





Introduction
The recent lapse in the discovery of new herbicide molecules viable for commercial development, coupled with the rise in prevalence and new instances of herbicide-resistant weeds, has led many agricultural chemical manufacturers to utilize new premixtures and novel formulations of currently available herbicide active ingredients to improve weed management (Ganie et al. Reference Ganie, Obrigawitch, Kang, Copeland, Gutteridge, May, Schrage, Albright and Chandi2021; Kaundun Reference Kaundun2021; Sleugh et al. Reference Sleugh, Wright, Salas, Simpson, Schmitzer, Morell and Saunders2021). One novel formulation approach is microencapsulation, in which an inactive polymer surrounds the active herbicide for controlled release of the herbicide (Mulqueen Reference Mulqueen1998). A microencapsulation can provide the benefits of increased crop selectivity, decreased volatilization, increased handler safety, and controlled release of the pesticide (Andrade et al Reference Andrade, Song, Li, Zimmerman, Cheng, Moore, Harris and Katz2015; Ivy Reference Ivy1972; Mulqueen Reference Mulqueen1998; Turner et al. Reference Turner, Glotfelty, Taylor and Watson1978). A microencapsulated formulation of saflufenacil (Herbicide Resistance Action Committee [HRAC] Group 14) was registered in 2024 and is available in a premixture with pyroxasulfone (HRAC Group 15) for residual broadleaf weed control in field corn (Zea mays L.) (Anonymous 2024). Saflufenacil is a weak acid herbicide that exhibits both soil-residual and foliar activity in broadleaf plants (Grossmann et al. Reference Grossmann, Hutzler, Caspar, Kwiatkowski and Brommer2011). In the microencapsulated formulation, the saflufenacil encapsulation serves as a physical barrier between plant foliage and the herbicide, reducing foliar absorption of saflufenacil, which increases saflufenacil selectivity to corn and allows for safer postemergence applications (Bangarwa et al. Reference Bangarwa, Hartman, Steppig, Osterholt, Putman, Klingaman, Frihauf, McCaskey, Fitterer, Carruth and Findley2024). Saflufenacil absorption is limited across all plant species when in the encapsulated formulation, thus providing only soil-residual weed control.
Saflufenacil is encapsulated in a solid phase (Noller et al. Reference Noller, Fuchs, Simon and Sowa2022), which is different from other encapsulated pesticide formulations that are achieved through an interfacial polymerization reaction between a liquid-phase pesticide and the aqueous-phase encapsulation polymer (Scher et al. 1988). Solid saflufenacil is coated in a melamine-formaldehyde-based aminoplast polymer that forms a near-complete encapsulation around the herbicide (Noller et al. Reference Noller, Fuchs, Simon and Sowa2022) and cracks open as the spray solution dries. Water, in the form of irrigation or rainfall, functions to solubilize the encapsulated saflufenacil for plant uptake from the soil solution after release from microcapsules (Anonymous 2023). In the encapsulated formulation, a small percentage of saflufenacil remains non-encapsulated (Noller et al. Reference Noller, Fuchs, Simon and Sowa2022). This trace percentage of free, non-encapsulated saflufenacil can cause foliar crop phytotoxicity when applied postemergence (Davis et al. Reference Davis, Butts and Young2026).
Timely herbicide applications may be delayed by adverse weather conditions or equipment failure, resulting in increased solution-storage time for herbicide mixtures. Prolonged storage time of a mixed herbicide solution may allow for accelerated degradation, herbicide settling out of solution, or herbicide adherence to the spray tank (Lin et al. Reference Lin, Lerch, Thurman, Garret and George2002; Whitford et al. Reference Whitford, Nowaskie, Young, Foreman, Spradley, Walker, Becovitz, Obermeyer, Reynolds, Johnson and Smith2015). The effect of solution-storage time on postemergence herbicide efficacy is dependent on the target weed species and the physicochemical properties of the specific herbicide or formulation. Previous research observed no effect of solution storage time on control of velvetleaf (Abutilon theophrasti Medik.), redroot pigweed (Amaranthus retroflexus L.), or common lambsquarters (Chenopodium album L.) from herbicide combinations in mode of action Groups 2, 4, 5, 9, 10, and 27 applied postemergence 1, 3, or 7 d after mixing (Stewart et al. Reference Stewart, Nurse, Cowbrough and Sikkema2009). Conversely, Palmer amaranth (Amaranthus palmeri S. Watson) control with lactofen was reduced by 25% or greater when postemergence applications were delayed 8 d after mixing (Eure et al. Reference Eure, Jordan, Fisher and York2013). Although the primary form of herbicide release from microcapsules is through herbicide solution drying (Doub et al. Reference Doub, Wilson and Hatzios1988; Petersen and Shea Reference Petersen and Shea1989; Zhang et al. Reference Zhang, Zhang, Luo, Li, Wei and Liu2018), microcapsule release can also occur via diffusion (Dubey et al. Reference Dubey, Shami and Bhasker2009). As such, to mitigate herbicide efficacy concerns, it is crucial to understand the physical stability of herbicide microcapsules under both saturated and dry conditions. Encapsulated saflufenacil has been reported to be stable in the spray tank for 72 h after mixing (Bangarwa et al. Reference Bangarwa, Hartman, Steppig, Osterholt, Putman, Klingaman, Frihauf, McCaskey, Fitterer, Carruth and Findley2024), but no supporting data have been published.
Chlorophyll fluorescence measurements are one way to rapidly detect plant stress from herbicides with different modes of action and to screen for herbicide resistance (Ahrens et al. Reference Ahrens, Arntzen and Stoller1981; Dayan and Zaccaro Reference Dayan and Zaccaro2012; Norsworthy et al. Reference Norsworthy, Talbert and Hoagland1998; Riethmuller-Haage et al. Reference Riethmuller-Haage, Bastiaans, Kropff, Harbinson and Kempenaar2006; Wu et al. Reference Wu, Varanasi and Perez-Jones2021). Chlorophyll fluorescence measurements provide insight into the functioning of photosystem II (PSII) reaction centers in a rapid, nondestructive way (Maxwell and Johnson Reference Maxwell and Johnson2000). Changes in PSII function can be documented by measuring chlorophyll fluorescence at multiple intervals over an extended period (Maxwell and Johnson Reference Maxwell and Johnson2000). The minimum and maximum chlorophyll fluorescence values of plant tissues exposed to varying light levels can be used to determine relative PSII efficiency by applying Equation 1:
 $\begin{align}{{F_{\rm v}} \over {F_{\rm m}}} = {{\left( {{F_{\rm m}} - {F_0}} \right)} \over {F_{\rm m}}}\end{align}$
where F m is the maximum fluorescence, F 0 is the minimum fluorescence, and F v/F m is the relative efficiency of PSII reaction centers (Maxwell and Johnson Reference Maxwell and Johnson2000). The F v/F m ratio represents the likelihood that light will be used for photosynthesis in the plant, with healthy tissues having F v/F m values of approximately 0.8 (Demmig and Björkman Reference Demmig and Björkman1987), and stressed tissues, such as those exposed to herbicides, having decreased F v/F m values (Wu et al. Reference Wu, Varanasi and Perez-Jones2021). Although protoporphyrinogen oxidase (PPO)-inhibiting herbicides like saflufenacil do not directly impact PSII, the rapid membrane peroxidation resulting from PPO-inhibiting herbicide binding also destroys the photosynthetic structures, and thus chlorophyll fluorescence measurements can be used to detect PPO-inhibiting herbicide damage (Dayan and Zaccaro Reference Dayan and Zaccaro2012).
Previous research has shown that postemergence applications of encapsulated saflufenacil result in only minor levels of transient foliar corn phytotoxicity (Davis et al. Reference Davis, Young, Butts and Young2024). Nevertheless, understanding the relative bioavailability of saflufenacil in the encapsulated formulation and the influence of prolonged moisture on microcapsule stability is critical for ensuring effective use of this herbicide formulation. Therefore, the objectives of this research, addressed using chlorophyll fluorescence as a proxy for corn phytotoxicity, were to (1) determine the bioavailability of encapsulated saflufenacil under dry and saturated conditions, (2) establish that only the non-encapsulated fraction of the formulation causes foliar corn phytotoxicity, and (3) characterize the physical stability of saflufenacil microcapsules over time.
Materials and Methods
Saflufenacil Fraction Experiment
A controlled environment experiment was conducted to compare the bioavailability of different saflufenacil formulations in saturated conditions. Three saflufenacil fractions from the encapsulated formulation were evaluated: (1) encapsulated product containing trace amounts of free, non-encapsulated saflufenacil; (2) open-capsule saflufenacil, where the encapsulated formulation was exposed to conditions that release the herbicide; and (3) free, non-encapsulated saflufenacil via filter extraction from the encapsulated formulation. Formulated non-encapsulated saflufenacil (Sharpen®, BASF, Research Triangle Park, NC, USA) and a no-herbicide solution were included as positive and negative controls, respectively. Treatments are hereafter referred to as encapsulated saflufenacil, open-capsule saflufenacil, free saflufenacil, non-encapsulated saflufenacil, and nontreated.
A 50 µM saflufenacil solution of each treatment was prepared in a leaf disk buffer solution (pH 6.0) containing 1 mM MES hydrate (CAS no. 1266615-59-1, Sigma-Aldrich, St Louis, MO, USA), 10 g L-1 sucrose (Fisher Chemical, Vancouver, BC, Canada), and nanopure water (pH = 6.15). The open-capsule saflufenacil treatment was prepared by placing 0.5 ml of encapsulated saflufenacil (1,000 µM) solution in an open petri plate for 2 h until dry, then resolubilizing it in 10 ml of leaf disk buffer for a final 50 µM concentration. Allowing the encapsulated saflufenacil solution to dry should crack the encapsulation and release the saflufenacil. Rehydration after complete drying then allows the herbicide to be resolubilized for plant uptake. The free saflufenacil fraction was obtained by passing the encapsulated formulation through a syringe filter to separate microcapsules from free saflufenacil. Encapsulated saflufenacil particles have a diameter ranging from 2 to 10 µm (Noller et al. Reference Noller, Fuchs, Simon and Sowa2022). Therefore, using a syringe filter with a 3-µm mesh size allowed for the non-encapsulated saflufenacil to pass freely through while retaining the saflufenacil microcapsules in the syringe. This filtrate was diluted in leaf disk buffer to 50 µM based on the active ingredient loading in the encapsulated formulation, with the expectation that it would contain a similar concentration of bioavailable trace levels of saflufenacil in the encapsulated treatment.
Corn (‘8339SXE’, Hoegemeyer Hybrids, Corteva Agriscience, Indianapolis, IN, USA) was sown in 25 by 25 cm flats and grown in a greenhouse maintained at 23 to 29 C with 16-h supplemental light (1,100 µmol m−2 s−1) supplied by high-pressure sodium bulbs. Once emerged, plants were fertilized once with a macronutrient fertilizer (Jack’s Classic Professional 20-20-20, JR Peters, Allentown, PA, USA). Fully emerged V1 and V2 leaves were excised from plants, and leaf disks were cut using a 9.5-mm-diameter cork borer (United Scientific, Libertyville, IL, USA). Leaf disks were allowed to float with the adaxial surface upward in a closed, unsealed petri plate that was prefilled with 10 ml of leaf disk buffer or saflufenacil solution. Each petri plate contained four leaf disks and was considered a single experimental unit, and each individual leaf disk was a subsample. Relative PSII efficiency (F v/F m) was used as a proxy for visible corn phytotoxicity Relative PSII efficiency was measured at 0, 4, 8, 24, and 48 h after treatment (HAT) using an imaging pulse amplitude modulated fluorometer (PlantExplorer Pro+, PhenoVation Life Sciences, Wageningen, Netherlands). Before imaging, petri plates were dark acclimated for 20 min in a black tray wrapped in aluminum foil, allowing for full oxidation of PSII electron acceptors. At each imaging time, F v/F m values, which can range from 0 to 1, were collected for each leaf disk. The F v/F m values were then averaged across each petri plate. Petri plates were incubated between imaging times in a controlled environment chamber (BioChamber FXR, BioChamber, Winnipeg, MB, Canada) set to maintain a 16-h light/8-h dark cycle at 28 C and 40% relative humidity.
Solution Storage Experiment
The physical stability of saflufenacil microcapsules over time was evaluated using the same leaf disk assay methodology outlined in the saflufenacil fraction experiment. This experiment consisted of a single mixing event followed by treatment of corn leaf tissue at different times after mixing to mimic a delayed-application field scenario in which the herbicide solution was mixed, then reagitated before application at a later time. The herbicide solution was mixed in nanopure water with a pH of 6.15. Five solution storage treatments were tested: 0, 1, 3, 5, and 7 d after mixing, and a nontreated, no-herbicide control was included. The encapsulated saflufenacil stock solution (50 µM concentration) was stored in a sealed 1,000-ml glass bottle in a closed fume hood with minimal light exposure. There was the potential for some photodegradation of the non-encapsulated saflufenacil in the solution, as the 50% degradation time (DT50) of saflufenacil is 22 d under aqueous photolysis conditions (Shaner Reference Shaner2014). Before treatment on each treatment date, the encapsulated saflufenacil solution was manually agitated for approximately 30 s or until the herbicide was uniformly suspended in the solution. Petri plates were filled with 10 ml of encapsulated saflufenacil solution, and four corn leaf disks were suspended in each plate. Each petri plate was considered a single experimental unit with each individual leaf disk treated as a subsample. Relative PSII efficiency of each leaf disk was measured at 0 and 48 HAT. Petri plates were incubated in a controlled environment chamber (BioChamber FXR, BioChamber) between sampling times set to maintain a 16-h light/8-h dark cycle at 28 C and 40% relative humidity.
Data Analysis
Analyses were performed using RStudio software (v. 2025.05.0+496; R Core Team 2024). Both experiments were conducted in a randomized complete block design conducted twice with 10 total replications. Each petri plate was treated as a single experimental unit, and each individual leaf disk within the petri plate was a subsample. Data from the saflufenacil fractions experiment were fit to separate generalized linear mixed models for each fluorescence imaging timing using the glmmTMB package (Brooks et al. Reference Brooks, Kristensen, Van Benthem, Magnusson, Berg, Nielsen, Skaug, Machler and Bolker2017), with saflufenacil fraction and experimental run treated as fixed effects and replication nested within experimental run treated as a random effect. Data from the solution storage experiment were fit to separate generalized linear mixed models for each solution storage timing, with solution storage time and experimental run treated as a fixed effects and replication nested within experimental run treated as a random effect. Data were checked for normality and equal variance using the Shapiro-Wilk test (Shapiro and Wilk Reference Shapiro and Wilk1965) and Levene’s test (Levene Reference Levene and Olkin1960). If either test failed, data were fit to a beta distribution. An ANOVA was conducted using the car package (Fox and Weisberg Reference Fox and Weisberg2019), and significant estimated marginal means were determined and separated according to Tukey’s honestly significant difference test (Tukey Reference Tukey1953; α = 0.05) using the emmeans (Lenth Reference Lenth2024) and cld packages (Hothorn et al. Reference Hothorn, Bretz and Westfall2008).
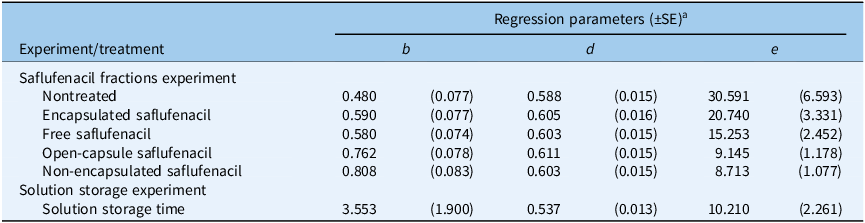
The drc package (Knezevic et al. Reference Knezevic, Streibig and Ritz2007) was used to fit the data from each experiment to a three-parameter log-logistic model (Equation 2) to visualize the changes in relative PSII efficiency over time.
 $Y = {d \over 1} + {\rm{exp}}[b({\rm{log}}\;x - \log e)]$
For the saflufenacil fractions experiment, Y was equal to relative PSII efficiency, the lower asymptote was 0, b was the relative slope of the curve, d was the upper asymptote, and e was the hours after treatment that corresponds to a 50% reduction in relative PSII efficiency. For the solution storage experiment, Y, the lower asymptote, b, and d were the same as in the saflufenacil fraction experiment. However, e was the days of solution storage that corresponded to a 50% reduction in relative PSII efficiency (Table 1).
Log-logistic regression parameters for both experiments.

Table 1. Long description
A table comparing regression parameters for saflufenacil fractions experiment and solution storage experiment. The table has 7 rows and 6 columns. The columns are labeled as Experiment/treatment, b, SE of b, d, SE of d, and e. The rows are labeled as Saflufenacil fractions experiment and Solution storage experiment. The Saflufenacil fractions experiment includes Nontreated, Encapsulated saflufenacil, Free saflufenacil, Open-capsule saflufenacil, and Non-encapsulated saflufenacil. The Solution storage experiment includes Solution storage time. The values in the table are as follows: Row 1: Nontreated, 0.480, 0.077, 0.588, 0.015, 30.591. Row 2: Encapsulated saflufenacil, 0.590, 0.077, 0.605, 0.016, 20.740. Row 3: Free saflufenacil, 0.580, 0.074, 0.603, 0.015, 15.253. Row 4: Open-capsule saflufenacil, 0.762, 0.078, 0.611, 0.015, 9.145. Row 5: Non-encapsulated saflufenacil, 0.808, 0.083, 0.603, 0.015, 8.713. Row 6: Solution storage time, 3.553, 1.900, 0.537, 0.013, 10.210.
a Regression parameters calculated using
 $Y = \;{d \over 1} + {\rm{exp}}\left[ {b\left( {{\rm{log}}x - {\rm{log}}e} \right)} \right]$
, where y was the response parameter, b was the relative slope of the curve, d was the upper asymptote, and e was the saflufenacil concentration (µm) corresponding with a 50% reduction in relative photosystem II (PSII) efficiency or the duration of solution storage corresponding with a 50% reduction in relative PSII efficiency in the first 48 h after treatment.
Results and Discussion
Saflufenacil Fraction Experiment
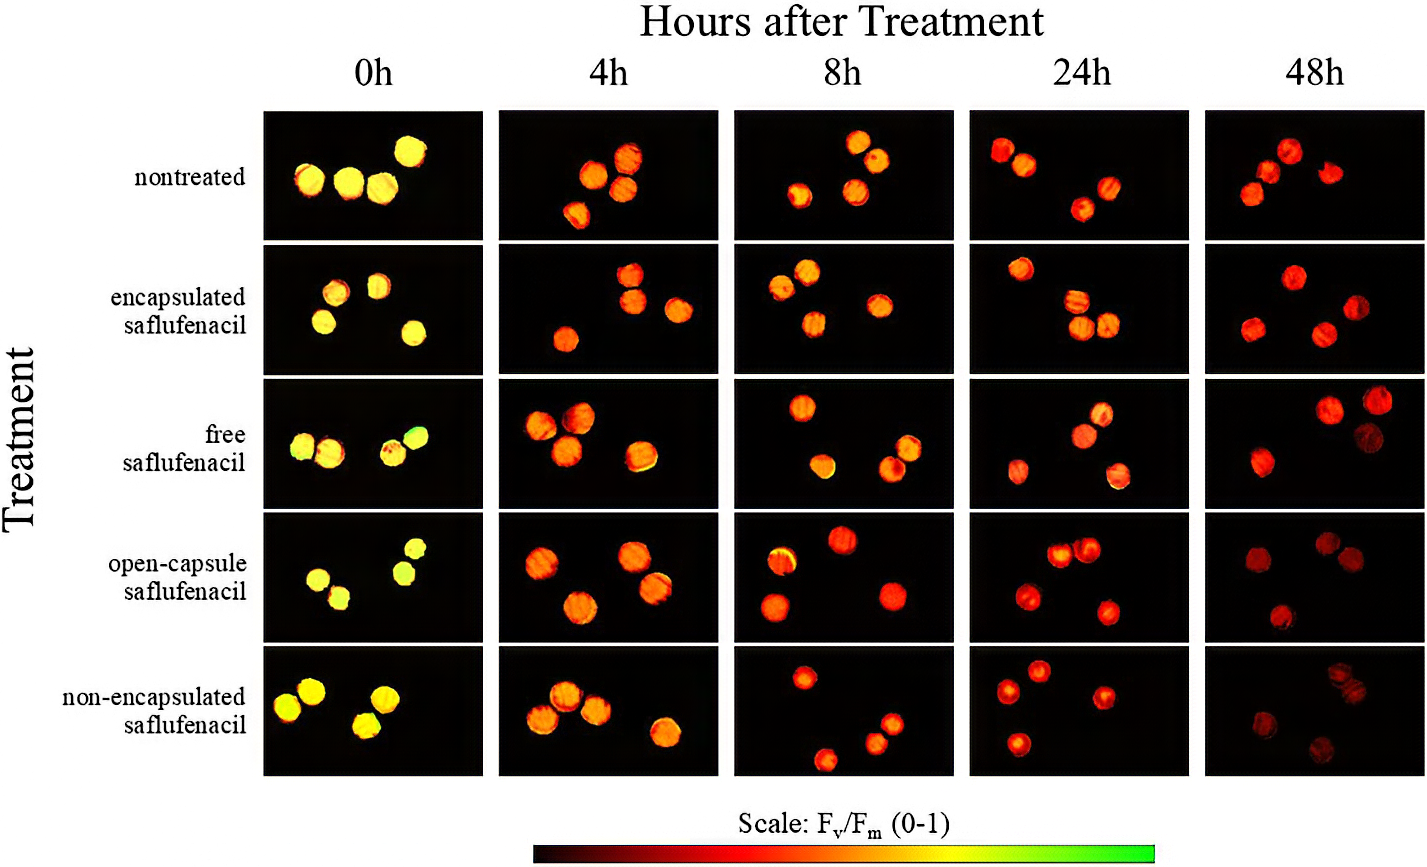
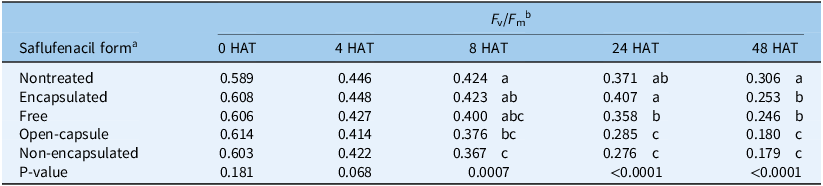
As chlorophyll fluorescence provides insight into the proper functioning of PSII reaction centers (Maxwell and Johnson Reference Maxwell and Johnson2000), the F v/F m values were highest when measured immediately after application, before herbicide stress symptoms had developed, and declined steadily across the experiment time course (Figure 1). There were no treatment differences at 0 HAT (F = 8.75, P = 0.068). The F v/F m values at this timing ranged from 0.589 to 0.614 (Table 2). Healthy plant tissues are generally indicated by F v/F m values around 0.8 (Demmig and Björkman Reference Demmig and Björkman1987). However, lower chlorophyll fluorescence values at 0 h after treatment have been demonstrated previously in excised plant tissue assays, suggesting that F v/F m values may be lower in a semi-destructive experiment, where the sampled tissue has been excised from the growing plant (Norsworthy et al. Reference Norsworthy, Talbert and Hoagland1998; Wu et al. Reference Wu, Varanasi and Perez-Jones2021).
Chlorophyll fluorescence images of petri plates containing corn leaf tissue exposed hydroponically to saflufenacil in different forms from 0 to 48 h after treatment. F v/F m values ranging from 0 to 1 are described by the color of the leaf disks in each photo. Healthy leaf tissue, with higher F v/F m values, is indicated by green and yellow, while stressed leaf tissue, with lower F v/F m values, is indicated by dark orange and red. F v/F m is the variable fluorescence/maximum fluorescence ratio.

Effect of saflufenacil in different forms on relative photosystem II efficiency from 0 to 48 h after treatment (HAT).

Table 2. Long description
A table comparing the effect of saflufenacil in different forms on relative photosystem II efficiency over time. The table has 6 rows and 6 columns. Column headers are: Saflufenacil form, 0 HAT, 4 HAT, 8 HAT, 24 HAT, 48 HAT. Row labels are: Nontreated, Encapsulated, Free, Open-capsule, Non-encapsulated, P-value. Row 1: Nontreated, 0.589, 0.446, 0.424, 0.371, 0.306. Row 2: Encapsulated, 0.608, 0.448, 0.423, 0.407, 0.253. Row 3: Free, 0.606, 0.427, 0.400, 0.358, 0.246. Row 4: Open-capsule, 0.614, 0.414, 0.376, 0.285, 0.180. Row 5: Non-encapsulated, 0.603, 0.422, 0.367, 0.276, 0.179. Row 6: P-value, 0.181, 0.068, 0.0007, <0.0001, <0.0001.
a Encapsulated saflufenacil form was the formulated encapsulated saflufenacil product containing trace amounts of non-encapsulated saflufenacil. Free saflufenacil form was created using a syringe filter to separate the non-encapsulated saflufenacil fraction from the encapsulated formulation. Open-capsule saflufenacil was created by allowing the encapsulated saflufenacil formulation to dry and then rehydrating the solution. Non-encapsulated saflufenacil form was the formulated non-encapsulated saflufenacil product.
b F v/F m is the variable fluorescence/maximum fluorescence ratio. Means within a column followed by the same letter are not different according to Tukey’s honestly significant difference test (α = 0.05).
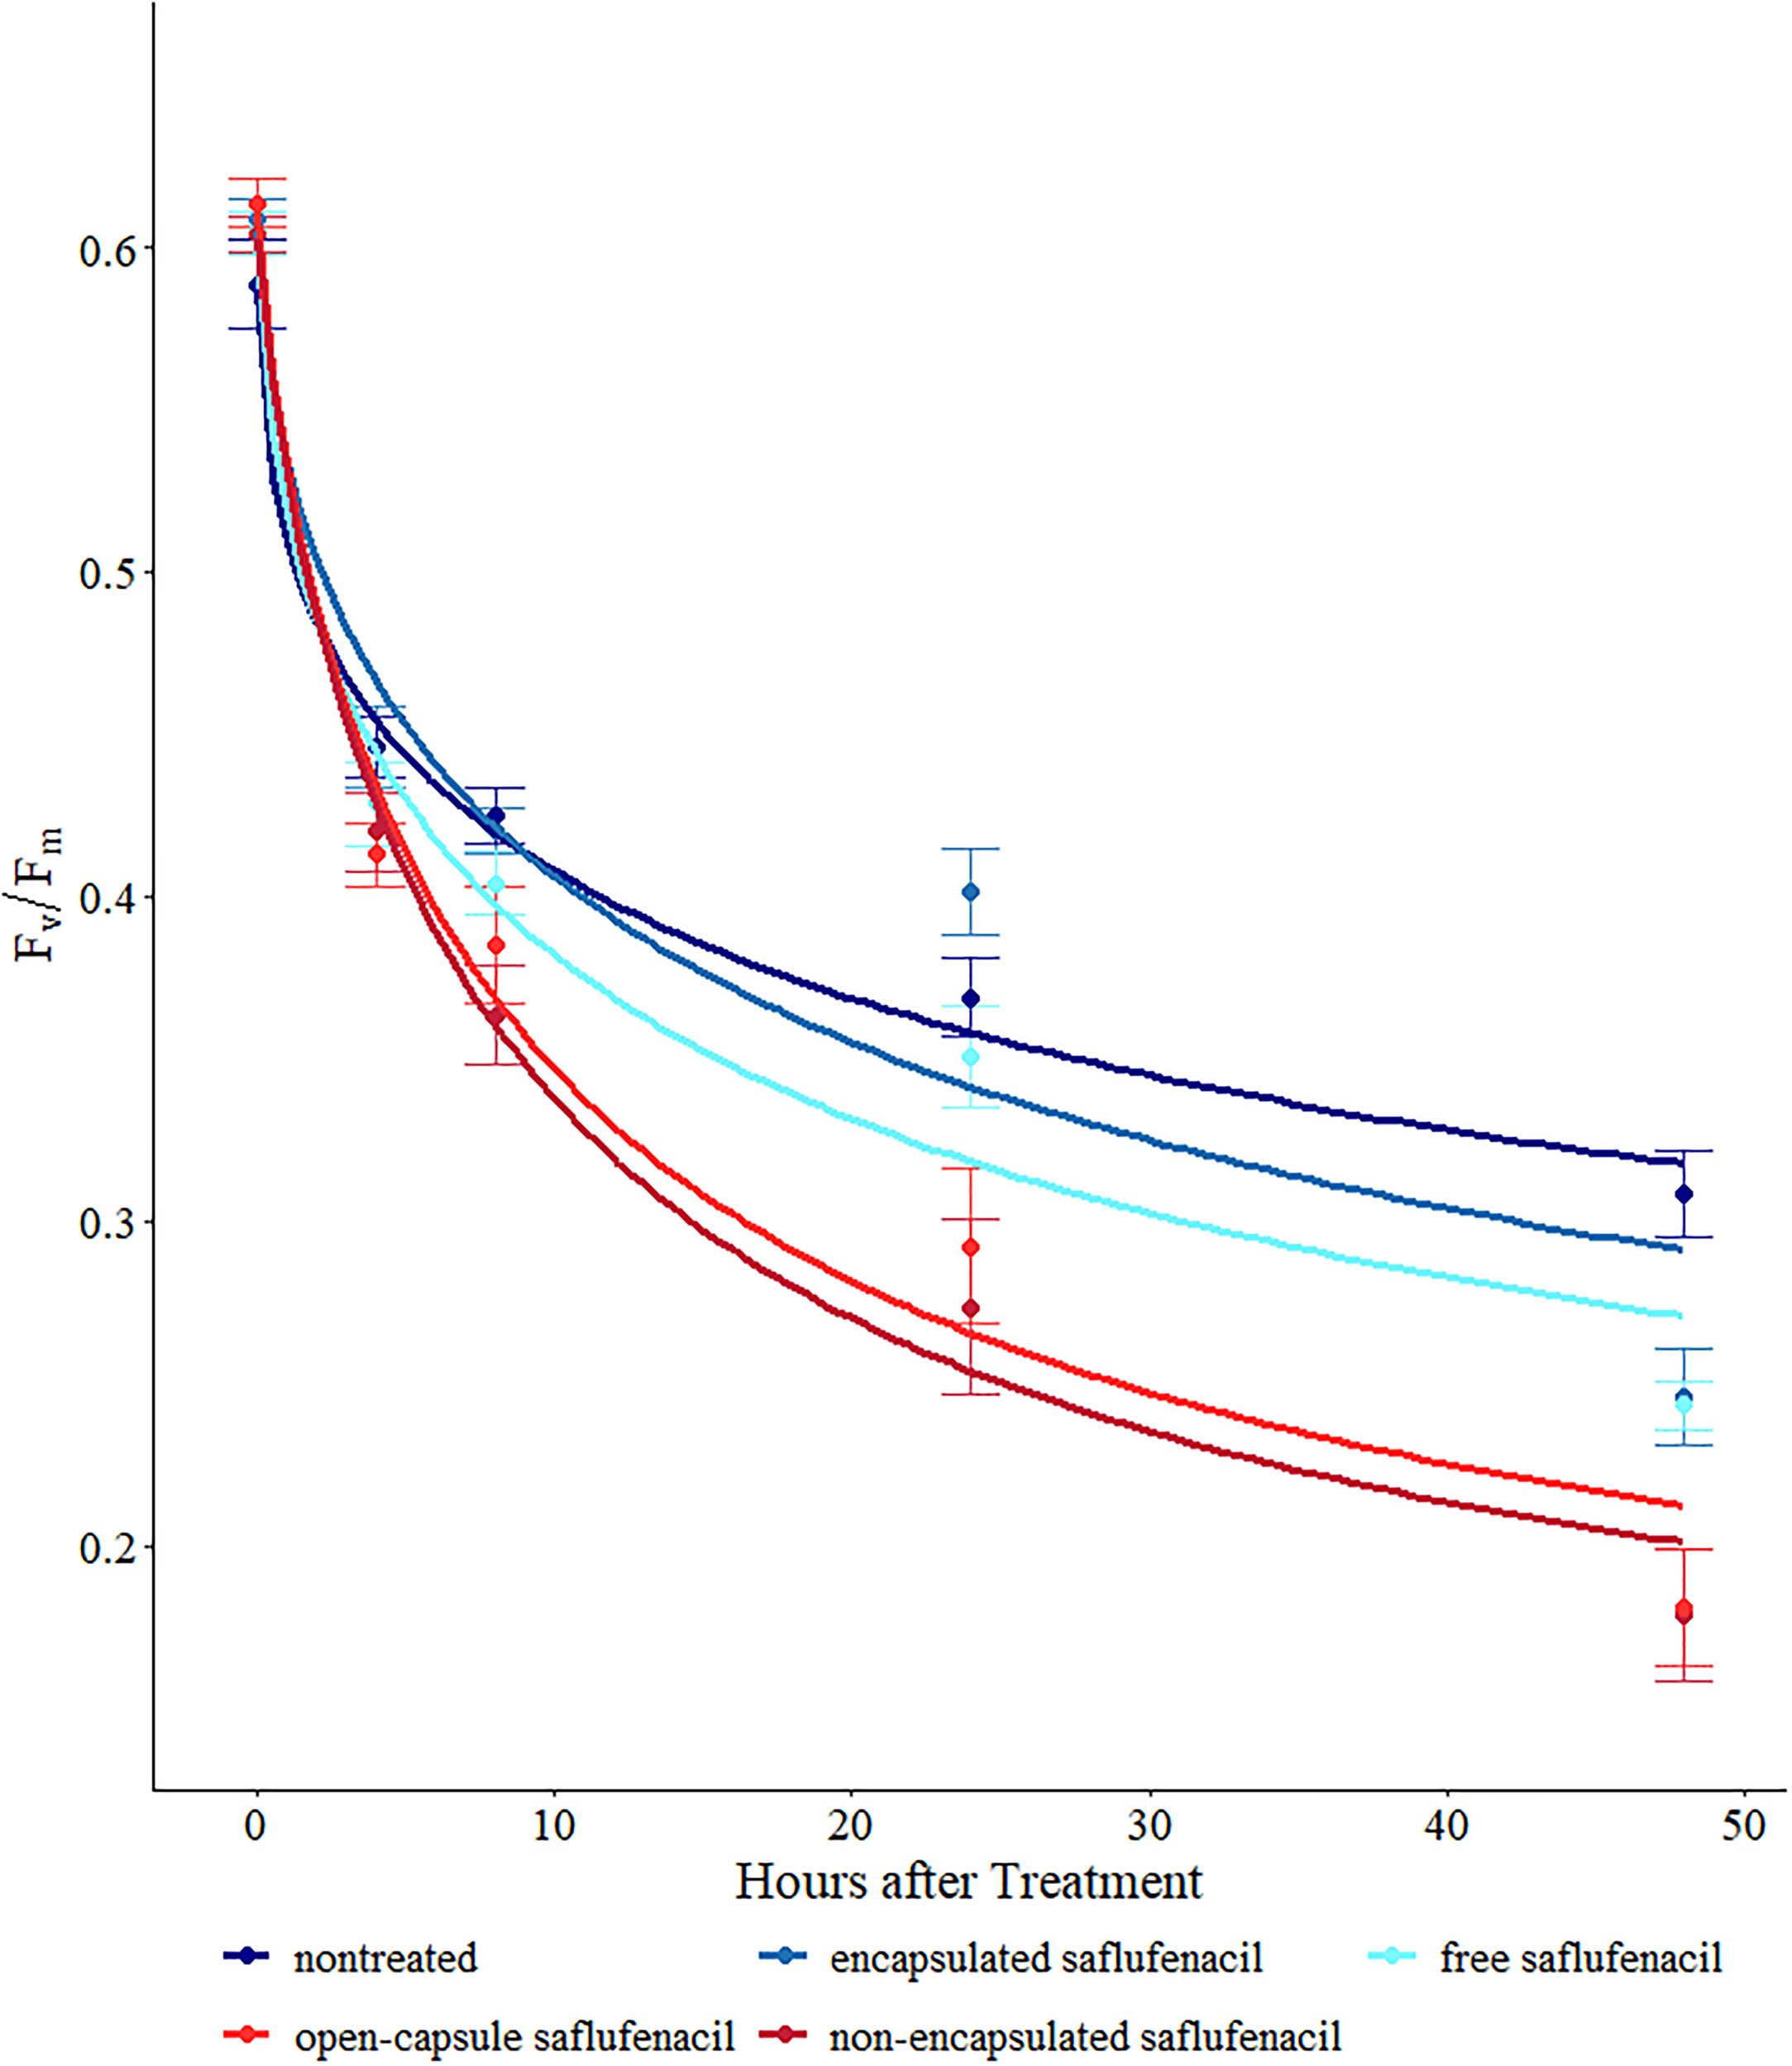
There were no treatment differences at 4 HAT (F = 8.75, P = 0.068). Differences between encapsulated and open-capsule saflufenacil became pronounced over time, with 43% and 41% higher fluorescence from encapsulated saflufenacil compared with open-capsule saflufenacil at 24 and 48 HAT, respectively (Table 2). Open-capsule saflufenacil was similar to non-encapsulated saflufenacil at 8, 24, and 48 HAT (Table 2; Figure 2), which suggests that saflufenacil is quickly released from the capsule after drying. This result coincides with previous research demonstrating similar fresh-weight reductions in barnyardgrass [Echinochloa crus-galli (L.) P. Beauv.] with dried microencapsulated alachlor and emulsifiable concentrate alachlor, in contrast to microencapsulated alachlor that remained continuously moist throughout the experiment (Doub et al. Reference Doub, Wilson and Hatzios1988).
Photosynthetic efficiency over time for corn leaf disks exposed to 50 µM saflufenacil in different forms. Greater F v/F m values indicate healthier tissue. F v/F m is the variable fluorescence/maximum fluorescence ratio.

Free saflufenacil and encapsulated saflufenacil F v/F m values were similar at 8 and 48 HAT (Table 2). When averaged across these two treatments, F v/F m values were 11% higher at 8 HAT and 39% higher at 48 HAT when compared with the mean values of open-capsule saflufenacil and non-encapsulated saflufenacil at the same time points (Table 2; Figure 2). The free saflufenacil and encapsulated saflufenacil treatments contained non-encapsulated, bioavailable saflufenacil at extremely low concentrations (Davis et al. Reference Davis, Young, Butts and Young2024). Because the bioavailable saflufenacil concentration was lower in these treatments, the impact on relative PSII efficiency was less than that of the non-encapsulated and open-capsule saflufenacil treatments. From these results, we can conclude that only the non-encapsulated fraction of formulated encapsulated saflufenacil was available for foliar plant uptake, which resulted in foliar corn injury. Thus, when applied postemergence, encapsulated saflufenacil is selective to crop and weed species, because the encapsulation serves as a barrier to foliar uptake, and foliar symptoms result only from the trace amount of non-encapsulated saflufenacil. This result is similar to previous research documenting less than 5% foliar corn phytotoxicity from a postemergence application of the encapsulated saflufenacil + pyroxasulfone premixture (75 g saflufenacil ha−1) (Davis et al. Reference Davis, Young, Butts and Young2024) compared with non-encapsulated saflufenacil that can cause 99% corn phytotoxicity when applied postemergence (100 g ai ha−1) (Soltani et al. Reference Soltani, Shropshire and Sikkema2009).
Solution Storage Experiment
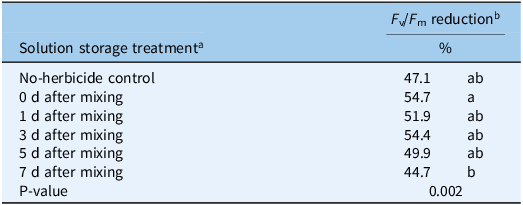
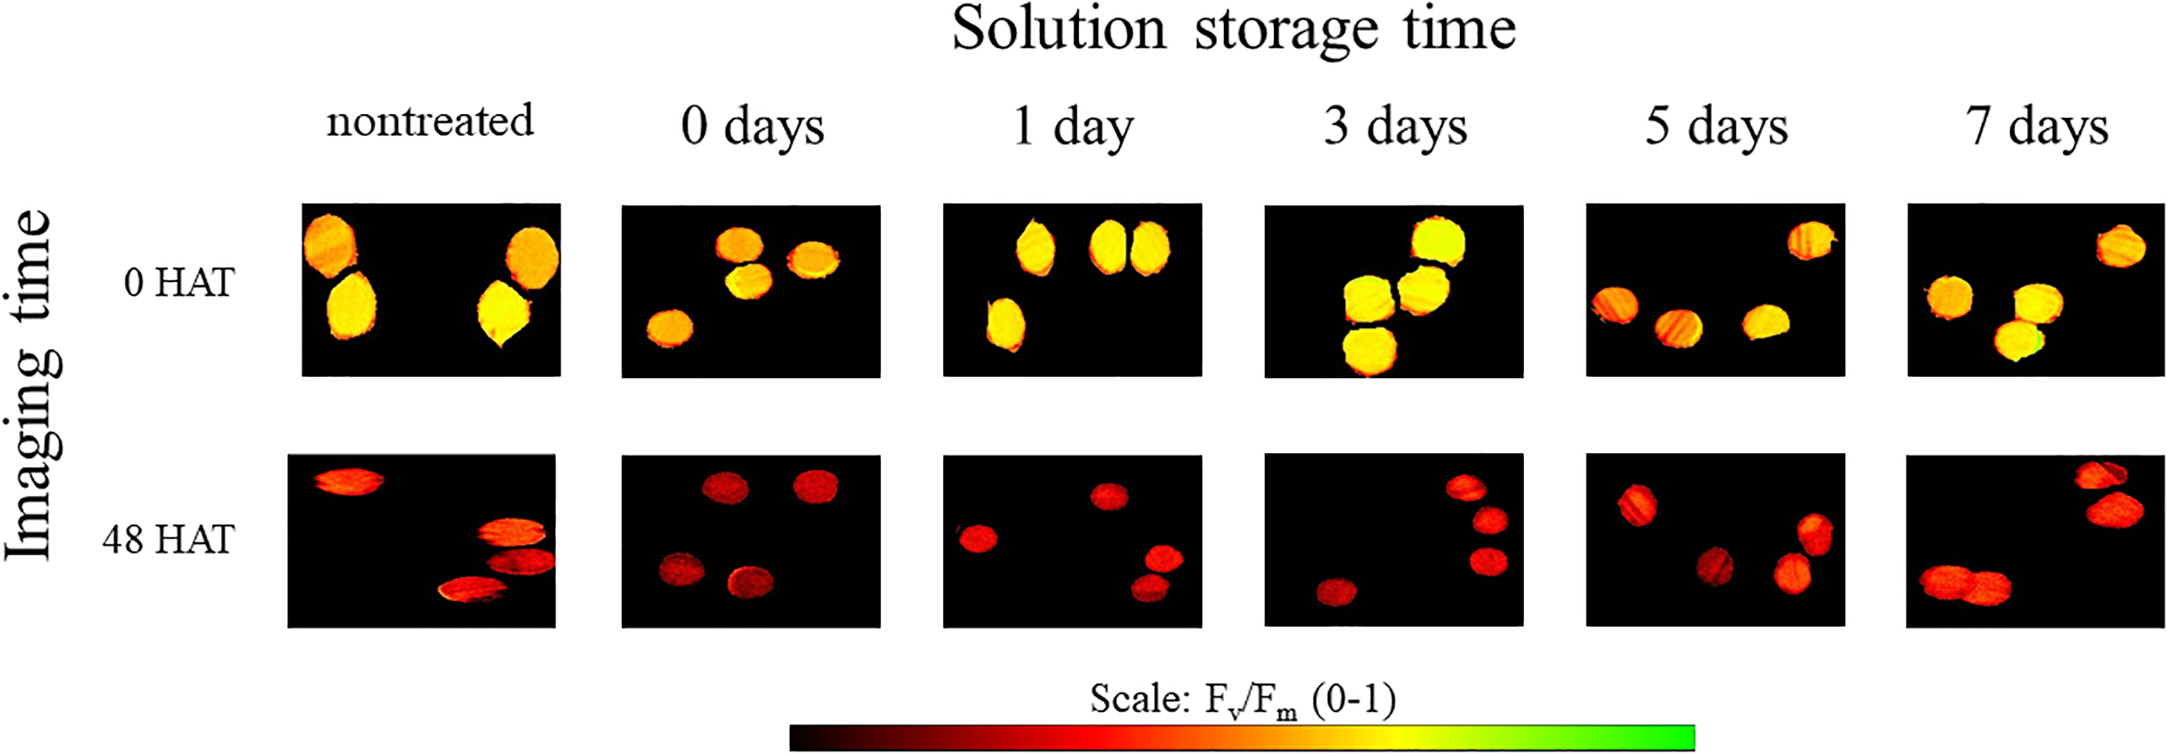
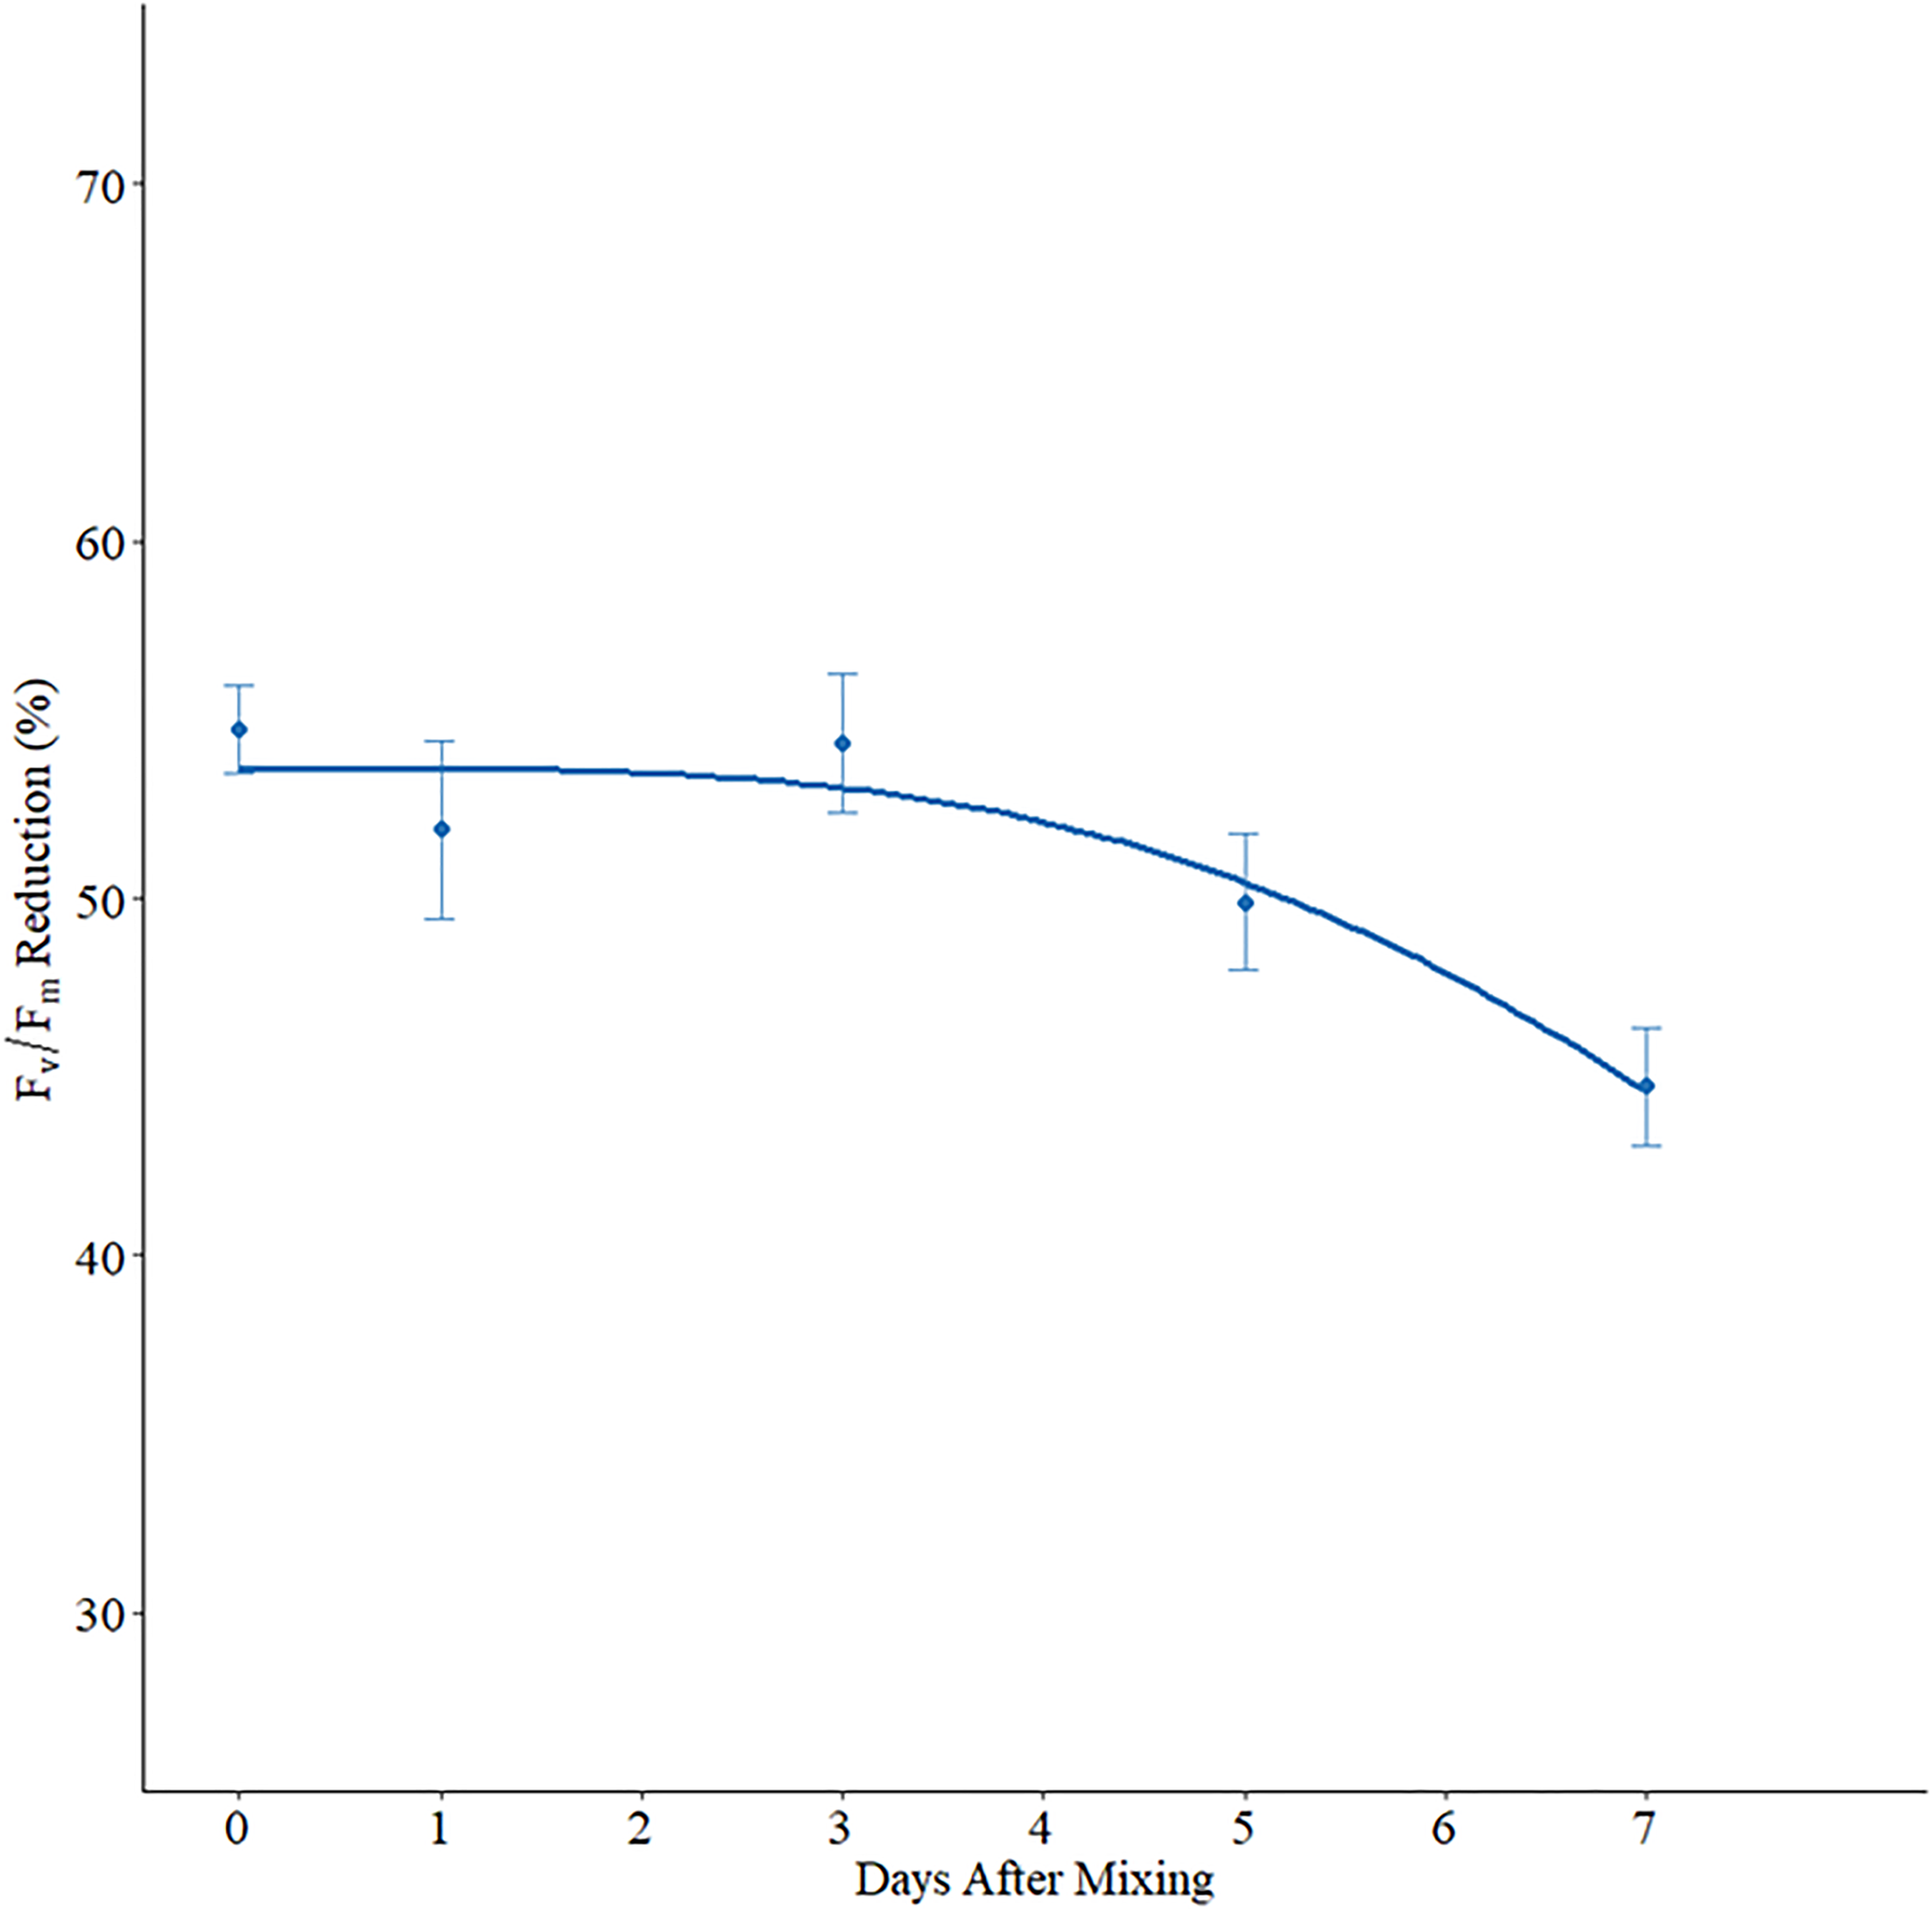
There were slight variations across storage time treatments in F v/F m values at 0 HAT, potentially due to differences in leaf tissue age (Bielcyznski et al. Reference Bielczynski, Mk, Hoefnagels, Gambin and Croce2017). To account for these variations, the 48 HAT F v/F m values were normalized as a percent F v/F m reduction from the 0 HAT values, where a lower F v/F m reduction is indicative of a lower level of tissue phytotoxicity. Experimental runs were combined due to a nonsignificant interaction (F = 6.29, P = 0.279). Reductions in F v/F m ranged from 45% to 55%, which is similar to F v/F m reductions of corn leaf tissue exposed to a non-herbicide-treated leaf disk solution for 48 h (Table 3; Figure 3). From 0 to 3 d after mixing, the F v/F m reduction was relatively unchanged (Figures 3 and 4), suggesting that the saflufenacil capsule was physically stable when stored in the spray solution for at least 3 d after mixing. However, a greater F v/F m reduction was observed with leaf disks treated with saflufenacil 0 and 3 d after mixing compared with leaf disks treated 5 or 7 d after mixing (Table 3; Figure 4). The reduction in F v/F m at 0 d after mixing was greater than at 5 or 7 d after mixing (Table 3). Given the aqueous photolysis DT50 of 22 d for saflufenacil (Shaner Reference Shaner2014), there was potentially ∼16% degradation of the free saflufenacil fraction from 0 to 7 d after mixing. Thus, the decrease in crop phytotoxicity observed in this experiment at 5 and 7 d after mixing, could be a result of degradation of the trace percentage of non-encapsulated herbicide due to extended storage. Nevertheless, this experiment was not designed to evaluate non-encapsulated saflufenacil degradation, so this conclusion is speculative.
Effect of the length of solution storage on relative photosystem II efficiency of corn leaf tissue exposed to a 50 µM encapsulated saflufenacil solution.

Table 3. Long description
A table comparing the effect of solution storage time on photosystem II efficiency in corn leaf tissue. The table has 9 rows and 3 columns. The columns are labeled ‘Solution storage treatment’, ‘Fv/Fm reduction’, and ‘%’. The rows list different solution storage treatments and their corresponding Fv/Fm reduction percentages. Row 1: No herbicide control, 47.1, ab. Row 2: 0 d after mixing, 54.7, a. Row 3: 1 d after mixing, 51.9, ab. Row 4: 3 d after mixing, 54.4, ab. Row 5: 5 d after mixing, 49.9, ab. Row 6: 7 d after mixing, 44.7, b. Row 7: P-value, 0.002. The table shows variations in Fv/Fm reduction percentages across different storage times, with notable differences highlighted by different letters.
a The no-herbicide control data were collected 0 d after mixing and 48 h after treatment. The 0, 1, 3, 5, and 7 d after mixing data were collected from corn leaf tissue exposed to a 50 µM encapsulated saflufenacil solution. The F v/F m reduction was calculated by dividing the 48-h after treatment F v/F m reading by the 0-h after treatment F v/F m reading and multiplying by 100.
b F v/F m is the variable fluorescence/maximum fluorescence ratio. Means within a column followed by the same letter are not different according to Tukey’s honestly significant difference test (α = 0.05).
Chlorophyll fluorescence images of petri plates containing corn leaf tissue exposed hydroponically to saflufenacil following 0, 1, 3, 5, or 7 d in solution. F v/F m values ranging from 0 to 1 are described by the color of the leaf disks in each photo. Healthy leaf tissue, with higher F v/F m values, is indicated by green and yellow, while stressed leaf tissue, with lower F v/F m values, is indicated by dark orange and red. F v/F m is the variable fluorescence/maximum fluorescence ratio.

Reduction in relative photosystem II (PSII) efficiency of corn leaf tissue following hydroponic exposure to encapsulated saflufenacil following 0, 1, 3, 5, and 7 d in solution. F v/F m is the variable fluorescence/maximum fluorescence ratio.

The results of this experiment indicate that if spray conditions are not optimal after mixing, delaying postemergence applications of encapsulated saflufenacil up to 7 d after mixing does not compromise physical microcapsule stability or enhance corn phytotoxicity. However, factors beyond physical formulation stability, such as chemical degradation, interactions with carrier ions, and weed growth between the time of mixing and application, must be considered when applications are delayed (Eure et al. Reference Eure, Jordan, Fisher and York2013). Although microencapsulated chemicals can be released from diffusion through the capsule, in addition to physical breakdown of the microcapsule (Dubey et al. Reference Dubey, Shami and Bhasker2009), the results of this experiment indicate that saflufenacil is not released from the microcapsule via diffusion. Previous literature demonstrated that the diffusion of microencapsulated herbicides is dependent on both the specific herbicide and microcapsule properties (Petersen and Shea Reference Petersen and Shea1989). Microencapsulated alachlor was reported to diffuse by 30% over 14 d in a saturated environment (Petersen and Shea Reference Petersen and Shea1989). Conversely, less than 1% diffusion of microencapsulated pendimethalin was observed over 14 d under similar aqueous conditions (Zhang et al. Reference Zhang, Zhang, Luo, Li, Wei and Liu2018). The lack of diffusion observed with encapsulated saflufenacil in this study was likely due to the solid phase of encapsulated saflufenacil, as solid-phase chemicals diffuse through barriers at a speed 100,000x slower than liquid-phase chemicals (McFarlane and Pedley Reference McFarlane and Pedley1978).
The chlorophyll fluorescence-based hydroponic assay used in this study may be useful in identifying herbicide bioavailability across formulation types. However, the physicochemical properties of the specific herbicide active ingredient and the impact of a saturated environment must be carefully considered to ensure the accurate usage of this assay. Nonetheless, these results overall demonstrate that only the trace amount of non-encapsulated saflufenacil in the encapsulated formulation was bioavailable under saturated conditions, which greatly increased the foliar safety of the herbicide. Furthermore, the physical stability of saflufenacil microcapsules was not compromised under extended periods of solution storage, and as such, delayed applications after mixing can be performed safely.
Funding statement
This research was funded in part by BASF Agricultural Solutions.
Competing interests
JND is currently employed by BASF Agricultural Solutions. The authors declare no conflicts of interest.

 Open access

