1 Introduction
Understanding and predicting large-magnitude, nonlinear water waves is one of the most challenging topics for ocean engineering both because of the catastrophic impact they can have on ocean engineering structures (e.g. ships and offshore platforms) and naval operations, and because of the lack of specialized mathematical tools for the analysis of the underlying physics (Müller, Garrett & Osborne Reference Müller, Garrett and Osborne2005; Dysthe, Krogstad & Müller Reference Dysthe, Krogstad and Müller2008; Akhmediev & Pelinovsky Reference Akhmediev and Pelinovsky2010; Xiao et al. Reference Xiao, Liu, Wu and Yue2013). This is because nonlinear water wave dynamics are characterized by the existence of inherent uncertainty (expressed in the form of phase uncertainty between different Fourier modes) and in the form of strong nonlinearities and associated energy transfers between modes. The latter can be activated locally and intermittently, leading to unusually high-magnitude waves that emerge out of the complex background wave field.
An extreme form of such dynamical evolution is the case of freak or rogue waves with wave height which can be as large as eight times the standard deviation of the surrounding wave field (Onorato et al. Reference Onorato, Osborne, Serio and Cavaleri2005; Dysthe et al. Reference Dysthe, Krogstad and Müller2008). Waves of this magnitude have caused considerable damage to ships, oil rigs and human life (Haver Reference Haver2004; Liu Reference Liu2007). In addition, many naval operations, e.g. transfer of cargo between ships moored together in a sea base, landing on aircraft carriers, or path planning of high-speed surface vehicles, require short-term prediction of the surrounding wave field. To make such predictions, unusually high wave elevations must be forecasted reliably.
One mechanism for the occurrence of such rare, unusually intense wave elevations is nonlinear wave focusing (Onorato, Osborne & Serio Reference Onorato, Osborne and Serio2002a ; Janssen Reference Janssen2003; Cousins & Sapsis Reference Cousins and Sapsis2015). For deep-water waves a manifestation of this focusing is the well-known Benjamin–Feir (BF) instability of a plane wave to small sideband perturbations. This instability, which has also been demonstrated experimentally (Chabchoub, Hoffmann & Akhmediev Reference Chabchoub, Hoffmann and Akhmediev2011), generates huge coherent structures by soaking up energy from the nearby field (Benjamin & Feir Reference Benjamin and Feir1967; Zakharov Reference Zakharov1968; Osborne, Onorato & Serio Reference Osborne, Onorato and Serio2000). Cousins & Sapsis (Reference Cousins and Sapsis2015) demonstrated that even imperfect background conditions, i.e. completely different from the idealized plane wave set-up of the BF instability, can still lead to important wave focusing and rare events. In particular, it was analytically shown and numerically demonstrated for unidirectional wavetrains that there is a critical combination of wave group length scales and amplitudes which will lead to wave focusing and thus unusually high elevations. In contrast to the standard BF mechanism, these instabilities are initiated because of sufficiently large spatially localized energy.
Such energy localization, which can ‘trigger’ nonlinear wave focusing, can occur as the result of random relative phases between different harmonics. This phase randomness is mainly introduced by the mixing of different harmonics due to their linear dispersive propagation. Thus, the linear propagation of water waves can locally create conditions that will lead to nonlinear focusing and subsequent rare events. It is clear that this perspective provides a scenario in which the unstable extreme wave events are isolated occurrences of strongly nonlinear focusing events initiated by the linear or weakly nonlinear background.
Therefore, on the one hand we have the nonlinear wave mechanics that define which localized wave groups will focus because of modulation instabilities, while on the other hand we have the power spectrum that defines what wave groups can form due to random phase difference between harmonics. The scope of this work is to combine these two perspectives in order to derive precursors of rare events that will take into account not only the nonlinear mechanics of water waves (in particular the modulation instability) but also the spectral or statistical properties of the wave field. In particular, we show how the interplay between (i) modulation instability properties of localized wave groups and (ii) statistical properties of wave groups associated with a given spectrum defines a critical length scale that is related with the occurrence of strongly nonlinear interactions and the formation of extreme events. The energy that is locally concentrated over this length scale acts essentially as the ‘trigger’ of nonlinear focusing of wave groups.
We use this property to derive short-term precursors for the occurrence of large water waves, circumventing the need for solving the governing equations. To quantify the probability of occurrence of specific wave groups from a given spectrum we use a scale selection algorithm (Lindeberg Reference Lindeberg1998). This statistical analysis is combined with an analytical nonlinear stability criterion for focusing of localized wave groups (Cousins & Sapsis Reference Cousins and Sapsis2015) to yield a reliable, computationally inexpensive forecast of the subsequent growth for each wave group in the field. In a second stage, we demonstrate that merely tracking the energy of the wave field over the critical length scale defined by the interplay between statistics and nonlinearity allows for an even cheaper and robust forecast of upcoming intense nonlinear wave elevations, with a prediction window of the order of 25 wave periods. We demonstrate our results in numerical experiments involving unidirectional water wave fields described by the modified nonlinear Schrödinger equation (MNLS).
Our proposed predictive method reveals and directly uses the low-dimensional character of the domain of attraction of these rare water waves. In particular, despite the distribution of the background energy over a wide range of scales, the ‘trigger’ of nonlinear focusing is essentially low-dimensional and to this end it can be used as an inexpensive way to estimate the probability for a rare event in the near future. Our scheme is robust, performing well even with noise and irregularity in the wave field. Furthermore, the presented approach introduces a new paradigm for handling spatiotemporal rare events in dynamical systems with inherent uncertainty by providing an efficient description of the ‘trigger’ that leads to those rare events through the careful study of the synergistic action between uncertainty and nonlinearity.
We stress that our method differs significantly from previously described predictive schemes. For example, the inverse scattering approach of Islas & Schober (Reference Islas and Schober2005) is, in its proposed form, limited to the nonlinear Schrödinger equation (NLS). Our wave-group-based scheme easily applies to the more accurate MNLS where such analytical tools are not available. Also, our scheme is similar in spirit to the quasi-determinism (QD) theory of Boccotti (Reference Boccotti2008), which extends the observation that profiles of large-amplitude waves resemble the autocorrelation function (Lindgren Reference Lindgren1970; Boccotti Reference Boccotti1983). Boccotti’s QD theory is linear and has been extended to include second-order effects by Fedele & Tayfun (Reference Fedele and Tayfun2009). Although second-order QD agrees well with many oceanic observations, our scheme allows us to perform prediction of rare events occurring due to nonlinear focusing effects induced by wave–wave interactions which are associated with highly nonlinear regimes where current analytical methods are limited.
2 Extreme events in envelope equations
In this work, we consider irregular waves travelling on the surface of a fluid of infinite depth. A typical approach for modelling this phenomenon is to assume incompressible, irrotational, inviscid flow, which gives Laplace’s equation for the velocity potential. This equation is paired with two boundary conditions on the surface: a pressure condition and a kinematic one (a particle initially on the free surface remains so). This model agrees well with laboratory experiments (Wu, Ma & Eatock Taylor Reference Wu, Ma and Eatock Taylor1998), and faithfully reproduces the classical
 $k^{-5/2}$
spectral tail observed in deep water (Onorato et al.
Reference Onorato, Osborne, Serio, Resio, Pushkarev, Zakharov and Brandini2002b
). Although some care is required to deal numerically with the free surface, this fully nonlinear model may be solved numerically with reasonable computational effort, particularly in one space dimension (Dommermuth & Yue Reference Dommermuth and Yue1987; Craig & Sulem Reference Craig and Sulem1993; Dyachenko et al.
Reference Dyachenko, Kuznetsov, Spector and Zakharov1996; Choi & Camassa Reference Choi and Camassa1999). However, the presence of the free surface makes analysis of the underlying dynamics challenging.
Here we consider approximate equations governing the evolution of the wave envelope, the NLS (Zakharov Reference Zakharov1968) and the MNLS of (Dysthe Reference Dysthe1979). Both NLS and MNLS can be derived via a perturbation approach from the fully nonlinear model under assumptions of small steepness and slow variation of the wave envelope. Although forms of these equations exist in a full two-dimensional setting, here we consider wave fields varying only in the direction of propagation. The NLS, in non-dimensionalized coordinates, reads
 $$\begin{eqnarray}\frac{\partial u}{\partial t}+\frac{1}{2}\frac{\partial u}{\partial x}+\frac{\text{i}}{8}\frac{\partial ^{2}u}{\partial x^{2}}+\frac{\text{i}}{2}|u|^{2}u=0,\end{eqnarray}$$
where
 $u(x,t)$
is the wave envelope. To leading order the surface elevation is given by
 ${\it\eta}(x,t)=\text{Re}[u(x,t)\text{e}^{\text{i}(x-t)}]$
. Equation (2.1) has been non-dimensionalized with
 $x=k_{0}\tilde{x}$
,
 $t={\it\omega}_{0}\tilde{t}$
and
 $u=k_{0}\tilde{u}$
, where
 $\tilde{x}$
,
 $\tilde{t}$
and
 $\tilde{u}$
are physical space, time and envelope,
 $k_{0}$
is the dominant spatial frequency of the surface elevation and
 ${\it\omega}_{0}=\sqrt{gk_{0}}$
.
Our primary interest in this work is the MNLS, which is a higher-order approximation of the fully nonlinear model,
 $$\begin{eqnarray}\frac{\partial u}{\partial t}+\frac{1}{2}\frac{\partial u}{\partial x}+\frac{\text{i}}{8}\frac{\partial ^{2}u}{\partial x^{2}}-\frac{1}{16}\frac{\partial ^{3}u}{\partial x^{3}}+\frac{\text{i}}{2}|u|^{2}u+\frac{3}{2}|u|^{2}\frac{\partial u}{\partial x}+\frac{1}{4}u^{2}\frac{\partial u^{\ast }}{\partial x}+\text{i}u\left.\frac{\partial {\it\phi}}{\partial x}\right|_{z=0}=0,\end{eqnarray}$$
where
 ${\it\phi}$
is the velocity potential and
 $\partial {\it\phi}/\partial x|_{z=0}=-\mathscr{F}^{-1}[|k|\mathscr{F}[|u|^{2}]]/2$
, and
 $\mathscr{F}$
denotes the Fourier transform. The MNLS has been shown to reproduce laboratory experiments reasonably well (Lo & Mei Reference Lo and Mei1985; Goullet & Choi Reference Goullet and Choi2011). There are even higher-order envelope equations, such as the broadband modified nonlinear Schrödinger equation (BMNLS) (Trulsen & Dysthe Reference Trulsen and Dysthe1996) as well as the more recent compact Zakharov equation (Dyachenko & Zakharov Reference Dyachenko and Zakharov2011). The latter is valid for third-order nonlinearities and it does not have restrictions on the spectral bandwidth (Fedele Reference Fedele2014). However, we do not discuss these equations here. Although there are considerable differences between NLS and MNLS, we found minimal differences between simulations of MNLS and BMNLS. Dysthe et al. (Reference Dysthe, Trulsen, Krogstad and Socquet-Juglard2003) also found similar agreement between MNLS and BMNLS.
These envelope equations, as well as the fully nonlinear water wave model, admit periodic plane wave solutions. Interestingly, these plane wave solutions are unstable to sideband perturbations (Benjamin & Feir Reference Benjamin and Feir1967; see also Zakharov Reference Zakharov1968), a phenomenon termed the BF instability. This instability has a striking manifestation. Energy is ‘sucked up’ from the nearby field to produce a large-amplitude coherent structure, containing a wave 2.4–3 times larger than the surrounding background field (Osborne et al. Reference Osborne, Onorato and Serio2000). This behaviour has been shown numerically in envelope equations (Yuen & Fergusen Reference Yuen and Fergusen1978; Dysthe & Trulsen Reference Dysthe and Trulsen1999) as well as in the fully nonlinear formulation (Henderson, Peregrine & Dold Reference Henderson, Peregrine and Dold1999). Furthermore, a number of experiments confirm these numerical predictions (Chabchoub et al. Reference Chabchoub, Hoffmann and Akhmediev2011, Reference Chabchoub, Hoffmann, Onorato and Akhmediev2012).
However, in realistic physical settings, the water surface is not merely a plane wave – energy is distributed over a range of frequencies. To this end, we consider extreme waves emerging out of a background with Gaussian spectra and random phases, that is
 $$\begin{eqnarray}u(x,0)=\mathop{\sum }_{-N/2+1}^{N/2}\sqrt{2{\it\Delta}_{k}F(k{\it\Delta}_{k})}\,\text{e}^{\text{i}({\it\omega}_{k}x+{\it\xi}_{k})},\quad F(k)=\frac{{\it\epsilon}^{2}}{{\it\sigma}\sqrt{2{\rm\pi}}}\,\text{e}^{-k^{2}/2{\it\sigma}^{2}},\end{eqnarray}$$
where
 ${\it\xi}_{k}$
are independent, uniformly distributed random phases. Here we adopt the definition of an extreme wave as any instance where
 $|u|>H_{E}=4{\it\epsilon}$
(as defined above,
 ${\it\epsilon}$
is the standard deviation of the surface elevation). In these irregular wave fields, it is well known that the critical quantity for extreme event formation is the Benjamin–Feir index (BFI), which is the ratio of the energy level of the field to its bandwidth (Janssen Reference Janssen2003). If the BFI is large enough, then nonlinear interactions dominate, leading to the appearance of large-amplitude coherent structures and heavy-tailed statistics for the elevation (Alber Reference Alber1978; Crawford, Saffman & Yuen Reference Crawford, Saffman and Yuen1980; Dysthe et al.
Reference Dysthe, Trulsen, Krogstad and Socquet-Juglard2003; Janssen Reference Janssen2003; Onorato et al.
Reference Onorato, Osborne, Serio and Cavaleri2005).
We solve the MNLS numerically using a Fourier method in space. The use of periodic boundary conditions is of course artificial, but is a standard convention. We take our spatial domain to be 128 wavelengths (
 $256{\rm\pi}$
), large enough to avoid any box-size effects. We use a fourth-order Runge–Kutta exponential time differencing scheme (Cox & Matthews Reference Cox and Matthews2002; Grooms & Majda Reference Grooms and Majda2014). This scheme requires evaluation of the function
 ${\it\phi}(z)=(\text{e}^{z}-1)/z$
. Naive computation of
 ${\it\phi}$
can suffer from numerical cancellation error for small
 $z$
(Kassam & Trefethen Reference Kassam and Trefethen2005). We use a Padé approximation code from the EXPINT software package, which does not suffer from such errors (Berland, Skaflestad & Wright Reference Berland, Skaflestad and Wright2007). We use
 $2^{10}$
Fourier modes with a time step of 0.025; results in this work were insensitive to further refinement in grid size.
Large-amplitude coherent structures (b), which emerge via focusing of a localized wave group (a).

3 Localized wave group evolution
A large BFI indicates that the extreme events are more likely than Gaussian statistics would suggest. However, the BFI does not provide any specific information on precisely where an extreme event will occur. Thus, in order to develop a scheme providing precise spatiotemporal predictions we must develop a more precise indicator than the BFI. In high-BFI seas, extreme events are triggered by the nonlinear focusing of localized wave groups (Fedele Reference Fedele2008). Figure 1 displays such an example of extreme event formation by focusing of localized groups. In this case we see that a localized group focuses, narrowing in width and doubling in amplitude, yielding an extreme event.
To better understand this mechanism, in Cousins & Sapsis (Reference Cousins and Sapsis2015) we studied the evolution of isolated wave groups. We review these results describing the evolution of hyperbolic secant initial data:
 $$\begin{eqnarray}u(x,0)=A\,\text{sech}(x/L).\end{eqnarray}$$
For the NLS on zero background, this family of envelopes gives rise to the Satsuma–Yajima breathers that have been observed experimentally in the context of NLS and MNLS (Chabchoub et al.
Reference Chabchoub, Hoffmann, Onorato, Genty, Dudley and Akhmediev2013). Owing to the invariance of the envelope equations we take
 $A$
real with no loss of generality. We investigate the evolution of such groups as a function of amplitude
 $A$
and length scale
 $L$
. In particular, we are interested in whether or not a group will focus and, if it does, the degree by which the group amplitude is magnified.
We emphasize the difference between the instability occurring due to initially localized energy (and zero background) and the classical modulation instability of plain waves. Specifically, in the classical BF instability the aim is to understand when and how energy is transferred from the background wavetrain to a localized wave group that has the form of a breather solution. In this case the conditions of occurrence and length scale of the instability depend on the amplitude of the plane wave. However, for our study assuming a perfect plane wave as background reservoir of energy is not realistic. It is rather more rational to understand if and how energy is transferred from an already localized wave group to smaller scales, resulting in rare events. These localized wave groups are the result of random phases between harmonics caused by linear dispersion. To this end we will focus our attention on the modulation instability properties of individual and isolated wave groups. Similar questions were asked by Adcock et al. in the context of the one-dimensional NLS (Adcock & Taylor Reference Adcock and Taylor2009) as well as NLS and the fully nonlinear model in two dimensions (Adcock, Gibbs & Taylor Reference Adcock, Gibbs and Taylor2012).
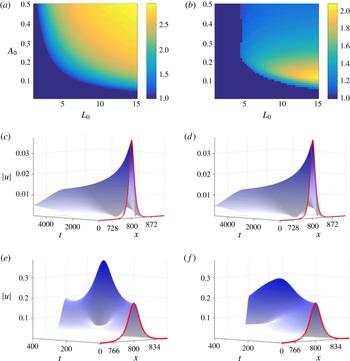
Amplitude growth factors for localized groups in NLS (a) and MNLS (b). Examples of defocusing, amplitude-decreasing groups for NLS (c) and MNLS (d). Examples of focusing, amplitude-increasing groups for NLS (e) and MNLS (f). The initial conditions for the simulations displayed in (e) and (f) are identical. Although both groups focus, the amplitude grows considerably less in MNLS than in NLS.

To answer these questions, we numerically evolve hyperbolic secant initial data for many values of
 $A$
and
 $L$
for NLS and MNLS. To measure the degree of focusing that a group undergoes, we computed the value of the first spatiotemporal local maximum of
 $|u|$
, and termed this value
 $u_{max}(A,L)$
. For a defocusing group, however (figure 2
c,d), this local maximum will occur at
 $x=0$
,
 $t=0$
and we trivially have
 $u_{max}(A,L)=A$
. For a focusing group (figure 2
e,f), the group will contract and increase in amplitude. The group amplitude will eventually reach a maximum and then demodulate, decreasing in amplitude. To make the focusing behaviour clear, in figure 2(a,b) we plot the amplitude growth factor
 $(1/A)u_{max}(A,L)$
for NLS (a) and MNLS (b). This amplitude growth factor describes the degree of focusing that has occurred, with a value of 1 indicating that the group does not grow in amplitude.
We observe that, for both NLS and MNLS, there is a range of groups that focus considerably. However, there are stark differences between group evolution in the two equations owing to the lack of scale invariance in the MNLS. In MNLS, the set of focusing groups is smaller compared with NLS, and many groups that do focus do so to a smaller degree (see example in figure 2 e,f). Particularly, in MNLS there is a smallest focusing length scale where groups thinner than this scale do not focus, regardless of how large their initial amplitude may be. The scale invariance of NLS, however, precludes such behaviour. A similar lack of focusing behaviour at small group length scales was observed by Henderson et al. in numerical simulations of the fully nonlinear model in one space dimension (Henderson et al. Reference Henderson, Peregrine and Dold1999).
The presented modulation instability analysis of localized wave groups will be the first ingredient for the derivation of precursors of rare wave events. It provides information about the wave groups that can lead to rare events because of nonlinear focusing effects but it does not provide information about the likelihood of such wave groups. This information will be extracted using a statistical analysis from the spectrum of the wave field.
4 Probability of critical wave groups in irregular wave fields
In a particular sea state, dispersion effects create random mixing of different harmonics. To this end, all groups do not occur with equal likelihood – the probability of a particular group occurring is determined by the spectral properties of the field. For example, in a Gaussian spectrum the spatial field will contain groups unlikely to focus if the energy level
 ${\it\epsilon}$
is small (low-amplitude groups) or if the spectral bandwidth
 ${\it\sigma}$
is large (small-length-scale groups). Thus, the frequency and nature of the unstable wave groups in a particular field results from the interplay of the nonlinear dynamical properties of the system (expressed as modulation instabilities of wave groups) and the statistical properties of the background field (expressed by the spectrum).
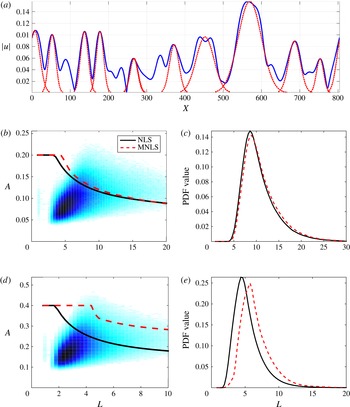
(a) Dominant wave groups (red, dashed) determined by applying the group detection algorithm to the field
 $|u(x)|$
(blue, solid). (b,c) Joint density of wave group amplitude and length scale (b); length scale density for extreme ‘triggering’ groups (c),
 $\text{BFI}=1.4$
,
 ${\it\epsilon}=0.05$
,
 ${\it\sigma}=0.1$
. (d,e) The same, but for
 $\text{BFI}=1.4$
,
 ${\it\epsilon}=0.1$
,
 ${\it\sigma}=0.2$
. In each joint density plot we overlay the curve that separates groups that would focus (if isolated) to form extreme events: NLS curve is black, solid; MNLS curve is red, dashed.

We now describe a computational procedure to quantify for any given spectrum the probability of occurrence of a wave group of a given amplitude and length scale. To compute this probability density function we use an ensemble approach. Using the random phase model (2.3) we generate realizations that follow the given spectrum. For each realization we use a scale selection algorithm to identify coherent wave groups as well as their associated length scales and amplitudes (see appendix A for details on the scale selection algorithm). In figure 3(a), we display an example of such a random realization field
 $|u(x)|$
as well as the groups identified by the group detection algorithm, showing that this algorithm appropriately picks out the dominant groups. We then compute the joint probability density of group amplitude and length scale by applying this group identification algorithm to 50 000 realizations of Gaussian spectrum random fields.
The described step has very low computational cost since it does not involve the numerical solution of dynamical equations but only the statistical analysis of wave realizations that follow a given spectrum. It is the second ingredient, the statistical component of our analysis, which we will now combine with the modulation instability analysis of localized wave groups presented in the previous section. More specifically, using the analysis for the evolution of localized wave groups, we determine, for each length scale
 $L$
, the smallest group amplitude required to ‘trigger’ an extreme event. That is, if the extreme event threshold is
 $H_{E}=4{\it\epsilon}$
, we find, for each
 $L$
, the smallest
 $A$
such that
 $u_{max}(A,L)\geqslant H_{E}$
. Denoting this amplitude as
 $A^{\ast }$
, we trivially have
 $A^{\ast }\leqslant H_{E}$
. This procedure describes a curve
 $A^{\ast }(L)$
, where isolated groups located above this curve in the
 $(L,A)$
plane would yield an extreme event, and those below this curve would not. Note that wave groups with sufficiently small initial length scales
 $L$
will never undergo nonlinear focusing. For these length scales the only wave groups that can reach amplitudes as large as
 $H_{E}$
are the ones that start with
 $A^{\ast }(L)=H_{E}$
. This observation explains the plateau that occurs for small
 $L$
.
In figure 3 we overlay this curve (which expresses dynamical properties of nonlinear wave groups) over the joint density of group amplitude and length scale (which expresses statistical properties of the wave spectrum). For a given spectrum, we may determine the frequency and nature of extreme event triggering groups (i.e. those lying above the respective curves in figure 3). As expected, increasing the energy level or decreasing the spectral bandwidth increases the number of these extreme triggering groups. This analysis provides a concrete, wave-group-based explanation of the development of heavy tails via nonlinear interactions in high-BFI regimes. However, unlike traditional BFI-based analysis, this wave group analysis directly incorporates the lack of scale invariance in MNLS. This is clear from figure 3(b–e) where we display
 $(A,L)$
densities for two different spectra with the same BFI. We note the scale invariance property of NLS (note that the two black curves are identical, albeit the axes rescale) and how this contrasts with the corresponding curves (red dashed lines) for the MNLS, which change between the two spectra even though the BFI index remains the same.
The main benefit of this statistical instability analysis allows us to characterize the properties of extreme event triggering groups in a maximum likelihood sense. Specifically, for a given spectrum, we can compute the density of the length scale of groups that would generate extreme events (i.e. those lying above the curves of figure 3
b,d). In figure 3(c,e) we display examples of these length scale densities for the two different spectra. The concentration of these densities around their peak value suggests that for a given spectrum there is a most likely extreme event triggering length scale,
 $L_{E}$
. As the distribution is fairly narrow, we expect that the majority of extreme events that occur will be triggered by localization at length scales close to
 $L_{E}$
. In § 5, we will use this fact to develop a predictive scheme based on projecting the field onto an appropriately tuned set of Gabor wavelets.
5 Precursors of extreme events
In this section, we describe the central result of this paper, which is the derivation of precursors for extreme events in nonlinear water waves. These precursors allow for the detection of instabilities at their very early stages and therefore lead to the prediction of rare events without the need to solve the full envelope equations.
We describe two precursor forms. First, we develop an algorithm to predict extreme events by identifying the dominant wave groups in a given field, and use our results from § 3 regarding localized groups that can ‘trigger’ an extreme event. Second, we develop a scheme based on projecting the field onto a carefully tuned set of Gabor modes. We find that large values of a certain Gabor coefficient indicate that an upcoming extreme event is likely. This Gabor-based scheme is nearly as reliable as the group detection scheme, yet requires a remarkably smaller computational cost.
5.1 Prediction by wave group identification
Here we describe a straightforward scheme for advance prediction of extreme events via wave group identification. For a given wave field, we apply the group identification algorithm described in appendix A to the envelope. This gives the spatial location, amplitude
 $A$
and length scale
 $L$
of each wave group. We then predict the future focused amplitude of the group by evaluating
 $u_{max}(A,L)$
, where
 $u_{max}$
is the numerically constructed function from our prior study of localized groups in § 3. If
 $u_{max}(A,L)$
is at least 95 % of the extreme event threshold
 $H_{E}$
, then we predict that an extreme event will occur. We choose this conservative prediction threshold in order to minimize the number of false negatives (extreme events that we fail to predict).
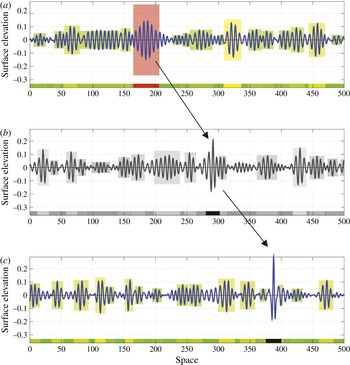
(a) Initial conditions for a simulation of MNLS,
 $t=0$
. Our scheme identifies a group around
 $x=190$
which we predict will grow to form a large extreme event. (b) Group in initial stages of focusing,
 $t=202.5$
, which breaks the extreme event threshold
 $H_{E}=0.2$
near
 $x=290$
. (c) Group is fully focused,
 $t=384.5$
, and attains its maximum amplitude near
 $x=390$
.

In figure 4, we display an example output of our predictive scheme for a simulation of MNLS with initial conditions generated via a Gaussian spectrum with random phases (
 ${\it\epsilon}=0.05$
,
 ${\it\sigma}=0.1$
,
 $\text{BFI}=1.4$
,
 $H_{E}=0.2$
). We display the spatial dependence of the surface elevation for three different values of time. In this simulation, the surface elevation first exceeds
 $H_{E}$
around
 $t=200$
near
 $x=300$
. After exceeding this threshold, the extreme event continues to focus, eventually reaching a maximum of approximately 0.3 at
 $t\approx 385$
,
 $x\approx 390$
(figure 4
c).
We highlight each wave group with a rectangle whose height is equal to the predicted focused amplitude of the group, with a red coloured rectangle indicating that we predict that the group will focus to form an extreme event. Our scheme identifies the group that will ‘trigger’ the extreme event far in advance. The initial prediction occurs at the beginning of the simulation at
 $t=0$
, 200 time units (
 ${\approx}32$
temporal wave periods) before the elevation crosses the extreme event threshold
 $H_{E}=0.2$
, and nearly 400 time units before the extreme event reaches its maximal amplitude. Perhaps most importantly, the prediction occurs while the elevation is at the relatively modest value of 0.147.
Also, our scheme accurately gives the spatiotemporal location where the extreme event will occur. The group that we predict will focus to an extreme event (red rectangle in figure 4
a) has a length scale of 10.3 and amplitude of 0.147. In MNLS, a localized hyperbolic secant initial profile with these characteristics will focus to a maximum amplitude of 0.264 after 351 time units, meaning that our scheme predicts a wave of this amplitude at
 $t=351$
,
 $x=361$
. To predict this spatial location we use the linear group velocity and the fact that the group is located at
 $x=185$
initially. This agrees well with the observed dynamics of the simulation of the full field using MNLS – the identified group focuses to an actual maximum of 0.289.
To test the reliability of this scheme, we implemented it on 100 simulations each of NLS and MNLS with BFI = 1.4 (see appendix A for details on these simulations). Here we only discuss the MNLS results, as the NLS results are similar and MNLS is the more physically relevant equation. In these 100 simulations, there were 336 extreme events. We predicted all of these extreme events in advance – there were no false negatives. There were 91 instances where we predicted an extreme event but one did not occur, giving a false positive rate of 21.3 %. For our correct predictions, the average warning time (the amount of time before the prediction began and the onset of the extreme event) was 153 time units (
 ${\approx}$
24 temporal wave periods).
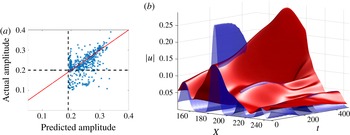
(a) Scatter plot of predicted versus actual amplitudes as well as the line predicted
 $=$
actual (red). Note that the vertical dashed line is located at
 $0.95H_{E}$
to reduce false negatives (as discussed in the text). (b) Spatiotemporal dependence of
 $|u|$
(red) and predicted future amplitude (blue).

Our scheme has value beyond a binary predictor of extreme events. In figure 5(a), we display a scatter plot showing the relationship between the predicted future amplitude and the actual future amplitude of the wave field. We observe that our predictor reliably estimates the future amplitude in a continuous sense. In addition to predicting when an upcoming extreme event is likely, our scheme predicts when a particularly large extreme event is upcoming.
To further illustrate the skill of our scheme, in figure 5(b), we plot the surface
 $|u(x,t)|$
in red, as well as the predicted future group shape in blue. The field displayed here is the same field displayed in figure 4 in a coordinate frame moving with the linear group velocity. The surface plots in figure 5 provide a visualization of the skill of our scheme in predicting the future amplitude of the extreme wave, as well as the spatial location at which it will occur. The blue surface near the extreme event decays and vanishes around
 $t=200$
because we locally turn off the predictor while an extreme event is occurring (
 $|u|>H_{E}$
).
5.2 Prediction by Gabor projection
We now describe an alternative reliable prediction scheme that requires negligible computational cost. In this scheme, we predict upcoming extreme events by projecting the field onto a set of carefully tuned Gabor modes. This approach is similar in spirit to our extreme event predictive scheme for the model of Majda, McLaughlin and Tabak (MMT) (Cousins & Sapsis Reference Cousins and Sapsis2014). This projection requires only a single convolution integral, so its computation is extremely cheap. Even at this low cost, this scheme reliably predicts upcoming extreme events with spatiotemporal skill.
As we showed in § 3, for a given spectrum we can compute the joint density of wave group amplitude and length scale. Using our study of isolated localized groups, we can then compute the conditional density of wave group properties for groups that will ‘trigger’ extreme events. This gives the density of group length scales for groups that would focus to form an extreme event (refer to figure 3
c,e). From this, we can compute the spatial length scale
 $L_{G}$
with the maximum likelihood of ‘triggering’ an extreme event. Owing to the narrowness of the distribution of extreme event triggering group length scales, we expect that extreme events will be preceded by energy localization at a length scale close to
 $L_{G}$
.
To predict extreme events, we estimate the energy concentrated in scale
 $L_{G}$
. To do so, we ‘project’ the field onto the set of Gabor basis functions
 $v_{n}(x;x_{c})$
, complex exponentials multiplied by a Gaussian window function. This gives the Gabor coefficients
 $Y_{n}(x_{c},t)$
:
 $$\begin{eqnarray}\displaystyle & \displaystyle v_{n}(x;x_{c})=\text{e}^{\text{i}{\rm\pi}n(x-xC)/L_{G}}\text{e}^{-(x-x_{C})^{2}/2L_{G}^{2}}, & \displaystyle\end{eqnarray}$$
 $$\begin{eqnarray}\displaystyle & \displaystyle Y_{n}(x_{c},t)=\langle u(x,t),v_{n}(x;x_{c})\rangle /\langle v_{n}(x;x_{c}),v_{n}(x;x_{c})\rangle . & \displaystyle\end{eqnarray}$$
We claim that a large value of
 $Y_{0}$
at a spatial point
 $x_{c}$
indicates that an extreme event is likely in the future near
 $x_{c}$
in space (in a frame moving with the group velocity). To confirm this, we compute the following family of conditional distributions.
 $$\begin{eqnarray}F_{\mathscr{Y}_{0}}(\mathscr{U})\triangleq \mathscr{P}\left(\max _{\substack{ |x^{\ast }-x_{c}|<L_{G} \\ t^{\ast }\in [t+t_{A},t+t_{B}]}}|u(x^{\ast },t^{\ast })|>\mathscr{U}\,\bigg|\,|Y_{0}(x_{c},t)|=\mathscr{Y}_{0}\right).\end{eqnarray}$$
That is, given a particular current value of
 $Y_{0}$
, we examine what are the statistics of the envelope
 $u$
in the future. Here we choose
 $t_{A}=50$
and
 $t_{B}=350$
from the time required for a group of length scale of
 $L_{G}$
to focus to form an extreme event. We compute the statistics (5.3) from 200 simulations of NLS/MNLS with Gaussian spectra and random phases with
 ${\it\epsilon}=0.05$
,
 ${\it\sigma}=0.1$
and
 $\text{BFI}=1.4$
.
(a) Family of conditional densities of current
 $|Y_{0}|$
and future
 $|u|$
, corresponding to (5.3). (b) Probability of upcoming extreme event as a function of
 $|Y_{0}|$
.

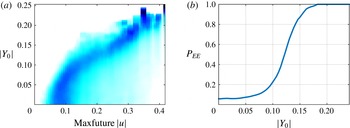
In figure 6(a), we display the family of conditional densities of future
 $|u|$
for a range of values of
 $|Y_{0}|$
. These densities show that, when
 $|Y_{0}|$
is large,
 $|u|$
is essentially guaranteed to be large in the future. From these conditional statistics, we compute the probability of an upcoming extreme event
 $P_{EE}$
as a function of current
 $Y_{0}$
by integrating over
 $(H_{E},\infty )$
. This function is displayed in figure 6(b). Probability
 $P_{EE}$
has a sigmoidal dependence on
 $Y_{0}$
: if
 $Y_{0}$
is large enough then an upcoming extreme event is nearly guaranteed, while if
 $Y_{0}$
is small enough then an upcoming extreme event is highly unlikely.
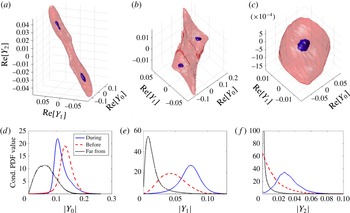
Level surfaces of the joint density of the real parts of
 $Y_{0}$
,
 $Y_{1}$
and
 $Y_{2}$
during (
 $a$
), before (
 $b$
) and far from (
 $c$
) an extreme event. Marginal statistics of
 $Y_{0}$
(d),
 $Y_{1}$
(e) and
 $Y_{2}$
(f) during, before and far from an extreme event.

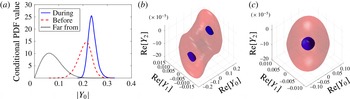
Marginal statistics of
 $Y_{0}$
computed for one-dimensional linear waves (MNLS without nonlinear terms) during (a), before (b) and far from (c) an extreme event. The corresponding level surfaces of the joint density of the real parts
 $Y_{0}$
,
 $Y_{1}$
and
 $Y_{2}$
are also shown.

Our predictor
 $Y_{0}$
becomes large distinctly before the extreme event occurs. The conditional statistics shown in figure 6 pair a value of
 $Y_{0}$
with a maximum value of
 $|u|$
which occurs at least
 $t_{A}=50$
time units in the future. To further illustrate this point, we statistically investigate the energy exchanges between the various Gabor modes. To do so, we compute the statistics of the Gabor coefficients during, before and far from an extreme event. We display these Gabor statistics in figure 7. We see that, away from extreme events, we have nearly Gaussian statistics for the coefficients. In this regime the coefficients also appear to be uncorrelated. Before an extreme event, the coefficients are larger – in particular
 $Y_{0}$
is quite large. During an extreme event,
 $Y_{0}$
is on average smaller than before extremes (see figure 7
d). In the formation of the extreme events,
 $Y_{0}$
decreases by transferring energy to
 $Y_{1}$
, which is largest during the extreme events. During the extreme events, the Gabor coefficients are also strongly correlated (figure 7
a) presenting essentially non-Gaussian behaviour.
For reference we compare the marginal statistics of
 $Y_{0}$
computed previously with MNLS with the corresponding linear equation, i.e. MNLS with the same parameters but without nonlinear terms (figure 8). We find that in the linear case rare events are also preceded by large Gabor coefficients
 $Y_{0}$
, which follow an essentially non-Gaussian distribution. However, in this case
 $Y_{0}$
is much larger compared with the nonlinear case since the amount of amplification is much smaller (due to the absence of modulation instability). This implies that in both the linear and nonlinear wave models, extreme events are preceded by localized wave groups. This is an important property that can lead to rare event prediction for weakly nonlinear wave fields where modulation instability is not relevant.
To predict extreme events, we first compute
 $Y_{0}$
by convolving the field
 $u$
with a Gaussian with the length scale
 $L_{G}$
tuned to the particular spectrum. After computing
 $Y_{0}$
, we then compute the probability of an upcoming extreme event via our pre-computed conditional statistics (figure 6
b). We predict that an extreme event will occur if
 $P_{EE}>P^{\ast }$
, where
 $P^{\ast }$
is a threshold probability that we choose. Choosing a large
 $P^{\ast }$
will result in few false positives and many false negatives, while choosing a small
 $P^{\ast }$
will result in few false negatives and many false positives. We choose
 $P^{\ast }=0.5$
as it gives a low rate of false negatives (meaning we predict almost all extreme events) with a reasonably low false positive rate.
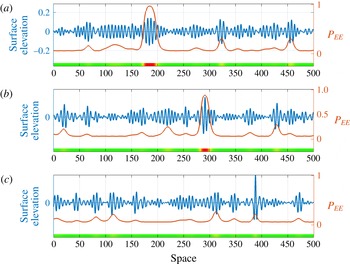
In figure 9, we display the output of the Gabor predictive scheme applied to an example extreme event in a simulation of MNLS (this is the same example we investigated for the group detection-based predictive scheme in figure 4). The extreme event that occurs at
 $x\approx 390$
,
 $t\approx 385$
is predicted from the initial conditions by our Gabor-based predictive scheme, with a high level of confidence (
 $P_{EE}=0.965$
). This prediction occurs 200 time units (32 wave periods) before the amplitude exceeds
 $H_{E}$
, and 385 time units (61 wave periods) before the maximally focused amplitude. The spatial location of the upcoming extreme event (in a moving coordinate frame) is predicted with very good accuracy as well.
Surface elevation (blue) and probability of upcoming extreme event (red) for (a) time
 $t=0$
, (b) time
 $t=202.5$
and (c) time
 $t=384.5$
at which maximum elevation attained.

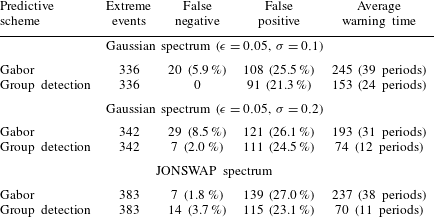
To assess the reliability of this scheme, we tested it on the 100 MNLS simulations used to test the group detection-based scheme in the previous section. None of these simulations were used to generate the conditional statistics in figure 6. We give data describing the performance of both predictive schemes in table 1. The Gabor scheme predicted 316 of the 336 extreme events, giving a low false negative rate of 5.9 %. There were 108 instances where the Gabor scheme predicted an extreme event but one did not occur, giving a false positive rate of 25.5 %. Thus, the Gabor scheme has a slightly higher false positive/negative rate compared with the group detection scheme but overall it performs nearly as well while requiring extremely little computational effort. Additionally, the average warning time for the Gabor scheme was larger than the group detection scheme (245 versus 153 time units, 39 versus 24 temporal wave periods).
We tested both prediction algorithms using a Gaussian spectrum with wider characteristics (
 ${\it\epsilon}=0.05$
,
 ${\it\sigma}=0.2$
), as well as a JONSWAP spectrum given by
 $$\begin{eqnarray}S(k)=\frac{{\it\alpha}}{2k^{3}}\exp (-(3/2)[k_{0}/k]^{2}){\it\gamma}^{\exp [-(\sqrt{k}-\sqrt{k_{0}})^{2}/2{\it\delta}^{2}k_{0}]},\end{eqnarray}$$
where
 ${\it\delta}=0.07$
for
 $k\leqslant k_{0}$
, and
 ${\it\delta}=0.09$
for
 $k>k_{0}$
. For the JONSWAP spectrum we set
 ${\it\gamma}=6$
and choose
 ${\it\alpha}$
so that the significant wave height is 0.2. The results are presented in table 1 and indicate the robustness properties of both predictive schemes.
Performance of Gabor and group detection prediction schemes on 100 simulations of MNLS.

6 Discussion
We study and quantify how energy localization (induced by the linear dispersive mixing of waves) and strong local nonlinearity (having the form of modulation instability of localized wave groups) interact, resulting in the ‘triggering’ of extreme waves. Based on this analysis, we have developed two methods to derive precursors of rare events in nonlinear waves. The first method relies on the prediction by a wave group identification method. Specifically, we combined (i) nonlinear modulation instability results that quantify the focusing of localized wave groups and (ii) a scale selection algorithm that detects wave groups that satisfy this localized stability criterion. This scheme allows us to detect efficiently, and without solving the governing equations, wave groups having high probability of ‘triggering’ an extreme wave. Most importantly, the developed precursor can foresee an extreme event before the amplitude of the wave field becomes important.
The second method relies on the tracking of energy localized over a critical length scale. We used the scale selection algorithm to quantify, for a given wave spectrum, the probability of the formation of critical wave groups that can evolve into rare events. This analysis revealed a spatial length scale where important energy has the highest likelihood to ‘trigger’ a rare event. Based on this result, we formulated an even simpler predictor relying on the Gabor transform, which locally tracks the energy of the wave field over the critical length scale. We applied the two predictive schemes in the MNLS to forecast rare events in directional water waves. Both precursors reliably predicted rogues in advance. Most importantly, this prediction was robust against noise in the background field, allowing for reliable forecast of, on average, 12–39 wave periods before the occurrence of an extreme wave, depending on the initial spectrum.
Note that, although we considered (for demonstration purposes) unidirectional deep-water waves, where heavy tails are more prominent, there are no constraints for the presented theory to be applied in other set-ups involving the occurrence of rare events due to dynamical instabilities. Indeed, heavy-tailed statistics is not a strict requirement for our scheme. The presented approach introduces a new paradigm for understanding and inexpensively predicting intermittent and localized events in general dynamical systems where we have an interplay between uncertainty and nonlinearity. For such systems previous analytical studies have mainly focused on the quantification aspects of rare event statistics through the use of a generalized Pareto distribution (see e.g. Lucarini, Faranda & Wouters Reference Lucarini, Faranda and Wouters2012; Lucarini et al. Reference Lucarini, Faranda, Wouters and Kuna2014). As our approach uses minimal analytical tools, we believe it may be utilized for both prediction and statistical quantification in settings where the dynamics are exceedingly complicated or entirely unknown (requiring a data-driven approach).
In the future, we plan to examine precursors of rare events for two-dimensional water waves, waves in regions with variable bathymetry, as well as waves in crossing seas. Deriving inexpensive precursors of strongly nonlinear instabilities will allow for the improvement of direct numerical methods (see e.g. Alam Reference Alam2014; Clauss et al. Reference Clauss, Klein, Dudek and Onorato2014) for short-term prediction of the wave field evolution through the use of adaptive resolution techniques. To this end, we plan to combine the presented precursors with existing prediction schemes formulated for linear and weakly nonlinear equations in order to improve their efficiency by placing more computational effort in spatiotemporal regimes where strongly nonlinear interactions are expected.
Acknowledgements
This research has been partially supported by the Naval Engineering Education Center (NEEC) grant 3002883706 and by the Office of Naval Research (ONR) grant ONR N00014-14-1-0520. The authors thank A. Chabchoub, F. Fedele, P. Gremaud and C. Merrill (NEEC Technical Point of Contact) for stimulating discussions. They also thank the anonymous referees for numerous comments and suggestions that led to important improvements.
Appendix A. Scale selection algorithm
Here we describe the wave group detection algorithm used in the prediction scheme discussed in § 5.1. To find the dominant wave groups in a given irregular wave field, we look for Gaussian-like ‘blobs’ in
 $|u(x)|$
. To find these blobs, we use an existing algorithm based on the scale-normalized derivatives of
 $|u|$
(Koenderink Reference Koenderink1984; Witkin Reference Witkin1984; Lindeberg Reference Lindeberg1998). These scale-normalized derivatives,
 $s^{(m)}$
, are normalized spatial derivatives of the convolution of
 $|u|$
with the heat kernel,
 $$\begin{eqnarray}s^{(m)}(x,L)=L^{m/2}\frac{\partial ^{m}}{\partial x^{m}}(f\ast g),\end{eqnarray}$$
where
 $g(x,L)$
is the heat kernel,
 $$\begin{eqnarray}g(x,L)=\frac{1}{\sqrt{2{\rm\pi}L}}\,\text{e}^{-x^{2}/2L}.\end{eqnarray}$$
In the above,
 $x$
is the spatial variable and
 $L$
is the length scale variable. Following Lindeberg (Reference Lindeberg1998) we choose
 $m=2$
for optimal blob detection.
We illustrate this approach by computing the scale-normalized derivatives of a single Gaussian:
 $u(x)=A\text{e}^{-x^{2}/2L_{0}^{2}}$
. It is straightforward to show that
 $s^{(2)}$
has a local minimum at
 $x=0$
,
 $L=2L_{0}^{2}$
. In an arbitrary field
 $|u|$
, we similarly find wave groups by computing
 $s^{(2)}$
and subsequently find the local minima. If we find a local minima at
 $(x_{C},L^{\ast })$
, we conclude that there is a wave group at
 $x=x_{C}$
having a length scale
 $\sqrt{L^{\ast }/2}$
. We determine the amplitude of the wave group,
 $A$
, by computing the local maxima of
 $|u|$
near
 $x_{C}$
.
In some instances, scale space extrema do not correspond to actual wave groups. Consider
 $u(x)=\text{e}^{-x^{2}/2L_{0}^{2}}-\text{e}^{-x^{2}/2L_{1}^{2}}$
, where
 $L_{1}=0.8L_{0}$
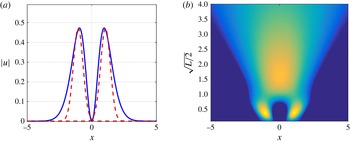
, displayed in figure 10(a). There are two distinct peaks, which the scale selector detects. However, there is an additional local minimum of
 $s^{(2)}$
near
 $x=0$
that does not correspond to a wave group. To eliminate such false positives, for each local minimum of
 $s_{2}$
, we compute the quantity
 $C$
, which measures how close
 $u$
is to a Gaussian-like blob:
 $$\begin{eqnarray}C=1-\frac{\Vert f(x)-A\text{e}^{-(x-x_{C})^{2}/2(L^{\ast })^{2}}\!\Vert _{2}}{\Vert A\text{e}^{-(x-x_{C})^{2}/2(L^{\ast })^{2}}\!\Vert _{2}}.\end{eqnarray}$$
If
 $|u|$
is an exact Gaussian, then
 $C$
is 1. Thus, we take small values of
 $C$
as evidence that the local minimum of
 $s^{(2)}$
do not correspond to a wave group. In the two-humped case displayed in figure 10, the two local minima around
 $x=-1,1$
have
 $C\approx 0.9$
, while
 $C\approx 0.5$
at
 $x=0$
. In practice, we ignore local minima of
 $s^{(2)}$
where
 $C<0.75$
. An example output of the scale selection algorithm with this criterion applied to an irregular wave field is displayed in figure 3(a). We see that the algorithm successfully identifies the dominant wave group in the field.
(a) Plot of double-humped field
 $|u|$
and the groups identified via the scale selection algorithm. (b) Negative part of
 $s^{(2)}(x,L)$
. The extremum at
 $x=0$
,
 $\sqrt{L/2}=2$
is eliminated via the procedure described in the text.

To compute the local minima of
 $s^{(2)}$
, we first generate initial guesses for the minima by computing
 $s^{(2)}$
on a grid with
 $N_{x,SS}$
spatial points and
 $N_{L}$
points in the length scale dimension. We then refine the local minima of the grid-evaluated
 $s^{(2)}$
by Newton’s method. For a particular length scale value
 $L$
, computation of
 $s^{(2)}(\cdot ,L)$
requires two fast Fourier transforms. Thus, the cost is
 $O(N_{L}N_{x,SS}\log N_{x,SS})$
. We have found that a relatively small
 $N_{L}$
is adequate to generate reliable initial guesses for the minima (we use
 $N_{L}=20$
).
For the Newton iteration, we compute the gradient and Hessian of
 $s^{(2)}$
analytically (these analytic expressions do contain integral terms, which we evaluate numerically). For each wave group, we refine (
 $x_{C},L$
) to five digits of precision, which requires no more than three Newton iterations in almost all cases. Note that, compared to the grid computation of
 $s^{(2)}$
, the cost of the Newton iterations is low. The reason for this is that at each iteration the gradient and Hessian of
 $s^{(2)}$
need only be calculated at a single point. This means that the associated integration is only over a small subset of the full spatial domain.
Prediction via this scale selection algorithm is considerably cheaper than solving the envelope partial differential equation (PDE). In the example considered in § 5.1, we predict an extreme event 200 time units in advance using the scale-selection-based algorithm. Evolving the field this many time units with the PDE would require thousands of time steps, each costing
 $O(N_{x,PDE}\log N_{x,PDE})$
to compute the nonlinear terms, where
 $N_{x,PDE}$
is the number of spatial grid points in the numerical PDE solver. By contrast, the scale selection algorithm only requires
 $N_{L}=20$
evaluations of
 $s^{(2)}(\cdot ,L)$
, with each evaluation of
 $s^{(2)}(\cdot ,L)$
requiring
 $O(N_{x,SS}\log N_{x,SS})$
operations. To accurately resolve the small-scale dynamics and the nonlinear terms,
 $N_{x,PDE}$
must be considerably greater than
 $N_{x,SS}$
, which demonstrates clearly the computational gain of the proposed approach (for the considered setting we found that
 $N_{x,SS}$
can be 16 times smaller than
 $N_{x,PDE}$
with no loss of reliability).