1. Introduction
Ships navigate through designated routes when entering, departing or passing ports and adjacent waters, resulting in high congestion levels in the vicinity of port areas. The demand for port entry serves as an indicator for predicting traffic levels. Consequently, when port logistics are concentrated, there is an increase in the number of ships, necessitating measures to ensure their safety (Simonelli et al., Reference Simonelli, Tinessa, Marzano, Papola and Romano2019; Marzano et al., Reference Marzano, Tocchi, Fiori, Tinessa, Simonelli and Cascetta2020; Lee et al., Reference Lee, Lee, Kim, Na, Kim, Lee and Park2022). Most countries widely implement vessel traffic services (VTS) to prevent maritime accidents and effectively manage vessel operations. VTS encompasses a range of shore-side systems, from providing essential information messages to ships regarding the position of other vessels or weather-related hazards, to the comprehensive management of traffic within ports and waterways.
Typically, ships entering a VTS area must report to the authorities through radio communication and can be tracked by the VTS centre. While ships must remain attentive to a specific frequency for navigational or safety warnings, VTS operators may directly contact them in case of incident risks or in regulated traffic flow areas to provide guidance on when to proceed.
Regulation V/12 of the Safety of Life at Sea (SOLAS) stipulates that governments may establish VTS in areas where they deem the volume of traffic or level of risk justifies such services.
Being a coastal state, South Korea has established VTS areas in most coastal waters and major ports to ensure the safety of its coastal regions. According to the Korean VTS Master Plan, VTS centres will be installed in all coastal areas by 2025, enabling efficient control by facilitating information sharing among these centres. In this context, the Inter-VTS Exchange Format (IVEF) was developed to facilitate information exchange within VTS centres. However, despite the guidelines provided by the International Association of Marine Aids to Navigation and Lighthouse Authorities (IALA), smooth information sharing has not been fully achieved. Consequently, there is ongoing discussion within the IALA to revitalise the IVEF, which has been under development for 10 years since 2020.
Moreover, the International Maritime Organisation (IMO) is engaged in discussions regarding autonomous ships. It plans to finalise the development of a non-mandatory agreement by 2025, which is expected to come into force by 2028. In the realm of digital technologies, such as autonomous ships, information sharing assumes a vital role.
Numerous analyses have been conducted on the utilisation of IVEF in VTS. In e-navigation, the standardisation of data exchange formats among marine-related systems is crucial. In this regard, IALA recommends IVEF (IALA, 2011; Oyunchimeg et al., Reference Oyunchimeg, Jeong and Park2013). Oyunchimeg et al. (Reference Oyunchimeg, Jeong and Park2013) proposed a method for designing an IVEF service between VTS and GICOMS in South Korea. Fiorini (Reference Fiorini2012) emphasised the necessity of appropriately sharing essential information across independent systems and procedures on an ongoing basis, suggesting an approach to enhancing situational awareness through VTS information sharing. Lee et al. (Reference Lee, Kim, Cho, Lee and Seo2012) proposed a new IVEF protocol for sharing radar-tracked objects using VTS information. Park (Reference Park2014) designed and implemented a J-VTS middleware that facilitates the exchange of maritime traffic information based on IALA's IVEF service model and protocol. Kim et al. (Reference Kim, Choi and Lee2013) developed an Android platform for exchanging VTS information using IVEF, enabling real-time display of ship data on mobile terminals by extracting specific data from the ObjectData.xml file. With the adoption of e-navigation, the demand for VTS data exchange has grown, leading IALA to endorse the utilisation of IVEF services. Consequently, numerous studies have been conducted on the simultaneous utilisation of these services.
Recently, the exchange of VTS information has transitioned to new technologies, such as cloud computing. Ficco et al. (Reference Ficco, Pietrantuono and Russo2018) highlighted the challenges of a fragmented local VTS and proposed a simulation platform incorporating cloud technology into the VTS system. The authors discovered that the platform leveraged hybrid simulation and virtualisation technologies, enabling deployment on a private cloud, thus reducing the costs associated with setting up realistic and practical testing scenarios. Martínez and Uyà (Reference Martínez de Osés and Uyà Juncadella2021) introduced significant EU projects that harness the potential of satellite technology in the digital era of VTS. The authors argued that real-time traffic control, facilitated by wireless equipment and radar screens, has existed for more than 73 years. Now is the time for implementing a global VTS without geographical limitations. In line with the implementation of e-navigation, the development of the S-100 specification for VTS is underway, and the S-127 standard defines VTS services from the perspective of vessel navigation (Lee et al., Reference Lee, Lee, Kim, Na, Kim, Lee and Park2022). E-navigation has undergone sea trials and can be utilised independently, even when physical and traditional navigation aids are not feasible (Weintrit et al., Reference Weintrit, Pietraszkiewicz, Piotrzkowski and Tycholiz2021).
These studies recognised the significance of information exchange between VTS areas within the context of e-navigation and focused on standards and technologies for sharing information across VTS areas. The objective of this study was to analyse the need for information sharing. In other words, information exchange between VTS areas is vital as ships traverse between these areas, and the areas requiring information exchange can be identified through the traffic patterns of ships moving between VTS areas.
To emphasise the flow of information between VTS areas rather than the VTS information connectivity technology itself, this study sought to identify the characteristics of ships passing through the VTS area to serve as the focal point of information flow. Consequently, the study aimed to determine the concentration of ship information using social network analysis (SNA). In the coastal state of South Korea, identifying the VTS area through which a ship passes before reaching its destination or moving to another location makes it possible to identify areas where ship information is concentrated and what path the ship should follow. Furthermore, areas with significant information gathering can be prioritised as policy zones for smooth control. Therefore, this study aimed to analyse the network of VTS data flow by utilising the data of ships that pass through the VTS area, ultimately deriving information-centric areas along the coast of South Korea.
The rest of this paper is organised as follows: Section 2 underscores the importance of information delivery by examining VTS and VTSO surveys. Section 3 outlines the data collection, pre-processing, and analysis procedures. Section 4 presents the results of the SNA. Section 5 discusses the implications of these results for South Korea. Finally, Section 6 provides the study's conclusions and limitations.
2. Review of VTS operation
2.1 Roles
A VTS is an onshore system responsible for overseeing and regulating ship traffic to ensure the safe and efficient movement of vessels. VTS has gained international recognition as a vital navigational safety measure under the International Convention on the Safety of Life at Sea 74/78 (SOLAS). Specifically, SOLAS Chapter V (Safety of Navigation) Regulation 12 outlines the provisions for VTS (IALA, 2022).
The primary objective of a VTS is to contribute to the safety of life at sea, promote secure and efficient navigation, and safeguard the environment within the designated VTS area by proactively addressing potentially hazardous situations through the following means:
• Providing timely and pertinent information regarding factors influencing a ship's navigation and aiding decision-making processes.
• Monitoring and managing ship traffic to ensure the safety and efficiency of vessel movements.
• Taking appropriate measures to address emerging unsafe situations.
Furthermore, in the event of an incident, the VTS can also support various mitigation operations. In the realm of vessel traffic safety, the VTS may extend assistance in maritime assistance services (IMO Resolution A.950(23)), identifying places of refuge (IMO Resolution A.949(23)), search and rescue efforts, firefighting activities, pollution response and salvage operations.
2.2 System
The VTS is designed to maintain a comprehensive overview of the traffic situation, enable interaction with vessels and respond effectively to evolving traffic conditions within the VTS area. The International Association of Marine Aids to Navigation and Lighthouse Authorities (IALA) has established functional and performance requirements for VTS systems and equipment, including the VTS core system, voice communications, RADAR, AIS(Automatic Identification System), environment monitoring systems, electro-optical systems, radio direction finders and long-range sensors (IALA, 2018, 2022).
The VTS centre collects information through the VTS system, which can then be shared with stakeholders and relevant external parties. IALA Recommendation 0145 offers a framework comprising formats and protocols for data exchange. The VTS system acquires and compiles information about marine traffic within the VTS area. This information can be shared among stakeholders and relevant external parties, contributing to the effective provision of services to the marine and maritime community by promoting harmonisation, connectivity and integration of system components.
2.3 Survey results of VTS operator
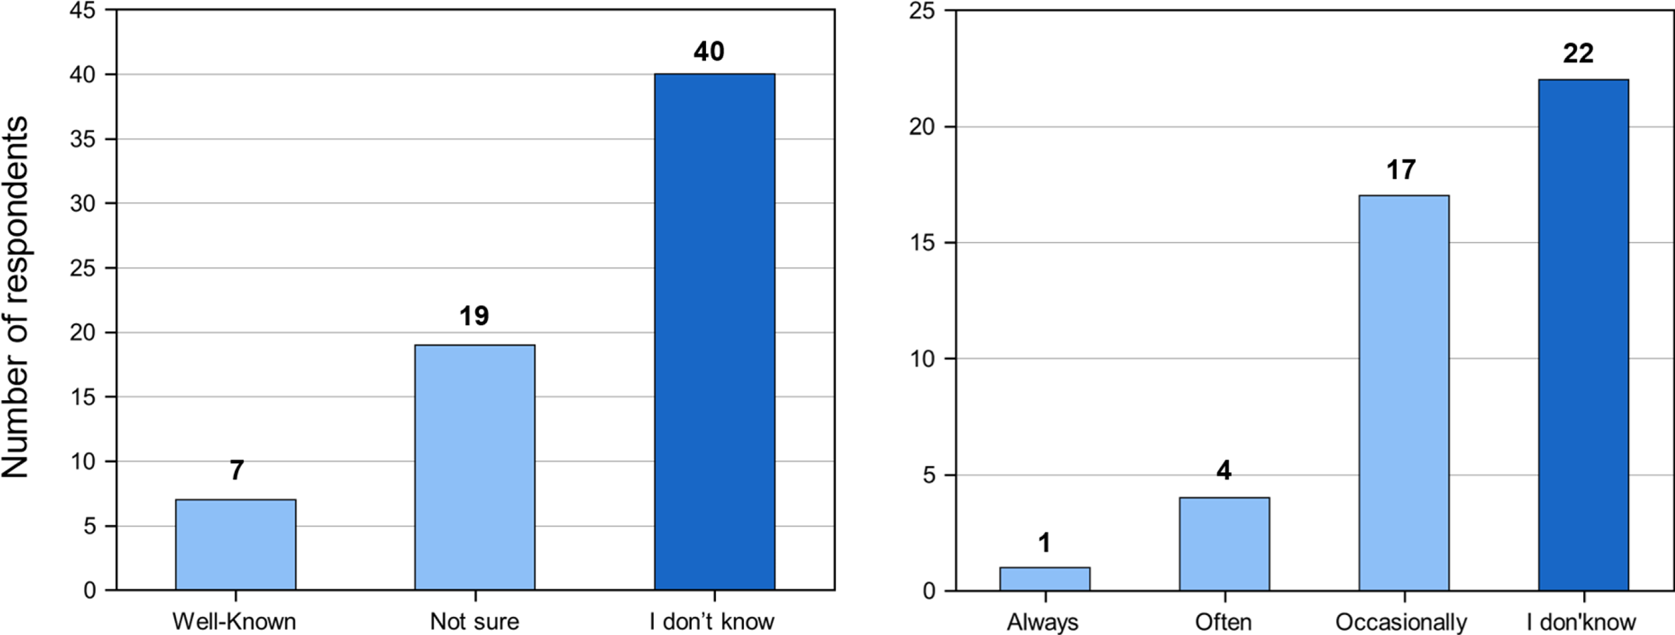
A survey was conducted targeting VTS operators in South Korea to ascertain the status and significance of information sharing. A total of 66 VTS operators participated in the survey. The questionnaire aimed to gauge their awareness and utilisation of the information exchange for VTS (IVEF), the methods employed for information sharing and the most crucial content requiring dissemination. Figure 1 illustrates the response graph from the VTS operators regarding IVEF recognition. The findings revealed that 60.6% (40 individuals) of the surveyed VTS operators were unaware of the IVEF. Only one VTS operator consistently utilised the IVEF, while 39 operators either lacked knowledge or reported inadequate usage. It became apparent that the IVEF, as a means of information exchange between VTS systems, was not actively employed on-site.
IVEF service recognition (left) and utilisation (right)

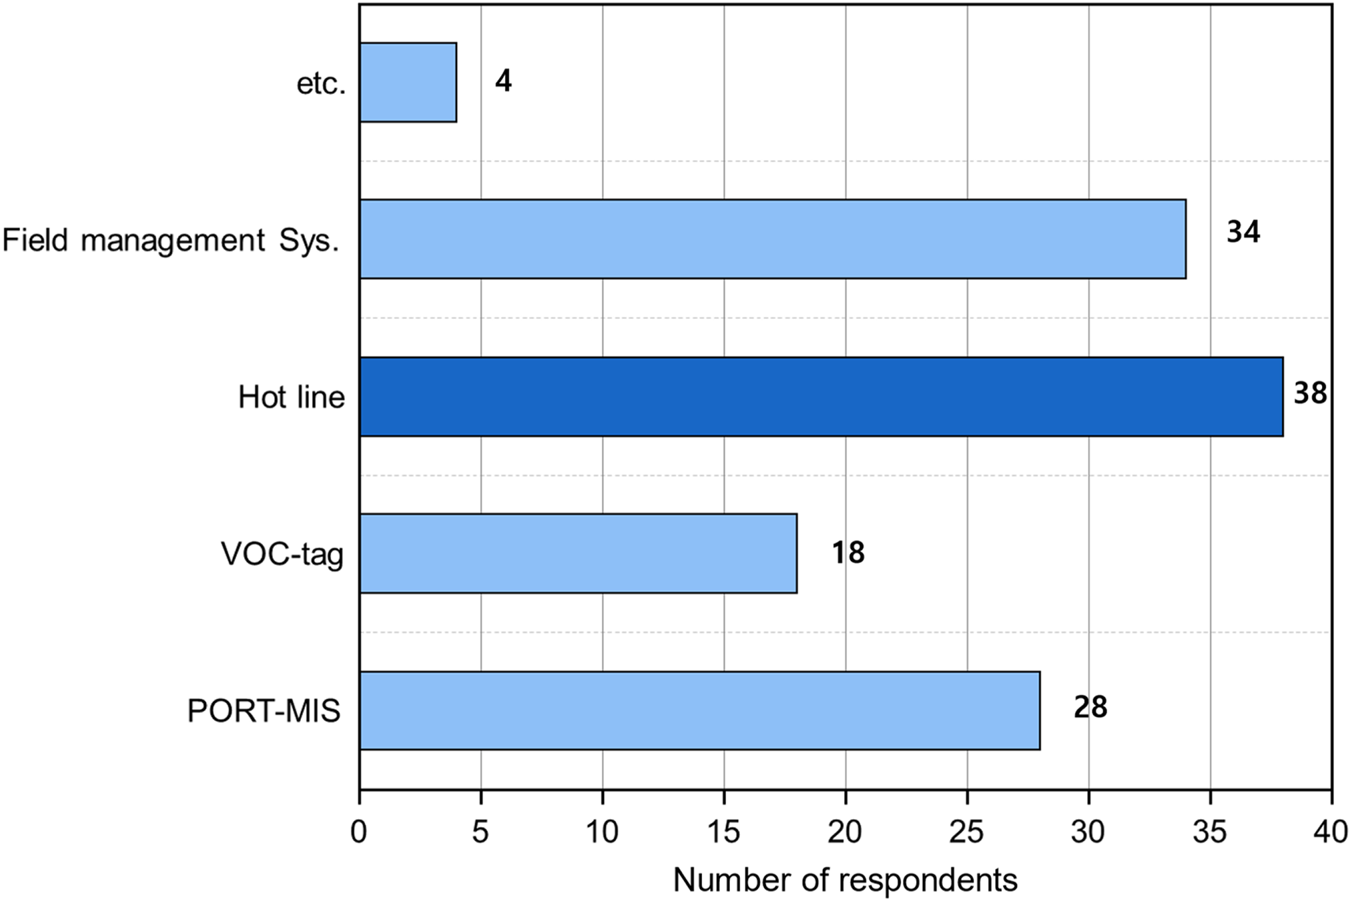
Figure 2 presents the responses concerning the current information-sharing methods employed by VTS operators. To effectively fulfil their role, VTS operators should collect, interpret, and disseminate information to the relevant parties. Before conducting the survey, we examined the information-sharing system employed at the VTS centre through interviews. The VTS centre utilises the Port Management Information System (PORT-MIS), the VTS operation console tag function, a hotline and the Korea Coast Guard Information System for information sharing.
Means of use for sharing VTS information

The possibility of duplication was allowed, and it was observed that the most prevalent method of information sharing was through a hotline, with 38 participants opting for this approach. It was apparent that direct communication channels, such as the hotline, were favoured over data sharing via alternative systems.
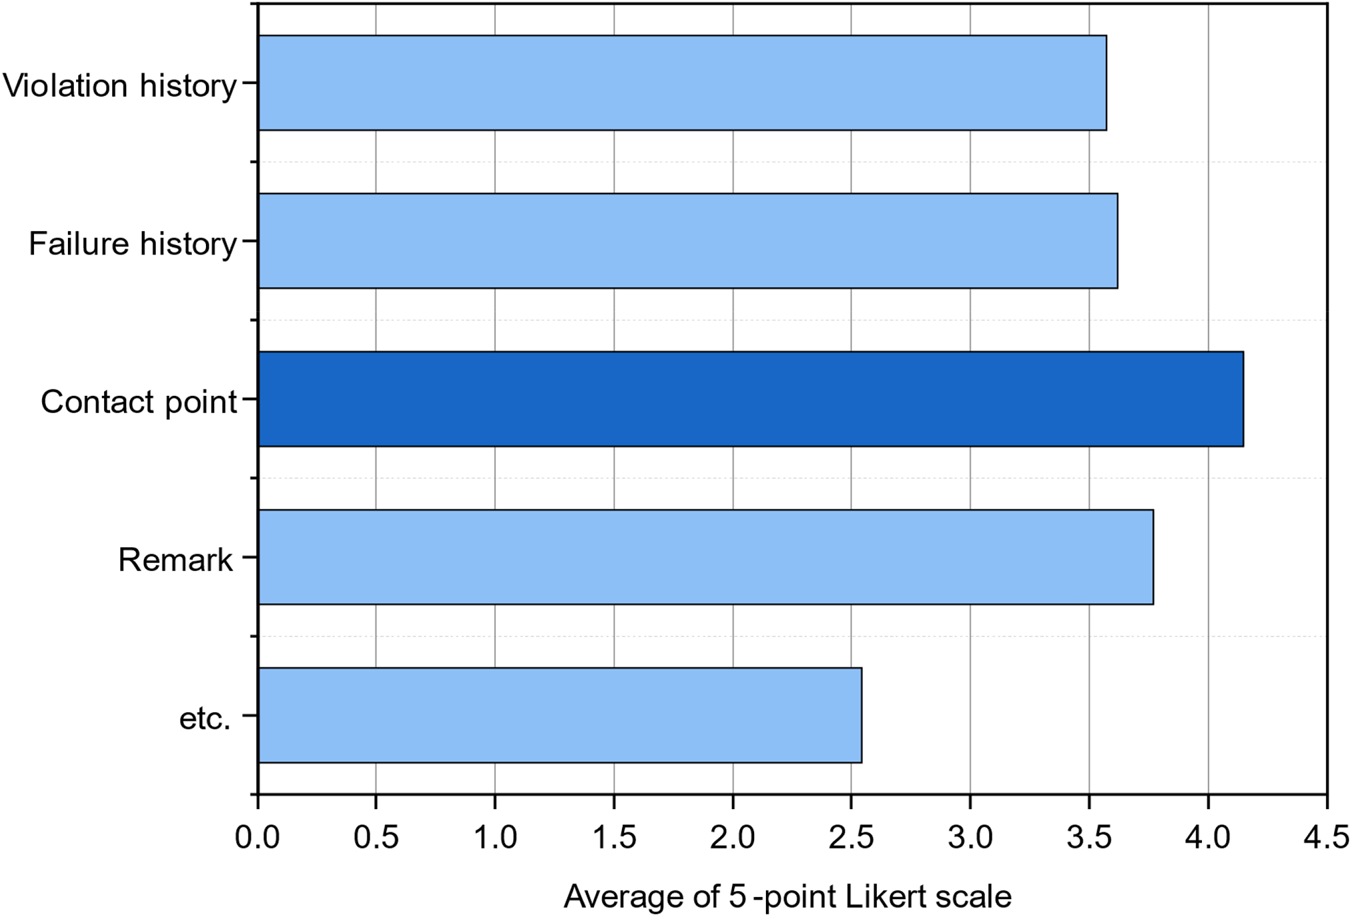
Figure 3 illustrates the responses regarding the specific content that necessitates sharing. Before the VTS operator interview, it was identified that information related to violation history, failure history, contact points and remarks was deemed essential. The content was evaluated using a 5-point Likert scale (Likert, Reference Likert1932), and it was determined that the contact point category received the highest score.
Contents that require information sharing

Conducting a survey among VTS operators validated the present state of information sharing between VTS areas and the requirement for enhancing information exchange. Furthermore, it was observed that the IVEF service, which facilitates the sharing of VTS information among different areas, was not actively utilised on-site.
3. Materials and methods
3.1 Data processing sequence
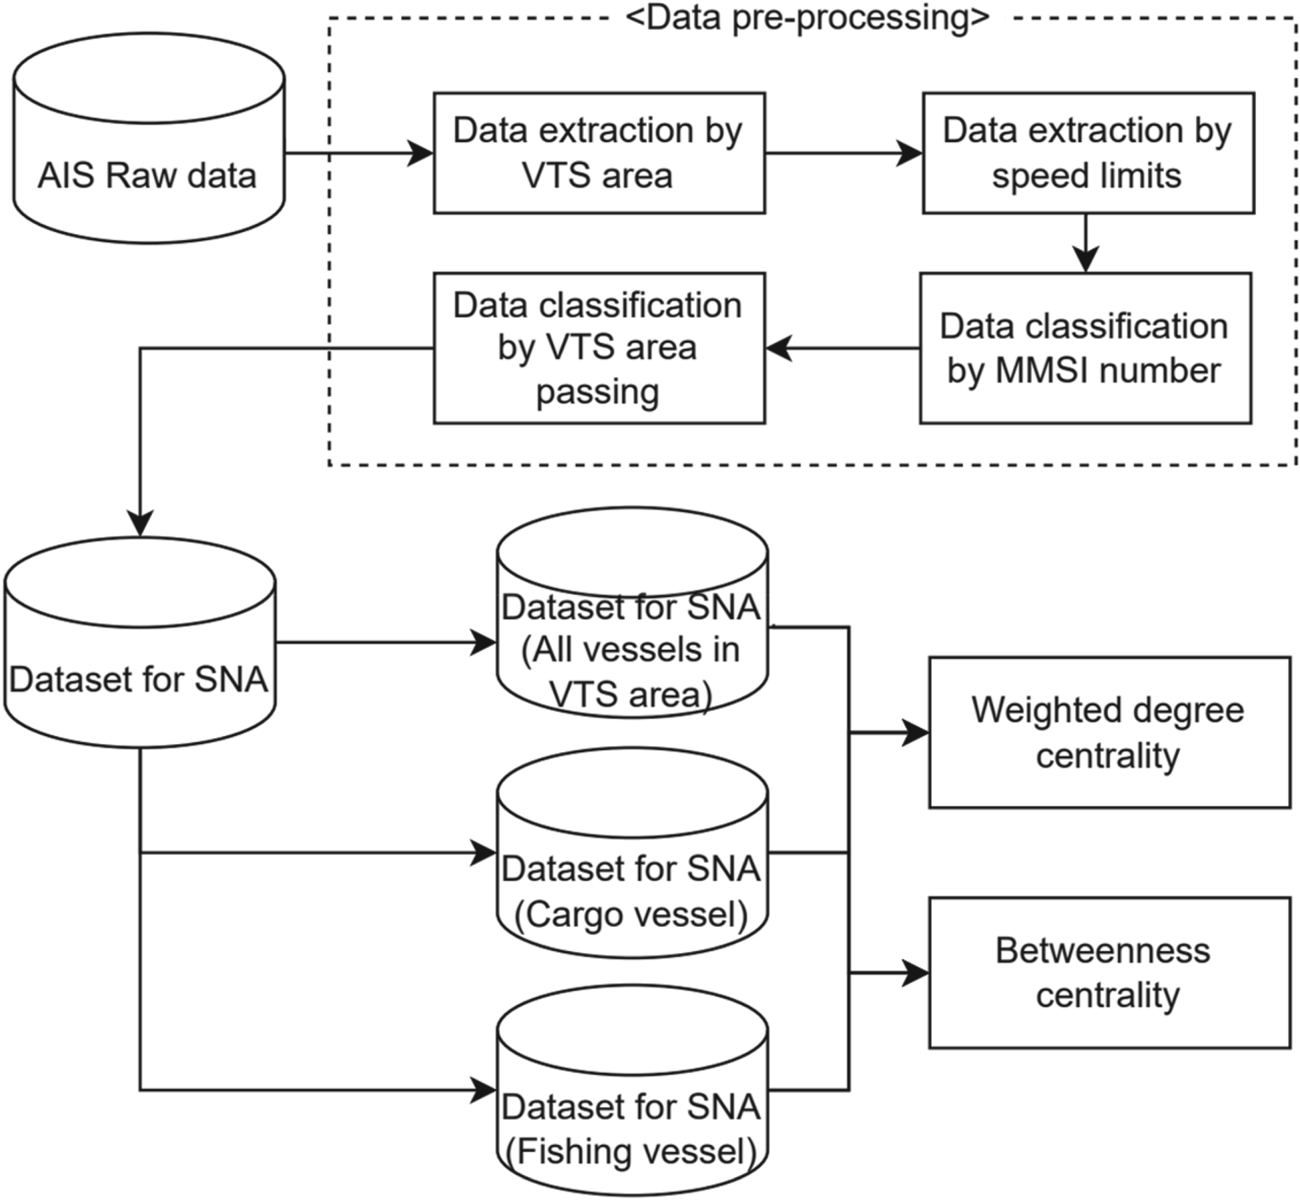
Figure 4 depicts the data processing methodology employed in this study. AIS data were utilised to examine ships’ flow among the VTS areas. Following Inoue and Hara (Reference Inoue and Hara1974), a minimum of three days' worth of maritime traffic data was deemed necessary to establish the traffic characteristics of the target sea area over one year. Additionally, Yoo et al. (Reference Yoo, Park, Park and Jeong2015) suggested that a marine traffic survey should span at least one week, considering the day-of-week index. Therefore, this study employed AIS data collected over seven days, from 2 March 2020 to 9 March 2020. The gathered AIS data were then organised within the GIS program to delineate the VTS areas of Korea.
Data processing sequence

Sailing ships were categorised based on their speed. The vessel's Maritime Mobile Service Identity (MMSI) number was employed for identification and to determine the VTS area to which it corresponded. Furthermore, the ship type was classified using the MMSI number. Subsequently, the collected data were segregated into two groups: ships entering and departing the VTS area, delineated by a gate line drawn along the VTS area boundary. This division facilitated the creation of a dataset for analysis. The analysis encompassed ships, cargo ships and fishing ships within the VTS area. While the VTS primarily monitors vessels subject to SOLAS regulations, there are also non-SOLAS-related vessels within the VTS area. Hence, the movement of fishing boats within the VTS area was also examined.
3.2 Data pre-processing to dataset
To conduct SNA, data on the origin and destination of ships was acquired. The dataset comprised information on the originating VTS area and the destination VTS area. Figure 5 provides an example of how the origins and destinations of a VTS area were identified using traffic data. In the given illustration, we extracted the transit time of Ship A within the VTS area, distinguishing it as either entering or exiting the VTS area. Determining the origin and destination within the VTS area was based on chronological order. Ship A yielded two sets of data points. The first dataset indicated Coast_Yeosu as the origin and Coast_Tongyoung as the destination, while the second dataset indicated Coast_Tongyoung as the origin and Busan as the destination. This study did not consider movements solely within the VTS area. However, in cases where a vessel exited a VTS area and returned to the same VTS area, the origin and destination were considered the same VTS area, resulting in the creation of a dataset.
Pre-processing example

3.3 Target area
Figure 6 represents the designated target area. This area encompasses the VTS zones established in the ports and coastal regions of the Republic of Korea. South Korea has five coastal VTS areas and 15 Port VTS areas. Currently, four companies employ VTS systems in Korea. Although each system adheres to the IVEF service, as discussed in Section 3, the seamless utilisation of this format is not guaranteed. Therefore, in this study, we assumed and analysed that information sharing among VTS operators in different areas may be challenging if they employ systems from different manufacturers.
Target area

3.4 Social network analysis
SNA is a method used to examine network structures and phenomena through connection data (John, Reference John2017). SNA operates under the assumption that social networks form a significant component of social systems. Unlike the traditional focus on individual members, SNA offers an alternative perspective that emphasises the relationships among members to explain a range of social phenomena (Kwak, Reference Kwak2014; John, Reference John2017). In essence, SNA portrays the social environment as a pattern of entity interactions and relationships. Due to its ability to quantitatively analyse network structures resulting from interactions and relationships among actors, it finds application in diverse fields such as social science, business administration, and applied science (Han and Jeong, Reference Han and Jeong2016).
Since ships navigate between ports and along specified routes, the methodology of SNA has found active application in the shipping and port sectors. Ducreut and Notteboom (Reference Ducreut and Notteboom2012) examined the connectivity and centrality of major ports, establishing a robust correlation between the centrality index within the network and the volume of transported goods. Kang et al. (Reference Kang, Bang and Woo2014) conducted SNA to investigate the role of ports as hubs. Moreover, various scholars have employed SNA in the context of shipping and ports (Leam, Reference Leam2011; Kim, Reference Kim2013; Kim and Kwon, Reference Kim and Kwon2014; Jeon et al., Reference Jeon, Cha and Yeo2016; Park et al., Reference Park, Ahn and Lim2016; Park, Reference Park2018; Ryu et al., Reference Ryu, Nam, Jo and Ryoo2018; Kim, Reference Kim2020).
3.4.1 Weighted degree centrality
Weighted degree centrality evaluates the level of connectivity by considering both the number of links connecting nodes and the weight associated with the traffic volume:

where $C_D^W$ : weighted degree centrality
The calculation of weights does not signify the presence of a connection between nodes but rather indicates the number of connections. Hence, it represents the frequency of connections rather than just the degree of connectivity. In this study, the VTS areas were treated as nodes, and the analysis focused on identifying the number of ships moving between the VTS areas and establishing the network among them. A VTS area with a high weighted connection centrality denotes a central point in the flow of information.
3.4.2 Betweenness centrality
Betweenness centrality assesses the centrality of a particular location within the entire network, encompassing both nodes, and signifies the extent to which it mediates the connection between nodes that are not directly linked. A node situated along the shortest path in a network is regarded as possessing a structural advantage:

where ${C_B}(i )$ : betweenness centrality; ${p_{jk}}$
 : the number of shortest paths passing through nodes j and k; and $\; {p_{jk}}(i)$
 : number of shortest paths through nodes j and k that include node i.
A high betweenness centrality indicates that a VTS area is geographically located on a major route that must be passed through when connecting specific VTS areas.
4. Result
4.1 Network map
Figure 7 depicts the network connecting VTS areas. Figure 7(a) illustrates all vessels traversing between VTS areas, Figure 7(b) shows cargo ships navigating between VTS areas and Figure 7(c) demonstrates the movement of fishing boats between VTS areas. The direction of the network is denoted by arrows, with the size of the port symbol indicating the centrality of the connection and the thickness of the links representing the number of vessels in motion. Where the arrows return to the same VTS area, this signifies vessels exiting the VTS area and subsequently re-entering it.
Maps: (a) network map of all vessels in the VTS area; (b) network map for cargo vessels in the VTS area; (c) network map for fishing vessels in the VTS area

The network comprising all vessels moving within the VTS area exhibits a notable volume of coastal movement. Being a coastal state, South Korea experiences marine traffic that predominantly follows a trajectory along the coastline, entering ports along the way. This is primarily due to ships seeking the shortest distance.
The network of cargo ships displays a prominent pattern of movement along the coast. Conversely, the network of fishing boats exhibits limited connectivity with the West, South and East Seas. This indicates that fishing boats primarily operate within the confines of the West Sea, South Sea and East Sea, without extensively crossing into other sea areas. Furthermore, there is substantial movement of fishing boats in and out of the Kyungin and Tongyoung coastal VTS areas, suggesting that many fishing boats depart from and return to these coastal VTS areas for fishing activities.
4.2 Weighted degree centrality
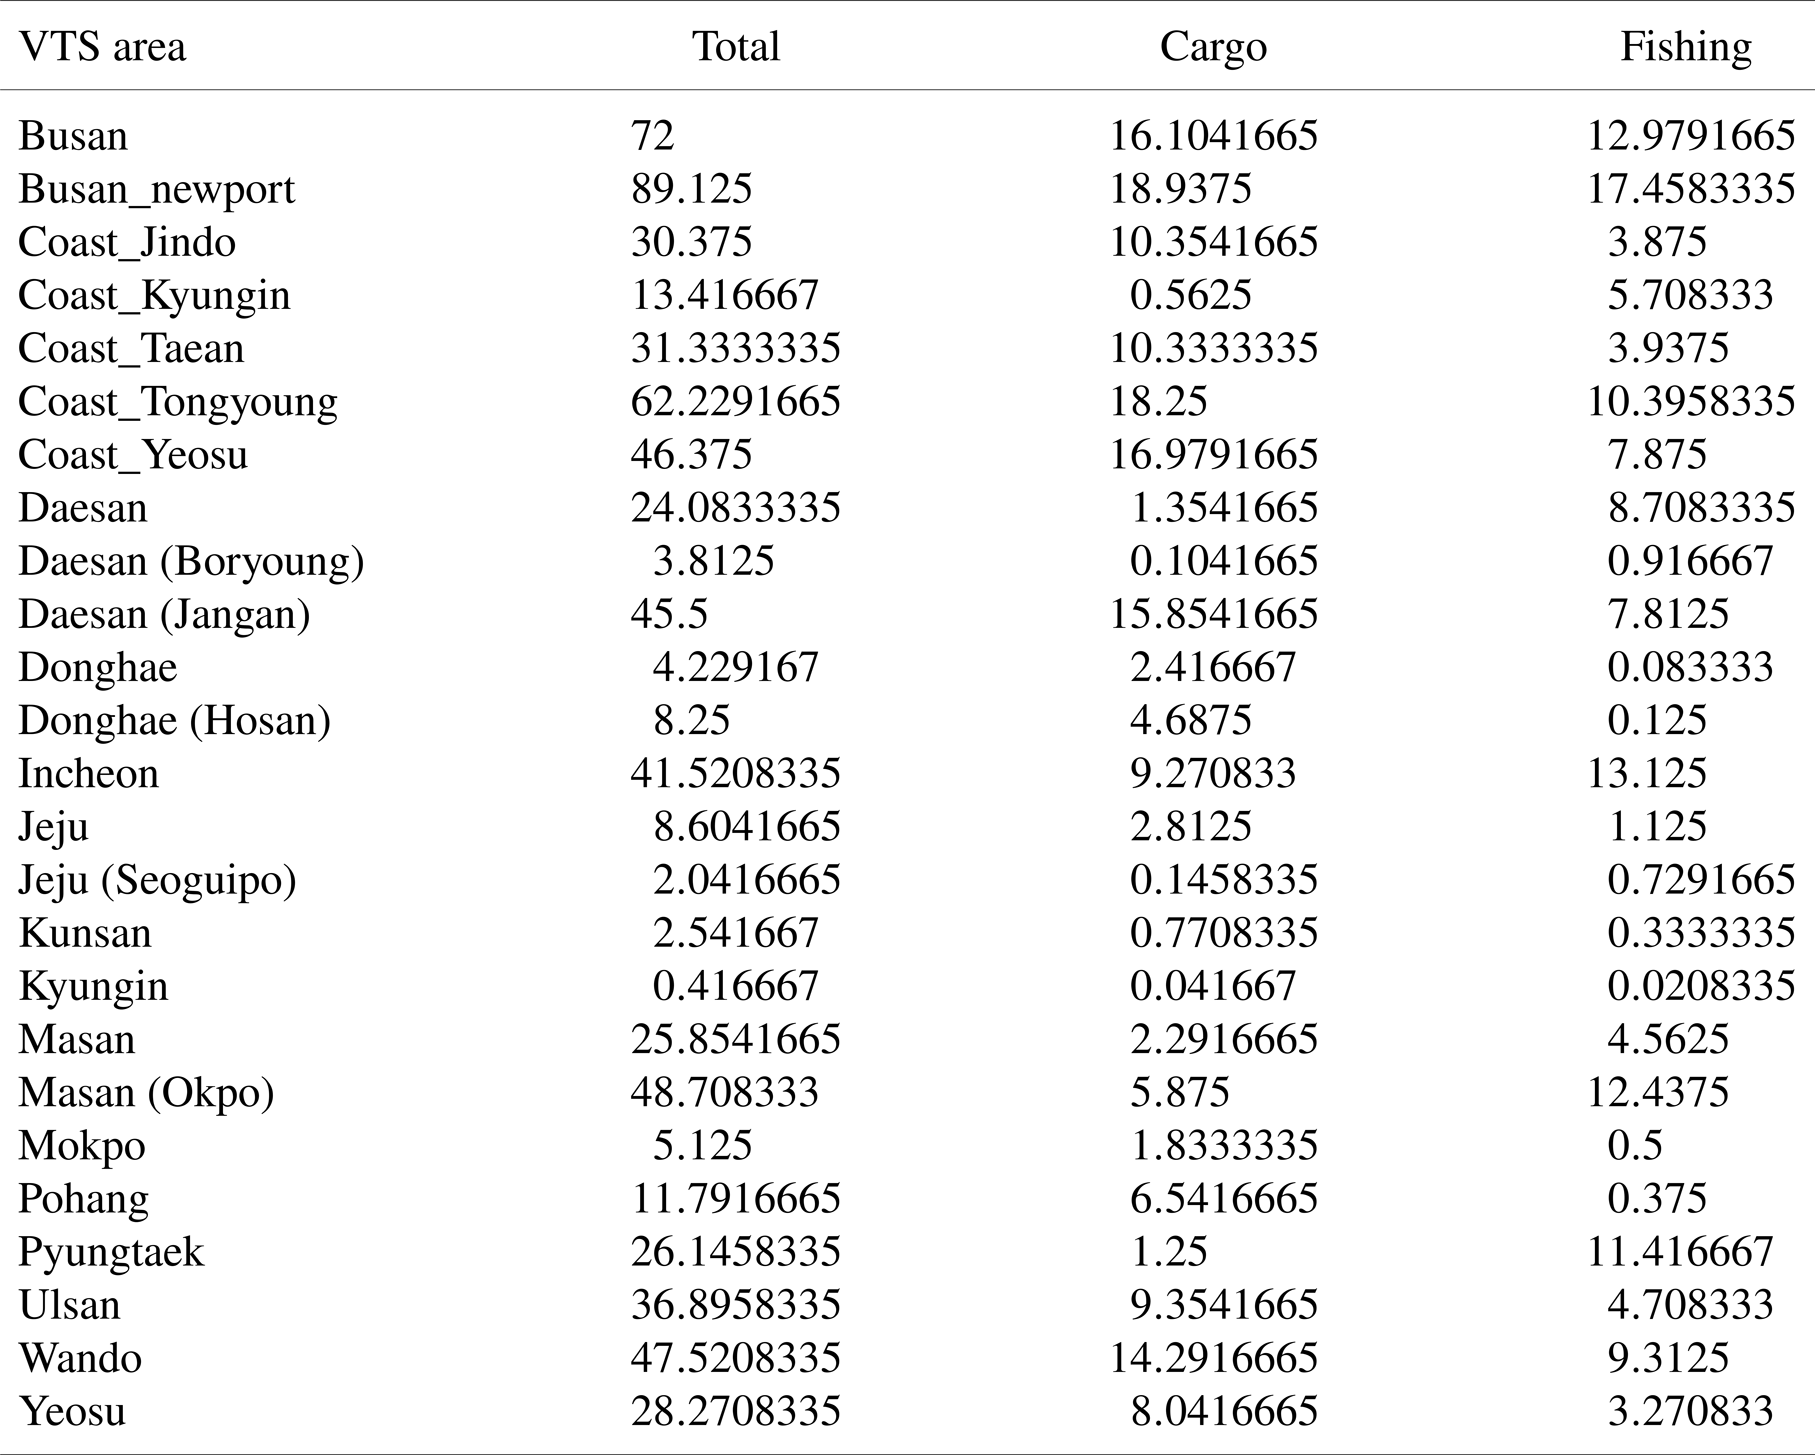
Table 1 presents the weighted degrees corresponding to each ship type. Busan New Port exhibited the highest connectivity centrality among all vessels, followed by Busan Port, Tongyoung, and Yeosu Coastal Areas. These VTS areas are interconnected, and each demonstrates significant connectivity. Given the substantial volume of ship traffic passing through these areas, ensuring effective information connectivity within this region is paramount.
Weighted degree centrality of VTS area by vessel type

Regarding cargo ships, the findings were consistent with the overall results. However, Masan Okpo Port displayed relatively lower connection centrality due to the limited number of cargo ships operating in the Okpo Port area.
Regarding fishing boats, Busan New Port emerged as the VTS area with the highest connection centrality. Furthermore, Busan Port, Tongyoung coastal area and Okpo Port area exhibited notable values. Like cargo ships, fishing boats frequently traverse the VTS areas in the southern coastal region. However, unlike cargo ships, fishing boats often pass through the Okpo Port area.
4.3 Betweenness centrality
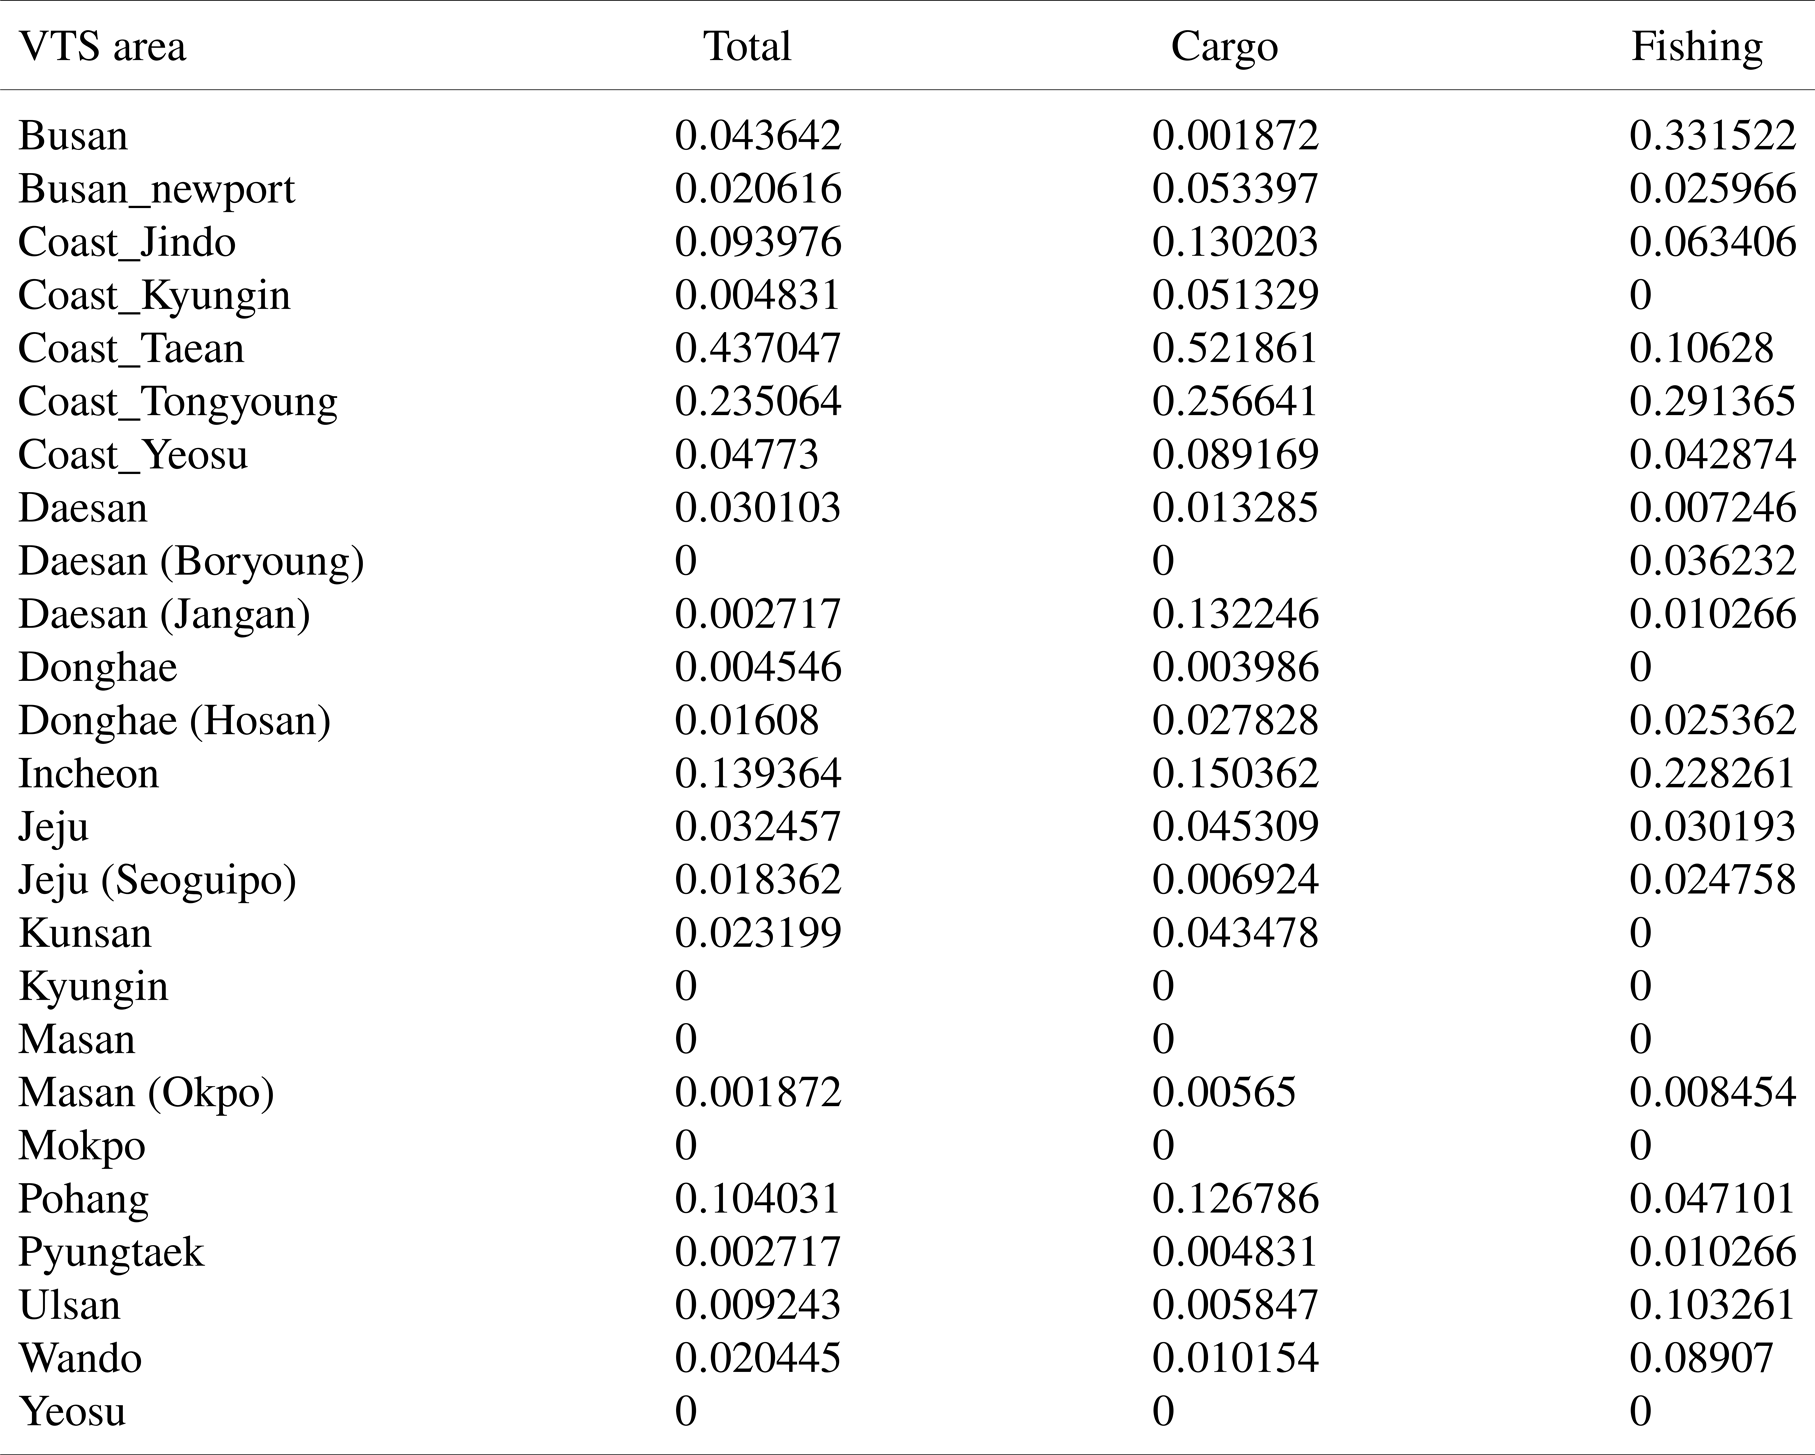
Table 2 presents the betweenness centrality values by each ship type. The Taean coastal area exhibited the highest betweenness centrality among all ships, followed by the Tongyoung coastal VTS Area. The coastal VTS areas demonstrated relatively high betweenness centrality, likely because the shortest routes between port areas often pass through coastal waters. Similar patterns were observed for cargo ships, consistent with the overall ship analysis.
Betweenness centrality of VTS area by vessel type

Busan Port and Tongyoung coastal VTS area displayed significant values regarding fishing boats. This can be attributed to fishing boats navigating between ports and fishing areas rather than exclusively between ports. Consequently, the corresponding VTS areas are crucial in facilitating their movement along these routes.
5. Discussion
Figure 8 displays an overlay of the network map depicting the VTS system manufacturers within the VTS area, as shown in Figure 8. The network map reveals that all VTS areas are interconnected. Although the Donghae VTS, located at the eastern end of the East Sea, is not directly linked to the Kyungin Coast VTS, it can establish connectivity by traversing the Donghae–Donghae(Hosan)–Pohang–Ulsan–Busan–Busan New Port–Tongyoung Coast–Yeosu Coast–Wando–Jindo Coast–and Taean Coast. This implies that if information can be exchanged between VTS areas, it is also possible to establish geographical connectivity across regions separated by the East Sea and West Sea.
Network map with VTS system manufacturer

However, in reality, South Korea utilises VTS systems from four different manufacturers, and as indicated by the survey results, the utilisation of the IVEF service is not actively practiced. Consequently, there is a likelihood of information being impeded within this network.
Figure 9 illustrates the distribution ratio of different manufacturers within each VTS area and the occurrence of marine accidents in the respective VTS areas where vessel movements between VTS areas took place. The marine accidents reported within the VTS areas encompass data from a six-year period, spanning 2017 to 2022 (Korean Maritime Safety Tribunal, 2023). While the primary objective of VTS is to ensure the safety of the VTS areas, swift action must be taken in the event of a marine accident (IALA, 2022). In addition, it was confirmed that the manufacturers were different among the navigating routes between the VTS areas. The non-connecting rate was defined as the ratio of routes between different manufacturers out of all routes. This is to distinguish the degree of difficulty in exchanging information with the system among the connection paths.
Non-connecting rate and marine accidents in the VTS area

First, the correlation coefficient was calculated to determine the relationship between the number of marine accidents and the non-connecting rate. The correlation coefficient was 0.14, indicating a low correlation between these variables. This suggests that the direct relationship between marine accidents and information sharing among VTS centres is minimal. However, it is important to examine the characteristics of certain VTS centre areas.
The VTS area with the highest ratio was the Masan (Okpo) VTS. The Masan (Okpo) VTS area demonstrates direct ship movements with Masan Port, Busan New Port, Busan Port, and Tongyoung coastal VTS area. However, apart from Masan Port, the manufacturers of the nearby VTS areas are different, resulting in potential information fragmentation. In such cases, direct communication or information delivery through VHF should be employed. Similar to the Masan (Okpo) area, the Taean coastal VTS area faces a comparable situation. While the surrounding VTS areas are geographically interconnected, a significant portion (67.9%) of information remains unlinked due to variations in manufacturers between Boryeong Port, Daesan Port the and Kyungin coastal VTS area.
Although there was no direct quantitative correlation between the non-connecting rate and the number of marine accidents, it was noted that many marine accidents occur in certain areas where direct information sharing is difficult due to the variety of manufacturers.
Marine accidents occur most frequently in the Busan, Masan and Tongyoung coastal VTS areas. These areas exhibit high degrees of centrality along with a substantial ratio of unconnected information. Therefore, they are deemed areas requiring immediate attention and action.
6. Conclusions
The Republic of Korea, being a coastal state, has devised a comprehensive plan to extend the coverage of VTS to its entire coastline by 2025. This expansion of coastal VTS aims to eliminate control gaps during departures and entries into Korean ports, ensuring safe navigation. Consequently, the significance of information connectivity within the VTS becomes increasingly vital. Therefore, this study utilises SNA to examine the characteristics of ship movements between VTS areas along the South Korean coast. The findings are as follows:
1. A survey conducted among VTS operators in Korea determined that operators primarily exchange VTS information through direct communication rather than relying solely on systems. Notably, sharing information regarding secondary communication methods with vessels within the VTS area emerged as a crucial aspect. This established the importance of data sharing in the VTS.
2. A maritime traffic survey encompassing 20 VTS areas in South Korea was conducted to identify the characteristics of vessel movements between VTS areas. Through the use of SNA, it was observed that Busan New Port, Busan Port and Tongyoung Coast exhibited high weighted degree centrality. These VTS areas are geographically interconnected and serve as hubs for information exchange, given the substantial ship traffic in these regions. The Tongyoung and Taean coasts demonstrated high betweenness centrality, indicating their role in connecting networks. Therefore, these coastal VTS areas are recognised as crucial geographical locations linking various ports.
3. The study further analysed the VTS manufacturers and network maps in South Korea. While the information connection within the network extends to the East Sea, South Sea and West Sea, potential information blockages can occur due to the systems of different manufacturers. Particularly, Masan (Okpo Port) exhibited significant connection blocking, coinciding with a higher frequency of marine accidents in the area. As the primary function of VTS includes accident prevention and swift dissemination of information in the event of a maritime incident, ensuring information connectivity within this region is deemed of utmost importance.
This study contributes academically to the quantitative analysis of VTS areas and vessel movements within them, identifying the network focal points within Korean VTS areas. Furthermore, a comparison between these network focal points and marine accident information provides valuable insights for policy-making by highlighting areas requiring improvement due to high instances of information connection blockages.
One limitation of this study is that it did not account for seasonality and peak times due to the limited investigation period. Additionally, the analysis focused solely on movements within VTS areas, excluding ships directly approaching from overseas ports or departing the territorial seas directly from the VTS areas. Future research can address these limitations by conducting an expanded network analysis and presenting an extended network map.