

Introduction
Environmental heterogeneity is known to be a driver of population structure (Temunović et al., Reference Temunović, Franjić, Satovic, Grgurev, Frascaria-Lacoste and Fernández-Manjarrés2012; Stein et al., Reference Stein, Gerstner and Kreft2014), and malaria mosquitoes are no exception (Touré et al., Reference Touré, Petrarca, Traoré, Coulibaly, Maïga, Sankaré, Sow, Di Deco and Coluzzi1994). Without doubt, altitude is a major parameter affecting it because of the abiotic (temperature and humidity) as well as the biotic conditions, including the lower presence of pathogens such as Plasmodium spp., as shown in bird populations (van Rooyen et al., 2013). As global warming is significantly affecting species distribution as well as their mutual interactions, altitude can be considered as a proxy to understand its impact on the structure of populations of terrestrial insects (Hodkinson, Reference Hodkinson2005), including mosquitoes. In the case of malaria, the large increase in household ownership of long-lasting insecticidal nets (LLINs) has contributed to an important decrease in the number of malaria cases in the last decade (WHO, 2014), but at the same time, this is associated with a greater risk of the spread of resistance to pyrethroids, the sole insecticidal class used for LLIN treatment (Ranson et al., Reference Ranson, N'guessan, Lines, Moiroux, Nkuni and Corbel2011). Understanding, at a fine scale, how resistance can spread in mosquito populations is of critical importance to optimize current and future vector control. Genetic data can, not only help obtain this information, but can also provide a better understanding of the role of connectivity between populations on the dynamics of disease transmission (Donnelly et al., Reference Donnelly, Pinto, Girod, Besansky and Lehmann2004). Finally, and on a more hypothetical aspect of the control of vector-borne diseases, it is a prerequisite for any release of genetically modified mosquitoes or sterile insects aimed to control the disease at a large scale.
Along the coast of Tanzania, the major malaria vectors are Anopheles funestus and Anopheles gambiae s.s. (Magesa et al., Reference Magesa, Wilkes, Mnzava, Njunwa, Myamba, Kivuyo, Hill, Lines and Curtis1991; Temu et al., Reference Temu, Minjas, Coetzee, Hunt and Shiff1998; Mboera and Magesa, Reference Mboera and Magesa2001; Maliti et al., Reference Maliti, Ranson, Magesa, Kisinza, Mcha, Haji, Killeen and Weetman2014). Here, we present a comparative study of the population genetics of these two major vectors from the Muheza district in the north-eastern part of Tanzania, to investigate the spatial population structure of these two anopheline species. This region is a rural area known for its holoendemic transmission of malaria in the lowland area (Mboera and Magesa, Reference Mboera and Magesa2001; Alilio et al. Reference Alilio, Kitua, Njunwa, Medina, Rønn, Mhina, Msuya, Mahundi, Depinay, Whyte, Krasnik and Bygbjerg2004), and it also presents a steep ecological cline with the presence of highland areas close to the town of Muheza and in the vicinity of the Amani Nature Reserve in the Tanga Region of Tanzania, East Africa.
Materials and methods
Collection site
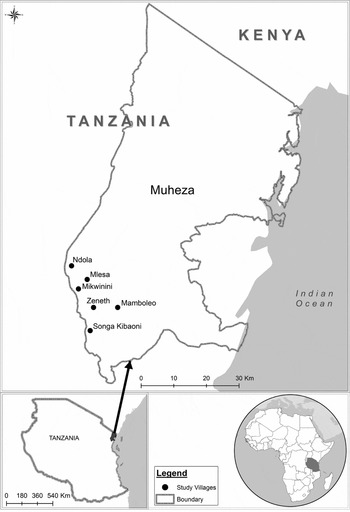
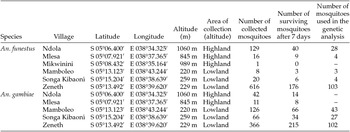
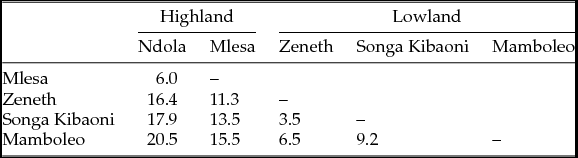
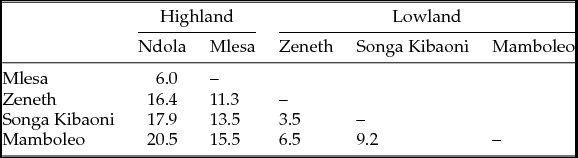
Adult mosquitoes were collected in Muheza district, Tanga Region in the north-eastern part of Tanzania. Six sites were chosen that could be organized in two clusters according to their altitudes: the lowland cluster (mean altitude = 236 m ± 11.8 m) included three villages (Mamboleo, Songa Kibaoni, Zeneth), and the highland area (mean altitude = 952 m ± 63.2 m) with three villages (Mikwinini, Mlesa, Ndola) (Fig. 1 and Table 1). Pairwise distances between villages inside each cluster ranged from 5 to 10 km (Table 2).
Map of the area where collections of malaria mosquitoes were performed.

Number of collected adult (Anopheles funestus and An. gambiae) surviving 7 days after collection and their infection status

Matrix of pairwise geographic distance amongst sampled sites. Distances are expressed in km
Mosquito sampling, species identification and oocysts collection
The collections were performed between May 2005 and August 2005 where indoor-resting blood-fed anopheline females were collected with aspirators in the morning regularly during this period, i.e. between 15 and 19 times in the lowland and the highland areas, respectively. At each visit, the same four houses were visited for 15 to 20 min in each village. Mosquitoes were brought to the insectary in Muheza, fed with a sugar solution ad libitum, and maintained for 7 days in small pots. On the seventh day after capture, midguts of the surviving mosquitoes were dissected with tweezers under a light microscope and the presence/absence of Plasmodium falciparum oocysts recorded. All the collected mosquitoes did not survive the period of 7 days in the insectary. Performing an analysis of the mortality rate neither revealed any significant differences between areas and species, nor their interactions (see Additional File 1). This reveals the absence of any bias in the mortality. Similarly, a number of mosquitoes survived the period of 7 days in the insectary, but they were untested for genotyping (conservation issues). Again the statistical analysis (see Additional File 2) revealed no significant difference between the groups, and this did not affect the survey.
Morphological identification based on the taxonomic keys for the identification of Afrotropical mosquitoes (Gillies and de Meillon, Reference Gillies and De Meillon1968; Gillies and Coetzee, Reference Gillies and Coetzee1987) was done to identify An. funestus group and An. gambiae s.l. DNA extraction from whole insects was performed using the DNeasy Blood and Tissue kit (Qiagen) according to the manufacturer's instructions and DNA concentration was measured with a Nanodrop® spectrophotometer. Identification of subspecies inside each complex was performed by polymerase chain reaction (PCR) according to a protocol based on Koekemoer et al. (Reference Koekemoer, Kamau, Hunt and Coetzee2002) within the An. funestus group and Wilkins et al. (Reference Wilkins, Howell and Benedict2006) within the An. gambiae complex. Sampling details are summarized in Table 1.
Microsatellite genotyping
A total of 142 An. funestus were genotyped using 10 microsatellite loci: AF2, AF3, AF5, AF19, AF20 (Sinkins et al., Reference Sinkins, Hackett, Costantini, Vulule, Ling, Collins and Besansky2000), FunF, FunG, FunL, FunO, FunR (Cohuet et al., Reference Cohuet, Simard, Berthomieu, Raymond, Fontenille and Weill2002). A total of 181 An. gambiae individuals were genotyped using 13 microsatellite loci: 11 loci from Zheng et al. (Reference Zheng, Benedict, Cornel, Collins and Kafatos1996) [H29, H46, H88, H131, H143, H197, H249, H555, H675, H678, H1D1 (abbreviated names from Midega et al. (Reference Midega, Muturi, Baliraine, Mbogo, Githure, Beier and Yan2010)] and two microsatellite loci from the NOS and cecropin 3′ UTR genes (Luckhart et al., Reference Luckhart, Li, Dunton, Lewis, Crampton, Ryan and Rosenberg2003), which function in the innate immune system of insects.
For each species, the forward primer of each locus was labelled with a fluorescent dye using a M13 labelled tail added to the 5′-end of the oligonucleotide (four colours: FAM, VIC, NED, PET). PCR were performed in a volume of 10 µl with 5 µl of MasterMix 2x (Applied Biosystems™; Thermo Fisher Scientific Inc., Waltham, Massachusetts, USA), 0.25 µl of each primer (10 µM) and 0.25 µl of labelled M13 tail (10 µM), 2 µl of DNA template (10 ng/µl) using the following cycling: 2 min at 95 °C; followed by 30 cycles of 30 sec at 95°C, 30 sec at 55 °C and 30 sec at 72 °C); then 5 min at 95 °C. Mixes of PCR products were then made according to amplicon size and dye, and genotyping was performed using an ABI PRISM 3730 XL DNA sequencer (Applied Biosystems™). Results were analysed with GeneMapper™ v. 4.0 software (Applied Biosystems™).
Data analyses
Estimates of linkage disequilibrium were performed using FSTAT v. 2.9.3 (Goudet, Reference Goudet1995). The presence of null alleles was assessed using micro-checker v. 2.2.3 (Van Oosterhout et al., Reference Van Oosterhout, Hutchinson, Wills and Shipley2004).
Genetic diversity of mosquito populations was assessed by the number of alleles (Na), observed heterozygosity (HO ), and expected heterozygosity (HE ) using Arlequin v. 3.5.1.2 (Excoffier et al., Reference Excoffier, Laval and Schneider2005). Tests of deviation from Hardy–Weinberg equilibrium (HWE) were performed using FSTAT v. 2.9.3 (Goudet, Reference Goudet1995).
The significance of genetic differentiation between populations based on allelic distribution across populations was examined using a Fisher exact test with FSTAT v. 2.9.3 (Goudet, Reference Goudet1995). The pairwise F ST statistic between populations was calculated after Weir and Cockerham (Reference Weir and Cockerham1984) using FSTAT v. 2.9.3 (Goudet, Reference Goudet1995) and Arlequin v. 3.5.1.2 (Excoffier et al., Reference Excoffier, Laval and Schneider2005).
For each species, without taking into account their geographic origin, An. funestus and An. gambiae individuals were clustered on the basis of their genetic relatedness using the Bayesian clustering approach implemented in structure v. 2.3.3 (Pritchard et al., Reference Pritchard, Stephens and Donnelly2000; Falush et al., Reference Falush, Stephens and Pritchard2003). Simulations were performed using the admixture and correlated frequencies model. We estimated the number K of genetic clusters (here between K = 1 and K = 4) to which the individuals should be assigned. For all simulations, we did not force the model with predefined allele frequencies for source clusters. Five independent runs were conducted to assess the consistency of the results across runs, and all runs were based on 106 iterations after a burn-in period of 105 iterations. We then identified the number of genetically homogeneous clusters as described by Evanno et al. (Reference Evanno, Regnaut and Goudet2005).
As analyses using structure are based on strong assumptions (Panmixia, no linkage disequilibrium), we performed a dissimilarity analysis calculating the Shared Allele Distance (DAS) between pairs of genotypes and drawing a neighbour-joining tree with DARwin v 5.0 (Perrier and Jacquemoud-Collet, Reference Perrier and Jacquemoud-Collet2006).
Results
Species identification
Of the 142 An. funestus individuals, all were identified as An. funestus sensu stricto following PCR identification tests. Amongst 181 An. gambiae individuals, 172 were identified as An. gambiae sensu stricto and nine as An. arabiensis. Anopheles arabiensis were excluded from further analyses.
Linkage disequilibrium and test for Hardy–Weinberg equilibrium
Due to a large number of missing data for some of the loci, which may be due to null alleles, data from seven microsatellite loci from 10 were retained for further analyses for An. funestus (AF2, AF19, AF20, FunF, FunG, FunO and FunL). Amongst 21 linkage equilibrium tests, none was significant at the 5% level after Bonferroni correction for multiple testing. As such, these seven loci were considered as independent and kept for further analyses. Because of small sampling size for some locations and low Plasmodium prevalence over the dates of collection, all individuals were pooled into two populations: ‘Highland’ (n = 32) and ‘Lowland’ (n = 110).
For An. gambiae, due to a large number of missing data for some of the loci, which may also be due to null alleles, data from seven microsatellite loci from 13 were retained for further analyses (H29, H88, H131, H249, H678, H1D, NOS). Amongst 21 linkage equilibrium tests, none was significant at the 5% level after Bonferroni correction for multiple testing. As such, these seven loci were considered as independent and kept for further analyses. Due to low Plasmodium prevalence, infected individuals were pooled with non-infected for each village. For An. gambiae, the term ‘population’ referred to individuals sampled in the same village during the time of the experiment.
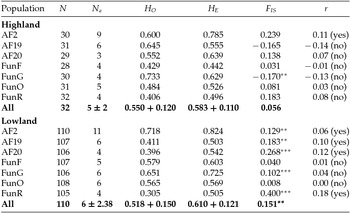
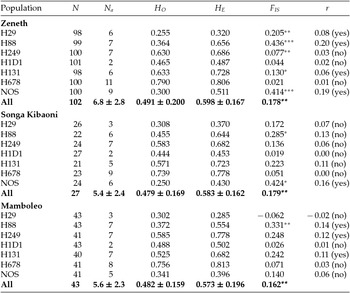
Regarding the two An. funestus populations, the highland population did not show deviation from Hardy–Weinberg equilibrium over all loci, whilst the lowland population showed a significant excess of homozygotes (FIS = 0.151**; Table 3). Additionally, the three populations of An. gambiae showed significant excess of homozygotes over all loci (FIS ranged from 0.162** to 0.179**; Table 4).
Summary statistics of Anopheles funestus populations

N: number of amplified individuals; NA : number of alleles; HO : observed heterozygosity; HE : expected heterozygosity under Hardy–Weinberg equilibrium; FIS : inbreeding coefficient. Next to the FIS is indicated the significance of the P-values for deviation to Hardy–Weinberg equilibrium: *: P<0.05; **: P<0.01; ***: P<0.001; r: Null allele frequencies (presence or absence is indicated next by yes or no).
Summary statistics of Anopheles gambiae populations

N: number of amplified individuals; NA : number of alleles; HO : observed heterozygosity; HE : expected heterozygosity under Hardy–Weinberg equilibrium; FIS : inbreeding coefficient. Next to the FIS is indicated the significance of the P-values for deviation to Hardy–Weinberg equilibrium: *: P<0.05; **: P<0.01; ***: P<0.001; r: Null allele frequencies (presence or absence is indicated next by yes or no).
Genetic diversity and population differentiation
The number of alleles per locus ranged from four (AF20) to 12 (AF2) for An. funestus and from two (H1D1) to 11 (H678) for An. gambiae (Tables 3 and 4, respectively).
Tests of genetic differentiation between populations were performed for each species. For An. funestus, the highland population was undifferentiated from the lowland population (FST = 0.012, P = 0.05; Fisher exact test not significant). Moreover, allelic richness of the highland population was not significantly different from the lowland population (permutation test, P = 0.67).
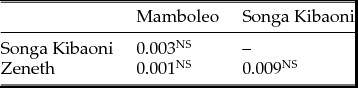
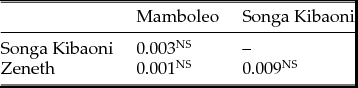
For An. gambiae, the allelic richness of the three populations was not significantly different from each other (permutation test, all P > 0.05). FST estimates were not significantly different from 0 (Table 5). Thus, no genetic differentiation was found between the three populations, nor when considering only the NOS locus implied in the immune response (FST ranged from 0.001 to 0.018, all P > 0.05).
Pairwise multilocus estimates of FST for Anopheles gambiae populations. All comparisons for Fisher exact tests were not significant at the 0.05 level
Assignment tests
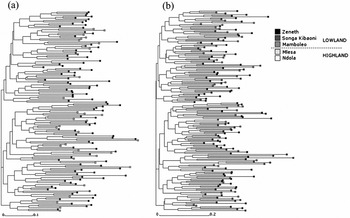
A Bayesian clustering analysis was performed using structure. For both An. funestus and An. gambiae, the clustering analysis indicated that the posterior distribution of the allele frequencies amongst clusters was best explained with a grouping into K = 1 genetic cluster (data not shown). This is confirmed by the construction of a neighbour-joining tree based on DAS between pairs of multilocus genotypes for each species. Indeed, neither different genetic clusters nor spatial clustering for both species could be observed (Fig. 2a and b).
Neighbour joining trees based on shared allele distance (DAS) for each species. (a) Anopheles funestus and (b) Anopheles gambiae.

Discussion
Low prevalence of Plasmodium
We could not perform tests to assess genetic differentiation between ‘infected’ and ‘uninfected’ individuals due to the low prevalence found, but it is interesting to note that all infected mosquitoes (10 An. gambiae and six An. funestus) were caught in the lowland, suggesting that altitude could be a structuring factor for immunity gene. We should, however, remain cautious as temperature in altitude could also preclude Plasmodium infection. This would then release the pressure favouring a stronger immune response against malaria parasites. Obviously, we have no information about a potential higher mortality in the infected mosquitoes that were collected but died before dissection 7 days after capture.
High gene flow between populations
Our results showed that the highland population of An. funestus was not genetically differentiated from the lowland population. We had hypothesized that differences, both in altitude and in ecological factors, could lead to significant genetic differentiation, but this does not appear to be true despite a steep ecological cline. This is important because it shows that altitude does not act as a strong barrier to gene flow.
Likewise, for An. gambiae, the populations were not significantly differentiated from each other in the lowland area (pairwise distances ranged from 3 to 9 km; Table 2). This is consistent with previous studies that have revealed a deme size greater than 50 km for An. gambiae (Lehmann et al., Reference Lehmann, Hawley, Kamau, Fontenille, Simard and Collins1996; Kamau et al., Reference Kamau, Lehmann, Hawley, Orago and Collins1998). The similarity between topography and climate of the different locations probably explains this lack of differentiation.
Furthermore, the high positive FIS found for both species could be explained by the presence of null alleles or by the Wahlund effect, either spatial (pool of individuals originated from different houses or different foci within houses) and/or temporal (pool of successive cohorts over a 4-month sampling period). One could suggest that we pooled partially diverging clades from An. funestus (Michel et al., Reference Michel, Guelbeogo, Grushko, Schemerhorn, Kern, Willard, Sagnon, Costantini and Besansky2005), but this hypothesis can be rejected as this should have been revealed by the Bayesian assignment tests. The hypothesis of possible local scale and/or temporal genetic heterogeneity cannot be ruled out. This is, however, not in contradiction with our result of an absence of genetic differentiation at a larger scale, as already found in other organisms (Torda et al., Reference Torda, Lundgren, Willis and van Oppen2013; Gorospe et al., Reference Gorospe and Karl2013, Reference Gorospe and Karl2015). To test for local structure, the sampling and genotyping efforts (number of individuals and number of loci) should be enhanced for the different houses and foci to allow fine-scale structuring analyses.
Nevertheless, for both An. funestus and An. gambiae, this is a major point of concern when monitoring the spread of resistance against insecticides, as well as the resistance against drugs in Plasmodium. In a more hypothetical way, such high gene flow between locations presenting different ecological conditions would facilitate the spread of a genetic mutation. The lack of ecological barriers could be an advantage in the use of genetically modified mosquitoes for malaria control (Boëte, Reference Boëte2006; Levy, Reference Levy2007; Wang and Jacobs-Lorena, Reference Wang and Jacobs-Lorena2013).
Conclusion
Our study found evidence of high gene flow between populations of malaria vectors in north-eastern Tanzania. In the case of An. funestus, the genetic structure is unaffected by altitude, at least in this part of East Africa. However, it might be a factor influencing An. gambiae distribution with a decrease of mosquito number as altitude increases. Moreover, and given the importance of the spatio-temporal dynamics of vectors in disease transmission (Chaves et al., Reference Chaves, Imanishi and Hoshi2015), there is a crucial need to understand such vector population dynamics in areas with contrasted patterns of transmission (Kamugisha, Reference Kamugisha, Maxwell and Curtis2005), to better design tailor-made solutions to control disease transmission.
Ethics
The study received ethical approval by the Tanzanian Commission for Science and Technology (COSTECH) with research permit number 2005-51-NA-2004-53 granted to C.B. All anopheline collections were undertaken following verbal consent of householders.
Supplementary material
To view supplementary material for this article, please visit http://dx.doi.org/10.1017/S1742758416000175.
Acknowledgements
We are grateful to the team of entomologists for their dedication during the fieldwork and to the villagers who kindly accepted our regular visits in their homes. We thank the GENTYANE platform (INRA, Clermont, France) for their technical support for genotyping. During this work, CB was supported by a Marie Curie Intra-European Fellowship MEIF-CT-2003-501659 at Wageningen University, the Netherlands.