Studies in autism spectrum disorder (ASD) have identified atypicalities in auditory and speech processing among individuals with ASD. Individuals with ASD exhibit enhanced perceptual performance in auditory (and visual) domains, including not only the processing of pitch (e.g., Bonnel et al., Reference Bonnel, Mottron, Peretz, Trudel, Gallun and Bonnel2003; Heaton, Davis, & Happé, Reference Heaton, Davis and Happé2008) but show deficits in processing speech signals that involve incorporating higher order information, such as categorical perception (Stewart, Petrou, & Ota Reference Stewart, Petrou and Ota2018; You, Serniclaes, Rider, & Chabane, Reference You, Serniclaes, Rider and Chabane2017) and prosody comprehension (see O’Connor Reference O’Connor2012, for review). The atypicalities in speech processing associated with individuals with ASD might be related to differences in cognitive processing styles relative to neurotypicals, in particular relating to bias for local processing, which causes either weak top-down processing (i.e., Weak Central Coherence; Happé, Reference Happé1999), highly developed low-level processing (i.e., Enhanced Perceptual Functioning; Mottron, Dawson, Soulières, Hubert, & Burack, Reference Mottron, Dawson, Soulières, Hubert and Burack2006), or a lack of flexibility in ignoring prediction errors, which leads to a focus on local processing at the expense of more abstract representations of the incoming signals (Cruys et al., Reference van de Cruys, Evers, van der Hallen, van Eylen, de-Wit and Wagemans2014).
The present study investigates the effects of ASD on the discrimination of speech signals in different phonological contexts. In particular, this study focuses on how individuals with autism integrate information regarding the potential influence of one speech sound on the realization of another, commonly referred to coarticulation or coproduction. For example, perceptual studies of coarticulated speech, such as the perception of sibilants in different vocalic contexts, have found that neurotypical listeners report hearing more instances of [s] than its postalveolar counterpart, [ʃ], in the context of [u] than in the context of [a] (Mann & Repp, Reference Mann and Bruno Repp1980; Mitterer, Reference Mitterer2006), presumably because listeners take into account the lowered noise frequencies of /s/, which renders /s/ perceptually more [ʃ]-like, in a rounded vowel context. Previous studies on perceptual compensation for coarticulatory influence in neurotypicals have identified significant individual variability in compensatory responses. Repp (Reference Repp1981), for example, suggests that there exist two different strategies of listening to fricative-vowel syllables, one auditory, which segregates the noise portion from the vocalic portion, and the other phonetic, where sibilant noise information is more integrated with the vocalic portion. More recent studies found that individual variation in perceptual compensation to be more gradient (Turnbull, Reference Turnbull2015; Yu, Reference Yu2010; Yu & Lee, Reference Yu and Lee2014).
This kind of context sensitivity in speech perception or perceptual expectation adjustment strategy, commonly referred to as perceptual compensation for coarticulation, is crucial for speech comprehension as misidentifying a speech sound in a context-appropriate manner might lead to errors in phonological and lexical retrieval, which could result in miscommunication and/or sound change (Ohala, Reference Ohala1993a, Reference Ohala and Jones1993b). Thus, to the extent that individuals with ASD have continuous or noncategorical perception of phonetic dimension as suggested by findings of a categorical perception deficit (Stewart et al., Reference Stewart, Petrou and Ota2018; You et al. Reference You, Serniclaes, Rider and Chabane2017), the between-category sound difference that separates words would be less distinct. As perceptual compensation for coarticulation has been shown to be phonologically mediated (Mitterer, Reference Mitterer2006), if individuals with ASD have difficulties discriminating category boundaries and/or integrating information from the phonological level, they are predicted to have difficulties engaging in appropriate perceptual expectation adjustments, commonly referred to as perceptual compensation or normalization. Spoken word recognition, or lexical retrieval, may then be hampered if such a listener is too focused on within-category acoustic differences at the expense of taking into account potential influence of neighboring phonological contexts on generating those differences. Thus, understanding the nature of reduced perceptual compensation for coarticulation can offer a useful window into how atypicalities in auditory or low-level phonetic perception skills interfere with the requirement of successful speech processing. That is, general difficulties with sound identification and discrimination can lead to a cascade effect on the comprehension of language at other levels, which might help explain some of the language-related problems related to ASD (Walenski, Tager-Flusberg, & Ullman, Reference Walenski, Tager-Flusberg, Ullman, Moldin and Rubenstein2006).
Methods
Participants
The ASD cohort consisted of 15 Cantonese-speaking adult males with autism with ages ranging from 18 to 33. All the participants were recruited from employment programs particularly designed for young adults who have been diagnosed with high-functioning ASD. The programs are run by two local nongovernmental organizations in Hong Kong. ASD diagnosis was based on Diagnostic and Statistical Manual of Mental Disorders, third edition (American Speech-Language Association Audiologic Assessment Panel, 1997) criteria and International Classification of Diseases, 10th revision (World Health Organization, 1990) by either a clinical psychologist or a pediatrician during their childhood. The current state of ASD was verified by the clinical judgment of the second author who is a speech-language pathologist with ASD expertise and the Autism Diagnostic Observation Schedule (Lord, Rutter, DiLavore, Graham, & Bishop, Reference Lord, Rutter, DiLavore, Risi, Gotham and Bishop2012) administered by research-reliable personnel, with a total score at or above the thresholds of autism or autism spectrum for Module 4. The hearing ability of all participants was screened with a GSI 18 screening audiometer in a sound-proofed room, with the passing criteria set at 25 dB HL at the frequencies of 1000, 2000 and 4000 Hz in both ears (American Speech-Language-Hearing Association Audiologic Assessment Panel, 1997). This study focuses only on male participants due to difficulty in recruiting female ASD participants in Hong Kong. All ASD participants received a nominal fee for their participation.
The neurotypical (NT) cohort included 20 male adults in Hong Kong and Chicago (N = 9), all native speakers of Hong Kong Cantonese, who completed this study either for course credits or for a nominal fee. Their age range was between 18 and 26 with a mean of 19.58 (SD = 1.91). None reported any language, speech, or hearing disorders nor any mental illness. The Chicago participants were all born and raised in Hong Kong and had moved to Chicago for undergraduate or graduate education within 2 years prior to the time of testing.
Stimuli and procedure
Participants performed an auditory AX discrimination task, described in Yu and Lee (Reference Yu and Lee2014), where the participants were asked to decide whether the consonants of two consonant–verb (CV) syllables were the same or different. To ensure maximal compatibility between earlier perceptual experiments and the current one, the stimuli were adopted from Yu and Lee (Reference Yu and Lee2014; https://bit.ly/2CGcJRK); readers are referred to that study for a detailed explanation on how the stimuli were created. The target stimuli were CV syllables where the C ranges perceptually from /s/ to /ʃ/ and V is either /a/ or /u/. On each trial, two CV combinations were presented with one of two interstimulus intervals (ISI): 50 ms and 750 ms. The short ISI was chosen to encourage listeners to engage in the auditory model of listening that is characterized by a highly detailed but quickly decaying trace memory; with the long ISI, listeners would presumably tap into the phonological mode of listening, using a more abstracted or categorization representation of the sounds in question (Pisoni, Reference Pisoni1973). Participants were instructed to attend to the consonant and indicate whether the two consonants were different using buttons labeled SAME and DIFFERENT (button positions were counterbalanced). Participants were told the target consonants would always sound similar and that they should respond SAME only if they hear the targets as identical. On each trial, one target consonant was followed by /u/ and the other by /a/. The target consonants were either identical (catch trials) or differed by three steps along a 10-step series (e.g., Step 1 vs. Step 4, Step 2 vs. Step 5 etc.; discrimination trials). The effect of context was tested by comparing two conditions defined by the arrangement of the targets and the accompanying vowels in each trial. In the “enhanced” condition, target consonant with high center frequency (at [s]-end of the [s]–[ʃ] continuum) were followed by the vowel /u/ and target stimuli with low center frequency (at the [ʃ]-end of the same [s]–[ʃ] continuum) were followed by the vowel /a/ (e.g., Step5/u vs. Step8/a or Step7/a vs. Step4/u). In the “diminished” condition, the opposite arrangement is used (e.g., Step8/u vs. Step5/a or Step4/a vs. Step7/u). Based on the findings reported in Yu and Lee (Reference Yu and Lee2014), the discrimination of the target pairs was expected to be more accurate (i.e., easier to detect a difference between the consonants) in the “enhanced” condition than in the “diminished” condition if the listeners were engaging in perceptual compensation for coarticulation. The within-trial order of the CV pairs was counterbalanced to yield 28 unique discrimination trials and 20 unique catch trials. Finally, the natural /da/ and /du/ syllables were paired with original /s/ and /ʃ/ to create four filler pairs with an ISI of 750 ms to enhance the alertness of the participant during the task. All 100 trials ([7 discrimination pairs × 2 conditions {enhanced vs. diminished} + 10 catch pairs] × 2 orders [/a/-final syllable first or /u/-final syllable first] × 2 ISIs [50 ms vs. 750ms] + 4 fillers) were presented in a single block and there were four repetitions of the trial block for a total of 400 trials. The order of presentation was randomized within each trial block. Participants were given a short break after two blocks.
Before the discrimination task, all participants completed a series of questionnaires online. Besides age, sex, handedness, and questions about hearing loss, speech and language disorders. and mental illnesses, participants answered questions from the Autism Spectrum Quotient (AQ; Baron-Cohen, Wheelwright, Skinner, Martin, & Clubley, Reference Baron-Cohen, Wheelwright, Skinner, Martin and Clubley2001), and two abbreviated nine-item forms of the Raven’s Standard Progressive Matrices (RSPM; Bilker et al., Reference Bilker, Hansen, Corensinger, Richard, Cur and Gur2012). The AQ items were scored on a Likert scale (1–4). A total AQ score was calculated by summing all the scores for each of the items, with a maximum score of 200 and a minimum score of 50. The AQ scale was scored in such a way that a higher score is more autistic-like, that is, lower social skills, difficulty in attention switching/strong focus of attention, high attention to detail and patterns, lower ability to communicate, and low imagination. Estimated nonverbal IQ score was assessed using the average score between the two abbreviated nine-item forms of the RSPM.
Results
The median AQ score of the NT participants was 116.5 (SD = 10.79, range = 96–142), compared to 102 (N = 55, SD = 14.5, range = 71–150) in Stewart and Ota (Reference Stewart and Ota2008) and 110.05 (N = 60, SD = 18, range = 78–155) in Yu (Reference Yu2010). Their median RSPM score is 52.50 (SD = 3.29, range = 45.41–54.87). The median AQ score of the ASD participants was 132 (SD = 21, range = 89–168) and the median RSPM score was 52.64 (SD = 11.72, range = 17.3–54.86). A series of Mann–Whitney-Wilcoxon tests showed that the two cohorts do not differ in RSPM scores (Mann–Whitney U = 141, p = .97), while their difference in AQ scores was marginally significant (Mann–Whitney U = 207, p = .059). The age difference between the two cohorts is significantly different (Mann–Whitney U = 254, p = .001). However, comparisons between regression models with and without Age as a predictor did not improve model-likelihood significantly; Age was therefore not included in the following analysis.
Following Stephens and Holt (Reference Stephens and Holt2003) and Yu and Lee (Reference Yu and Lee2014), response accuracy for the stimulus pairs was modeled using a series of logistic mixed-effects regressions fitted in R, using the lmer() function from the lme4 package. Responses made prior to the end of the second sibilant presentation (7% of the trials) were excluded in the regression analysis. The regression model includes the following predictors: Trial order (1–400), ISI (50 ms vs. 750 ms), Condition (catch vs. enhanced vs. diminished), and Cohort (ASDs vs. Neurotypicals [NT]), as well as two-way interactions between ISI and Condition and between Condition and Cohort. Neither the two-way interaction between ISI and Cohort nor the three-way interaction between ISI, Condition, and Cohort were significant using likelihood ratio tests comparing between models with and without the particular interaction. Continuous variables were centered and scaled, and binary categorical variables were sum-coded. The Condition variable was Helmert-coded to allow for comparison between the catch trials and the average of the two discrimination trials (Contrast 1) and between the enhanced and diminished discrimination trials (Contrast 2). By-subject random slopes were also included for Trial, ISI, and Condition, as well as the interaction of ISI and Condition to allow for by-subject variability in the effect of each variable on discrimination accuracy. The model formula in lme4 style was: Accuracy ∼ Trial + Age + Condition × (ISI + Cohort) + (1 + Trial + ISI × Condition|subject).
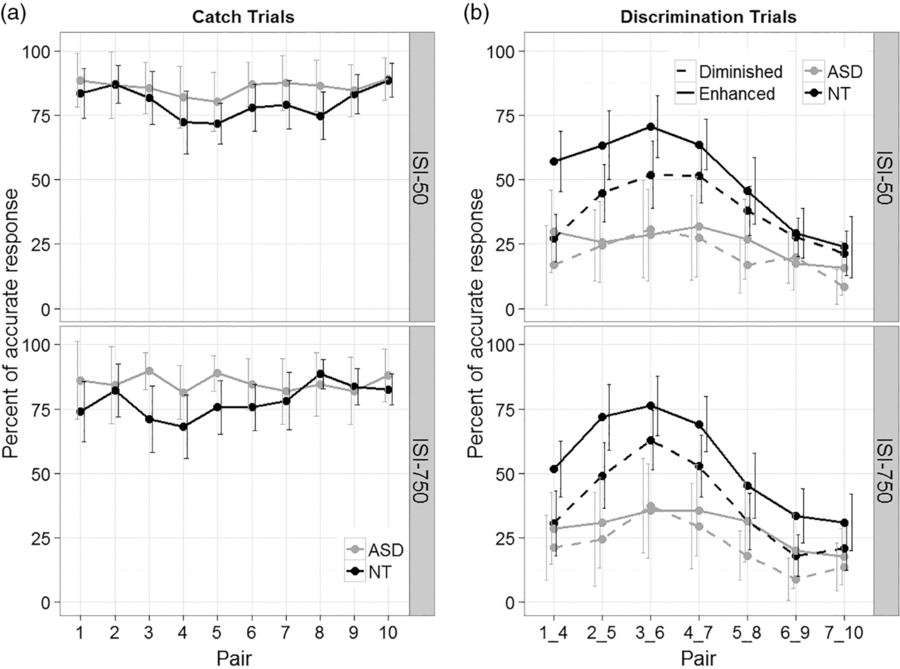
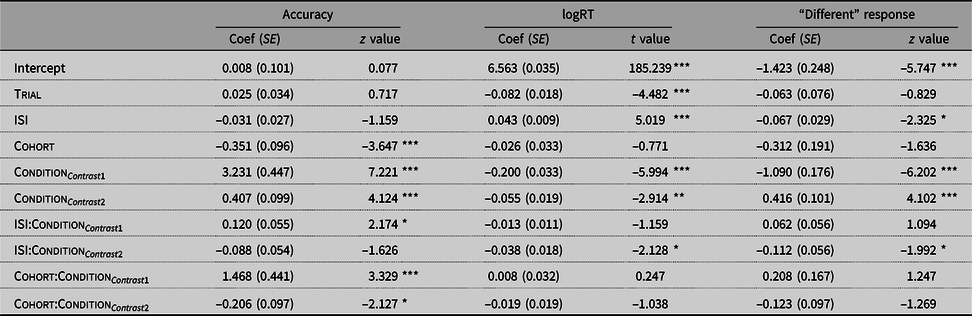
A summary of the accuracy responses across conditions is given in Figure 1. Table 1 summarizes the regression model for response accuracy for all trials. There are main effects of Condition. Accuracy is significantly higher for the catch trials than the discrimination trials (β = 3.23, z = 7.22, p < .001). This suggests that the participants can make relatively accurate discrimination when the sibilants are identical, but when the sibilants are different, but sufficiently close perceptually to each other, mistakes are frequent. Accuracy is significantly higher for the enhanced trials than the diminished trials (β = 0.41, z = 4.12, p < .001). This finding indicates that, as a group, participants exhibit response patterns that are consistent with knowledge of the influence of neighboring phonological contexts on sibilant realization. There is a significant interaction between ISI and Condition Contrast1, indicating that the accuracy difference between the catch trials and the discrimination trials is larger when the ISI is short (β = 0.12, z = 2.17, p < .05). In particular, response accuracy is higher for the catch trials and lower for the discrimination trials when listeners must rely more on auditory processing (i.e., shorter ISI).
Mean accuracy (a) across catch pairs and (b) across “enhanced” and “diminished” pairs. The error bars indicate 95% confidence intervals.

Summary of regression models for response accuracy, log-transformed reaction time (logRT), and “different” response for all trials

Note: For the Condition variable, Contrast 1 compares the catch trials with the discrimination trials while Contrast 2 compares the “enhanced” trials with the “diminished” trials. With respect to the linear regression model results for logRT, p values were obtained using normal approximation, which has the assumption that the t distribution converges to the z distribution as degrees of freedom increase (see Mirman, Reference Mirman2014, for details). *p < .05. **p < .01. ***p < .001.
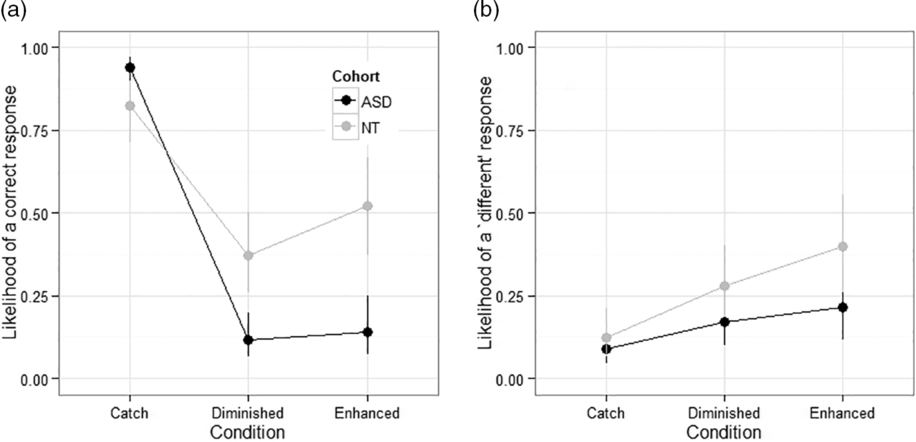
There is a main effect of Cohort (β = –0.35, z = –3.65, p < .001), indicating that the ASD cohort are generally less accurate compared to the NT cohort. But crucially this cohort difference is mediated by stimulus pair conditions. The model predictions for the interaction between Cohort and Condition are illustrated in Figure 2a. Relative to the NT cohort, the ASD cohort shows a larger accuracy difference between the catch trials and the discrimination trials (β = 1.47, z = 3.33 p < .001). In particular, the ASD cohort is more accurate during the catch trials and less accurate during the discrimination trials. In terms of the difference between the enhanced and diminished conditions, there is also a significant difference between the ASD and NT cohorts (β = –0.21, z = –2.13, p < .05). While the NT cohort exhibits a sizable difference in discrimination accuracy between the enhanced and diminished conditions, the ASD cohort did not.
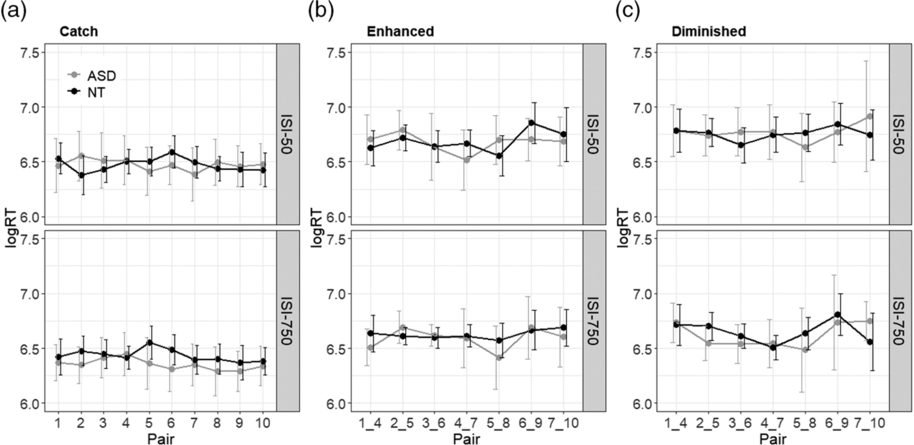
Mean log reaction time across cohorts and trial conditions. The error bars indicate 95% confidence intervals.

A summary of the (log-transformed) reaction time for the accurate trials is given in Figure 2. The (log-transformed) reaction time for the accurate trials was also analyzed in terms of a linear regression model using the same model structure as the accuracy analysis; the regression model results are summarized in Table 1. There is a significant effect of trial order (β = –0.08, z = –4.48, p < .001), suggesting that participants responded faster as the experiment progressed. ISI is significant (β = 0.04, z = 5.02, p < .001), indicating that the participants took longer to respond to the trials with short ISI than trials with long ISI. There were also significant effects of Condition. The participants were faster at responding to the catch trials than the discrimination trials (β = –0.20, z = –5.99, p < .001). Among the discrimination trials, participants were faster with the enhanced trials than the diminished trials (β = –0.06, z = –2.91, p < .01). Crucially, the effects of Cohort and its interaction with Condition were not significant, suggesting that the NT and ASD participants patterned similarly in their processing of the stimuli, at least in terms of their reaction time relative to the different trial conditions.
The fact that the ASD cohort is more accurate during the catch trials and less accurate during the discrimination trials might be due to a response bias (e.g., if the ASD cohort were biased toward giving “same” responses). To examine potential biases in response patterns, a follow-up analysis on the rate of “different” response was conducted. The model structure was otherwise the same as that of the regression model for accuracy above. The regression model results are summarized in Table 1. There was a significant effect of ISI (β = –0.07, z = –2.33, p < .05), suggesting that participants were less likely to respond DIFFERENT and more likely to respond same when the ISI was short compared to when it was long. There were also significant effects of Condition. As expected, there was a significant difference in DIFFERENT response between the catch trials and the discrimination trials (β = –1.09, z = –6.20, p < .001); a DIFFERENT response is less likely among the catch trials. The rate of DIFFERENT response is significantly higher in the enhanced condition than in the diminished one among the discrimination trials (β = 0.42, z = 4.1, p < .001). There was also a significant interaction between ISI and Condition Contrast2 (β = –0.11, z = –1.99, p < .05); the difference in DIFFERENT response rate between ISI conditions is larger in the enhanced condition than in the diminished condition. Unlike in the accuracy results, however, there was not a significant effect of Cohort nor a significant interaction between Cohort and Condition, suggesting that there was not a general bias toward one response by a particular cohort. As illustrated in Figure 3, the model predictions for the interaction between Cohort and Condition in the accuracy model (Figure 3a) and in the “different” response model (Figure 3b) show that the significant interaction between Cohort and Condition in the accuracy model is likely due to the larger difference in accuracy rate between the catch trials and the discrimination trials (i.e., the enhanced and diminished conditions) among the ASD cohort relative to the NT cohort. The cohort differences in the likelihood of a DIFFERENT response across the “catch” and “discrimination” conditions are much smaller.
Model predictions for the interaction between Cohort and Condition in the regression models for (a) response accuracy and (b) “different” responses. The error bars indicate 95% confidence intervals.

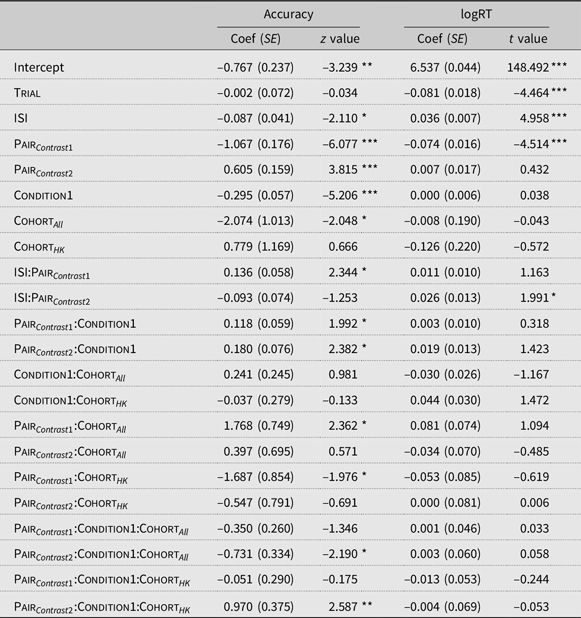
An examination of the accuracy rates among the discrimination trials in Figure 1 suggests that the accuracy rates differ across stimulus pairs. To further explore the differences in compensatory response between the ASD and NT cohorts, the accuracy of the responses to the discrimination trials was modeled separately in order to allow the incorporation of pair types in the analysis. It is worth noting that because a “different” response is also the accurate response in the case of the discrimination trials, an analysis of the accuracy here is also an analysis of the DIFFERENT response. In addition, the NT cohort was subdivided by the location of where the experiment took place to allow for the examination of potential language exposure effects; even though all participants have at least some familiarity with English, the NT participants in the United States who were living in an English-speaking environment might nonetheless exhibit different perceptual compensatory responses to the sibilant continua than NT participants in Hong Kong on account of the higher rate of exposure to English in Chicago. The Cohort variable was contrast-coded to allow for comparison between the ASD cohort with the NT cohort as a whole, as in the earlier models (Contrast 1) and between the ASD cohort and the NT cohort in Hong Kong in particular (Contrast 2). To reduce model complexity, the Pair variable was reduced to three levels. That is, Level 1 consists of pairs 1_4 and 2_5 (see, e.g., the left two pairs on the x-axis in Figure 1b), while Level 2 is made up of pairs 3_6 and 4_7, where the target sibilants came from the most ambiguous region of the [s]–[ʃ] continuum. Level 3 consists of the remainder of the discrimination pairs, which are all toward the [ʃ]-end of the sibilant continuum: 5_8, 6_9, and 7_10. The Pair variable was reverse Helmert-coded such that the first contrast compares Level 3 to the average of Levels 1 and 2, while the second contrast compares between Levels 1 and 2. The model structure was otherwise very similar to the regression model for accuracy above. The model formula was Accuracy ∼ Trial+ISI × Pair + Pair × Condition × Cohort + (1+Trial + ISI + Pair + Condition|Subject).
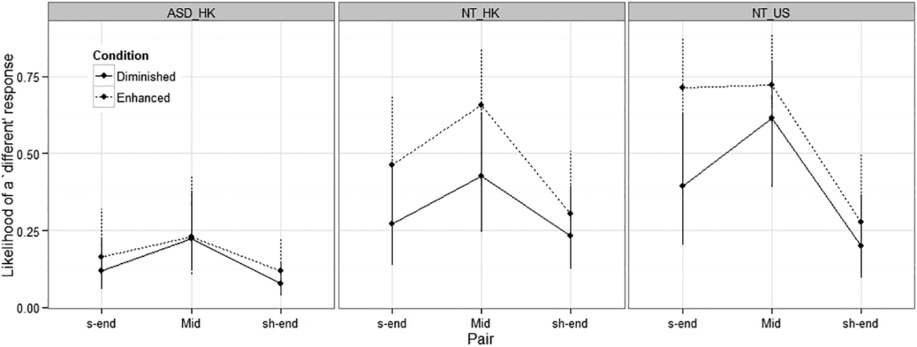
Table 2 summarizes the regression model for response accuracy among the discrimination trials. Besides the main effects of ISI, Condition, and Cohort, all replicated patterns already discussed in the first regression analysis, there was also a significant main effect of Pair, indicating that response accuracy is higher toward the [s]-end of the continuum (Pair Contrast1: β = –1.07, z = –6.08, p < .001) and highest toward the middle of the continuum (Pair Contrast2: β = 0.61, z = 3.82, p < .001). This finding is consistent with previous studies on categorical perception (e.g., Liberman, Harris, Hoffman, & Griffith, Reference Liberman, Harris, Hoffman and Griffith1957), which show that listeners are more sensitive at discriminating across-boundary differences than within-boundary ones (i.e., the so-called discrimination peak). The interaction between ISI and Pair Contrast1 is significant (β = 0.14, z = 2.34, p < .05), indicating that the accuracy difference associated with the different ISIs is smaller in the middle than toward the /ʃ/-end of the continuum. While no significant interaction between Cohort and Condition was found, there were significant three-way interactions between Pair, Condition, and Cohort. The model predictions for the three-way interactions are shown in Figure 4. While the heightened discrimination response in the middle of the continuum is stronger among the NT cohort than the ASD cohort, the NT cohort from Hong Kong shows a larger difference in response accuracy between the enhanced and diminished conditions (Pair contrast2:Condition:Cohort HK β = 0.97, z = 2.59, p = .01), relative to the entire NT cohort (Pair contrast2:Condition:Cohort all β = –0.73, z = –2.19, p = .05), suggesting that the NT cohort in Hong Kong exhibits a larger compensatory enhancement effect at the discrimination boundary relative to the ASD cohort; the enhancement effect at the discrimination boundary is smaller when the entire NT cohort is considered on account of the fact that discrimination accuracy difference between the enhanced and diminished trials are small among the Chicago-based NT cohort.
Summary of regression models for response accuracy and log-transformed reaction time (logRT) of the “discrimination” trials

Note: With respect to the linear regression model results for logRT, p-values were obtained using normal approximation which has the assumption that the t distribution converges to the z distribution as degrees of freedom increase. *p < .05. **p < .01. ***p < .001.
Model predictions for the likelihood of a “different”/accurate response across pairs in the enhanced and diminished conditions by the different cohorts. The error bars indicate 95% confidence intervals. The pairs from the [s]-end include pairs 1_4 and 2_5; the middle pairs include 3_6 and 4_7, the rest are from the [ʃ]-end.

Table 2 summarizes the regression model for participants’ log-transformed reaction time for the correct responses in the “discrimination” trials. The analysis of the log-transformed reaction time found no significant cohort related effects, suggesting that the observed accuracy differences reviewed above is not likely to be attributable simply to differences in processing patterns between cohorts.
Discussion
In general, participants tended to be more accurate in sibilant discrimination when the target sibilants were embedded in vocalic environments that maximize perceptual distinctiveness (i.e., discrimination pairs where /u/ is preceded by a target sibilant drawn from the [s]-end of the continuum while /a/ is preceded by a sibilant drawn from the [ʃ]-end of the continuum), if the listener engages in context-appropriate expectation adjustment. Accuracy rates suffered when the vocalic arrangement was in a diminished distinctiveness configuration (i.e., discrimination pairs where /a/ is preceded by a target sibilant drawn from the [s]-end of the continuum while /u/ is preceded by a sibilant drawn from the [ʃ]-end of the continuum). Crucially, the ASD and NT cohorts exhibited different compensatory response patterns. In particular, while the NT cohort showed a clear difference in discrimination accuracy across enhanced and diminished trials (i.e., perceptual compensation), the ASD cohort exhibited little differences, if at all. This reduction in the enhanced/diminished context effects in discrimination, which suggests that the ASD cohort does not benefit from the enhancement effects of the vocalic contexts, is consistent with the prediction of the weak central coherence theory of ASD (Happé, Reference Happé1999), to the extent that individuals with ASD are supposed to have difficulties integrating higher order information, such as the categorical phonological identity of the neighboring sounds, in cognitive processing. These findings echo recent studies that found NTs exhibiting different degrees of autistic-like traits also vary in their context-dependent speech processing behavior. Stewart and Ota (Reference Stewart and Ota2008), for example, found that an individual’s AQ (Baron-Cohen et al., Reference Baron-Cohen, Wheelwright, Skinner, Martin and Clubley2001) score negatively correlates with the extent of identification shift associated with the Ganong effect (i.e., the bias in categorization in the direction of a known word), after controlling for individual differences in auditory sensitivity, lexical access latency, and verbal IQ. Such a correlation is also observed in children’s speech processing (Ota, Stewart, Oatrou, & Dickie, Reference Ota, Stewart, Petrou and Dickie2015). Echoing the findings of these studies, which focus on the influence of lexical knowledge (a type of contextual information) on speech perception among individuals with different degree of autistic-like traits, our findings suggest that individuals with ASD might be less affected by lexical knowledge in their speech perception, possibly due to their heightened sensitivity to acoustic differences and difficulties in integrating information from different levels of representation.
Our findings are also consistent with the idea that the ASD cohort is inflexible in ignoring prediction errors, focusing instead on local processing at the expense of more abstract representations of the incoming signals. In particular, given that in order to engage in context-appropriate expectation adjustment, a listener must either allow an early categorization decision to be revised in light of new information or engage in a buffered processing strategy where sound category identification is postponed until the following phonological information becomes available. From this perspective, individuals with ASD might employ a more stringent cascade processing strategy and might not be so flexible to revising their perceptual expectation once the vocalic information becomes available. The present findings are not consistent with the enhanced perceptual processing theory of ASD (e.g., Mottron et al., Reference Mottron, Dawson, Soulières, Hubert and Burack2006), as the theory predicts enhanced perceptual discrimination which was not seen in the current study; the response patterns observed suggest that the ASD cohort had impaired discrimination across conditions.
To the extent that shorter ISI encourages phonetic (i.e., not language specific) processing, it is noteworthy that the difference in accuracy rates across the catch and discrimination trials varies depending on the duration of the ISI. The accuracy rate is higher in the discrimination trials when the ISI is long, suggesting that discrimination enhancement effect of perceptual compensation benefits from longer processing time. This finding is consistent with the idea that perceptual compensation for coarticulation might require phonological mediation. However, the fact that an enhancement/diminished difference in accuracy is observed even when ISI is very short suggests that perceptual compensation is either not entirely dependent on phonological information or that phonological information is relevant to speech processing even at the very early stages. Our findings suggest that coarticulatory information reaches down to early perceptual processing stages (Sjerps, Mitterer, and McQueen Reference Sjerps, Mitterer and McQueen2011). Future neurophysiological investigations might offer better time-course information regarding the influence of coarticulatory information on speech sound representations at early stages.
As noted above, we had chosen to employ the stimuli used in Yu and Lee (Reference Yu and Lee2014) to ensure maximal compatibility between earlier perceptual experiments and the current one. However, this methodological choice created a potential complication for the interpretation of the results. Unlike English, which contrasts /s/ with /ʃ/, [ʃ] and [s] are allophones in Cantonese (i.e., [s] and [ʃ] do not occur in the same environment). In particular, Cantonese /s/ is more [ʃ]-like before rounded vowels and females are more likely to exhibit this allophony than males (Yu, Reference Yu2016). Thus, requiring native Cantonese speakers to discriminate nonnative sounds from English might introduce unintended second language interference. Several factors mediate the severity of this complication. Previous studies have found that listeners are able to engage in perceptual compensation in the appropriate contexts even if the stimuli contain nonnative contrasts. Mann (Reference Mann1986), for example, reports that a group of Japanese listeners who could not identify [l] and [ɹ] accurately nonetheless showed compensation for their coarticulatory effects (see also Viswanathan, Magnuson, & Fowler, Reference Viswanathan, Magnuson and Fowler2010). Furthermore, the perceptual task was designed specifically to not require the listeners to engage in category identification of the target sounds, so the fact that [ʃ] is not a phoneme in Cantonese should have minimal impact on the participants’ completion of the task. Finally, the fact that the perceptual responses of the Cantonese-speaking NT cohort, especially the NT cohort in Hong Kong, are consistent with the findings reported in Yu and Lee (Reference Yu and Lee2014) suggests that the fact that the stimuli contain nonnative contrasts is not a problem for our Cantonese-speaking participants in general.
The fact that the discrimination accuracy of the ASD cohort is very low overall raises questions about the possibility that the difficulty of the task itself is obscuring the ability to detect compensation for coarticulation among this population. Two factors mitigate this concern. First, as the reaction time analyses suggested, there is no significant response time difference between the ASD and NT cohorts. These findings are consistent with the interpretation that the ASD cohort was not reacting to the stimuli and the task differently from the NT cohort in terms of how much time they need to make a response decision. Second, the accuracy level of the NT-HK cohort to the stimuli in the diminished condition is not that different from that of the ASD cohort overall, suggesting that the task was difficult even for the NT cohort when the target segments were not in perceptual enhancing environments. The fact that the NT-HK cohort nonetheless shows a heightened accuracy level in the enhanced condition is consistent with the idea that the ASD cohort did not take advantage of the enhancing effects of the contextual cues.
The findings of a reduced perceptual compensatory response among the ASD cohort raises questions regarding the nature of coarticulation in speech production. Individuals with ASD are often characterized as having atypical prosody in production. Prosodic atypicalities might be related to atypicalities in the degree of coarticulation in production. As the magnitude of phonological-context-dependent perceptual expectation adjustment has been shown to be positively correlated with degree of coarticulatory influence in speech production (Yu, Reference Yu2019), the findings of this study point to a potential reduction of coarticulation in the sibilant-vowel production among individuals with ASD. From this perspective, it is worth noting that Yu (Reference Yu2016) recently reported that Cantonese-speaking neurotypicals exhibiting different degree of autistic-like traits, as measured by the AQ (Baron-Cohen et al. Reference Baron-Cohen, Wheelwright, Skinner, Martin and Clubley2001), also vary in the magnitude of sibilant-vowel coarticulation they produce. In particular, individuals with higher AQ (i.e., more autistic-like traits) exhibit less sibilant-vowel coarticulation. Further studies are needed to determine whether such a reduction effect in coarticulation is observed among Cantonese-speaking individuals with ASD as well.
Acknowledgments
This research was partly supported by National Science Foundation Grants BCS-0949754 and BCS-1827409. Many thanks to the anonymous reviewers and the handling associate editor for their valuable comments and suggestions. Naturally, any errors in this work are our own.