


1. Introduction
Most of the world's coastlines are eroding, and typical erosion rates for soft coastlines vary from 0.3 m to 1.0 m per year (Pilkey & Cooper, Reference Pilkey and Cooper2004). The drivers of coastal erosion are complex and include large magnitude events (large swells, tsunamis and storms), sea level rise, sediment scarcity, human activities and antecedent conditions. All of these factors vary in time and space and may interact via feedback relationships. Understanding the role of specific drivers of coastal erosion is, however, important in the global context of climate change. Storms (particularly hurricanes) are often cited as important drivers of coastal erosion (e.g. Dolan & Hayden, Reference Dolan and Hayden1981), as surges associated with low pressure systems cause water levels to be especially elevated and enable waves to reach back-beach areas.
Many of the world's open ocean coasts experience large swells generated by distant storms in addition to storm waves. These differ from storms in that the waves tend to be larger, of longer period and are not always accompanied by a tidal surge. Storm frequency, size and duration can be related to local synoptic, regional and global drivers. For example, the effects of El Niño on storms have been noted in California (Ruggiero et al. Reference Ruggiero, Komar, McDougal, Marra and Beach2001; Allan & Komar, Reference Allan and Komar2002; Sallenger et al. Reference Sallenger, Krabill, Brock, Swift, Manizade and Stockdon2002; Bromirski et al. Reference Bromirski, Flick, Cayan and Graham2004) and in Australia (Phinn & Hastings, Reference Phinn and Hastings1995; Hemer et al. Reference Hemer, McInnes, Church, O'Grady and Hunter2008).
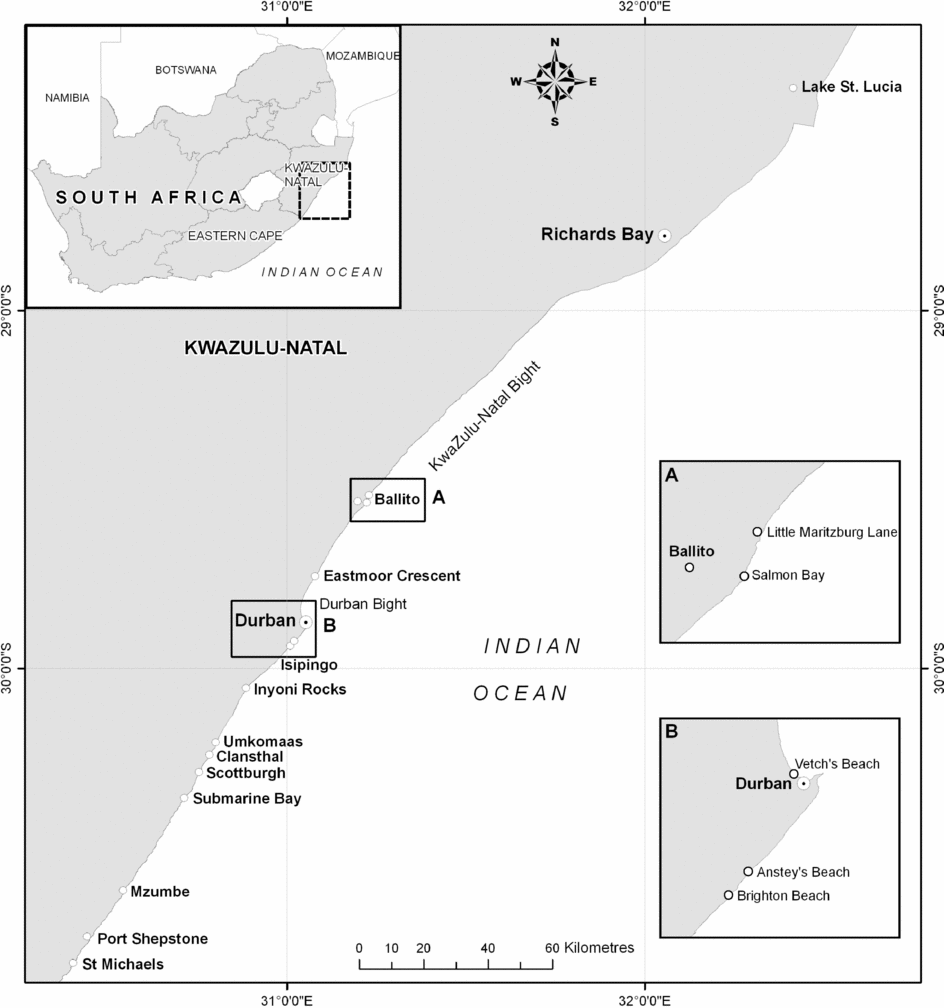
During the period 2006–2007 a number of large swell events occurred on the KwaZulu-Natal Coast (KZN) coast of South Africa (Fig. 1). Several of these swells coincided with spring and equinox tides and resulted in shoreline recession. The most dramatic effects were associated with a large swell on the March equinox (18th–20th), which had an 8.5 m significant shallow water wave height (Hs) and a maximum swell height of 14 m (Hmax) (M. Rossouw, CSIR, pers. comm.). The temporal and spatial patterns of coastal response to this and other swell events were highly variable.
Location map.
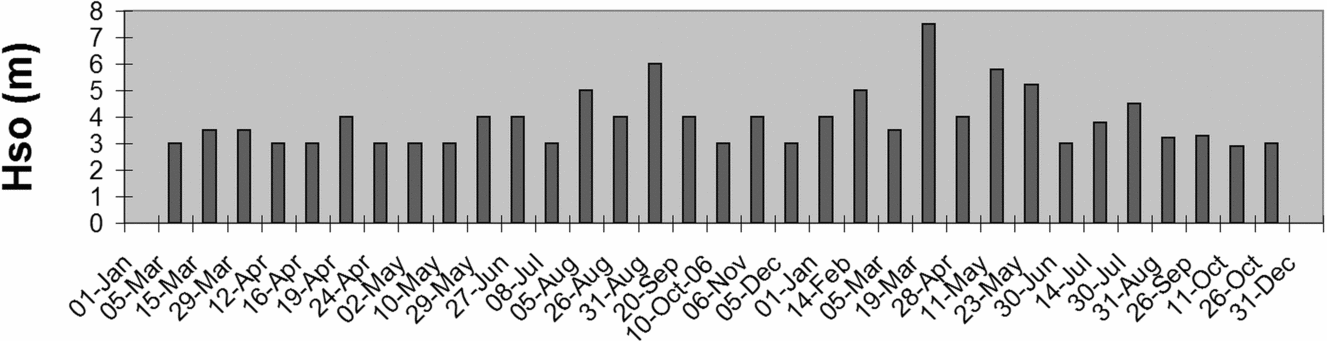
We describe the morphodynamics of a series of swell events with attention to water levels, wave heights and erosion patterns revealed by a combination of visual observations, in most cases, and field measurements (Fig. 2). The aim of this paper is to document the impacts of the 2006–2007 Erosion Event on the KZN coast of South Africa (Fig. 1). The swell that struck on the March equinox was particularly damaging but this cannot be seen in isolation, and observations made before, during and after this event provide insights into the overall coastal morphodynamics. Unless otherwise stated, the highest significant offshore swell (Ho) values were obtained from satellite altimetry (http://las.aviso.oceanobs.com/las/servlets/dataset?catitem=2) for the centre of the KwaZulu-Natal Bight (Fig. 1). Tidal data were obtained directly from the Hydrographer SA Navy. Coastal elevations are given according to Chart Datum (CD), which for the Durban area is mean sea level (msl), plus 0.9 m.
Significant 2006–2007 swell events (Hso > 3 m) for the KwaZulu-Natal Bight area.
2. Physical setting
The KZN coastline is generally eroding in the long-term (Cooper, Reference Cooper1991a,Reference Cooperb, Reference Cooper1994) at rates comparable with global values. This ongoing coastal erosion is attributed to various global and regional factors, including coastal and terrestrial land use changes, river sand mining and dam construction (Garland & Moleko, Reference Garland and Moleko2000). In many places coastal development has been allowed on the primary dunes and even in some instances, on the back-beach, closing off this natural source of sand.
KZN has a high-energy coastline with coarse-grained, sandy reflective to intermediate beaches (Cooper, Reference Cooper1991a). On the intermediate beaches that characterize the study area, the nearshore zone is typified by semi-continuous, shore-parallel nearshore bars. Swell data from the South African Data Centre for Oceanography, compiled from voluntary observation ships, for the area 29–30° S and 31–33° E, indicate that this coast is dominated (40 % of the year) by large amplitude southerly swells (Begg, Reference Begg1978; Rossouw, Reference Rossouw1984), mostly generated by eastward moving cold fronts with low pressure centres passing to the south of southern Africa. Large swells (Hmax = 8 –10 m and periods of 11–17 s) are commonly recorded during mid-winter storms in the KwaZulu-Natal Bight (Ematek, 1992). Swells associated with such storms generally approach from the south and southwest (Hydrographic Research Unit, 1968), but once on the shallower continental shelf (< 100 m deep) are refracted and make landfall from a more SSE direction. The KZN coast is also impacted by easterly to SE swells associated with tropical cyclones (hurricanes) and cut-off low (COL) storms. Although less frequent in occurrence, tropical cyclones have been responsible for damaging large swells; for example, Tropical Storm Imboa (February, 1984) produced 9 m (Hs) swells in the Richards Bay area (M. Rossouw, CSIR, pers. comm.). An example of a swell associated with a COL was that which struck on the March equinox (2007). Moes & Rossouw (Reference Moes and Rossouw2008) have indicated an average Hs of 1.8 m for Durban, diminishing northward to 1.5 m at Richards Bay (Fig. 1). Durban and Richards Bay have average spring tidal ranges of 1.8 and 1.84 m, respectively, with maximum tidal heights of 2.3 and 2.47 m, respectively.
The KZN coast comprises a number of headland-bound bays containing sandy beaches (Cooper Reference Cooper1991a,Reference Cooperb, Reference Cooper1994), some of which form barriers across river mouths (Cooper, Reference Cooper2001). Beach rotation (see Short, Reference Short and Smith2002) is a feature of the headland-bound bays. A continuous sand beach in the form of a 20 km long zeta bay extends through the Durban Bight (Fig. 1). Most of the beaches are backed by steep coastal dunes, although some are backed by rock outcrop. Dunes commonly reach heights of 30–60 m, and are often compound features, varying in age from Late Pleistocene to Holocene (Tinley, Reference Tinley1971). Coastal development, especially over the last fifteen years, has covered large parts of the coastal dune cordon and any bare sand patches have been planted and stabilized, often with alien vegetation.
3. Tidal-driven erosion events of 2006
A number of large swell (Hs > 3 m) events occurred during 2006. Three of these were associated with the equinoctial and lunar nodal cycle (LNC) peaks. Erosion associated with such events was confined to isolated sandy coastal stretches along the KwaZulu-Natal coastline (Richard's Bay, Salmon Bay, Eastmoor Crescent & Vetch's Beach, Submarine Bay and St Michaels-On-Sea; Fig. 1). These locations are erosion hotspots (EHS), as described elsewhere (List, Farris & Sullivan, Reference List, Farris and Sullivan2003; McNinch, Reference McNinch2004), that respond readily to large wave events. One of the best observed examples is the highly reflective Eastmoor Crescent Beach, Durban, which is located at the north end of a log-spiral bay (Fig. 1). Gardens of houses built in the dunes were undercut and infrastructure was threatened as the high water line (HWL) receded by 30 m during the equinoctial and LNC erosion events in 2006. This erosion was primarily tide-driven, but the occurrence of large swells, during or prior to these high tides, played a role (Table 1).
2006 erosion episodes at Eastmoor Crescent, Durban
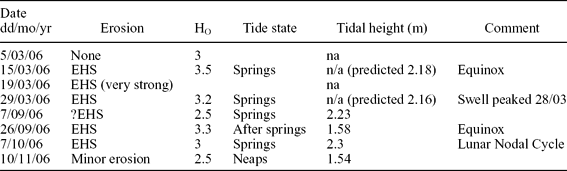
EHS – erosion hotspots
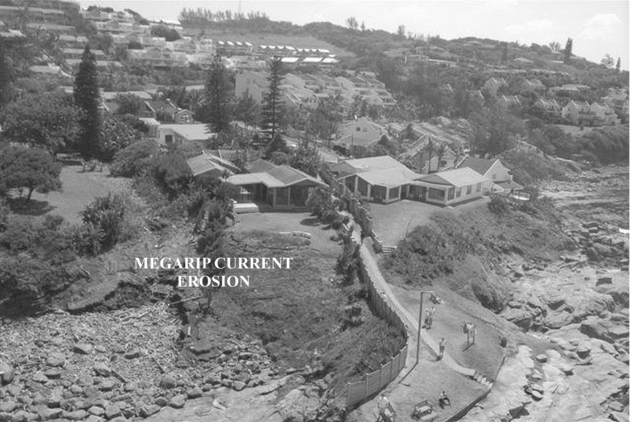
Erosion during 2006 was caused by the development of a megarip (see Short, Reference Short1999) which formed a cusp 60–100 m wide. Shoreward head-cutting megarip currents caused the formation of a steep erosion sand scarp. This beach is normally typified by symmetrical longshore sandwaves (see Thevenot & Kraus, Reference Thevenot and Kraus1995) with wavelengths of ± 300 m. One such sandwave grew larger, asymmetrical and mobile, EHS activity took place in the trough that preceded it, and it moved progressively northward, driven by the northerly longshore drift.
4. Decaying cyclone swell erosion morphodynamics
Oceanographic conditions in early 2007, prior to the March ’07 event, were dominated by swells (Hso = 2 to 5.5 m; see Table 2) produced by decaying tropical cyclones (hurricanes). Two late-season Indian Ocean tropical cyclones (Favio and Gamede) moved west towards Madagascar, and then turned south, weakening into extra-tropical lows as they did so. Both were blocked by high pressure systems, remained stationary and generated sizeable swell that persisted for several days, pounding the KZN coastline. Swell from ex-tropical cyclone Favio peaked four days before spring tides, while that from ex-tropical cyclone Gamede coincided with a spring-high tide (Table 2). These events activated some EHS and opened isolated estuaries, notably that of Lake St Lucia which had been closed for five years prior to this (Zaloumis, Reference Zaloumis2007).
Decaying cyclonic swells that preceded the March (2007) swell

5. March 2007 swell morphodynamics
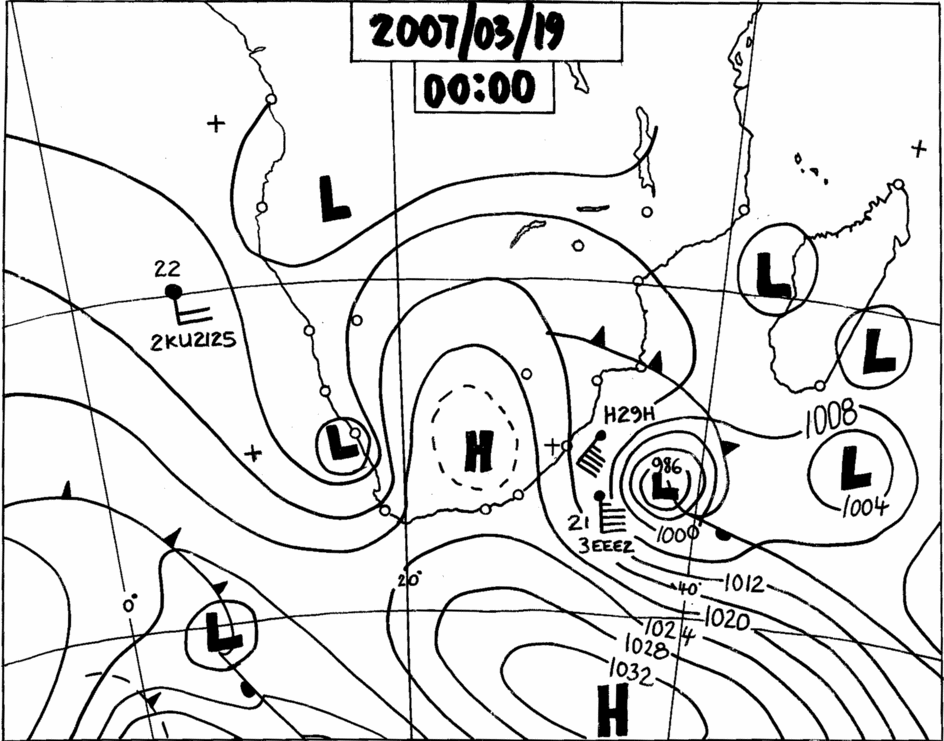
The March 2007 swell was generated by an intense cut-off low (COL) pressure system (Fig. 3; Table 3), which remained semi-stationary some 500–700 km southeast of the KZN coastline, between the 18th and 20th March 2007. The swell peaked early on 19th March; data from the Richards Bay (Fig. 1) wave rider buoy gave an Hmax of 14 m and an Hs of 8.5 m, a period of 16 seconds and a southeasterly direction (Rossouw, pers. comm). The swell peak struck twenty-four hours before the equinox (Smith et al. Reference Smith, Guastella, Bundy and Mather2007; Guastella & Rossouw, Reference Guastella and Rossouw2009), which was boosted by a storm surge (Table 3).
Synoptic chart showing the Cut-Off Low weather system responsible for the storm that produce the large swell on March ’07 swell (source: South African Weather Service).
Data from the March (2007) swell, measured at Durban
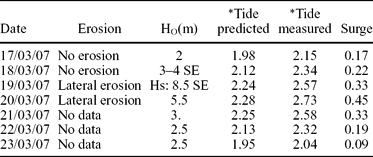
*Note all tidal heights are CD.
The March ’07 swell impact, boosted by the unusually high spring tides and storm surge, resulted in the inundation of coastal areas that seldom experience it and caused widespread coastal erosion from southern Mozambique (Smith et al. Reference Smith, Guastella, Bundy and Mather2007) to the Eastern Cape (Anderson & Mead, Reference Anderson and Mead2009). Hinterland penetration was generally low due to the steep nature of the coastline; however, seawater surged 2 km into the Richards Bay Harbour. Estuary barriers were overwashed and washover fans 100–300 m wide created, comparable to a weak category 3 Caribbean hurricane (Morton & Sallenger, Reference Morton and Sallenger2003). Offshore the nearshore (surf) bars were destroyed and sediment moved beyond the depth of closure. Dunes, beach, nearshore and inner-shelf sands were eroded.
5.a. March 2007 swell impacts
5.a.1. Richards Bay
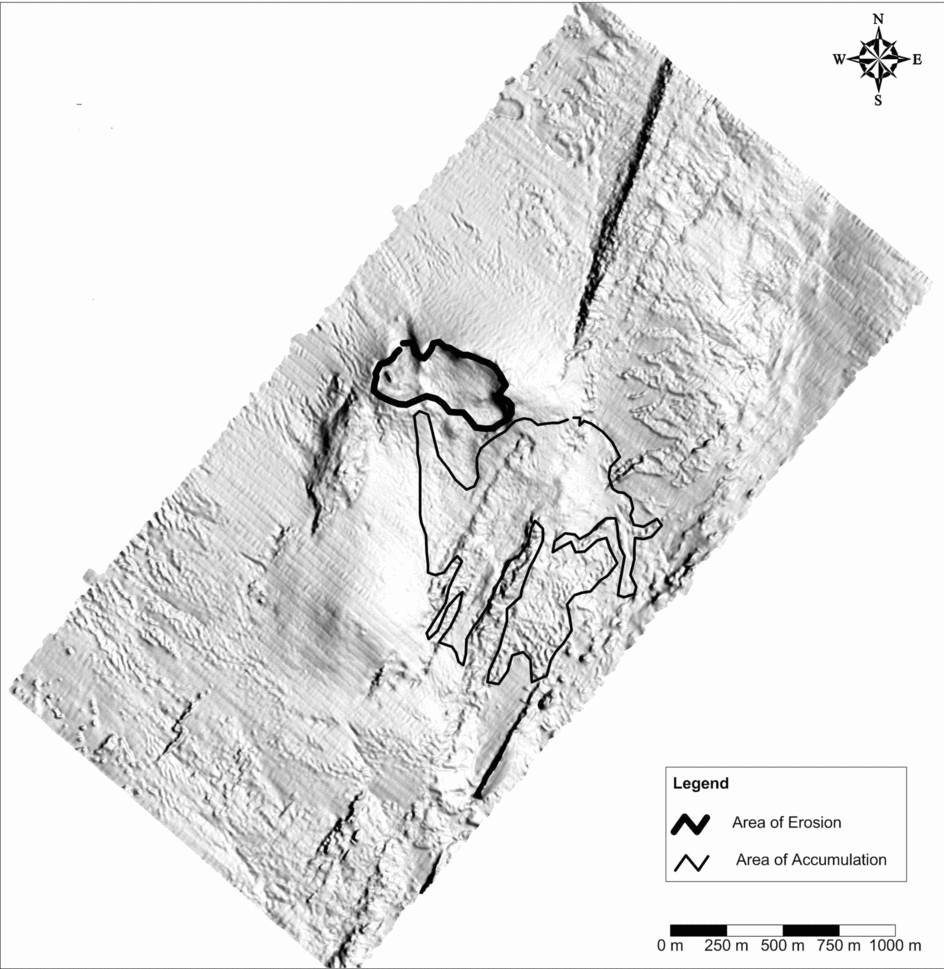
Richards Bay (Fig. 1) underwent coastal erosion, associated with coastal dune undermining, and the HWL retreated by up to 30 m. Shelf sediment at the Richards Bay dredge dump site, located at −20 m CD and 3 km from the coast, had built up to −11 m CD prior to this event (January, 2006 survey). A subsequent survey (July, 2007) noted that this feature had been lowered to −14 m. Although this survey may include effects from subsequent swells (Fig. 2), it is likely that most of it was related to the March ’07 swell. Five hundred thousand cubic metres of sediment was eroded and transported 200 to 700 m further offshore and deposited at depths of about −21 m CD (P. Van den Bossche, M. R. Machutchon & P. J. Ramsay, unpub. report no. 2007–011, Marine Geosolutions (Pty) Ltd, 2008)(Fig. 4). This amount of erosion is equivalent to the Richards Bay annual longshore drift volume (see Schoonees, Reference Schoonees2000). This evidence proves the existence of a return flow associated with the March ’07 swell event, as is to be expected with an event of this magnitude (see Thornton, Humiston & Birkemeier, Reference Thornton, Humiston and Birkemeier1996; Gallagher, Elgar & Guza, Reference Gallagher, Elgar and Guza1998).
Multibeam image of the Richards Bay offshore dredge dump site showing scouring and deposition.
5.a.2. Ballito
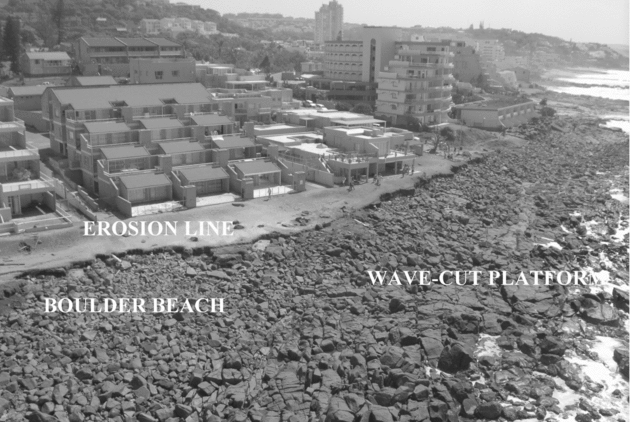
The Ballito coastline projects into the Indian Ocean (Fig. 1) and comprises a number of short topographically bound beaches bracketed by rocky headlands, associated with wave-cut platforms. The March ’07 swell caused the HWL to retreat by 5 to 50 m. Dunes were undercut and structures erected on them were damaged. In the rocky areas a boulder storm beach deposit was formed on the landward side of the wave-cut platform (Fig. 5). Old coastal defences were exposed and existing seawalls failed (Fig. 6).
Ballito rocky coastline following the March ’07 swell event.
Ballito: multi-storey block founded on the dune cordon and located within the 5 m amsl contour.
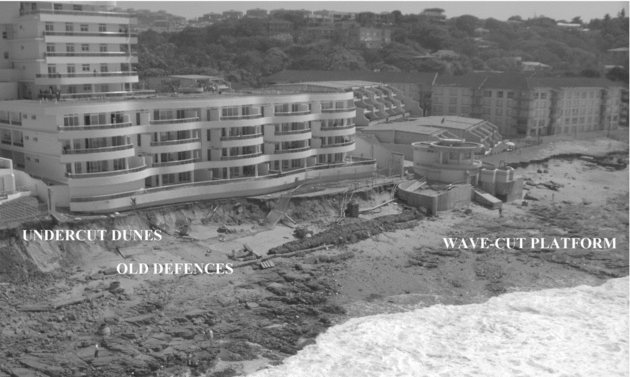
The zone between the measured tidal height (2.73 m CD) and the erosion line (± 4.5 m CD), at the height of the swell, represents rapid water level changes due to the pulsed arrival of wave sets. Wave run-up inundation levels reached 11.6 m CD, but in general this did not result in scour, unless focused by badly placed infrastructure. Erosion was generally laterally persistent and greatest on the southern lee of high headlands (Mather, Reference Mather2007; Smith et al. Reference Smith, Guastella, Bundy and Mather2007). The higher the blocking headland the greater the observed run-up (Fig. 7). Substrate also played a key role and damage was greatest where structures had been built on sand (Fig. 6), especially within the 5 m amsl contour (5.9 m CD), and particularly where bedrock is shallow (Smith et al. Reference Smith, Guastella, Bundy and Mather2007). Wave-cut platforms amplified erosion.
Ballito: headland induced erosion (with anthropogenic component), note the greater erosion on the southern side (left of image).
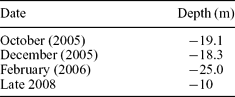
The seabed in the vicinity of the wreck Fame (a common SCUBA destination some 350 m off Salmon Bay, Ballito; Fig. 1) deepened from −18.3 to −25.0 m CD between December 2005 and February 2006 (Table 4). This indicates a gradual loss of sand to at least February (2006). By late 2008 it had built up significantly to −10 m CD. Onshore, Salmon Bay lost some dune buffer (HWL retreated 10 m) during the March ’07 swell. Simple calculations suggest that a minimum of 1.5 × 10⁶ m3 sediment may have been removed from the Salmon Bay coastline and deposited 350 m offshore at depths of at least −20 m CD. SCUBA ground truthing (late in 2008) still showed that the nearshore and shallow inner shelf (5–15 m deep) were littered with building and infrastructure rubble.
Changing bathymetry off Salmon Bay (2005–2008)
The soft coastline at Little Maritzburg Lane (Fig. 1) experienced severe erosion. This was due to a rocky point (surfer's point) to the south bypassing much of the wave energy northwards and focusing it on the soft coastline at the end of the rocky point.
5.a.3. Durban
During the March ’07 swell event the HWL receded 5 to 35 m in a few hours (Smith et al. Reference Smith, Guastella, Bundy and Mather2007); wave run-up was surveyed at 4.9–10.9 m CD (Mather, Reference Mather2007). The higher run-ups were on the exposed Anstey's and Brighton beaches, whereas the more protected parts of the Durban Bight experienced lower run-ups. At 650 to 800 m off the southern exposed beaches, seaward of a very high point near Isipingo (Fig. 1), erosion was detected at depths of −18 to −22 m CD (P. J. Ramsay & P. Van den Bossche, unpub. report 2008–007, Marine Geosolutions (Pty) Ltd, 2008).
Four million cubic metres (~ 40 m3 per metre of coastline) of sand were stripped from the Durban beaches during this large swell (Mather, Reference Mather2008) (Fig. 1). This volume is eight times the annual longshore drift (see Schoonees, Reference Schoonees2000). Extrapolation from these measurements suggests that 2.5 ×10⁷ m3 of sand could have been lost from the total KZN coast in 48 hours (Smith et al. Reference Smith, Guastella, Bundy and Mather2007). The lower wave run-up in the central Durban beaches (between Vetch's and Eastmoor beaches) damaged urban beachfront structures, especially glass doors and windows. In contrast, on the exposed southern beaches, water-loffel retaining systems and concrete seawalls failed. When seawalls did hold the line, some were overtopped and excavated from behind and failed to stop the erosion. In general they induced intense scouring, especially at their ends, amplifying the swell damage.
5.a.4. KZN South Coast
The KZN South Coast was less severely impacted. Here a coastal zone called the Admiralty Reserve, which extends from the HWL inland for 47 m is present. The removal of vegetation and building is prohibited in this zone, but in places where this restriction has been relaxed, swell damage was experienced. In areas of vegetated coastal dunes, run-up never exceeded 4.9 to 5.9 m CD, and was often less.
6. Winter 2007 swell morphodynamics
There was a gap of just over a month between the March ’07 large swell event and the onset of the Winter ’07 erosion cycle. During this time there were no large (> 3 m) swells (Fig. 2). Winter erosion is driven by seasonally enhanced south-to-north littoral drift, driven by the stronger winter swell regime. This generally results in beach thinning in the southern parts of topographically bound beaches, accompanied by deposition on the southern lee of northern headlands (Fig. 8).
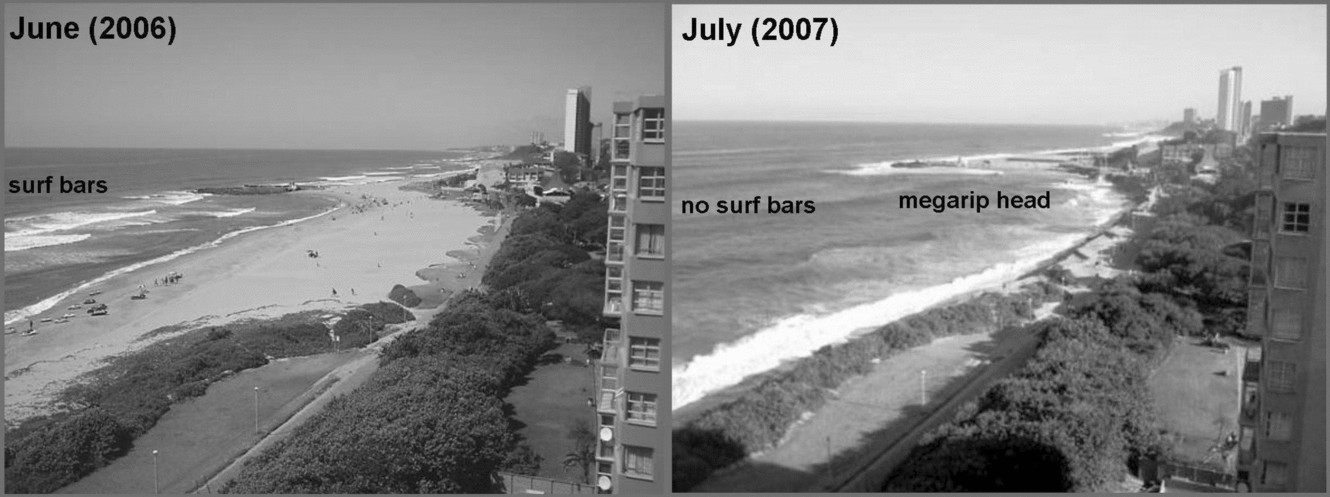
Inyoni Rocks: note the wide northern beach on June, 2006 (left image), whereas by July, 2007 (right image) the northern beach has thinned and sediment has built up on the southern point. The July, 2007 image was captured prior to peak erosion; note the lack of surf bars.

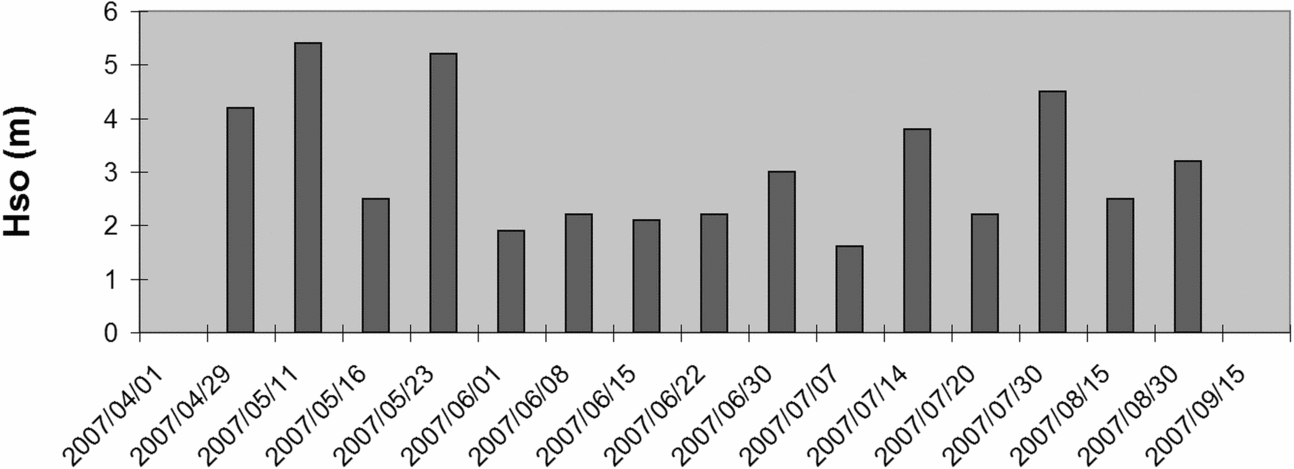
Winter ’07 erosion was restricted to erosion hotspots and built upon that already accomplished by the March ’07 swell. It was driven by a series of eight large swell events (Hs ≥ 3 m) and several minor ones which struck over a period of four months (Fig. 9). Ten swells coincided with spring tides and six with neaps (Table 5). It commenced with a 4 m swell on April 29th (Fig. 9) which maintained a 3 m height through the spring tidal cycle. This was followed by two large swells (> 5 m) on the 11th and 23rd May, both of which occurred on neap tide (Table 5). Minor EHS erosion was associated with these events, but against the backdrop of the March ’07 erosion, mostly went unnoticed at the time. From this point to the end of August, chronic coastal erosion occurred at some EHS localities: Little Maritzburg Lane (Ballito), Eastmoor Crescent, (Durban), Inyoni Rocks (Durban), Submarine Bay, Clansthal, Scottburgh and Mzumbe. This occurred on all spring high tides, and several neap high tides; most damage to infrastructure occurred at Inyoni Rocks and Submarine Bay (Table 5) where the HWL retreat was greatest. With the exception of Eastmoor Crescent, all these localities are within topographically bound beaches, associated with megarip currents. Although this style of winter erosion is normal for this coast, following the March ’07 event it was extreme. A similar pattern was recorded from California during the 1996–1997 El Niño season (Sallenger et al. Reference Sallenger, Krabill, Brock, Swift, Manizade and Stockdon2002) and this was also related to megarip current activity (Thornton, MacMahan & Sallenger, Reference Thornton, MacMahan and Sallenger2007). Dramatic erosion took place on July 30th when a swell (Ho = 4.5 m), again coinciding with spring tides, struck the coast (Table 5). At its peak, winter erosion occurred during neap tides and even during low swells; however, the greatest impact was during high swells and spring tides. The final erosion episode occurred on 30th August when a swell (Ho = 3.2 m) coincided with a very high spring tide (2.3 m CD) (Table 5). This event marked the end of the prolonged phase of EHS activity that commenced in late April 2007.
Significant open ocean swells during the May to August (2007) Winter Erosion cycle.
Submarine Bay* Winter erosion schedule
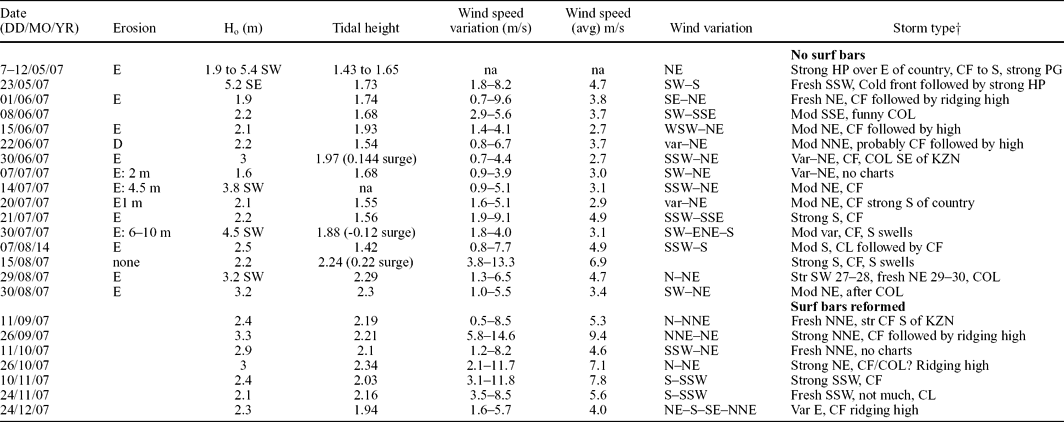
*This is based on observations at Submarine Bay (R. Osborne, pers. comm.) but there is good agreement with Ballito, Eastmoor Crescent and Inyoni Rocks.
†CF – cold front; CL – coastal low; COL – cut-off low; HP – high pressure.
HWL retreat values of 0.6 to 10 m per day were achieved at certain erosion hotspots during single events, but these totaled to give cumulative retreat values of 40 to 100 m (Fig. 10). Although these figures may not seem high for seasonal events, as some beaches in SE Australia are known to normally oscillate by as much as 100 m, with a recovery time of 2–5 years (Thom & Hall, Reference Thom and Hall1991; Short, Tremanis & Turner, Reference Short, Trembanis and Turner2001), they are equal to, and in some cases exceed, the KZN coast maximum historic EHS HWL variation (Table 7). In some instances, only dump rock intervention prevented the Winter ’07 erosion from reaching its natural peak. Analyses of the low-lying terrestrial topography of both Inyoni Rocks and Submarine Bay suggest that a further 30 to 50 m of erosion could have taken place if no intervention had been undertaken.
EHS at Inyoni Rocks, Amanzimtoti, June (2006: left) and July (2007: right) (Source: Independent Newspapers). The 2007 erosion had not yet peaked and but for an intervention strategy the shoreline may have receded further. Note the absence of a nearshore bar and suspended sediment in the nearshore surf zone on the right.
7. Coastal recovery
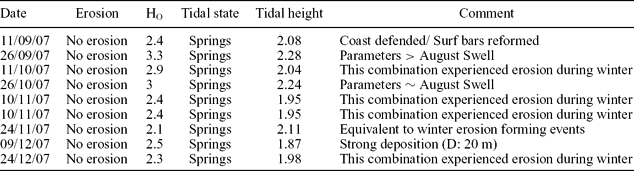
A new nearshore bar system (surf bars) was developed by early September 2007. As the quality of the surf improved, this event was well observed by the large local surfing community. Following this, a large swell (Ho = 3.3 m) struck on the September equinox (Table 6), but produced little notable erosion, even though it was comparable to, and in fact slightly higher than the 31st August ’07 swell (the last major erosive event). Only one significant event was recorded (at Submarine Bay), the significance of which is still being assessed. For the remainder of 2007, swells of a size that had previously been associated with erosion were linked with non-erosion and even deposition (Table 6). By February (2008), most EHS localities and laterally eroded beaches had been restored to at least 60 % of their pre-March ’07 erosion width. Pristine coastal dunes which had been impacted, had re-vegetated to some degree and in some instances new fore-dunes had established. In urban areas the coastal dune cordons have been impacted by development, to the point where they are dysfunctional and incapable of acting as either a swell defence or sediment source (Mather, Reference Mather2007; Smith et al. Reference Smith, Guastella, Bundy and Mather2007). These had to be repaired artificially using four-ton geo-textile sandbags. Although the KZN coastline appears to have re-equilibrated, the sand loss in some urbanized coasts has resulted in the new HWL being 5 to 10 m landward of the pre-March ’07 position.
The largest swells of the 2007 summer season
8. Discussion
The distinctive characteristics of the March ’07 swell event were its swell size (Hs = 8.5 m) and that it peaked less than 24 hours before the March equinox (coinciding with the joint highest tide of the year) which occurred near the top of the LNC. The proximity to the storm of origin (Fig. 3) resulted in a storm surge (0.33 to 0.45 m), and this together with the swell being disordered, as a result of the storm centre being only 450 km away (Smith et al. Reference Smith, Guastella, Bundy and Mather2007), meant that the wave sets were closely spaced and there was insufficient time between wave land-falls for water to drain away completely under gravity. Consequently, wave energy could not be dissipated in the surf zone as has been noted elsewhere (Cooper et al. Reference Cooper, Jackson, Navas, McKenna and Malvarez2004). On most of the KZN coast, dunes and a steep hinterland prevented inland penetration and consequently sediment could only be moved alongshore or offshore (Morton & Sallenger, Reference Morton and Sallenger2003), except at estuary barriers where overwash occurred. Thus a storm surge hydraulic head was established which gave rise to a strong return flow.
Subsequent EHS activity under moderate swell conditions is attributed to the March ’07 swell having left the coast in a state of disequilibrium. Nearshore bars had been destroyed or the sand moved too far offshore by the return bottom current to be effective (see Backstrom, Jackson & Cooper, Reference Backstrom, Jackson and Cooper2009). Offshore evidence from Richards Bay, Durban and Salmon Bay supports this. As the rising swell limb was very steep, offshore sediment transport probably took place early in the March ’07 swell event following a process of episodic net offshore bar migration (see Ruessink, Pape & Turner, 2008). During subsequent smaller swell events, the lack of a nearshore bar system reduced the frictional effect of incoming swell and resulted in waves breaking closer to shore, with higher energies due to reduced energy dissipation. This process has been recorded from the Australian Gold Coast (Castelle, Le Corre & Tomlinson, Reference Castelle, Le Corre and Tomlinson2008). Consequently, following the large March ’07 swell event, smaller swells with heights not normally associated with coastal erosion drove the megarip currents and EHS erosion. Between the swells on the 30th August (Ho = 3.2 m) and the 26th September equinox (Ho = 3.3 m), no major swell occurred and the nearshore (surf) bars were able to reform, restricting further erosion. This event was near-synchronous along the coast and marked the end of a six-month period of coastal disequilibrium triggered by the March ’07 large swell event.
Storm-return flow events, such as that driven by March ’07 swell, offer a mechanism by which sediment can be exported from the coast and nearshore zone to the inner shelf and beyond (Elliot, Reference Elliot and Reading1986; Tucker & Wright, Reference Tucker and Wright1990; Finkl, Reference Finkl2004; Backstrom, Jackson & Cooper, Reference Backstrom, Jackson and Cooper2009). It is known that sediment was moved to depths of at least −18 to −22 m CD during the March ’07 event. Sediment build-ups on the landward side of shore-parallel, aeolianite reefs, at depths up to −60 m CD in KZN are known (Flemming, Reference Flemming1981). Additional evidence that sediment passes offshore from the nearshore zone is shown by the presence of the shoreface-connected ridge fields on this coast (Bosman, Smith & Uken, Reference Bosman, Smith and Uken2008).
While large swell events commonly move sediment into the longshore drift via megarip-currents, severe events such as the March ’07 swell move it from the nearshore zone onto the shelf. The size of the swell is undoubtedly important in shifting the focus of wave breaking and imparting excess energy to the shoreline, but the enhanced water levels associated with barometric surge, extreme astronomical tides, storm surges and wave set-up are also responsible for coastal erosion. Unlike elsewhere (Cooper et al. Reference Cooper, Jackson, Navas, McKenna and Malvarez2004; Backstrom, Jackson & Cooper, Reference Backstrom, Jackson and Cooper2009), the Winter ’07 erosion was not wind dependent (Table 5).
Not all coastal stretches underwent erosion during the March ’07 event. Several erosion hotspots which had been active during 2006, such as Eastmoor Crescent (Durban), Inyoni Rocks (South Durban) and Submarine Bay (KZN South Coast)(Fig. 1), underwent little or no erosion during the March ’07 event. All of these areas had wide sandy beaches at the time the March ’07 swell hit, reducing the impact; this effect has been noted elsewhere (Sallenger et al. Reference Sallenger, Krabill, Brock, Swift, Manizade and Stockdon2002). Some relatively minor erosion took place, but the catastrophic destruction anticipated at Eastmoor Crescent, considering its recent history, did not take place.
The contrasting styles of swell-driven coastal erosion between the March ’07 and the Winter ’07 swell events may be explained in terms of water-level dynamics and geomorphology (Loureiro, Ferreira & Cooper, Reference Loureiro, Ferreira and Cooper2009). During the March ’07 swell, the very high water levels flooded some points and headlands, removing their topographic effect (Thornton, MacMahan & Sallenger, Reference Thornton, MacMahan and Sallenger2007); consequently, megarip EHS activity, itself geomorphologically controlled (Shand, Hesp & Shepherd, Reference Shand, Hesp and Shepherd2004), was weakened or absent except in the case of very high relief headlands. As a result, the coast responded with lateral (alongshore) erosion as opposed to EHS activity during the March ’07 swell.
Recurrence interval estimates of the March ’07 swell event range from 20 years (based on the historic record: Guastella et al. Reference Guastella, Smith, Mather and Bundy2008), 35 years (based on wave height) to 500 years (base on coincidence of tide and storm: A. Theron & J. Rossouw, unpub. data, 2008: http://researchspace.csir.co.za/dspace/bitstream/10204/2561/1/Theron_2008.pdf). If the cumulative erosion recorded during 2006–2007 is compared to the long-term (1937–1983) HWL fluctuations (Cooper, Reference Cooper1991a,Reference Cooperb, Reference Cooper1994), the greatest erosion corresponds to the areas with the largest historic envelopes of mobility (Table 7). (Due to the sampling intervals, varying from years to decades, these figures for envelopes of mobility have to be considered as minimums.) Indeed, many 2006–2007 HWL retreat values are similar to the known envelope of mobility values, indicating that such erosion events are not uncommon in the long-term.
Cumulative (2006–07) high-water mark changes compared to known long-term values (1937–8: Cooper, Reference Cooper1991a,Reference Cooperb, Reference Cooper1994)
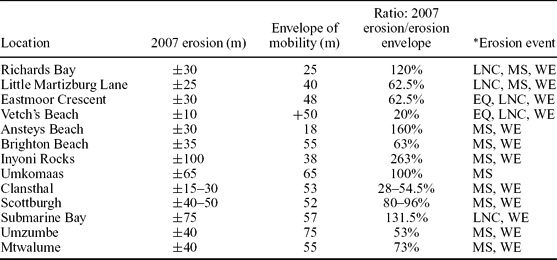
*EQ – equinoxes (2006), LNC – lunar nodal cycle (2006), MS – March swell (2007) and WE – winter erosion (2007).
However, at some locations the 2006–2007 erosion far exceeded the historic envelope of mobility, suggesting it to be a more unusual event. At Ballito, shell middens, which were active until the 1920s (L. van Schalkweg, pers. comm.), were exposed and partly eroded by wave action during March 2007, suggesting a longer interval since previous erosion of this magnitude.
Parts of the coast have been heavily urbanized during the last twenty years, perched swamps drained and coastal dunes made dysfunctional; consequently, the coastal erosion response was exacerbated by poor urban planning. All instances of 2006–2007 erosion which exceeded that of the envelope of mobility (Table 7) took place on highly urbanized coastlines. In contrast, natural coastline reaches recovered within a year, suggesting that the historic envelope of mobility is sufficient to accommodate such erosion events. In rocky coastal areas it was also noted that the wave-cut platform was only partially exposed, with part remaining buried under dune sand or drained swampland (Fig. 4). This suggests that the wave-cut platform-forming swell event is larger still.
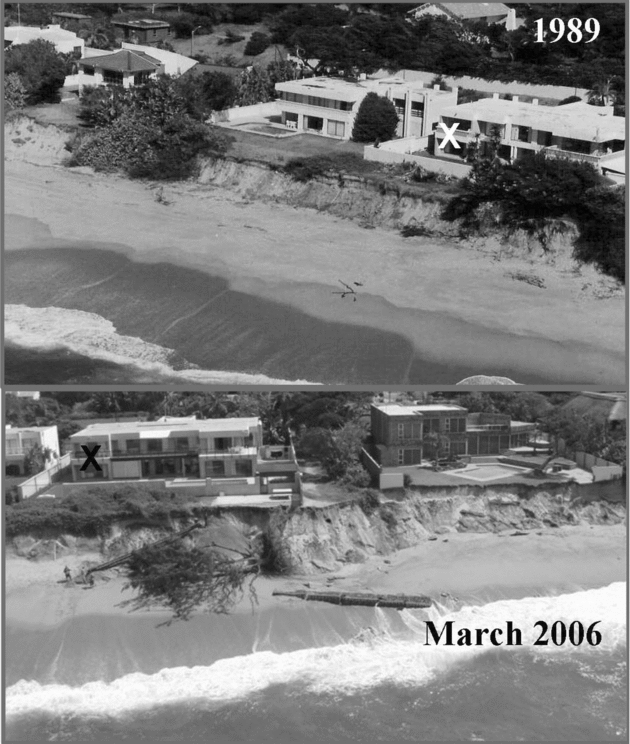
There is some evidence that EHS activity is episodic on the KwaZulu-Natal coast. At Eastmoor Crescent, a similar scale of erosion to that of 2006–2007 was recorded in 1970 and 1989; both occurred near previous LNC peaks (Fig. 11). Further, it is known that between July 1987 and June 1988, a period which straddles the previous LNC peak, the annual sediment loss from Durban's beaches was three times the annual average. At Submarine Bay, comparable erosion was recorded in 1991 (R. Osborne, pers. comm.) and unsubstantiated anecdotal information suggests that similar erosion occurred in the early 1940s.
Eastmoor Crescent, Durban: erosion from 1989 (top) and 2006 (bottom).
The LNC is known to modulate tidal amplitude by 3–5 % (Gratiot et al. Reference Gratiot, Anthony, Gardel, Gaucherel, Proisy and Wells2008; Oost et al. Reference Oost, De Haas, Jensen, Van den Boogert and De Boer1993). On swell-dominated coasts with narrow shelves, such as those of KwaZulu-Natal (4 to 47 km wide), tides are a particularly important mechanism for creating elevated water levels and thus in transferring increased wave energy to the back-beach where shoreline erosion is accomplished. A long period of stability (no major storms in 20 years), together with ignorance and greed, contributed to construction in inappropriate locations as landowners presumed them to lie outside the active coastal zone. Unwise development has undoubtedly increased the notoriety of the March ’07 swell event.
According to Elsner, Kossin & Jagger (Reference Elsner, Kossin and Jagger2008), cyclone numbers in the South Indian Ocean are unchanged (although storms are increasing in intensity); however, data posted online (Hurricane Alley Inc.), when plotted, suggest that there is an increase in storm numbers. At Richards Bay the intensity of swell exceedance events has remained fairly constant, but there has been an overall increase in number of exceedances since 1979 (Guastella & Rossouw, Reference Guastella and Rossouw2009). With the increase in the westerly winds between 30 and 60° S (Böning et al. Reference Böning, Dispert, Visbeck, Rintoul and Schwarzkopf2008), significant wave heights are also likely to increase. Theron (Reference Theron2007) has calculated that 10 % stronger winds would give wave height increases of 26 %, with coastal sediment transport rates increasing by 40 % to 100 %. This, coupled with rising sea level, means that the probability of occurrence of high water levels and large swells will increase and that EHS erosion and higher-swell-driven widespread erosion events of the scale experienced in March 2006–2007 will become more common.
9. Conclusions
The 2006–2007 period was marked by contrasting styles of coastal erosion along the KwaZulu-Natal coastline of southern Africa. Landfall of large ocean swells (Hso > 3 m, but < 5.5 m) associated with the unusually high spring tides, leading up to and just after the lunar nodal cycle of 2006, caused erosion at isolated erosion hotsponts. In contrast, the large March ’07 swell (Hs = 8.5 m) produced widespread, lateral (alongshore) coastal, nearshore and shelf erosion.
The contrasting styles of swell-driven coastal erosion between the March ’07 and the Winter ’07 erosion events may be explained in terms of water-level dynamics and geomorphology. The March ’07 large swell-driven megarip currents moved eroded coastal sediment onto the shelf, eroded the nearshore (surf) bars and triggered six months of coastal disequilibrium. In contrast, the Winter ’07 erosion moved sediment into the longshore drift and ultimately rebuilt the nearshore bars.
The March ’07 coastal erosion was an exceptional event that required the co-existence of a large swell, a storm surge and very high astronomical tides. Swell direction and not wind direction was a factor in coastal erosion. The steep nature of the coastline was responsible for the generation of a strong storm return flow, active to at least −20 m CD. Coastal surge penetration was low due to the steep hinterland, but washover fans 100–300 m long developed in estuaries.
Winter ’07 erosion was anomalously severe due to the lack of nearshore bars to dissipate wave energy; consequently, this energy reached the coast and strongly drove the megarip current cells driving the EHS localities. EHS activity continued from the end of April to the end of August, amplified by very high tides and high swells (Ho > 3 m, but < 5.5 m), but at its peak also took place during low swells (Ho ~ 2 m) and on neap tides.
The nearshore bars had been replaced and coastal erosion had ceased by the end of September, 2007. The natural coastline recovered (at least 60 %) within a year. The recurrence interval of the 2006–2007 erosion season is unknown, but all coastal erosion was contained within the HWL envelope of mobility, with the exception of that at highly modified urbanized coasts. Unwise urbanization was a key contributor to the 2006–2007 coastal erosion, making it look much worse than it was. The fact that the coastline recovered quickly suggests this event to have been significant but not extreme.
There is some evidence that erosion events are cyclic on this coast, possibly controlled by the lunar nodal cycle. With the rising sea levels and stronger winds forecast for global warming, erosion such as this is likely to increase along the KwaZulu-Natal coast.
Acknowledgements
The authors would like to acknowledge the acquisition of swell data from the Aviso-Las website and the Hydrographer SA Navy for tidal height data. We would further like to thank Richard Osborne and Barry Rebeck for sharing their detailed erosion observations. Further we would like to thank two anonymous referees for helpful comment which was used to improve this paper.



