


Introduction
Sea ice is considered to be an extreme and highly variable habitat, typically inhabited by diatoms (75%), autotrophic flagellates (14%) and heterotrophs (11%) which appear to be specifically adapted to this environment (e.g. Reference Garrison, Sullivan and AckleyGarrison and others, 1986). Only a select few species are successful in sea ice, often attaining higher abundances than in open-water blooms (e.g. Reference Garrison, Buck and SilverGarrison and others, 1983; Reference Garrison and BuckGarrison and Buck, 1989; Reference Gleitz, Bartsch, Dieckmann, Eicken, Lizotte and ArrigoGleitz and others, 1998; Reference Leventer, Lizotte and ArrigoLeventer, 1998). This, together with the fact that the Southern Ocean has an almost uniform algal species composition (Reference HasleHasle, 1976; Reference Fryxell and KendrickFryxell and Kendrick, 1988), leads to the assumption that it also holds true for sea ice. However, previous studies have shown that at least two distinct communities can be distinguished in sea ice: one in pack ice and the other in fast ice (Reference Meguro, Fukushima and MatsudaMeguro and others, 1992; Reference Scott, McMinn and HosieScott and others, 1994; Reference Gleitz, Bartsch, Dieckmann, Eicken, Lizotte and ArrigoGleitz and others, 1998).
Most studies have focused on fast-ice assemblages (Reference BuntBunt, 1963; Reference McConville and WetherbeeMcConville and Wetherbee, 1983; Reference Grossi and SullivanGrossi and Sullivan, 1985; Reference Krebs, Lipps and BurckleKrebs and others, 1987; Reference Meguro, Fukushima and MatsudaMeguro and others, 1992; Reference HoshiaiHoshiai, 1994; Reference Archer, Leakey, Burkill, Sleigh and ApplebyArcher and others, 1996; Reference McMinnMcMinn, 1996) where algal species composition is similar at many sites around Antarctica. As a result of these studies, the fast-ice community can be further subdivided into communities which differ significantly from each other (e.g. Reference Watanabe, Satoh, Hoshiai, Kerry and HempelWatanabe and others, 1990) and have a different succession (Reference Archer, Leakey, Burkill, Sleigh and ApplebyArcher and others, 1996).
Light was considered to be the primary limiting factor of algal growth in sea ice (reviewed by Reference Kirst and WienckeKirst and Wiencke, 1995). Others proposed that the availability of nutrients controls ice-algal proliferation (e.g. Reference Gosselin, Legendre, Therriault and DemersGosselin and others, 1990; Reference Dieckmann, Arrigo and SullivanDieckmann and others, 1992; Reference Robinson, Arrigo, Kolber, Gosselin and SullivanRobinson and others, 1998). Frequently, nutrient limitation, ice formation or salinity has been considered most likely to constrain algal growth in sea ice (Reference Dieckmann, Lange, Ackley and JenningsDieckmann and others, 1991; Reference GarrisonGarrison, 1991; Reference Scott, McMinn and HosieScott and others, 1994). More recently, Reference Gleitz, Bartsch, Dieckmann, Eicken, Lizotte and ArrigoGleitz and others (1998), who studied the composition of ice-algal assemblages in the Weddell Sea, suggested that their distribution is generally determined by (1) species composition of the phytoplankton at the time of ice formation, (2) selective mechanisms of algal enrichment during ice formation, (3) survival under extreme environmental conditions, (4) different growth rates of algae, (5) additional colonization during ice growth, and (6) selective grazing by microfauna.
However, interest in sea-ice species composition is not only ecologically motivated, but is also used by paleontologists to reconstruct past sea-ice distribution and climate change (Reference Leventer and DunbarLeventer and Dunbar, 1996; Reference Taylor, McMinn and FranklinTaylor and others, 1997; Reference Zielinski and GersondeZielinski and Gersonde, 1997; Reference Leventer, Lizotte and ArrigoLeventer, 1998). Fast ice, and the cooccurrence of an underlying platelet layer, could indirectly reflect the history and state of shelf-ice dynamics. The occurrence of platelet-ice algae in sediments (combined with other climate parameters) may reflect the past extent of platelet-ice production in Antarctica (Reference Leventer, Lizotte and ArrigoLeventer, 1998), and since platelet-ice production is closely coupled to shelf-ice dynamics, could be an indicator of historical ice extent.
We report on the algal species composition of fast-ice communities of the Weddell Sea. Changes in the diatom assemblages were followed within sea ice as well as in the underlying platelet layer during the winter/spring transition. Detailed, new information is provided on the ice-platelet assemblages as well as species composition in interstitial water between the platelet ice. The observed differences in species composition are compared to a combination of specific physical and chemical variables.
Materials and Methods
The study site was located in the western part of Atka Bay (Fig. 1), Weddell Sea, near the German research station Neumayer (70°35.05’ S, 8°8.41’W). The bay is, for the most part, covered by annual fast ice. A total of 18 cores were collected within an area of 25 m2, between 24 June and 5 December 1995 (Reference Gunther and DieckmannGünther and Dieckmann, 1999), of which 4 were used for this investigation. Cores were taken with a 9 cm diameter titanium corer and labeled according to the day of year sampled (i.e. cores 245, 281, 307 and 339). Ice platelets that had risen in the core holes were scooped up with a ladle on 14 occasions between 25 July and 18 December. Interstitial water from the top 120 cm of the platelet layer was also sampled on 14 occasions during the same period using an ADONIS sampler (Reference Dieckmann, Arrigo and SullivanDieckmann and others, 1992). Four samples from the water column were taken from 20 m depth, at approximately monthly intervals, through a crack in the fast ice, using a 5 L Niskin bottle. Snow depth was recorded during each sampling. Ambient light (LICOR 4 it sensor) was continuously measured underneath the sea ice at 3 m depth below the snow/air interface. At the beginning of the project the sensor was in the water column, but by October it was entrapped in platelet ice.
Location of sample site in atka bay, eastern weddell sea, antarctica. non-hatched area indicates the floating ice shelf.

Immediately after collection, core temperatures were measured in 5 mm holes drilled at 5 cm intervals using a WTW thermometer. Subsequently, cores were cut into 10 cm sections, placed in plastic cans and melted in the dark at approximately 12°C. Ice platelets were sieved through a household sieve (mesh 1 mm) and melted in artificial sea water (35psu (practical salinity units)) under the same conditions. All samples were analyzed for bulk salinity (WTW conductometer) and major nutrients, including nitrate, silicate and phosphate (Reference Parsons, Malta and LalliParsons and others, 1984). Nutrient concentrations were normalized to sea-water salinity. Thin sections of cores were prepared in order to determine the generic classification of each core (Reference EickenEicken, 1992). Brine salinity and volume were calculated using the equations of Reference Frankenstein and GarnerFrankenstein and Garner (1967). A more detailed description of methods and abiotic factors analyzed during this project is provided in Reference Gunther and DieckmannGünther and Dieckmann (1999). of each species in every sample was measured, and cell volume was calculated after Reference EdlerEdler (1979). A total of 63 ice-core samples, 5 ice-platelet samples, 10 interstitial-water samples and 4 water-column samples were analyzed for species composition and cell number.
For the analysis of species composition, an aliquot of each sample was fixed with hexamethylene-buffered formaldehyde (final concentration: 0.5%) and stored at 5°C until further examination at the Alfred Wegener Institute in Bremerhaven. Species were identified by scanning electron microscopy and counted using an inverted light microscope (Reference UtermohlUtermöhl 1958). We distinguished between empty cells and those containing plasma. Where identification of species by light microscopy was problematic, species were joined into higher taxonomic groups. The size of 10−20 cells
Community structure was analyzed by creating a ranked similarity matrix using species-abundance data of all samples. For this purpose we assumed that changes in species composition were the result of different growth rates leading to massive proliferation of certain species. Moreover, sea ice is a highly dynamic and ephemeral ecosystem with first recruitment of the habitat occurring randomly during frazil-ice scavenging. Community structure is therefore mainly determined by abundance of dominant species rather than distinct occurrence of single species of low abundance. To avoid dominance of these less abundant species, all abundances were double-square-root transformed prior to data analysis. The Bray-Curtis similarity index was chosen to elucidate seasonal and spatial changes in species composition (Reference Pfeiffer, Baumer, Dekker and SchleiferPfeiffer and others, 1996).
Empty and living cells of the same species were handled as separate items in the species-abundance table. Non-metric multidimensional scaling (MDS) was performed on the resulting similarity matrix to visualize similarities between all samples (Reference KruskalKruskal, 1964). Breakdown of species similarities was used to determine which species combination leads to the resulting clusters (Reference ClarkeClarke, 1993). Bio-environmental linking (Reference Clarke and AinsworthClarke and Ainsworth, 1993) was performed to compare species distribution with abiotic variables (nutrients, salinity, temperature, ice texture, brine volume and depth). In this method, principal-component analyses (PC As) of all possible combinations of abiotic factors measured were compared with the MDS analysis. The result is a best fit of a combination of abiotic variables which explain species distribution. All calculations concerning community structure analysis were done using the Primer statistical software package by Plymouth Marine Laboratory. This software was also used to determine species evenness of samples.
Results
Physical-chemical data
During late spring, Atka Bay fast ice grew in thickness from 165 cm in September to 204 cm by December (Fig. 2). Investigated cores had the same genesis, as indicated by an identical microstructure. Within the top 80 cm, snow ice was followed by granular ice and thereafter columnar ice. Subsequent sections consisted exclusively of consolidated platelet ice (Fig. 2). A loose matrix of unconsolidated platelet ice was present underneath the fast ice during the entire study.
Development of ice thickness and generic ice class. numbers above the cores denote day of the year the cores were sampled. zigzag lines (sn): snow ice; dots (gi): granular ice; vertical lines (a): columnar ice; shingle pattern (cp): consolidated platelet ice. horizontal lines denote 10 cm core sections. symbols on the right are used in figure 8.

Snow depth at the sampling site increased from 15 cm to 25 cm between September and December.
Ambient light at 3 m depth from the snow/air interface increased from a daily mean of 0.7 μE m−2 s−1 on 4 September to a maximum of 23.0 μE m−2 s−1 on 4 December. Thereafter, irradiance decreased to 3.4 μE m−2 s−1 by 18 December. The lowest temperature, −21.3°C, was measured on 23 September in the uppermost 5 cm of the ice. Thereafter, temperatures within the snow ice increased continuously to −5.3°C by December. Corresponding brine salinities at the snow-ice interface were 303 and 105, respectively. Temperatures of the sea-ice/platelet-layer interface and the interstitial water itself were always at the freezing point. Temperature gradients within ice cores were linear, showing decreasing slopes in the course of the study. Brine volumes were calculated using measured temperatures and salinities and provided a measure for sea ice. In this context, the depth contour of the 6% brine volume rose continuously from a mean of 165 cm in October to 95 cm by December. On 5 December, the uppermost 20 cm of the ice core also had a relative brine volume of > 6% (Fig. 3a). Changes in the nutrient regimes are shown in Figure 3b and c and described in more detail by Reference Gunther and DieckmannGunther and Dieckmann (1999).
Contour plots of (a) brine volume (%), (b) nitrate (mmol m−3) and ( c) silicate (mmol m−3) within fast ice, the underlying platelet layer and the upper water column during austral winter and spring in atka bay, 1995. the area between the dashed lines denotes the extent of the platelet layer. nutrient concentrations are normalized to sea-water salinity.

Biomass data
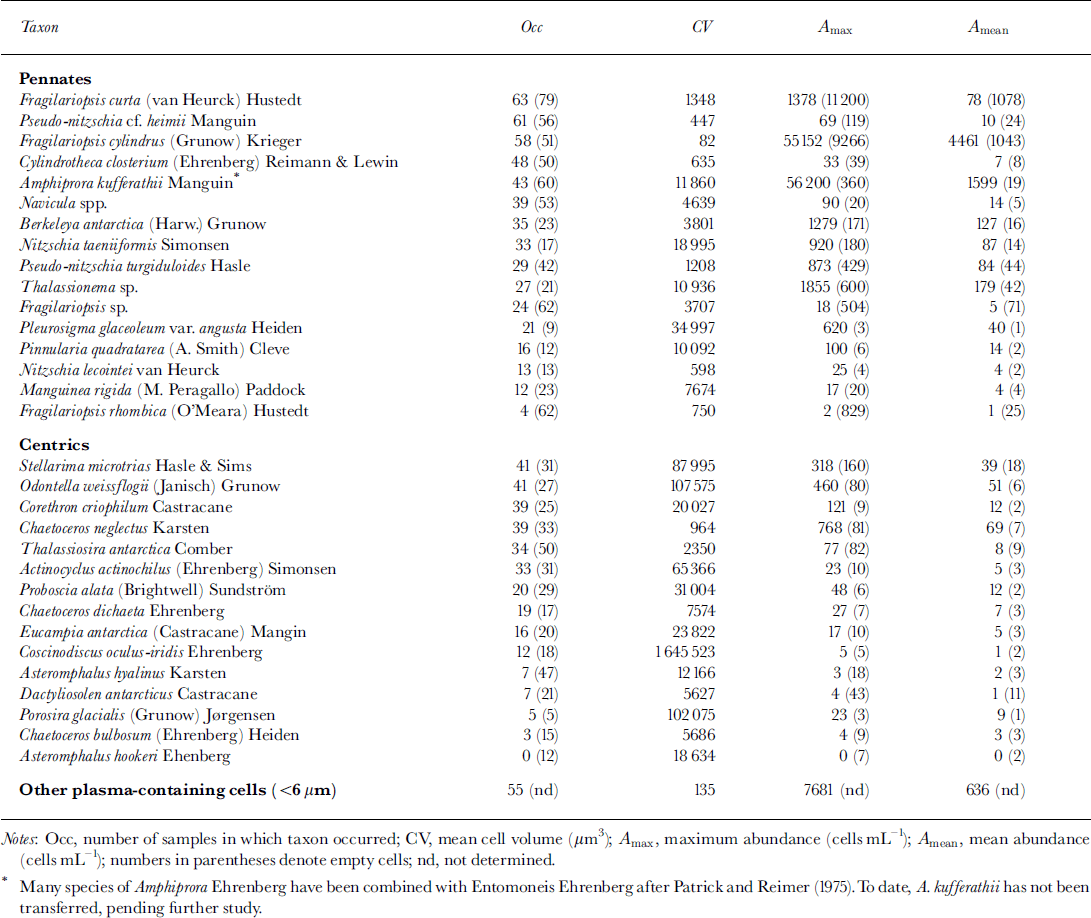
The results of the qualitative species analysis are given in Table 1. A total of 31 diatom taxa were clearly identified. Some less abundant species were pooled into the genera navicula spp. and fragilariopsis spp. In addition, unidentified algae or protists (cell diameter <6 μm) were found regularly in the upper core sections. Especially in December, many of these sphere-shaped organisms were observed to have a flagellum. Among the diatoms, the most abundant species were a tiny fragilariopsis cylindrus (apical axis <10μm) followed by amphiprora kufferathii* (see Table 1) and thalassionema sp. In addition, high numbers of empty fragilariopsis curta frustules occurred in almost every sample.
List of identified taxa in all samples (ice cores, ice platelets and interstitial water) ranked according to the occurrence of cells containing plasma
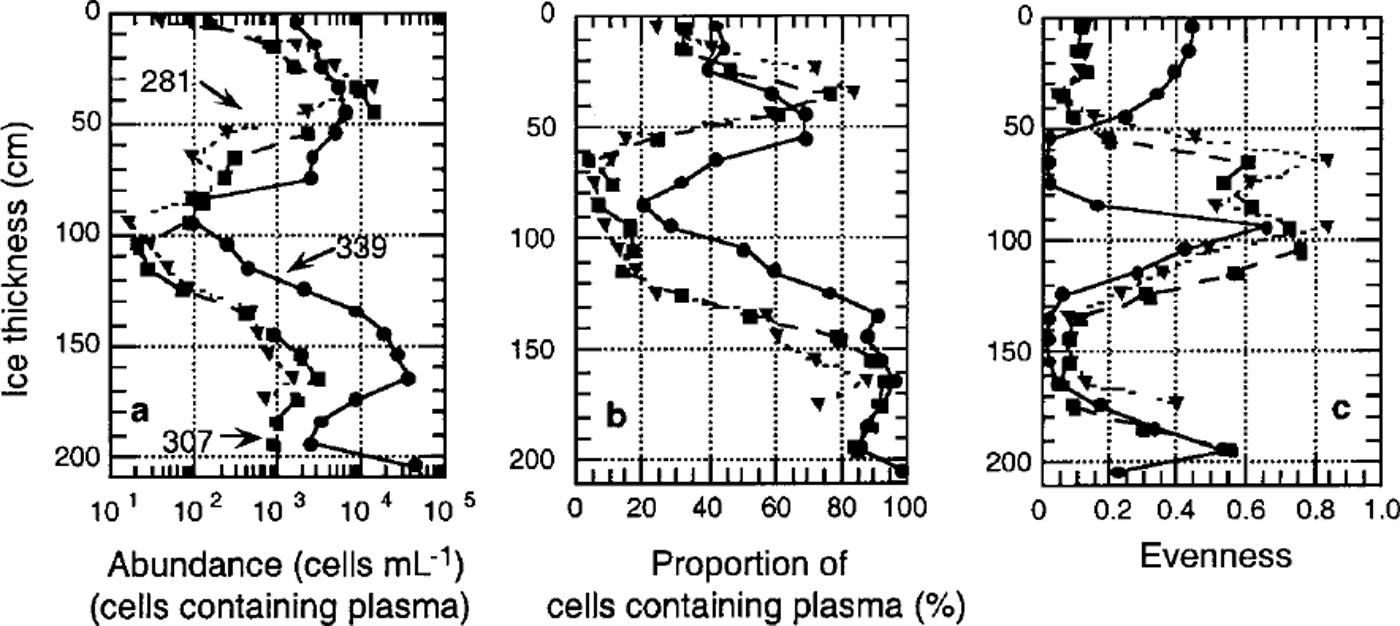
Cell counts of cores 281 and 307 were almost identical (Fig. 4a). Numbers of plasma-containing cells were highest at 40−50 cm depth, with concentrations up to 1.3 × 10⁴ mL−1. A second maximum occurred at the bottom of the sea ice, where cell numbers attained concentrations of about 103 cells mL−1. Cell numbers within snow ice and within the consolidated platelet ice at 60−120 cm depth were negligible, with <2.0 × 10² cells mL−1. Gore 339 had similar depth-dependent variations in abundances, although cell numbers were higher at almost every depth. In the lower half of the core, this difference was more than one order of magnitude, reaching a maximum of 4.1 × 10⁴ cells mL−1 at 165 cm depth. This trend is also reflected by a higher proportion of plasma-containing cells (Fig. 4b). By October (core 281) and November (core 307), >80% of cells were empty at 60−120 cm as well as within the snow ice. Above and below this depth, the majority of cells contained plasma, while at the very bottom of the ice cores there were almost no empty cells, especially at the end of the study.
Vertical distribution and temporal development of algal biomass in fast ice. (a) total cell number (units are ml−1); (b) proportion of plasma-containing cells; (c) evenness of core section. dotted line denotes core 281, dashed line core 307 and solid line core 339.
Algal cell numbers in the interstitial water of the platelet layer and attached to ice platelets were low during winter (approximately 10 cells m L−1) (Fig. 5a). In both habitats, cell numbers increased exponentially by three orders of magnitude towards December at the onset of spring. This is reflected by the proportion of living cells, which increased from <20% to almost 100% during this period (Fig. 5b).
Temporal development of algal biomass in platelet layers, (a) total cell number (units are ml−1); (b) proportion of plasma-containing cells; ( c) evenness of core section. dashed line denotes ice platelets, and solid line interstitial water.
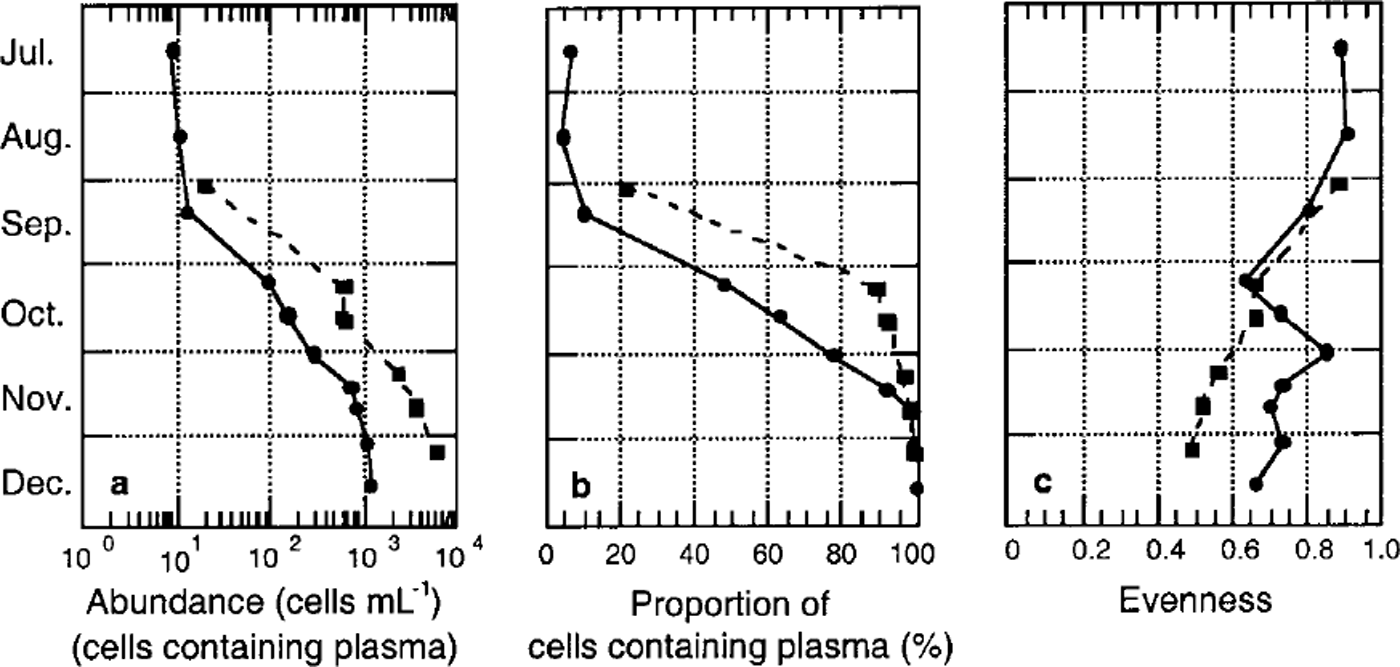
A first indication of a non-homogeneous species distribution is given by the sample evenness. With the exception of the bottommost core sections, evenness was generally low, as samples were dominated by fragilariopsis cylindrus (Fig. 4c). In December (core 339), the occurrence of the unidentified algae or protists (<6 μm) in the top half of the core resulted in an elevated evenness in the former fragilariopsis-dominated portion and in an extremely low evenness in the species-poor area. Within the underlying platelet layer, evenness is high in interstitial water as well as on ice platelets themselves. Evenness of these samples decreased only slightly in the course of the season (Fig. 5c).
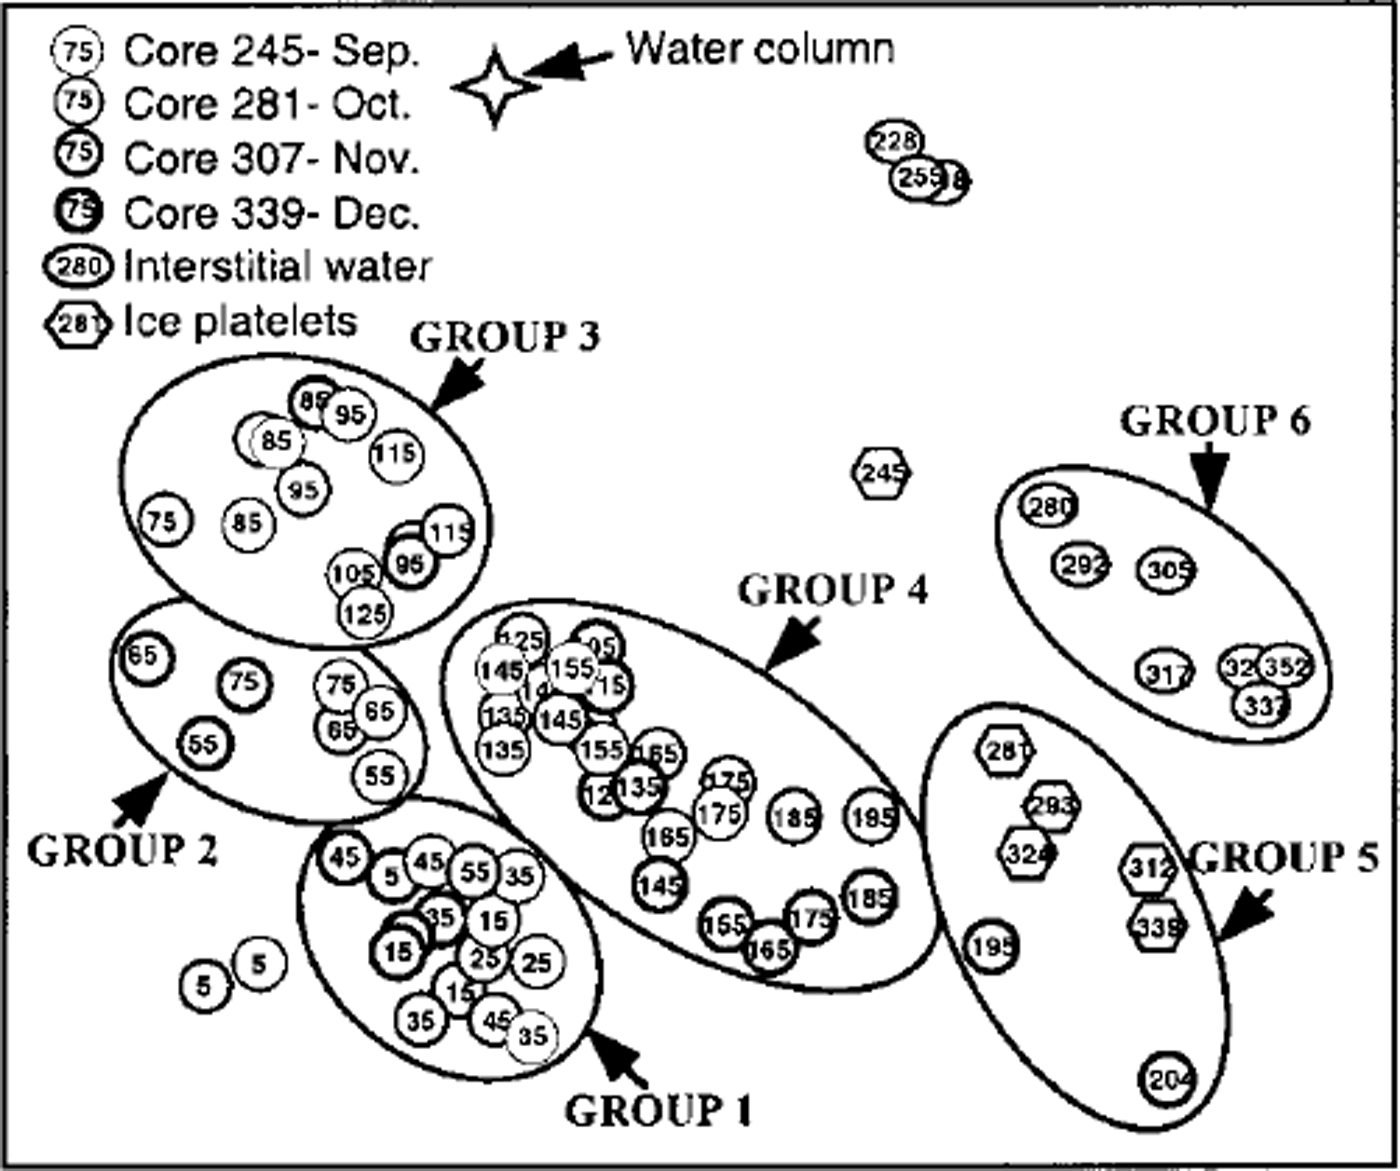
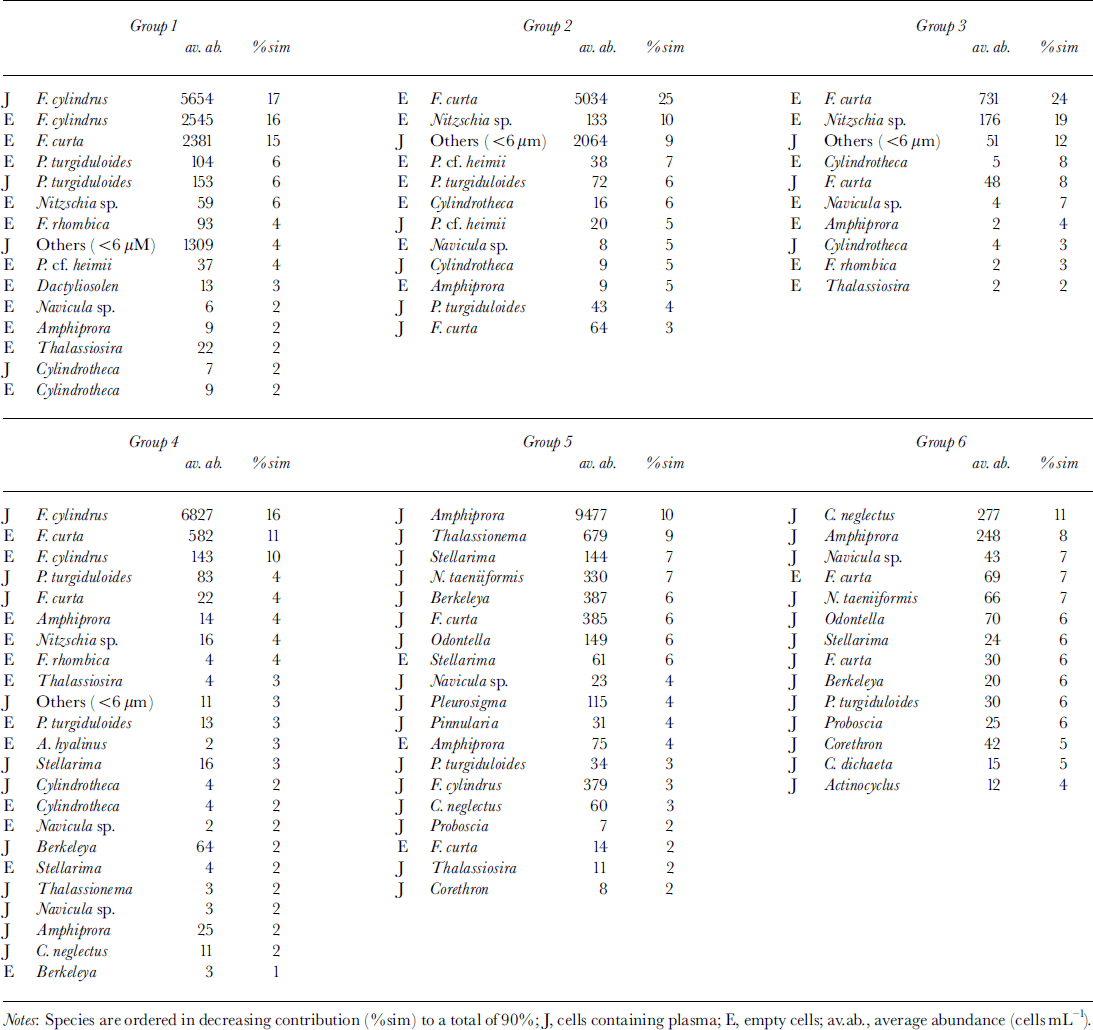
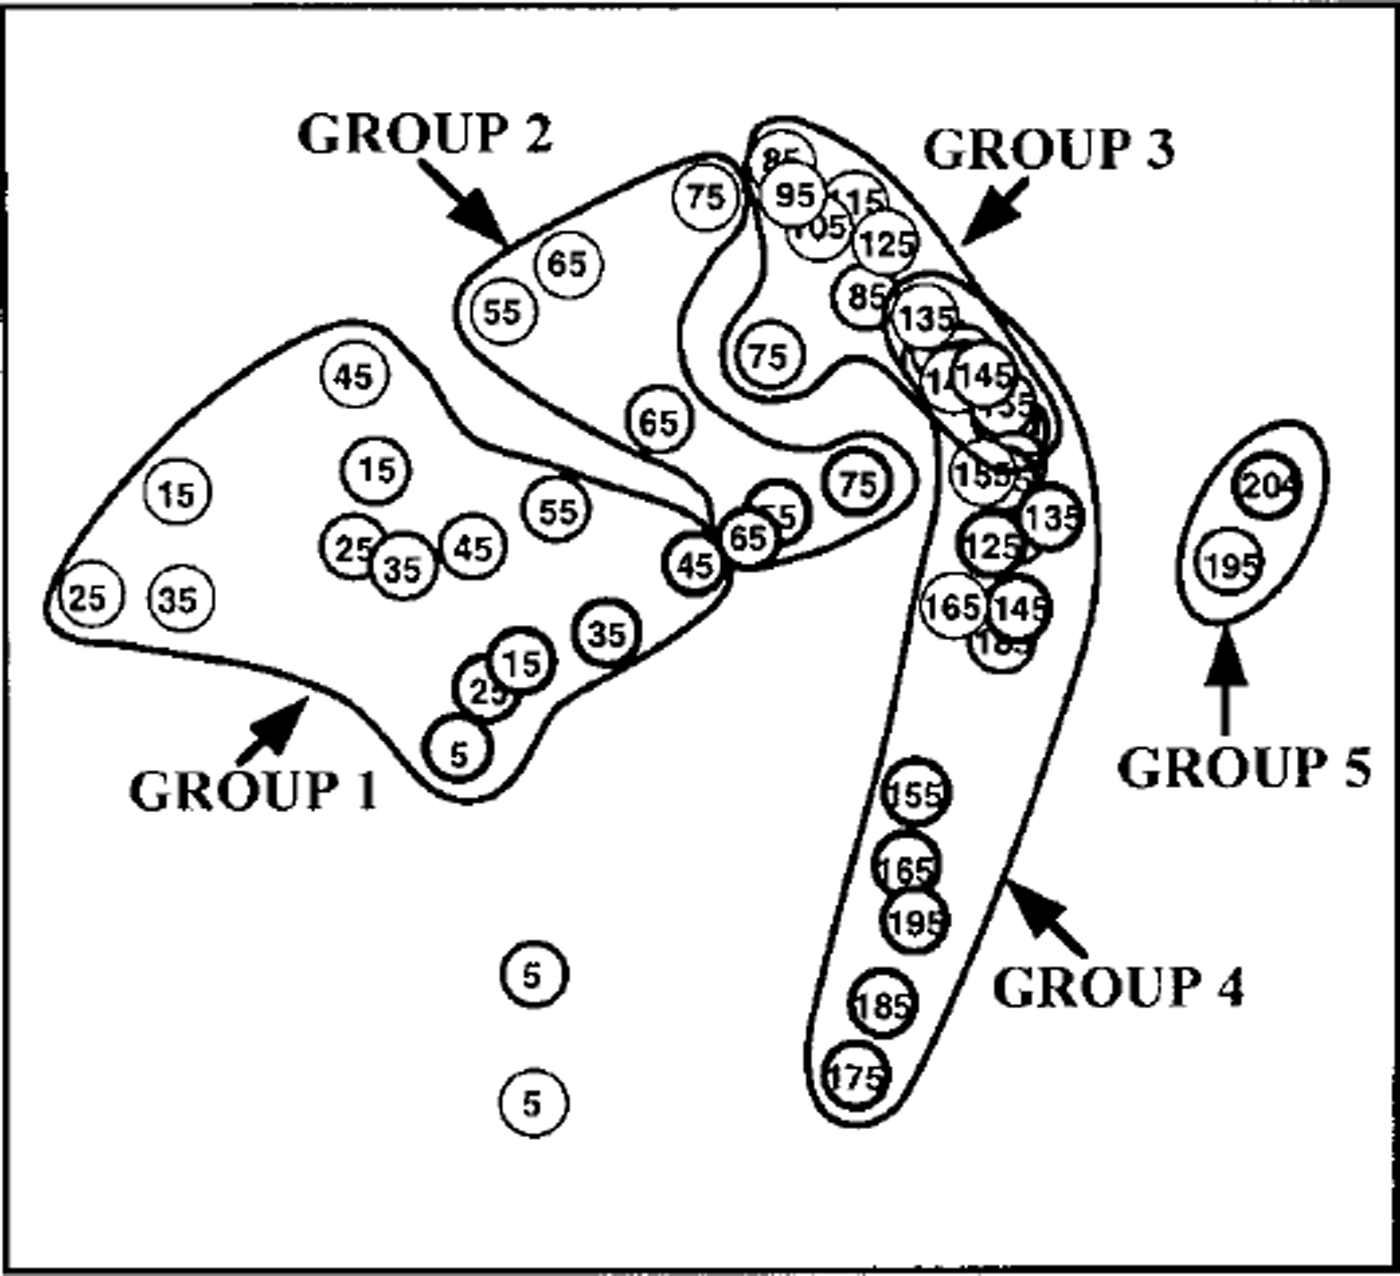
MDS resulted in six clearly distinguishable clusters consisting of more than six samples each (Fig. 6) at a stress level of 0.12. Outliers are characterized by extremely low cell numbers. The three different habitats (congelation ice, ice platelets and interstitial water) formed separate clusters. This general trend is disrupted by the bottommost sections of core 339, which are closer to the ice-platelet samples. Furthermore, vertical zonation is visible within the congelation ice. The breakdown of similarities emphasizes the importance of empty cells for the composition of the upper sea-ice assemblage (Table 2). Less than one-third of plasma-containing cells contributed to the similarities within samples of groups 1−3. Group 4 occupies an intermediate position, while empty cells played only a minor role in groups 5 and 6 (approximately 10%). Within the congelation ice, the occurrence and abundance of f. cylindrus, pseudo-nitzschia turgiduloides, empty frustules of f curta and the unidentified microalgae determined the clustering of the samples. Species composition of the ice-platelet cluster that contained the bottommost sections of core 339 (group 5) and the interstitial-water cluster (group 6) differed significantly from sea-ice clusters, as they are dominated by larger and chain-forming diatoms such as amphiprora kufferathii, chaetoceros neglectus, thalassionema sp., stellanma microtrias and nitzschia taenuformis.
MDS plot illustrating relationship between fast-ice core sections (circles), ice platelets (hexagons), interstitial water (ovals) and water column (star). groups were determined by eye. numbers denote mean depth of core section and day of sampling, respectively. line thickness denotes different cores.
Breakdown of similarities within groups (identified from fig. 5) into contributions from each species
The bio-environmental linking resulted in three parameters which best explain the present species distribution. Generic ice class, brine volume and silicate were responsible for 45% of the variance. The PCA of these abiotic factors (Fig. 7) revealed a similarly U-shaped arrangement of clusters, with snow-ice samples being excluded from this analysis.
PCA plot of fast-ice core sections including silicate concentration, brine volume and generic ice class derived from bio-environmental analysis. groups are according to figure 6.
Discussion
Species composition in land-fast ice has been intensively investigated (Reference McConville and WetherbeeMcConville and Wetherbee, 1983; Reference Palmisano and SullivanPalmisano and Sullivan, 1983; Reference Grossi and SullivanGrossi and Sullivan, 1985; Reference Meguro, Fukushima and MatsudaMeguro and others, 1992; Reference HoshiaiHoshiai, 1994; Reference Scott, McMinn and HosieScott and others, 1994; Reference McMinnMcMinn, 1996; Reference Gleitz, Bartsch, Dieckmann, Eicken, Lizotte and ArrigoGleitz and others, 1998), and some studies have broached the subject of succession (Reference Krebs, Lipps and BurckleKrebs and others, 1987; Reference Watanabe, Satoh, Hoshiai, Kerry and HempelWatanabe and others, 1990; Reference Archer, Leakey, Burkill, Sleigh and ApplebyArcher and others, 1996). In summary, all these studies reveal that differences between algal species composition in fast ice from different localities of the Southern Ocean are negligible. Of more than 100 species identified in land-fast sea ice, not more than 20 species are major contributors to the total algal biomass in the ice (Reference Gleitz, Bartsch, Dieckmann, Eicken, Lizotte and ArrigoGleitz and others, 1998). However, differences in spatial distribution, not only between pack-ice and fast-ice communities (Reference Scott, McMinn and HosieScott and others, 1994; Reference Gleitz, Bartsch, Dieckmann, Eicken, Lizotte and ArrigoGleitz and others, 1998), but also within fast ice, between interior and bottom ice communities (Reference Meguro, Fukushima and MatsudaMeguro and others, 1992), are evident. A comparison between interior assemblages recorded in previous studies is difficult, mostly because of problems in identifying species, particularly those belonging to the genera nitzschia and fragilariopsis. However, it can be generalized that: (1) there are more diatom species in the interior of the sea ice than in bottom ice communities, while the reverse is true for algal biomass, (2) flagellates regularly occur in this interior layer, and (3) species that often dominate these assemblages are fragilariopsis cylindrus, f. curta, navicula glaciei and cylindrotheca closterium. These generalizations could also be applied to cores of the present study.
Similarities between the species composition of bottom fast-ice assemblages from different sites are even more pronounced. In almost every study, amphiprora, mainly a. kufferathii, is one of the dominant genera, accompanied by berkeleya, nitzschia stellata and pleurosigma. These genera seldom occur in pack-ice assemblages, indicating either a different species composition of the coastal water column during ice formation or a selective mechanism of incorporation prevalent during fast-ice growth.
Linking sea-ice species composition to the abiotic environment
The pivotal goal of this study is to explain the observed species composition and succession in relation to abiotic factors. The best result is obtained by combining silicate concentration, brine volume and generic ice class, which explains 45% of the total variance. This value is high considering the fact that only a fraction of the factors controlling algal growth could be recorded. Factors such as CO2 concentration, brine-channel size, short-term extremes of abiotic parameters, algal motility, protozoan grazing and interspecific competition can as yet not be satisfactorily determined. It is also remarkable that with the exception of the generic ice class, species composition follows continuous gradients rather than constant thresholds such as minimum temperature or maximum salinity.
Silicate
The effect of silicate concentration, or more generally that of nutrients, has been intensively studied to understand nutrient limitation on algal growth in sea ice. Several authors have found species-specific uptake ratios of silicate. Reference SommerSommer (1986) showed a low uptake affinity for silicate with a km of 60.1, 88.7 and 21.7 μM, respectively, in corethron criophilum, f. kerguelensis and c. neglectus, all of which are abundant at the sea-ice bottom. In contrast, f. cylindrus has a relatively low half-saturation constant of 8.4 μM, while all species have a much higher affinity to nitrate (km = 0.3−4.2 μM). This is supported by Reference Nelson and TréguerNelson and Tréguer (1992) who reported on a natural ice-edge bloom dominated by f. curta, f. cylindrus and c. closterium having a half-saturation constant for silicate of 1.1−4.6 μM. In this study, these species were found primarily in the interior of the ice. Another taxon commonly found in interior assemblages was p. turgiduloides which has an intermediate silicate affinity of km = 12−22 μm Reference JacquesJacques, 1983). In the course of this study, nitrate was almost completely exhausted within the sea ice (Reference Gunther and DieckmannGunther and Dieckmann, 1999), while silicate concentrations were lower than the half-saturation constant of the "low-silicate-affinity species" but higher than that of the "high-affinity species" (mean of 22.4 μM). It can therefore be assumed that silicate availability controls the species composition, while nitrate determines the maximum abundance.
In this respect, the occurrence of flagellates in the upper part of fast-ice cores must be mentioned. Dinoflagellates, or at least non-silicon-dependent microalgae, are a common feature in upper fast-ice layers. Reference Krebs, Lipps and BurckleKrebs and others (1987) reported on archaeomonads in fast ice of the Bellingshausen Sea. Reference McConville and WetherbeeMcConville and Wetherbee (1983), Reference Watanabe, Satoh, Hoshiai, Kerry and HempelWatanabe and others (1990) and Reference Archer, Leakey, Burkill, Sleigh and ApplebyArcher and others (1996) found dinoflagellates in the Indian sector of Antarctica. Reference Stoecker, Buck and PuttStoecker and others (1992, Reference Stoecker, Gustafson, Black and Baier1998) found a flagellate flora in McMurdo Sound. In contrast, abundances of these groups in pack-ice assemblages are comparatively low. A possible explanation for this may be the assumption that the snow cover on pack ice leads to flooding events that in turn replenish the nutrients in the upper sea ice (Reference Fritsen, Ackley, Kremer, Sullivan, Lizotte and ArrigoFritsen and others, 1998). The presence of ice platelets, however, increases the buoyancy of fast ice, thus preventing flooding and nutrient exchange with the water column at the sea-ice surface. As soon as low silicate concentrations decrease growth rates of diatoms, flagellates compete more successfully for the remaining nitrate.
Availability of space
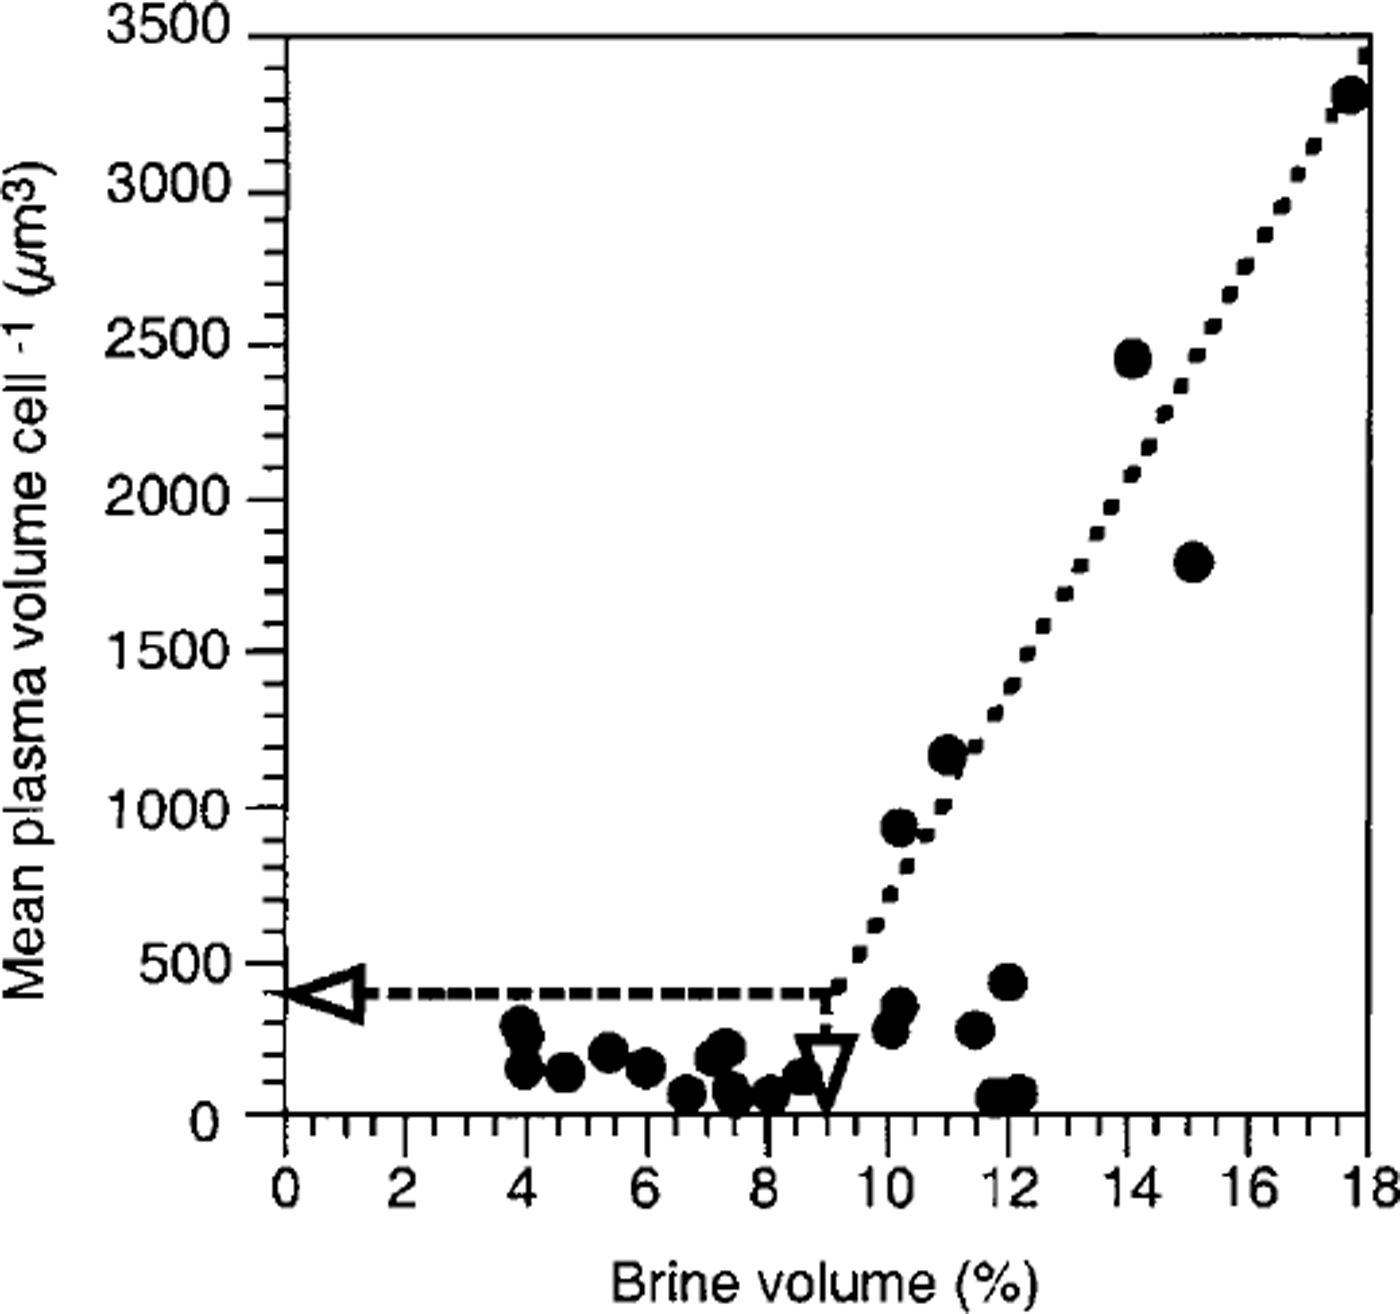
Space, represented by brine volume, seems to be the second factor forcing the observed species composition in sea ice. Reference Lake and LewisLake and Lewis (1970) showed that brine channels smaller than 1 mm do not allow convection, so that brine-channel size thermodynamically depends on temperature and salinity which in turn also determine total brine volume. Furthermore, J. Freitag (personal communication, 1999) reported that 80% of the brine-channel system consists of these small primary brine channels, indicating a direct correlation between decreasing brine volume and narrowing of brine channels. In this study, it was clearly shown that with decreasing brine volume from the bottom of the sea ice towards the top, the mean cell size of the algal assemblages also decreases (Fig. 8). Mean plasma volumes larger than 400 μm3 only occur when relative brine volume exceeds 9% (arrows). Thereafter, cell size appears to increase linearly with increasing brine volume. A similar effect was observed by Reference Gleitz and ThomasGleitz and Thomas (1993) who found that growth of algae greater than 40 μm is inhibited in the interior of sea ice, leading to a monoculture of tiny chaetoceros neogracile. In addition, Reference Grossmann and GleitzGrossmann and Gleitz (1993) observed that the chain size of f curta decreased from 50 to 3 cells after incorporation into sea ice. The same authors also showed that 50% of the large thalassosira antarctica cells were destroyed during the incorporation process. In fact, in the present study, chains of a. kufferathii within sea ice were much shorter than those attached to ice platelets, and the proportion of empty cells steadily increased from the sea-ice bottom upwards. Here, brine salinity does not exceed values which could lead to osmotically forced cell lysis (Reference Gunther and DieckmannGunther and Dieckmann, 1999). It can therefore be assumed that mechanical destruction and not hyperosmotic conditions caused the observed shift in species composition.
Relationship between brine volume and mean plasma volume per cell within consolidated platelet ice. see text for explanation of lines.
Sea-ice texture
Species composition is also related to generic ice class. Ice-crystal structure determines the architecture of the brine-channel system (Reference WeissenbergerWeissenberger, 1992), potentially having an impact on the species composition. This, however, has not been reported in the literature. On the other hand, the generic ice class is a result of ice-formation processes which in fact influence the establishment of algal assemblages. It is well known that during pancake-ice formation, wind- and wave-driven frazil-ice scavenging leads to accumulation of pelagic algae into the ice. Reference Garrison, Buck and SilverGarrison and others, (1983,Reference Garrison, Close and Reimnitz1989) and Reference Gleitz and ThomasGleitz and Thomas (1993) showed that this process is non-selective and probably a function of encounters between frazil ice and algae. Therefore, species composition in columnar ice resembles that of the water column in autumn. In fact, phytoplankton composition observed in the eastern Weddell Sea during this season (Reference Gleitz and ThomasGleitz and Thomas, 1993) is similar to the composition of empty cells in columnar ice of the cores investigated in this study. Later, the factors mentioned above cause a succession which results in the observed composition of plasma-containing cells. Ice formation also determines the species composition within the following columnar ice and upper consolidated platelet ice. Reference WeissenbergerWeissenberger (1992) observed that species composition as well as cell numbers there correspond to those of the water column in winter. In this study, environmental conditions after incorporation probably did not permit algal proliferation, but the forcing factor could not be identified. Moreover, exclusion of groups 2 and 3 (ice grown in winter) from bio-environmental linking decreased the stress factor by two-hundredths, meaning that 62% of the variance in species composition of groups 1, 4 and 5 could be explained by silicate concentration, brine volume and generic ice class alone (Fig. 9).
Superimposed data of (a) generic ice class (for symbols see fig 2), ( b) silicate concentration (smaller circles denote high concentrations and larger circles low concentrations for better visibility) and (c) brine volume (circle size corresponds to brine volume) of fast-ice core sections.

Even more pronounced is the influence of platelet-layer congelation on the species composition during later winter and spring. Ice platelets can be regarded as large (frazil) ice crystals, so that the scavenging process indicated for frazil ice during pancake-ice formation can also be applied to ice platelets during their ascent to the ice cover. Reference BuntBunt (1963) first surmised that scavenging by platelet ice seeded the bottom part of fast ice along shallow coasts. This was also proposed by Reference Dieckmann, Rohardt, Hellmer and KipfstuhlDieckmann and others (1986) for deeper waters. Further support comes from the fact that species composition of the lower consolidated platelet ice (group 4) is closely related to that of the unconsolidated platelets (group 5), with two core sections even belonging to the ice-platelet cluster (Fig. 6). Furthermore, species composition of the bottommost sea ice is different from that of the interstitial water and even more so from that of the water column at that time (Fig. 6). A comparison of species composition of bottom fast-ice assemblages (Reference Palmisano and SullivanPalmisano and Sullivan, 1983) and platelet-layer assemblages (Reference Arrigo, Robinson and SullivanArrigo and others, 1993) in McMurdo Sound is in accord with our observations and supports the assumption that ice platelets determine the species composition of fast-ice bottom communities.
However, a similar species composition of fast-ice bottom assemblages was observed where platelets were apparently absent. Thus, species such as a. kufferathii, berkeleya sp., mitzschia stellata and pleurosigma sp. also dominate at various coastal locations where authors did not mention the presence of "under-water-ice layers". Only Reference Archer, Leakey, Burkill, Sleigh and ApplebyArcher and others (1996), who used a submersible video system, explicitly excluded the presence of platelet ice near the Amery Ice Shelf. Reference Penrose, Conde and PaulyPenrose and others (1994), however, observed platelet-ice formation in that area. Our observations and those of C.W. Sullivan (personal communication, 1989) were that platelet layers in Atka Bay and McMurdo Sound, extant in winter and spring, will vanish in summer, especially during ice melt and break-off, which was the case during the study of Reference Archer, Leakey, Burkill, Sleigh and ApplebyArcher and others (1996). Only thin sections of ice cores can confirm the presence of ice platelets.
Unfortunately, ice-structure nomenclature is not consistent. In most studies, the term "congelation ice" is used for both columnar ice and consolidated platelet ice. Thus, the generic ice class should be re-evaluated in earlier studies, and more attention should be paid to the presence of platelet ice in future studies.
Composition of the platelet-layer community
One explanation for the differences in species composition and distinct patterns of succession between ice platelets and the surrounding interstitial water should be sought in biotic factors since the abiotic environment was the same for both. In general, species composition of algae attached to ice platelets in Atka Bay is similar to that found in McMurdo Sound (Reference Arrigo, Robinson and SullivanArrigo and others, 1993) or underneath drifting pack ice (Reference SmetacekSmetacek and others, 1992; personal communication from S. Grossmann, 1995). In all studies, an amphiprora species was among the dominant taxa, as well as stellarima microtrias, f. curta and the genus berkeleya. However, regional differences were also observed. Reference SmetacekSmetacek and others (1992) found Thalassiosira antarctica to be the dominant species in pack-ice platelet layers. In Atka Bay, we found only low abundances of empty valves of this species. Underneath McMurdo Sound fast ice, nitzschia stellata dominated the bloom. Again, this species was not present in any significant number in Atka Bay. However, this taxon is replaced by a thalassionema species that was the second-most abundant alga on ice platelets in this study. It is of the same size as nitzschia stellata and forms similar star-shaped chains. Electron microscopy revealed that the most abundant chain-forming species, amphiprora kufferathii, thalassionema sp. and berkeleya antarctica, were covered by large amounts of mucus. Thus either the stickiness of the cells (Reference Hoagland, Rosowski, Gretz and RoemerHoagland and others, 1993) or the higher probability of large chains being scavenged (Reference Garrison, Close and ReimnitzGarrison and others, 1989) or a combination of both leads to the observed ice-platelet assemblage. The low abundance of unidentified algae (<6μm) in group 4 (Table 2) may indicate that either flagellate abundances were very low in the water column during platelet congelation or the ability or need to attach themselves to platelets is restricted. More evidence supporting the stickiness hypothesis comes from the fact that the typical interstitial-water species chaetoceros neglectus, c. dichaeta, proboscia data, corethron criophilum and actinocyclus actinochilus were not covered by mucus. Reference Hoagland, Rosowski, Gretz and RoemerHoagland and others (1993) cited the work of Myklestad and co-workers who found that chaetoceros affinis produces extracellular mucus, but only under conditions not prevalent in platelet layers, where nutrients are sufficient and algae grow exponentially. Furthermore, chain lengths of a. kufferathii, also abundant in interstitial water, were much shorter there, thus decreasing the probability of being scavenged by ice platelets. A second possible factor controlling species composition in platelet layers is zoo-plankton grazing. Reference Gunther and DieckmannGünther and others (1999) observed a dense copepod and amphipod community within platelet layers at Drescher Inlet. They assumed on the grounds of morphological differences that the two dominant copepod species are specialized to feed either solely on planktonic algae or on attached algae.
Conclusions
Evidently, fast ice, including the underlying platelet layer, is inhabited by four clearly distinguishable communities: the internal and bottom sea-ice community, the ice-platelet community and the interstitial-water community. The species composition as well as their transition are most probably related to changes in silicate concentration, pore space, ice-formation processes and cell stickiness.
As the influence of a large number of environmental factors was tested here, it is apparent that an improved insight into the relationship between species composition and abiotic factors can be achieved only if measurements are conducted either continuously or at a smaller scale. Above all, however, in situ measurements are urgently required so that calculations can be replaced by real data. This demands the development and establishment of new techniques such as microprobes and non-destructive instruments.
There is some indication that the presence of platelet layers was overlooked in previous studies. If the result of such a re-evaluation suggested that the observed uniqueness of fast-ice bottom assemblages is related to platelet-ice scavenging, this would have strong impacts on paleoglaciology. As platelet-ice production is coupled to specific oceanographic conditions and plays a significant part in the mass balance of ice shelves, the extent of ice shelves and water currents may be inferred from the occurrence of platelet-ice algae in sediments.
Acknowledgements
We thank all participants in the 15th wintering at Neumayer station, especially J.Tanger, J. Rogenhagen, S. Hofinger and T. Schmidt for their assistance in the field. Thanks are due to F. Valero-Delgado for his patient help with the ice-texture analysis, and K.-H. George for the fruitful discussions on similarity indices. The manuscript benefited from discussions with R. Crawford and E. Noting. We thank R. Horner for a rigorous review of the manuscript. Our research at Neumayer station would not have been possible without the support of the Alfred Wegener Institute logistic staff.



