
Introduction
The use of environmental DNA (or eDNA) is rapidly becoming a routine tool for biodiversity monitoring and promises to be a valuable tool for parasitology (Harper et al., Reference Harper, Buxton, Rees, Bruce, Brys, Halfmaerten, Read, Watson, Sayer, Jones, Priestley, Mächler, Múrria, Garcés-Pastor, Medupin, Burgess, Benson, Boonham, Griffiths, Lawson Handley and Hänfling2019). The identification of parasites to species level via traditional methods is time-consuming and requires a high degree of expertize. Unfortunately, the number of experts with the necessary knowledge and skills may be in decline (Poulin and Presswell, Reference Poulin and Presswell2016). This taxonomic impediment could be partly circumvented by using DNA barcoding, which does not require taxon-specific knowledge. Furthermore, traditional methods of detecting, identifying and monitoring parasites generally require lethal sampling and dissection of host organisms. Not only does such sampling raise ethical and conservation concerns, but it is labour intensive, and it can easily fail to detect parasites that occur only in a small fraction of hosts – leading to false-negative results and a common failure to detect cryptic species (Beveridge and Gasser, Reference Beveridge and Gasser2014).
Most studies aiming to detect parasite eDNA to date have focused on single species detection methodologies, such as targeted qPCR using species-specific primers and probes, and such techniques have been shown to be more sensitive than metabarcoding approaches (Harper et al., Reference Harper, Handley, Hahn, Boonham, Rees, Gough, Lewis, Adams, Brotherton, Phillips and Hänfling2018). Species-specific eDNA methods have been shown to be more cost and time effective compared to traditional methods; for example using species-specific PCR primers to detect the pathogenic trematode Ribeiroia ondatrae (Huver et al., Reference Huver, Koprivnikar, Johnson and Whyard2015), qPCR designed for the detection of the pathogenic protozoan Chilodonella hexasticha in fish farms (Bastos Gomes et al., Reference Bastos Gomes, Hutson, Domingos, Chung, Hayward, Miller and Jerry2017) and the nematode Pseudocapillaria tomentosa in aquaria water (Norris et al., Reference Norris, Lawler, Hunkapiller, Mulrooney, Kent and Sanders2020). On the other hand, broad-scale metabarcoding studies have been conducted for biodiversity surveys focusing on identifying higher taxonomic groups which reduces time spent in the field compared to traditional methods. This approach is useful when DNA is likely to be at a high concentration, for instance using bat blood (Dario et al., Reference Dario, Moratelli, Schwabl, Jansen and Llewellyn2017) and primate faeces (Gogarten et al., Reference Gogarten, Calvignac-Spencer, Nunn, Ulrich, Saiepour, Nielsen, Deschner, Fichtel, Kappeler, Knauf, Müller-Klein, Ostner, Robbins, Sangmaneedet, Schülke, Surbeck, Wittig, Sliwa, Strube, Leendertz, Roos and Noll2020). In addition, a recent broad-scale metabarcoding study investigated platyhelminths in marine and freshwater environments; by placing data into a molecular phylogeny, novel clades were identified which could have been missed when using traditional methodologies (Mitsi et al., Reference Mitsi, Arroyo and Ruiz-Trillo2019).
Before the use of eDNA metabarcoding becomes a routine tool in parasitology, several questions must be addressed. Here, we will compare the species recovered using eDNA methodology against an independent benchmark: a recently completed, comprehensive and detailed data set compiled using traditional survey methodology providing precise data of the parasite diversity found in two sites in the Otago region (South Island, New Zealand): Tomahawk Lagoon and Lake Waihola. The objective of this study is to assess the use of eDNA for monitoring parasites at the ecosystem level. The reliability of eDNA metabarcoding as a proxy for traditional methods of parasite sampling is yet to be established a fact that prevents its acceptance as the method of choice.
Materials and methods
Field sampling
Sampling was conducted in two lakes, Tomahawk Lagoon (45.901°S, 170.545°E) and Lake Waihola (46.018°S, 170.082°E) where a robust estimate of abundance and biomass of all metazoan parasites has previously been obtained based on extensive surveys and dissections of large samples from all fish and invertebrate species (greater than 1 mm in length) (Lagrue and Poulin, Reference Lagrue and Poulin2016). Sampling was conducted towards the end of the austral summer (February 2020) when water temperatures were high and cercarial abundance (and thus eDNA) was expected to be at its maximum, therefore increasing the chance of parasite detection. The two lakes share many species of helminth parasites, although prevalence and intensity of infection are generally greater in Tomahawk than Waihola, resulting in higher parasite biomass (Table 1). Sampling for eDNA (see below) was conducted at two collection sites, corresponding exactly with two of the three sampling sites used by Lagrue and Poulin (Reference Lagrue and Poulin2016)
Trematode and cestode species, along with their total average biomass (mg m−2) across all hosts in the life cycle, found in Lake Waihola and Tomahawk Lagoon using traditional approaches, i.e. lethal dissection of hosts captured in each system and morphological identification (data from Lagrue and Poulin, Reference Lagrue and Poulin2016)

Water samples were collected in 1 L bottles that were previously soaked in 10% bleach to remove any potential contaminant DNA and then rinsed with molecular grade water to remove traces of bleach. At each of the two collection sites per lake, surface water was taken by partially submerging the bottles below the water surface; bottom samples were also taken by opening a bottle that was fully submerged and touching the bottom (about 0.5 m deep). This procedure was repeated, so that 3 L (each in a separate bottle) of surface water and 3 L of bottom water were obtained from each sampling point (3 surface samples + 3 bottom samples, ×2 sites = 12 samples per lake). Disposable latex gloves were worn during sampling and changed between sites. The water samples were put on ice prior to being returned to the laboratory where they were immediately filtered.
The water samples were filtered through a 1.0 μm nitrocellulose filter using a manifold pump [following the recommendations of Jeunen et al. (Reference Jeunen, Knapp, Spencer, Taylor, Lamare, Stat, Bunce and Gemmell2019)]. Filter funnels and forceps used to handle the filters were washed with 10% bleach and rinsed with distilled water between samples. When a filter became blocked with lake material, it was replaced and all filters used for the same sample were then pooled for DNA extraction. Negative filtration controls for each field site were added by filtering 1 L distilled water taken out into the field on the sampling day and thereafter treated the same way as genuine sample bottles. All filtering work was performed in a PCR-free clean room.
Primer design and in silica evaluation
Separate primers were developed for the parasitic phyla found in the study sites: Nematoda and Platyhelminthes. Primers were not designed for acanthocephalans because only a single species has been previously detected, in only one of the two lakes, and at low prevalence (Lagrue and Poulin, Reference Lagrue and Poulin2016). Mitochondrial COI sequences for these phyla were downloaded from BOLD and GenBank and clustered into operational taxonomic units (OTUs) using the R package PrimerMineR v0.18 (Elbrecht and Leese, Reference Elbrecht and Leese2017); subsequently, specific taxa were selected for each phylum based on what has previously been found in the sampling locations (Table 1). Sequences were aligned in Geneious Prime 2020 (http://www.geneious.com) using MAFFT v7.017 (Katoh and Standley, Reference Katoh and Standley2013). The consensus sequence generated in Geneious was used to design degenerate primers. Conserved regions were identified by eye in Geneious, primers were then designed for these conserved regions. PrimerMineR was then used to evaluate each primer against alignments for each phylum using the default settings.
DNA extraction and library preparation
The DNA was extracted from the filters using a Qiagen DNeasy Blood & Tissue Kit following the manufacturer's instructions. The PCR reactions were initially inhibited, so DNA extractions were diluted (1:10) using molecular grade water, which allowed for successful PCR amplification. We prepared the amplicon libraries via a two-step PCR strategy. The first-step PCR was conducted using MyTaq™ HS and our phylum-specific primers, with attached Illumina adapters (Table 2). The reaction mix included 5 μL of MyTaq Reaction Buffer, 2 μL of 10 μ m forward and reverse primers, 2 μL of template DNA, 0.25 μL of MyTaq HS DNA polymerase and 16 μL of molecular grade water to make a final reaction volume of 25 μL. Negative control for each field site was included using the same reaction mix but with 2 μL of molecular grade water instead of DNA. The thermocycling conditions were 95°C for 5 min, 38 cycles of 95°C for 30 s, 51°C for 30 s and 72°C for 2 min and then a final extension at 72°C for 7 min for one cycle. PCR products were visualized on a 1.5% agarose gel in a 1 × TAE buffer and the remaining PCR product was purified separately with magnetic beads as described in Rohland and Reich (Reference Rohland and Reich2012). 2 μL of purified DNA was used in the second-step PCR (barcoding step), where we used a Nextera XT index kit to attach dual indices to each PCR product of the first-step PCR. Here, the reaction mix was the same as the first-step PCR, except the primers were Nextera XT Index Kit primers instead of phylum-specific primers. The thermocycling conditions for the second stage PCR were 95°C for 3 min, eight cycles of 95°C for 30 s, 55°C for 30 s and 72°C for 30 s, and then a final extension at 72°C for 5 min. The PCR product was purified using magnetic beads (Rohland and Reich, Reference Rohland and Reich2012) and the DNA concentration of the purified products was measured using a Qubit HS assay. The PCR products were normalized for DNA concentration and pooled prior to sequencing.
Metabarcoding primers designed in this study.

Library quality control and MiSeq run
The pooled library concentration was quantified by Qubit HS assay; the library size was checked on a PerkinElmer LabChip® GX Touch HT instrument using the DNA High Sensitivity LabChip® Assay. qPCR was used to check if the library was suitable for MiSeq run and to help determine the final loading volume for the library. 10 μL of the 2 nm pooled library was denatured to single-stranded DNA with 10 μL 0.2 N NaOH (pH > 12.5) by mixing and incubating at room temperature for 5 min. Illumina PhiX Control v3 was diluted to 2 nm with 10 mm Tris pH 8.5 with 0.1% Tween 20, then denatured with 10 μL 0.2 N NaOH (pH >12.5) by mixing and incubating at room temperature for 5 min. The library was diluted to desired molarity and PhiX was diluted to 12.5 pm with ice-cold hybridization buffer (HT-1). Finally, 800 μL of the pooled library and 200 μL of PhiX were combined to give a calculated spike of 20% PhiX. The combined library was loaded into a thawed Illumina MiSeq V2 Nano kit cartridge for sequencing on the Illumina MiSeq platform using 250 bp paired-end reads.
All data generated by Illumina sequencing was QC checked using the following protocols: FastQC (https://www.bioinformatics.babraham.ac.uk/projects/fastqc/), FastQscreen (Wingett and Andrews, Reference Wingett and Andrews2018), SolexaQA + + (Cox et al., Reference Cox, Peterson and Biggs2010). Reads were mapped back to the PhiX control library to identify the known SNPs, using BWA (Li and Durbin, Reference Li and Durbin2010), samtools (Li et al., Reference Li, Handsaker, Wysoker, Fennell, Ruan, Homer, Marth, Abecasis and Durbin2009) and Varscan (Koboldt et al., Reference Koboldt, Chen, Wylie, Larson, McLellan, Mardis, Weinstock, Wilson and Ding2009).
Metabarcoding analysis
Metabarcoding reads recovered by paired-end sequencing were first aligned using the Illumina MiSeq analysis software under the default settings. To eliminate low-quality sequences, only reads matching 100% to Illumina adaptors, index barcodes and template specific oligonucleotides identified using Geneious were retained for downstream analysis. Forward and reverse reads were joined to obtain longer and higher-quality reads using PEAR v0.9.6 (Zhang et al., Reference Zhang, Kobert, Flouri and Stamatakis2014). Denoising, chimaera checking and clustering through dereplication was achieved using DADA2 (Zhang et al., Reference Zhang, Kobert, Flouri and Stamatakis2014). This step produced a list of identified Amplicon Sequence Variants (ASVs). To assign taxonomic information to the ASVs, each sequence was aligned against the NCBI GenBank nucleotide database using blastn (Altschul et al., Reference Altschul, Gish, Miller, Myers and Lipman1990).
Results
PCR amplification results
Two metabarcoding primer pairs were developed, one targeting platyhelminths (250 bp fragment) and the other nematodes (300 bp fragment). Both primer pairs targeted a region of the cytochrome c oxidase subunit I (COI). Both primer pairs were shown to amplify a clear band of the expected size range. All of the environmental samples produced a band of expected length in the expected region when amplified with nematode primers, whereas only three samples from Tomahawk Lagoon amplified a band using the platyhelminth primers. Only the environmental samples that produced a band for the first round of PCR were retained for further processing. Bands were not produced for any of the negative control PCRs but these were samples retained for further processing.
Sequencing and alignment results
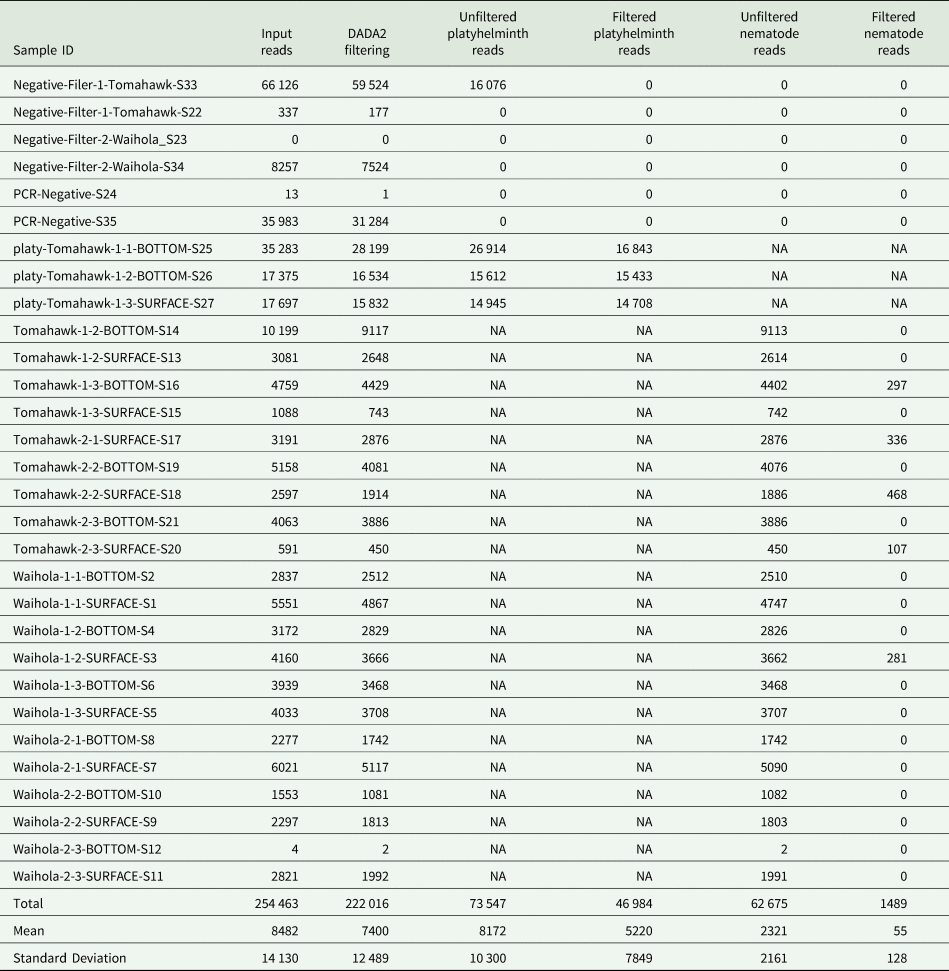
Total number of raw reads was 328 990 (Table 3) after quality filtering, 299 836 reads were retained for further analyses. Platyhelminth primers generated a total of 73 547 reads [46 984 reads on-target and 26 563 off-target organisms (here off-target refers to non-Platyhelminth organisms or contamination)], while the nematode primers generated a total of 62 675 reads [1489 on-target and 61 186 off-target organisms (here off-target refers to non-Nematode organisms or contamination)].
Total number of reads after de-multiplexing (input reads) for each sample produced by Illumina sequencing, including the number of reads retained after each filtering step: denoising with DADA2, followed by removal of off-target sequences or contamination

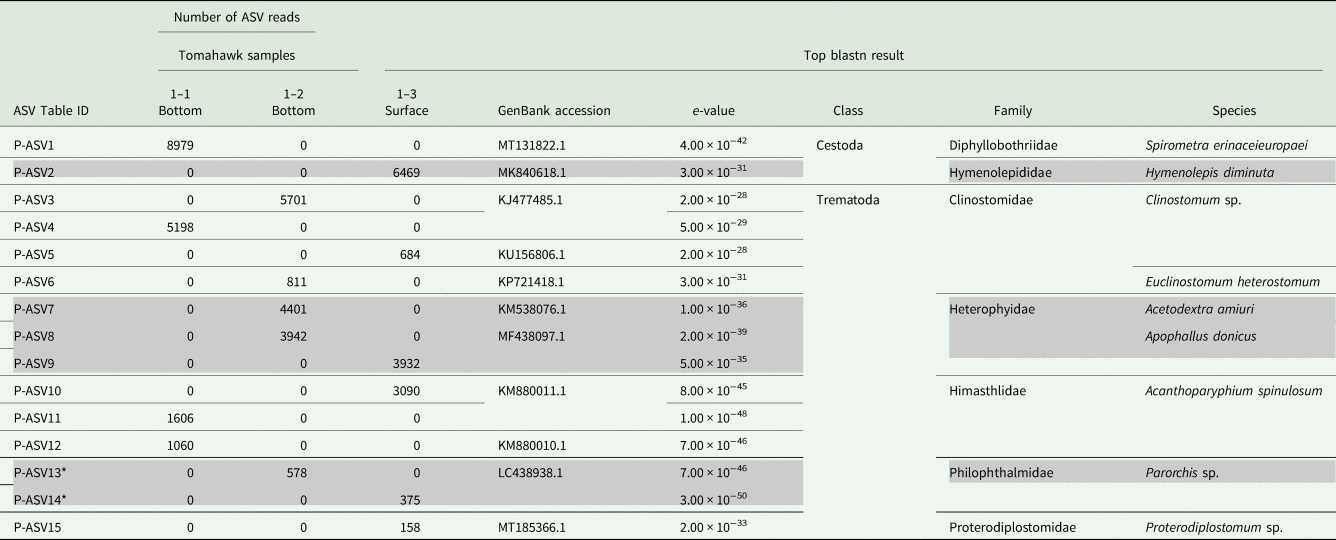
Further analysis of the reads produced by the Platyhelminth primers revealed 24 unique ASVs in Tomahawk lagoon, nine of which aligned to non-target organisms (Supplementary Material), and 15 of which aligned to platyhelminth sequences on GenBank. Two of these 15 ASVs aligned with two families within class Cestoda, and the remainder with five families within class Trematoda (Table 4). The three environmental samples from Tomahawk Lagoon yielded ASVs that were assigned to Platyhelminth species (4–6 ASVs per sample; Table 4).
Results (from 57 471 reads) for the platyhelminth primers tested on three samples from Tomahawk Lagoon. The listed ASVs successfully aligned to platyhelminth sequences on NCBI GenBank using blastn

The top blastn result is listed for each sequence, although these sequences are not necessarily exact sequence matches indicating successful genus- or species-level identification. ASVs sequenced from negative control samples were excluded, as were ASVs for non-target organisms such as fishes and mammals. No ASVs were sequenced from nematodes using the platyhelminth primers. ASV IDs (matching to Table IDs) and nucleotide sequences for all ASVs are provided in the Supplementary Material. P-ASV13 and P-ASV14 are marked with an asterisk (*), as an ASV amplified from a negative control sample aligned to the same sequence on GenBank. Rows are shaded to aid reading.
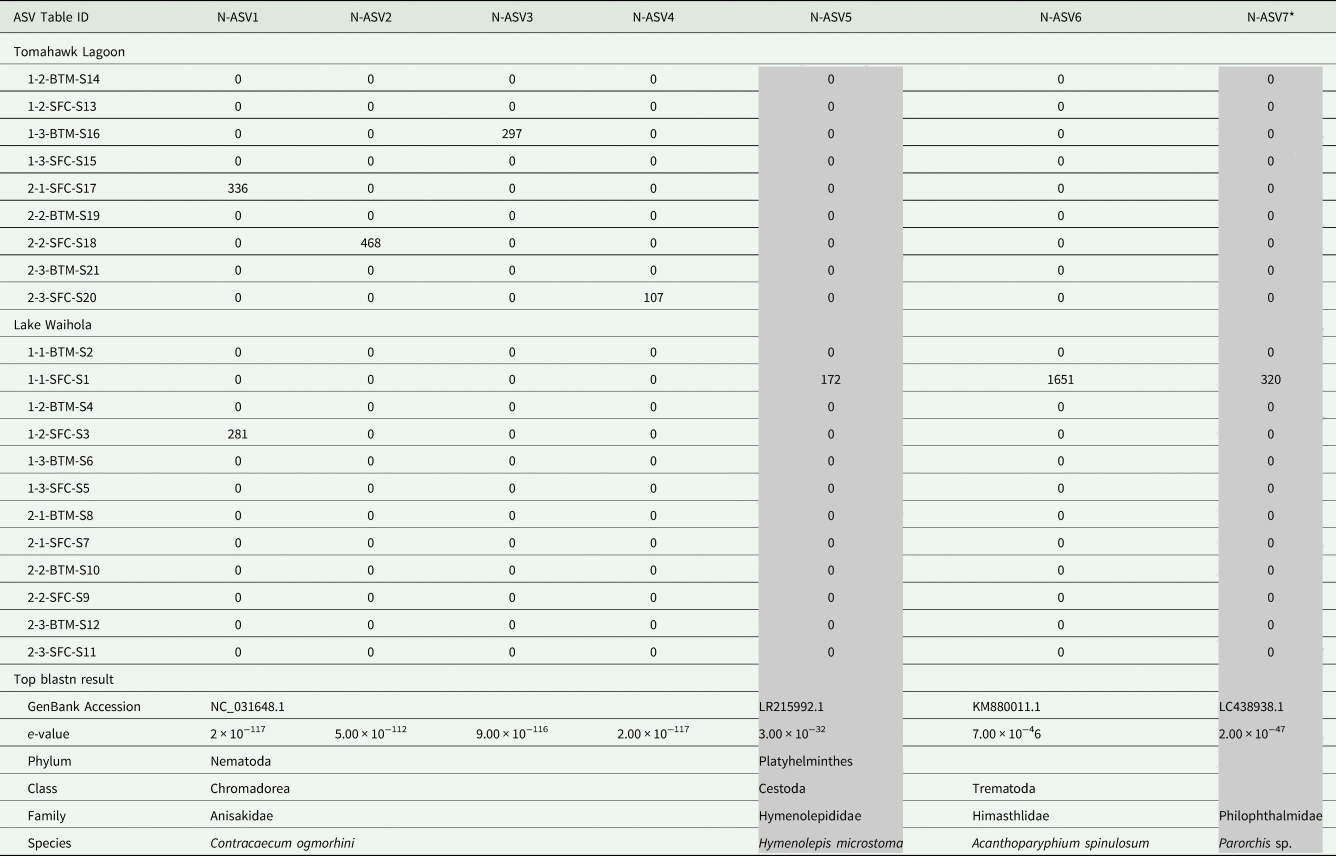
A total of 306 ASVs were amplified from the Tomahawk Lagoon and Lake Waihola samples, 299 of which aligned to non-target organisms (Supplementary Material), but seven aligned to a mixture of nematode and platyhelminth sequences on GenBank (Table 5). Four of the seven ASVs aligned to the same COI sequence for the nematode species Contracaecum ogmorhini, and the remaining three sequences aligned to three records representing three species of platyhelminths, belonging to one family within class Cestoda and two families within class Trematoda (Table 5). Overall, 4/9 and 2/12 environmental samples from Tomahawk Lagoon and Lake Waihola respectively yielded parasite ASVs (nematode or platyhelminth; Table 5).
Results (from 62 675 reads) for the nematode primers tested on nine samples from Tomahawk Lagoon and 12 samples from Lake Waihola

The listed ASVs successfully aligned to nematode or platyhelminth sequences on NCBI GenBank using blastn. The top blastn result is listed for each sequence, although these sequences are not necessarily exact sequence matches indicating successful genus- or species-level identification. ASVs sequenced from negative control samples were excluded, as were ASVs for non-target organisms such as fishes and mammals. ASV IDs (matching to Table IDs) and nucleotide sequences for all ASVs are provided in the Supplementary Material. N-ASV7 is marked with an asterisk (*), as an ASV amplified from a negative control sample aligned to the same sequence on GenBank. Columns are shaded to aid reading.
Twenty ASVs were amplified from the negative control (molecular grade water and negative PCR control) samples using both sets of metabarcoding primers simultaneously (Supplementary Material). One of these ASVs (amplified from a Tomahawk Lagoon negative control) was also amplified from a Tomahawk Lagoon environmental sample using the platyhelminth primers. This ASV aligned with a sequence for the platyhelminth Parorchis sp. (LC438938.1; e-value: 7 × 10−46). Three ASVs amplified from the environmental samples using both sets of primers (P-ASV13, P-ASV14, and N-ASV7) also aligned to the same sequence on GenBank [marked with an asterisk (*) in Tables 4 and 5]. No other ASVs amplified from the negative control samples appeared in the environmental sample results. Between the two primer datasets, two ASVs amplified from Lake Waihola and Tomahawk Lagoon aligned to sequences for separate species of Hymenolepis platyhelminths.
Discussion
With climate change and environmental degradation likely to affect the distribution, prevalence, or severity of diseases in freshwater ecosystems (Altizer et al., Reference Altizer, Ostfeld, Johnson, Kutz and Harvell2013), there is an urgent need to establish efficient monitoring programmes to track changes in the local diversity, prevalence and abundance of aquatic parasites. However, traditional methods to survey parasites, i.e. through dissections of hosts, should be replaced by more efficient and ethical sampling methods. Here, we evaluated the usefulness of environmental DNA as a tool to capture total parasite diversity in lake ecosystems from a few water samples.
Our platyhelminth primers successfully amplified platyhelminth DNA from samples collected from Tomahawk Lagoon. In contrast, the nematode primers amplified parasite DNA (nematode or platyhelminth) from 4/9 and 2/12 samples from Tomahawk Lagoon and Lake Waihola, respectively. The platyhelminth primers were more specific for the amplification of platyhelminth DNA (9/24 of amplified ASVs for non-target organisms), whereas the nematode primers appeared to be far less specific (likely due to the higher level of degeneracy in the primer design) and amplified a wide range of organisms (299/306 ASVs for non-target organisms; Supplementary Material). Using both sets of primers, many ASVs aligned with the same sequences on GenBank despite none of the ASVs being identical. This result may reflect limited taxonomic representation in the GenBank database: some phyla found at the study site do not have any COI sequences available on NCBI or BOLD (Table 6). Furthermore, many of the species identified in the lakes using the traditional methodology have not been previously sequenced and so they are absent from the GenBank database. Alternatively, the primers may have amplified similar but distinct mitochondrial haplotypes – either within the same species or divided across closely related taxa. A necessary step to fully utilize eDNA methodologies for routine parasite biodiversity assessment is to first build a reference database for every parasite of interest. Therefore, at this stage, this means going back to traditional parasitology methods to obtain, identify and then sequence each parasite, before eDNA can become a routine monitoring tool.
Numbers of genetic sequences available on GenBank and BOLD for the mitochondrial COI gene region for the parasite taxa that were identified using traditional methodology

The clusters per taxonomic order are the number of remaining genetic sequences once the package PrimerMineR has dereplicated and clustered sequences.
The nematode primers yielded fewer reads for the successfully aligned ASVs, compared to the platyhelminth primers (Tables 4 and 5). This pattern was probably affected by the amplification of many more ASVs under the less specific nematode primers, which would have led to competition for resources during PCR amplification. Overall, to assess parasite diversity using an eDNA methodology, we recommend designing primers that have a higher level of specificity towards more recently derived clades, rather than less specific primers that may universally amplify a wide range of non-target organisms.
Currently, we were unable to match the ASVs obtained here to the expected species (identified using traditional methods), but this is likely a problem that could be resolved with a complete reference database. However, four ASVs from a Lake Waihola sample aligned with sequences of Contracaecum ogmorhini, belonging to the family Anisakidae (amplified using the nematode primers; Table 5). These ASVs may represent a nematode species recorded in the taxonomic survey of the lakes, which was identified to the family level within Anisakidae and found within yellow-eye mullet Aldrichetta forsteri (Supplementary Material). Alternatively, these ASVs could actually represent Contracaecum ogmorhi or O. mirounga, as these species have been recorded as parasites for New Zealand pinnipeds (Lehnert et al., Reference Lehnert, Poulin and Presswell2019; Shamsi, Reference Shamsi2019) and New Zealand fur seals Arctocephalus forsteri are known to occasionally enter Lake Waihola.
An ASV amplified from a negative control sample from Tomahawk Lagoon aligned to a Parorchis sp. sequence also present in the environmental sample results (Tables 4 and 5). It is therefore possible that three ASVs amplified from the environmental samples represent contamination. However, none of these ASVs were identical and therefore the shared top blastn hit may reflect limited taxonomic diversity in the GenBank database.
The platyhelminth primers were only able to amplify DNA from Tomahawk Lagoon, and this is likely due to the much greater platyhelminth biomass found in this lake through traditional sampling methods (Table 1). In general, the number of ASVs was greater for platyhelminths than nematodes, and this may be due to differing life histories. Trematodes have a free-swimming life stage, and it is, therefore, possible that the concentration of trematode DNA in the water was higher than nematode DNA, because nematodes are contained within the host organism and they do not have a free-swimming stage. Indeed, even cestode eDNA was captured at a similar frequency as nematodes, and both of these parasites are internal, with no free-swimming stage. Nevertheless, our results highlight that eDNA can be useful for capturing both strictly internal parasites, as well as parasites that have free-swimming stages.
In conclusion, while we were able to detect parasite DNA from a range of parasite taxa, there was a large mismatch between the parasites identified using the eDNA methodology and those found using traditional methodologies. Importantly, we used negative controls at all stages of the study, which is a step that is often recommended but not always implemented in eDNA studies. Successful amplification in negative control samples is quite common in eDNA studies, especially at the field sampling stage, and the majority of eDNA metabarcoding studies use amplification in negative control samples to determine the level of background noise (Sepulveda et al., Reference Sepulveda, Hutchins, Forstchen, Mckeefry and Swigris2020). Here, we have used amplification in the negative controls to identify false-positive results that were likely the product of sample contamination. Using eDNA methodology did not reveal any of the parasite families we expected to recover, this is most likely due to the lack of genetic data available for New Zealand parasites in general. A stumbling block of the present study is the lack of genetic information for New Zealand parasites sequences available in genetic databases. If eDNA is to be used as a monitoring tool, we recommend the use of custom metabarcodes designed with target taxa in mind and most importantly, we recommend building a custom genetic database comprised of the organisms of interest. As suggested by Collins et al. (Reference Collins, Bakker, Wangensteen, Soto, Corrigan, Sims, Genner and Mariani2019) such a genetic database would be constructed using whole mitogenomes, which would open up the possibility of using different gene regions – in turn improving specificity and species identification and possibly reducing the problems associated with non-target amplification.
Supplementary material
The supplementary material for this article can be found at: https://doi.org/10.1017/S0031182021001840
Data
Jonined reads are available at: https://www.researchgate.net/publication/357776533_joined_reads
Acknowledgements
Eirik Haugstvedt Henriksen assisted with field work. Tania King and Bruce Roberts provided advice with laboratory procedures. We thank the two anonymous reviewers for their careful and detailed suggestions on earlier drafts have greatly improved this manuscript.
Author contributions
Conceptualization: RP and LJT. Methodology: LJT and MM. Formal analysis and Investigation: LJT, MM, FV. Writing: All authors. Funding acquisition: RP.
Financial support
This research was funded by a University of Otago Research Grant to R. Poulin.
Conflict of interest
The authors declare there are no conflicts of interest.
Ethical standards
Not applicable.