



1 Introduction
Interfacial instability due to parametric excitation of a fluid interface was shown in experiments by Faraday (Reference Faraday1831), who demonstrated that resonance between the natural frequency of the fluid and the parametric frequency renders the interface unstable. Rayleigh (Reference Rayleigh1833) showed that patterns typically arise subharmonic to the forcing frequency, although for very thin liquid films of thickness comparable to the viscous boundary layer, the instability may arise as a harmonic response (Kumar Reference Kumar1996). Once unstable, the interface may undergo a subcritical breakup or saturate nonlinearly to one of several patterns such as stripes, hexagons, squares or triangles (Douady Reference Douady1990; Müller Reference Müller1993; Edwards & Fauve Reference Edwards and Fauve1994). The instability can be excited using various modes of forcing, namely mechanical motion of the fluid-carrying container (Benjamin & Ursell Reference Benjamin and Ursell1954; Kumar & Tuckerman Reference Kumar and Tuckerman1994), imposition of a time-periodic electrostatic field (Yih Reference Yih1968) or use of acoustic waves (Tsai & Tsai Reference Tsai and Tsai2013).
Electrostatically induced Faraday instability has received far less attention compared with mechanically forced Faraday instability. Yih (Reference Yih1968) theoretically showed that the linear response of an inviscid perfectly conducting fluid is described by a Mathieu equation. Recently, Bandopadhyay & Hardt (Reference Bandopadhyay and Hardt2017) extended Yih’s linear analysis to include the effects of viscosity. Ward, Matsumoto & Narayanan (Reference Ward, Matsumoto and Narayanan2018) and Ward (Reference Ward2018) determined linear stability thresholds for finite-depth leaky dielectric fluids and also provided experimental confirmation. Most electrohydrodynamic studies have been restricted to either time-independent DC forcing (Saville Reference Saville1997; Wu & Chou Reference Wu and Chou2003; Craster & Matar Reference Craster and Matar2005; Thaokar & Kumaran Reference Thaokar and Kumaran2005) or periodic AC forcing under creeping flow conditions (Roberts & Kumar Reference Roberts and Kumar2009; Gambhire & Thaokar Reference Gambhire and Thaokar2010). Lubrication models based on the thin-film approximation have been successful in capturing the ‘pillaring’ instability of the interface observed experimentally in lithographically induced self-assembly applications (Wu & Chou Reference Wu and Chou2003). Roberts & Kumar (Reference Roberts and Kumar2009) showed that the geometric features of these pillars can be tuned as desired using a periodic AC forcing. Due to the absence of momentum inertia in their model, no resonant behaviour was reported. A necessary condition for resonant Faraday-type behaviour is the coupling of interface dynamics with another dynamic variable to generate a natural frequency of oscillation in the system. This may occur due to the presence of either momentum inertia (Benjamin & Ursell Reference Benjamin and Ursell1954) or non-inertial effects such as fluid elasticity (Suman & Kumar Reference Suman and Kumar2008), or even the presence of an insoluble surfactant at the interface, where Marangoni driven dynamics occurs (Kumar & Matar Reference Kumar and Matar2002; Matar, Kumar & Craster Reference Matar, Kumar and Craster2004).
Inertial lubrication models have been successfully employed to obtain nonlinear patterns formed as a consequence of mechanical Faraday instability (Rojas et al. Reference Rojas, Argentina, Erda and Tirapegui2010; Bestehorn Reference Bestehorn2013). In the current work, an inertial lubrication model based on the weighted residual integral boundary layer (WRIBL) method (Ruyer-Quil & Manneville Reference Ruyer-Quil and Manneville2002) is developed for electrostatic Faraday instability in thin films. Inertial thin films are shown to exhibit Faraday modes, in addition to the long-wavelength pillaring mode. The long-wavelength pillaring-type instability is shown to evolve in a subcritical manner, with the interface approaching either wall depending on the liquid–gas holdup. The Faraday modes exhibit standing waves of either subharmonic or harmonic nature, with the amplitude of oscillations increasing with the forcing amplitude, and the interface may approach either wall depending on the liquid–gas holdup. Finally, we explore the possibility of Rayleigh–Taylor (RT) stabilization using periodic electrostatic forcing and show, using the long-wave model, that RT instability is only further enhanced, unlike stabilization reported by mechanical Faraday forcing (Sterman-Cohen, Bestehorn & Oron Reference Sterman-Cohen, Bestehorn and Oron2017) or electrical forcing parallel to the interface (Cimpeanu, Papageorgiou & Petropoulos Reference Cimpeanu, Papageorgiou and Petropoulos2014).
2 Mathematical model
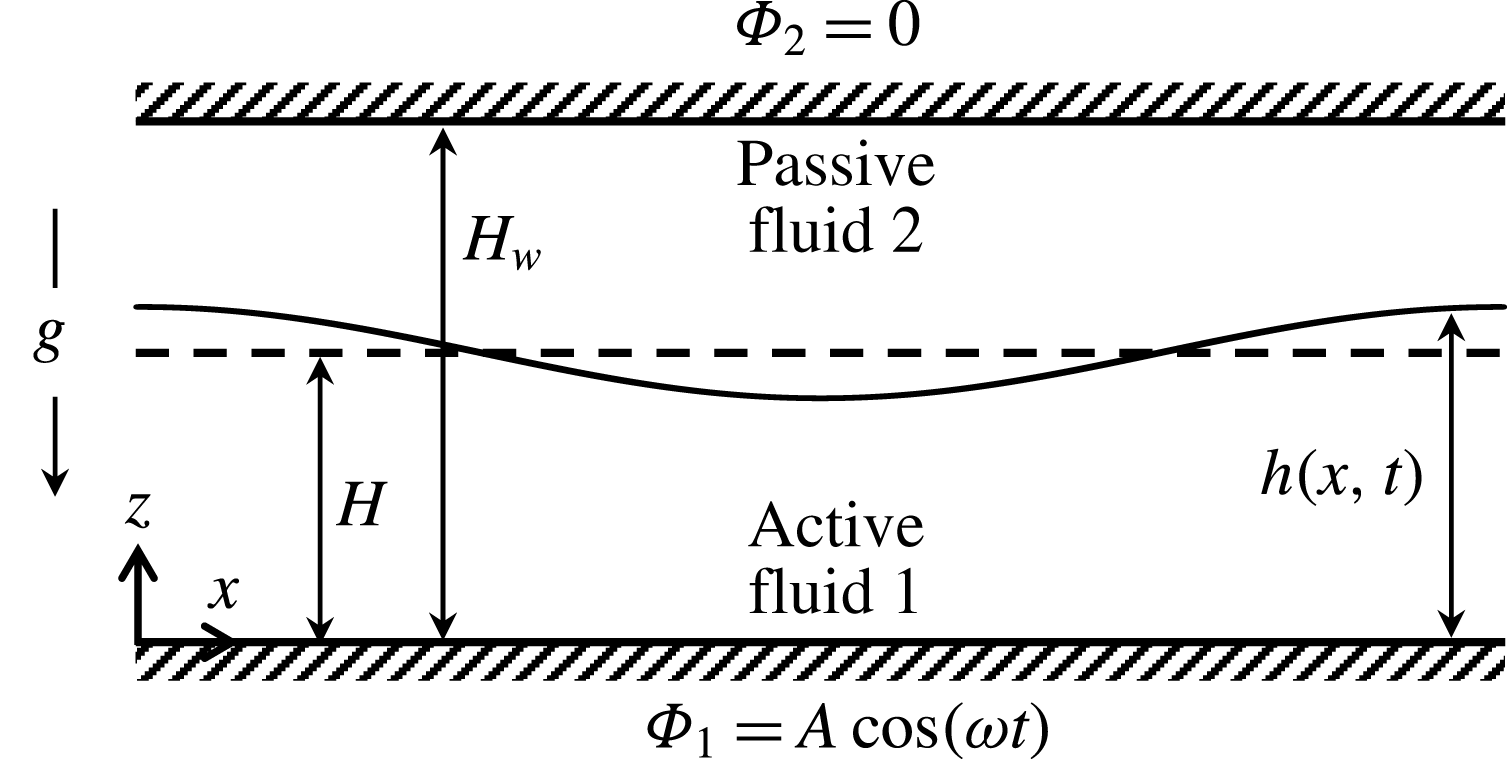
We consider an interface separating a hydrodynamically active Newtonian fluid 1 with constant properties and a passive fluid 2, as shown in figure 1. The density, viscosity and surface tension are denoted by
 $\unicode[STIX]{x1D70C}$
,
 $\unicode[STIX]{x1D707}$
and
 $\unicode[STIX]{x1D6FE}$
. The horizontal and vertical components of the velocity vector (
 $\boldsymbol{v}$
) are denoted by
 $u$
and
 $w$
. Fluid 1 is taken to be a perfect conductor, while fluid 2 is taken to be a perfect dielectric, a valid assumption for fluid pairs such as the water–air system. The bottom wall (
 $z=0$
) is held at a potential
 $\unicode[STIX]{x1D6F7}_{1}=A\cos (\unicode[STIX]{x1D714}t)$
, where
 $\unicode[STIX]{x1D714}=2\unicode[STIX]{x03C0}f$
and
 $f$
is the parametric forcing frequency. The top wall (
 $z=H_{w}$
) is grounded, i.e.
 $\unicode[STIX]{x1D6F7}_{2}=0$
. The charge relaxation time that characterizes the electrical effects is typically much larger than the magnetic time scale for fluids such as water and air, and hence the electrostatic assumption is used (Saville Reference Saville1997). The long-wave approximation is used, i.e.
 $H\ll \unicode[STIX]{x1D6EC}$
, where
 $\unicode[STIX]{x1D6EC}$
is the characteristic horizontal length scale arising from the instability. It should be noted that the long-wave approximation is only valid as long as the characteristic length scale of the ensuing instability in the lateral direction is significantly large compared with the film thickness. The results of the model are therefore not valid for considerably short-wave Faraday modes that may be excited by very high forcing frequencies.
Schematic of electrostatically forced Faraday instability. Fluid 1 is hydrodynamically active while fluid 2 is passive. Both fluids are confined between flat plates subject to electrostatic forcing as shown.
2.1 Governing equations
Fluid 1 is hydrodynamically active and satisfies the continuity and Navier–Stokes equations. Moreover, as it is a perfect conductor, the electrostatic potential everywhere in the domain equals the bottom wall potential. These equations are given by
 $$\begin{eqnarray}\unicode[STIX]{x1D735}\boldsymbol{\cdot }\boldsymbol{v}_{1}=0,\quad \unicode[STIX]{x1D70C}_{1}\left(\frac{\unicode[STIX]{x2202}\boldsymbol{v}_{1}}{\unicode[STIX]{x2202}t}+\boldsymbol{v}_{1}\boldsymbol{\cdot }\unicode[STIX]{x1D735}\boldsymbol{v}_{1}\right)=\unicode[STIX]{x1D735}\boldsymbol{\cdot }\unicode[STIX]{x1D64F}_{1}-\unicode[STIX]{x1D70C}_{1}g\boldsymbol{i}_{z},\quad \unicode[STIX]{x1D6F7}_{1}=A\cos (\unicode[STIX]{x1D714}t).\end{eqnarray}$$
Here,
 $\unicode[STIX]{x1D64F}_{1}=-p_{1}\unicode[STIX]{x1D644}+\unicode[STIX]{x1D707}_{1}(\unicode[STIX]{x1D735}\boldsymbol{v}_{1}+\unicode[STIX]{x1D735}\boldsymbol{v}_{1}^{\text{T}})$
,
 $\boldsymbol{i}_{z}$
is the unit vector along the positive
 $z$
direction and
 $\unicode[STIX]{x1D644}$
is the identity tensor. For fluid 2, the electric field,
 $\boldsymbol{E}_{2}=-\unicode[STIX]{x1D735}\unicode[STIX]{x1D6F7}_{2}$
, satisfies Gauss’s law,
 $$\begin{eqnarray}\unicode[STIX]{x1D6FB}^{2}\unicode[STIX]{x1D6F7}_{2}=0,\quad \text{subject to }\unicode[STIX]{x1D6F7}_{2}(h)=A\cos (\unicode[STIX]{x1D714}t)\quad \text{and}\quad \unicode[STIX]{x1D6F7}_{2}(H_{w})=0.\end{eqnarray}$$
The interface speed (
 ${\mathcal{U}}$
), the unit normal vector (
 $\boldsymbol{n}$
) and the unit tangent vector (
 $\boldsymbol{t}$
) are given by
 $$\begin{eqnarray}{\mathcal{U}}=\frac{\displaystyle \frac{\unicode[STIX]{x2202}h}{\unicode[STIX]{x2202}t}}{\displaystyle \left[1+\left(\frac{\unicode[STIX]{x2202}h}{\unicode[STIX]{x2202}x}\right)^{2}\right]^{1/2}},\quad \boldsymbol{n}=\frac{\displaystyle -\frac{\unicode[STIX]{x2202}h}{\unicode[STIX]{x2202}x}\boldsymbol{i}_{x}+\boldsymbol{i}_{z}}{\displaystyle \left[1+\left(\frac{\unicode[STIX]{x2202}h}{\unicode[STIX]{x2202}x}\right)^{2}\right]^{1/2}}\quad \text{and}\quad \boldsymbol{t}=\frac{\displaystyle \boldsymbol{i}_{x}+\frac{\unicode[STIX]{x2202}h}{\unicode[STIX]{x2202}x}\boldsymbol{i}_{z}}{\displaystyle \left[1+\left(\frac{\unicode[STIX]{x2202}h}{\unicode[STIX]{x2202}x}\right)^{2}\right]^{1/2}}.\end{eqnarray}$$
At the fluid–fluid interface,
 $\boldsymbol{v}_{1}\boldsymbol{\cdot }\boldsymbol{n}-{\mathcal{U}}=0$
must hold since it is a material surface, while the interfacial stress balances are given by
 $$\begin{eqnarray}\boldsymbol{n}\boldsymbol{\cdot }\unicode[STIX]{x1D64F}_{1}\boldsymbol{\cdot }\boldsymbol{t}=0\quad \text{and}\quad \boldsymbol{n}\boldsymbol{\cdot }\unicode[STIX]{x1D64F}_{1}\boldsymbol{\cdot }\boldsymbol{n}-\boldsymbol{n}\boldsymbol{\cdot }\unicode[STIX]{x1D648}_{2}\boldsymbol{\cdot }\boldsymbol{n}=-\unicode[STIX]{x1D6FE}\unicode[STIX]{x1D735}\boldsymbol{\cdot }\boldsymbol{n},\end{eqnarray}$$
where
 $\unicode[STIX]{x1D648}_{2}=\unicode[STIX]{x1D700}_{0}\unicode[STIX]{x1D700}_{2}[\boldsymbol{E}_{2}\boldsymbol{E}_{2}-1/2(\boldsymbol{E}_{2}\boldsymbol{\cdot }\boldsymbol{E}_{2})\unicode[STIX]{x1D644}]$
is the Maxwell stress exerted by fluid 2 (Saville Reference Saville1997). We now derive the long-wave model based on the separation of length scales.
2.2 Long-wave model
The governing equations are non-dimensionalized using the following scales, denoted by the subscript ‘
 $c$
’:
 $$\begin{eqnarray}x_{c}=\unicode[STIX]{x1D6EC},\quad z_{c}=H,\quad u_{c}=U,\quad w_{c}=\unicode[STIX]{x1D716}U,\quad t_{c}=\unicode[STIX]{x1D6EC}/U,\quad p_{c}=\unicode[STIX]{x1D707}_{1}U/H,\quad \unicode[STIX]{x1D6F7}_{i,c}=A.\end{eqnarray}$$
Here,
 $\unicode[STIX]{x1D716}$
is a small parameter defined as
 $\unicode[STIX]{x1D716}=H/\unicode[STIX]{x1D6EC}$
, known as the ‘film parameter’. The characteristic velocity scale,
 $U$
, is determined from the forcing frequency and given by
 $U=\unicode[STIX]{x1D714}H/2\unicode[STIX]{x03C0}$
or
 $U=Hf$
. Using the above scales, the non-dimensional flow equations, retaining terms up to
 $O(\unicode[STIX]{x1D716})$
and dropping higher-order terms, are obtained as
 $$\begin{eqnarray}\frac{\unicode[STIX]{x2202}u_{1}}{\unicode[STIX]{x2202}x}+\frac{\unicode[STIX]{x2202}w_{1}}{\unicode[STIX]{x2202}z}=0,\quad -\unicode[STIX]{x1D716}\frac{\unicode[STIX]{x2202}p_{1}}{\unicode[STIX]{x2202}z}-\unicode[STIX]{x1D716}G=0,\quad \text{where }G=\frac{\unicode[STIX]{x1D70C}_{1}gH^{2}}{\unicode[STIX]{x1D707}_{1}U},\end{eqnarray}$$
and
 $$\begin{eqnarray}\unicode[STIX]{x1D716}Re\left(\frac{\unicode[STIX]{x2202}u_{1}}{\unicode[STIX]{x2202}t}+u_{1}\frac{\unicode[STIX]{x2202}u_{1}}{\unicode[STIX]{x2202}x}+w_{1}\frac{\unicode[STIX]{x2202}u_{1}}{\unicode[STIX]{x2202}z}\right)=-\unicode[STIX]{x1D716}\frac{\unicode[STIX]{x2202}p_{1}}{\unicode[STIX]{x2202}x}+\frac{\unicode[STIX]{x2202}^{2}u_{1}}{\unicode[STIX]{x2202}z^{2}},\quad \text{where }Re=\frac{\unicode[STIX]{x1D70C}_{1}\,UH}{\unicode[STIX]{x1D707}_{1}}.\end{eqnarray}$$
To obtain the above governing equations,
 $Re$
is taken to be at most
 $O(1)$
, while
 $G$
to be at least
 $O(1)$
. The no-slip and no-penetration conditions are given as
 $u_{1}(0)=w_{1}(0)=0$
. Now, turning to the electrostatic equations, we obtain
 $\unicode[STIX]{x1D6F7}_{1}=\cos (2\unicode[STIX]{x03C0}t)$
. For fluid 2, we obtain
 $\unicode[STIX]{x2202}^{2}\unicode[STIX]{x1D6F7}_{2}/\unicode[STIX]{x2202}z^{2}=0$
from (2.1b
), subject to the boundary conditions,
 $\unicode[STIX]{x1D6F7}_{2}(h)=\cos (2\unicode[STIX]{x03C0}t)$
and
 $\unicode[STIX]{x1D6F7}_{2}(\unicode[STIX]{x1D6FD})=0$
, where
 $\unicode[STIX]{x1D6FD}=H_{w}/H$
. Solving for
 $\unicode[STIX]{x1D6F7}_{2}$
, we obtain
 $\unicode[STIX]{x1D6F7}_{2}=(\unicode[STIX]{x1D6FD}-z)/(\unicode[STIX]{x1D6FD}-h)\cos (2\unicode[STIX]{x03C0}t)$
.
The tangential and normal stress balance at the interface (
 $z=h$
) gives
 $$\begin{eqnarray}\frac{\unicode[STIX]{x2202}u_{1}}{\unicode[STIX]{x2202}z}=0\quad \text{and}\quad p_{1}=-E\left(\frac{\unicode[STIX]{x2202}\unicode[STIX]{x1D6F7}_{2}}{\unicode[STIX]{x2202}z}\right)^{2}-\frac{\unicode[STIX]{x1D716}^{2}}{Ca}\frac{\unicode[STIX]{x2202}^{2}h}{\unicode[STIX]{x2202}x^{2}},\quad \text{where }E=\frac{\unicode[STIX]{x1D700}_{0}\unicode[STIX]{x1D700}_{2}}{\unicode[STIX]{x1D707}_{1}UH}\frac{A^{2}}{2},Ca=\unicode[STIX]{x1D707}_{1}U/\unicode[STIX]{x1D6FE}.\end{eqnarray}$$
In the above,
 $Ca$
is taken to be at most
 $O(\unicode[STIX]{x1D716}^{2})$
, which corresponds to the large-surface-tension limit, true for fluids such as water or liquid metal conductors. In addition,
 $E$
is taken to be at least
 $O(1)$
. Using a rough order of magnitude analysis for the water–air system, it can be verified that all of the approximations made in the model are practical. Taking
 $\unicode[STIX]{x1D70C}_{1}\sim O(10^{3})$
,
 $\unicode[STIX]{x1D707}_{1}\sim O(10^{-3})$
,
 $\unicode[STIX]{x1D6FE}\sim O(10^{-1})$
,
 $f\sim O(1)$
,
 $H\sim O(10^{-3})$
,
 $\unicode[STIX]{x1D700}_{2}\sim O(1)$
,
 $\unicode[STIX]{x1D700}_{0}\sim O(10^{-11})$
and
 $A\sim O(10^{3})$
, it can be verified that all parameters (
 $Re,G,Ca$
and
 $E$
) satisfy the order of magnitude assignments made in the model.
By integrating the continuity equation and using the kinematic condition, we obtain
 $\unicode[STIX]{x2202}h/\unicode[STIX]{x2202}t=-\unicode[STIX]{x2202}q/\unicode[STIX]{x2202}x$
, where
 $q$
is the flow rate given by
 $q=\int _{0}^{h}u_{1}\,\text{d}z$
. By integrating the vertical component of momentum balance and eliminating pressure using (2.6) and (2.7), we obtain
 $$\begin{eqnarray}\unicode[STIX]{x1D716}Re\left(\frac{\unicode[STIX]{x2202}u_{1}}{\unicode[STIX]{x2202}t}+u_{1}\frac{\unicode[STIX]{x2202}u_{1}}{\unicode[STIX]{x2202}x}+w_{1}\frac{\unicode[STIX]{x2202}u_{1}}{\unicode[STIX]{x2202}z}\right)=\unicode[STIX]{x1D716}E\frac{\unicode[STIX]{x2202}}{\unicode[STIX]{x2202}x}\left(\frac{\unicode[STIX]{x2202}\unicode[STIX]{x1D6F7}_{2}}{\unicode[STIX]{x2202}z}\right)^{2}+\frac{\unicode[STIX]{x1D716}^{3}}{Ca}\frac{\unicode[STIX]{x2202}^{3}h}{\unicode[STIX]{x2202}x^{3}}-\unicode[STIX]{x1D716}G\frac{\unicode[STIX]{x2202}h}{\unicode[STIX]{x2202}x}+\frac{\unicode[STIX]{x2202}^{2}u_{1}}{\unicode[STIX]{x2202}z^{2}}.\end{eqnarray}$$
We now use the weighted residual technique as described by Ruyer-Quil & Manneville (Reference Ruyer-Quil and Manneville2002) to derive the set of reduced-order evolution equations that govern the interface position,
 $h(x,t)$
, and flow rate,
 $q(x,t)$
. Towards this end, we first decompose the horizontal velocity component as follows:
 $$\begin{eqnarray}u_{1}(x,z,t)=\underbrace{\hat{u} _{1}(x,z,t)}_{O(1)}+\underbrace{\tilde{u} _{1}(x,z,t)}_{O(\unicode[STIX]{x1D716})},\quad w_{1}=-\!\int _{0}^{z}\frac{\unicode[STIX]{x2202}u_{1}}{\unicode[STIX]{x2202}x}\,\text{d}z.\end{eqnarray}$$
Here,
 $\hat{u} _{1}$
is the
 $O(1)$
contribution to the velocity while
 $\tilde{u} _{1}$
denotes the
 $O(\unicode[STIX]{x1D716})$
correction. The vertical component of velocity,
 $w_{1}$
, as shown in (2.9b
), is then obtained by integrating the continuity equation. The leading-order velocity,
 $\hat{u} _{1}$
, is chosen to be locally parabolic at each horizontal position. This assumption is justified for moderate Reynolds numbers. Thus,
 $\hat{u} _{1}$
is determined using the following equations:
 $$\begin{eqnarray}\frac{\unicode[STIX]{x2202}^{2}\hat{u} _{1}}{\unicode[STIX]{x2202}z^{2}}=K_{u},\quad \hat{u} _{1}|_{0}=0,\quad \left.\frac{\unicode[STIX]{x2202}\hat{u} _{1}}{\unicode[STIX]{x2202}z}\right|_{h}=0,\quad \int _{0}^{h}\hat{u} _{1}\,\text{d}z=q.\end{eqnarray}$$
Here,
 $K_{u}$
is introduced so that the leading-order velocity profile is locally parabolic, and is obtained in terms of the flow rate,
 $q$
, using the integral constraint in (2.10d
). Next, we substitute for velocity as given by (2.9) in (2.8) and neglect all terms of
 $O(\unicode[STIX]{x1D716}\tilde{u} _{1})=O(\unicode[STIX]{x1D716}^{2})$
or smaller. Thus, the velocity corrections that appear in the inertial terms (left-hand side of (2.8)) are ignored. The only term that still contains the
 $O(\unicode[STIX]{x1D716})$
term,
 $\tilde{u} _{1}$
, is due to viscous diffusion. This term is eliminated by taking a weighted integral of (2.8) with a suitable weight function. We use the Galerkin method, wherein the weight function has the same functional form as the leading-order velocity, as it is the most efficient choice of weight function (Ruyer-Quil & Manneville Reference Ruyer-Quil and Manneville2002). The weight function,
 $F$
, is then defined as follows:
 $$\begin{eqnarray}\frac{\unicode[STIX]{x2202}^{2}F}{\unicode[STIX]{x2202}z^{2}}=1,\quad F|_{0}=0,\quad \left.\frac{\unicode[STIX]{x2202}F}{\unicode[STIX]{x2202}z}\right|_{h}=0.\end{eqnarray}$$
Using the weighted residual strategy, the diffusion term now gives
 $\int _{0}^{h}F(\unicode[STIX]{x2202}^{2}u_{1}/\unicode[STIX]{x2202}z^{2})\,\text{d}z=q$
upon integration by parts. The WRIBL equation obtained from (2.8) is then given by
 $$\begin{eqnarray}\displaystyle & & \displaystyle \int _{0}^{h}\unicode[STIX]{x1D716}ReF\left(\frac{\unicode[STIX]{x2202}\hat{u} _{1}}{\unicode[STIX]{x2202}t}+\hat{u} _{1}\frac{\unicode[STIX]{x2202}\hat{u} _{1}}{\unicode[STIX]{x2202}x}+{\hat{w}}\frac{\unicode[STIX]{x2202}\hat{u} _{1}}{\unicode[STIX]{x2202}z}\right)\,\text{d}z\nonumber\\ \displaystyle & & \displaystyle \quad =\left[\unicode[STIX]{x1D716}E\frac{\unicode[STIX]{x2202}}{\unicode[STIX]{x2202}x}\left(\frac{\unicode[STIX]{x2202}\unicode[STIX]{x1D6F7}_{2}}{\unicode[STIX]{x2202}z}\right)^{2}+\frac{\unicode[STIX]{x1D716}^{3}}{Ca}\frac{\unicode[STIX]{x2202}^{3}h}{\unicode[STIX]{x2202}x^{3}}-\unicode[STIX]{x1D716}G\frac{\unicode[STIX]{x2202}h}{\unicode[STIX]{x2202}x}\right]\int _{0}^{h}F\,\text{d}z+q.\end{eqnarray}$$
Equation (2.12) represents the long-wave WRIBL model consistent at
 $O(\unicode[STIX]{x1D716})$
. Substituting for velocity and
 $F$
obtained from (2.10) and (2.11), we obtain the evolution equations in terms of
 $h$
and
 $q$
alone. Once the reduced-order model is obtained, we renormalize the system by setting
 $\unicode[STIX]{x1D716}=1$
, as done by Dietze & Ruyer-Quil (Reference Dietze and Ruyer-Quil2013). This gives the final set of evolution equations as
 $$\begin{eqnarray}\frac{\unicode[STIX]{x2202}h}{\unicode[STIX]{x2202}t}+\frac{\unicode[STIX]{x2202}q}{\unicode[STIX]{x2202}x}=0,\end{eqnarray}$$
 $$\begin{eqnarray}\displaystyle & & \displaystyle Re\left(\frac{\unicode[STIX]{x2202}q}{\unicode[STIX]{x2202}t}+\frac{17q}{7h}\frac{\unicode[STIX]{x2202}q}{\unicode[STIX]{x2202}x}-\frac{9q^{2}}{7h^{2}}\frac{\unicode[STIX]{x2202}h}{\unicode[STIX]{x2202}x}\right)\nonumber\\ \displaystyle & & \displaystyle \quad =-\frac{5q}{2h^{2}}+\frac{5h}{6}\left(\frac{E\left[1+\cos (4\unicode[STIX]{x03C0}t)\right]}{(\unicode[STIX]{x1D6FD}-h)^{3}}\frac{\unicode[STIX]{x2202}h}{\unicode[STIX]{x2202}x}+\frac{1}{Ca}\frac{\unicode[STIX]{x2202}^{3}h}{\unicode[STIX]{x2202}x^{3}}-G\frac{\unicode[STIX]{x2202}h}{\unicode[STIX]{x2202}x}\right).\end{eqnarray}$$
 $\unicode[STIX]{x1D716}^{2}$
model and therefore retained additional effects of lateral diffusion as well. On the right-hand side of (2.13b
), the first term is due to transverse viscous diffusion, while the terms inside the bracket correspond to electrical, surface tension and gravitational effects respectively. It should be noted that when
 $E=0$
, the model reduces to an inertial lubrication model for inertial surface-gravity waves on thin liquid films. Under this limit, the presence of the gas-bounding wall is not felt by the fluid, as fluid 2 is assumed to be hydrodynamically passive.
The linear stability analysis of (2.13) is carried out using the method of modal decomposition. In the base state, the fluid is assumed to be stationary with a flat interface. The variables are perturbed around the base state as
 $h=1+h^{\star }\text{e}^{\text{i}kx}$
and
 $q=q^{\star }\text{e}^{\text{i}kx}$
, where the starred variables denote the perturbation amplitudes and
 $k$
is the spatial wavenumber. This leads to the following damped Mathieu equation:
 $$\begin{eqnarray}\left.\begin{array}{@{}c@{}}\displaystyle \frac{\unicode[STIX]{x2202}^{2}h^{\star }}{\unicode[STIX]{x2202}t^{2}}+\unicode[STIX]{x1D701}\frac{\unicode[STIX]{x2202}h^{\star }}{\unicode[STIX]{x2202}t}+[\unicode[STIX]{x1D714}_{0}^{2}-\unicode[STIX]{x1D6FF}\cos (4\unicode[STIX]{x03C0}t)]h^{\star }=0,\\ \displaystyle \text{where }\unicode[STIX]{x1D701}=\frac{5}{2Re},\quad \unicode[STIX]{x1D714}_{0}^{2}=\frac{5}{6Re}\left(Gk^{2}+\frac{1}{Ca}k^{4}-\frac{Ek^{2}}{(\unicode[STIX]{x1D6FD}-1)^{3}}\right),\quad \unicode[STIX]{x1D6FF}=\frac{5}{6Re}\frac{Ek^{2}}{(\unicode[STIX]{x1D6FD}-1)^{3}}.\end{array}\right\}\end{eqnarray}$$
In the above,
 $\unicode[STIX]{x1D714}_{0}$
is the natural frequency of the interface. It may be noted that the natural frequency of a thin film is modified in the presence of an electrostatic forcing (cf. the additional term due to the Maxwell stress). It can be observed that in (2.14), for a gravitationally unstable system,
 $G<0$
, and that the electric term is of the same sign as the gravity term. This observation forecasts the result that periodic electrostatic forcing cannot stabilize an RT unstable configuration of a conducting liquid, such as water, lying above a dielectric gas, such as air. Moreover, the Mathieu equation has a forcing frequency
 $4\unicode[STIX]{x03C0}$
compared with the imposed potential frequency
 $2\unicode[STIX]{x03C0}$
. This is due to the quadratic dependence of the Maxwell stress on the electric field. A stability analysis of the Mathieu equation (2.14) is carried out using standard Floquet theory (Nayfeh Reference Nayfeh1981).
For nonlinear calculations, an initial wavy disturbance is imposed on the interface position and equations (2.13) are solved on a computational domain corresponding to one wavelength of the imposed perturbation. The initial conditions are
 $h(x,0)=1+0.05\,\cos (kx)$
and
 $q(x,0)=0$
unless otherwise specified. We use the Fourier spectral collocation technique to obtain numerical solutions (Labrosse Reference Labrosse2011). It ensures high-order spatial resolution and that periodic boundary conditions are satisfied. The number of grid points,
 $N$
, was chosen to be 120 for all calculations, and varied between 200 and 300 for sliding-related calculations. The time integration is performed using the adaptive time-stepping NDSolve subroutine in Mathematica® v.10.3.
3 Results and discussion
Calculations are carried out using the properties of water and air, i.e.
 $\unicode[STIX]{x1D70C}_{1}=1000~\text{kg}~\text{m}^{-3}$
,
 $\unicode[STIX]{x1D707}_{1}=0.9\times 10^{-3}~\text{kg}~\text{m}^{-1}~\text{s}^{-1}$
,
 $\unicode[STIX]{x1D6FE}=0.072~\text{N}~\text{m}^{-1}$
,
 $\unicode[STIX]{x1D700}_{2}=1$
,
 $\unicode[STIX]{x1D700}_{0}=8.854\times 10^{-12}~\text{C}^{2}~\text{N}^{-1}~\text{m}^{-2}$
and
 $g=9.8~\text{m}~\text{s}^{-1}$
. Although pure water is a bad conductor, commercially available ultrapure water (UPW) such as that produced by the Millipore corporation is a good conductor. At
 $25\,^{\circ }\text{C}$
, the standard literature value for the conductivity of UPW is taken to be
 $5.5\times 10^{-6}~\text{S}~\text{m}^{-1}$
(Aylward & Findlay Reference Aylward and Findlay1994), which is several orders of magnitude higher than the conductivity of air (
 ${\sim}10^{-13}~\text{S}~\text{m}^{-1}$
). Therefore, a perfect-conductor–perfect-dielectric model ought to be valid for the water–air system. In addition, it has been shown by Ward et al. (Reference Ward, Matsumoto and Narayanan2018) that experimentally observed thresholds for electrostatic Faraday instability for a water–dielectric system can be predicted with excellent accuracy using the perfect-conductor–perfect-dielectric model. Of course, the model is equally applicable to conducting metals in contact with passive dielectric gas. The key results for the gravitationally stable and unstable configurations are now discussed. We have restricted our analysis to cases such that the dimensionless wavenumber,
 $k$
(scaled by the film thickness,
 $H$
, in the results section), takes a value of
 $1/2$
or less. This ensures that the ensuing wavelength is at least an order of magnitude larger than the film thickness and therefore the long-wave approximation is upheld.
3.1 Faraday instability in a gravitationally stable configuration
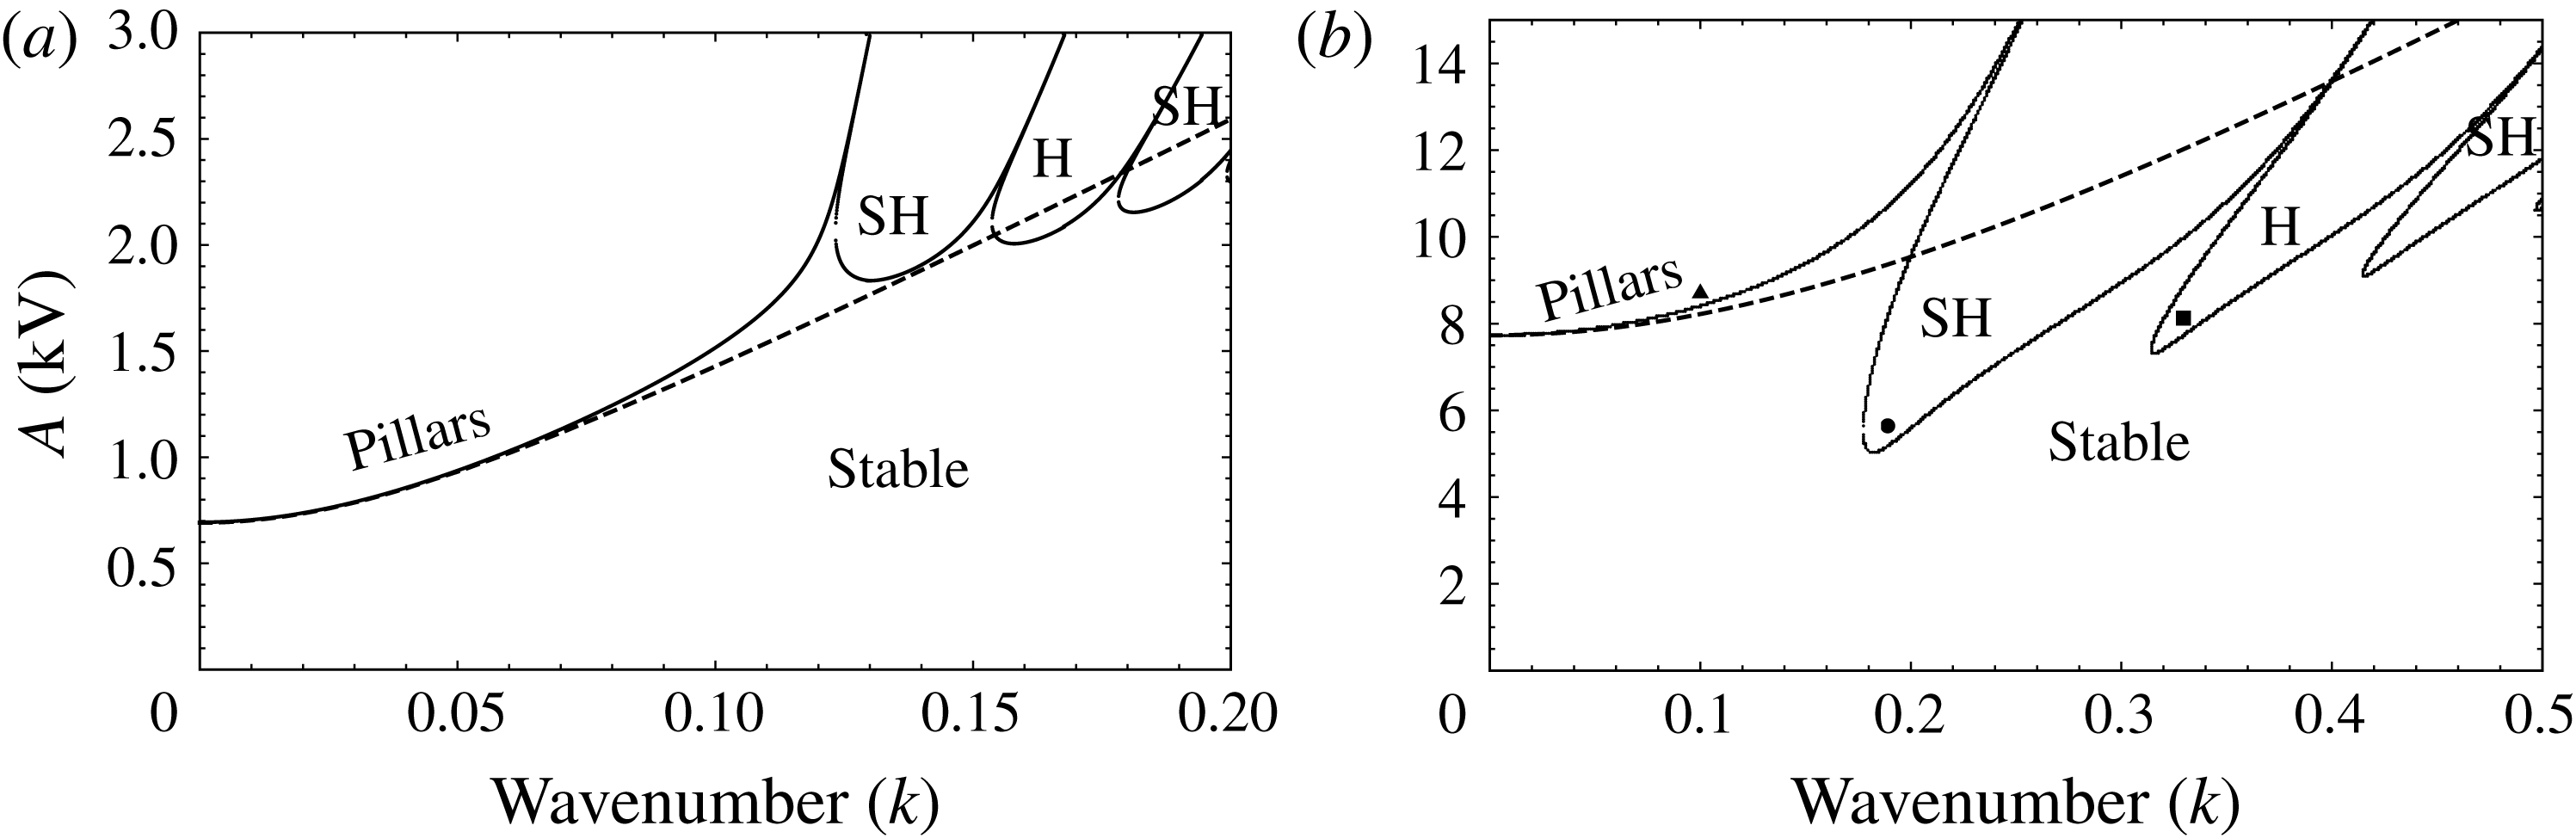
We begin with the gravitationally stable configuration. In figure 2(a), the neutral stability curve for such a case is plotted for a thin film of 0.25 mm. The dashed line denotes the neutral curve obtained in the absence of inertia (
 $Re=0$
). It is seen that the system becomes unstable beyond a critical threshold potential to a long-wave instability. This corresponds to the ‘pillaring’ instability reported by Wu & Chou (Reference Wu and Chou2003) and Roberts & Kumar (Reference Roberts and Kumar2009). In the presence of fluid inertia (solid), additional stability tongues corresponding to alternating subharmonic and harmonic Faraday responses are observed at higher threshold potentials and larger wavenumbers. In figure 2(b), the neutral stability curve is plotted for a thicker film of 0.75 mm. For this case, the instability threshold for the Faraday modes is lower than that for the pillaring mode. Thus, Faraday modes are expected to be observed in an experiment at the onset of instability for thicker films, and more so as the liquid thickness increases, i.e. as the fluid becomes more inertial. In this work, we restrict our discussion to such inertial thin films of
 $O(1~\text{mm})$
and proceed to discuss their interfacial dynamics.
(a) The neutral stability curve (solid) shows the long-wave ‘pillaring’ instability along with alternating subharmonic (SH) and harmonic (H) tongues characteristic of Faraday resonance. In the absence of inertia (dashed), only the ‘pillaring’ mode exists;
 $H=0.25~\text{mm}$
,
 $\unicode[STIX]{x1D6FD}=5$
,
 $f=3~\text{Hz}$
. (b) The neutral stability curve with
 $H=0.75~\text{mm}$
,
 $\unicode[STIX]{x1D6FD}=5$
,
 $f=3~\text{Hz}$
; the markers denote the parameters chosen for the nonlinear simulations.
(a) The linear (dashed) and nonlinear (solid) temporal evolution of
 $h_{max}$
for the pillaring mode at ▴ in figure 2(b) (
 $k=0.1$
,
 $A=8.7~\text{kV}$
). (b) The temporal evolution of
 $h_{min}$
for lower liquid holdup
 $(k=0.1,A=28.5~\text{kV},\unicode[STIX]{x1D6FD}=10)$
; see movie 1 available at https://doi.org/10.1017/jfm.2018.682 for the interface evolution.

It is known that the solution to the Mathieu equation can become unbounded in two ways, namely (i) a non-monotonic non-periodic unbounded solution and (ii) a periodic solution with an exponentially increasing amplitude (Nayfeh Reference Nayfeh1981). We show that these correspond to the pillaring-type and Faraday modes respectively. In figure 3(a), the temporal evolution of the maximum position of the interface,
 $h_{max}$
, corresponding to the pillaring mode (
 $\blacktriangle$
in figure 2
b) is plotted. The dashed curve denotes the linear Mathieu response while the solid curve denotes the nonlinear evolution. It can be seen that the Mathieu response is of the first kind and the corresponding nonlinear evolution of the interface shows a subcritical behaviour, with the interface approaching the top wall. As inertial films are typically of
 $O(1~\text{mm})$
, we do not consider long-range molecular forces, which become important only when the film thins to very small length scales of
 $O(100~\text{nm})$
(Israelachvili Reference Israelachvili2011). These forces are, however, of significance if one is interested in studying the spinodal dewetting and contact line dynamics. In the presence of these forces, pillar formation is arrested near the wall and ‘quasi-steady-state oscillations’ are observed, as shown by Roberts & Kumar (Reference Roberts and Kumar2009). In figure 3(b), a lower liquid–gas holdup (
 $\unicode[STIX]{x1D6FD}=10$
) is considered and the minimum position of the interface,
 $h_{min}$
, as a function of time is plotted. Here, the system again exhibits a subcritical behaviour, with the interface approaching the bottom wall (also see movie 1). The nonlinear emergence of the higher unstable Faraday modes, along with the viscosity of the film, considerably slows down the approach of the interface towards the bottom wall.
(a) The linear (dashed) and nonlinear (solid) temporal evolution of the interface position at
 $x=0$
,
 $h_{0}$
for the parameters corresponding to the markers in figure 2(b). (a) The subharmonic response at ●
 $(k=0.19,5.6~\text{kV})$
. (b) The harmonic response at ▪
 $(k=0.33,8.1~\text{kV})$
. Also see movie 2 for the interface evolution.

The effect of the forcing amplitude on the subharmonic response. (a) Large liquid–gas holdup: dashed
 $(A=6.7~\text{kV})$
, solid
 $(A=7.6~\text{kV})$
;
 $k=0.22,\unicode[STIX]{x1D6FD}=5$
. (b) Low liquid–gas holdup: solid
 $(A=22~\text{kV})$
, dotted
 $(A=26~\text{kV})$
;
 $k=0.22,\unicode[STIX]{x1D6FD}=10$
.
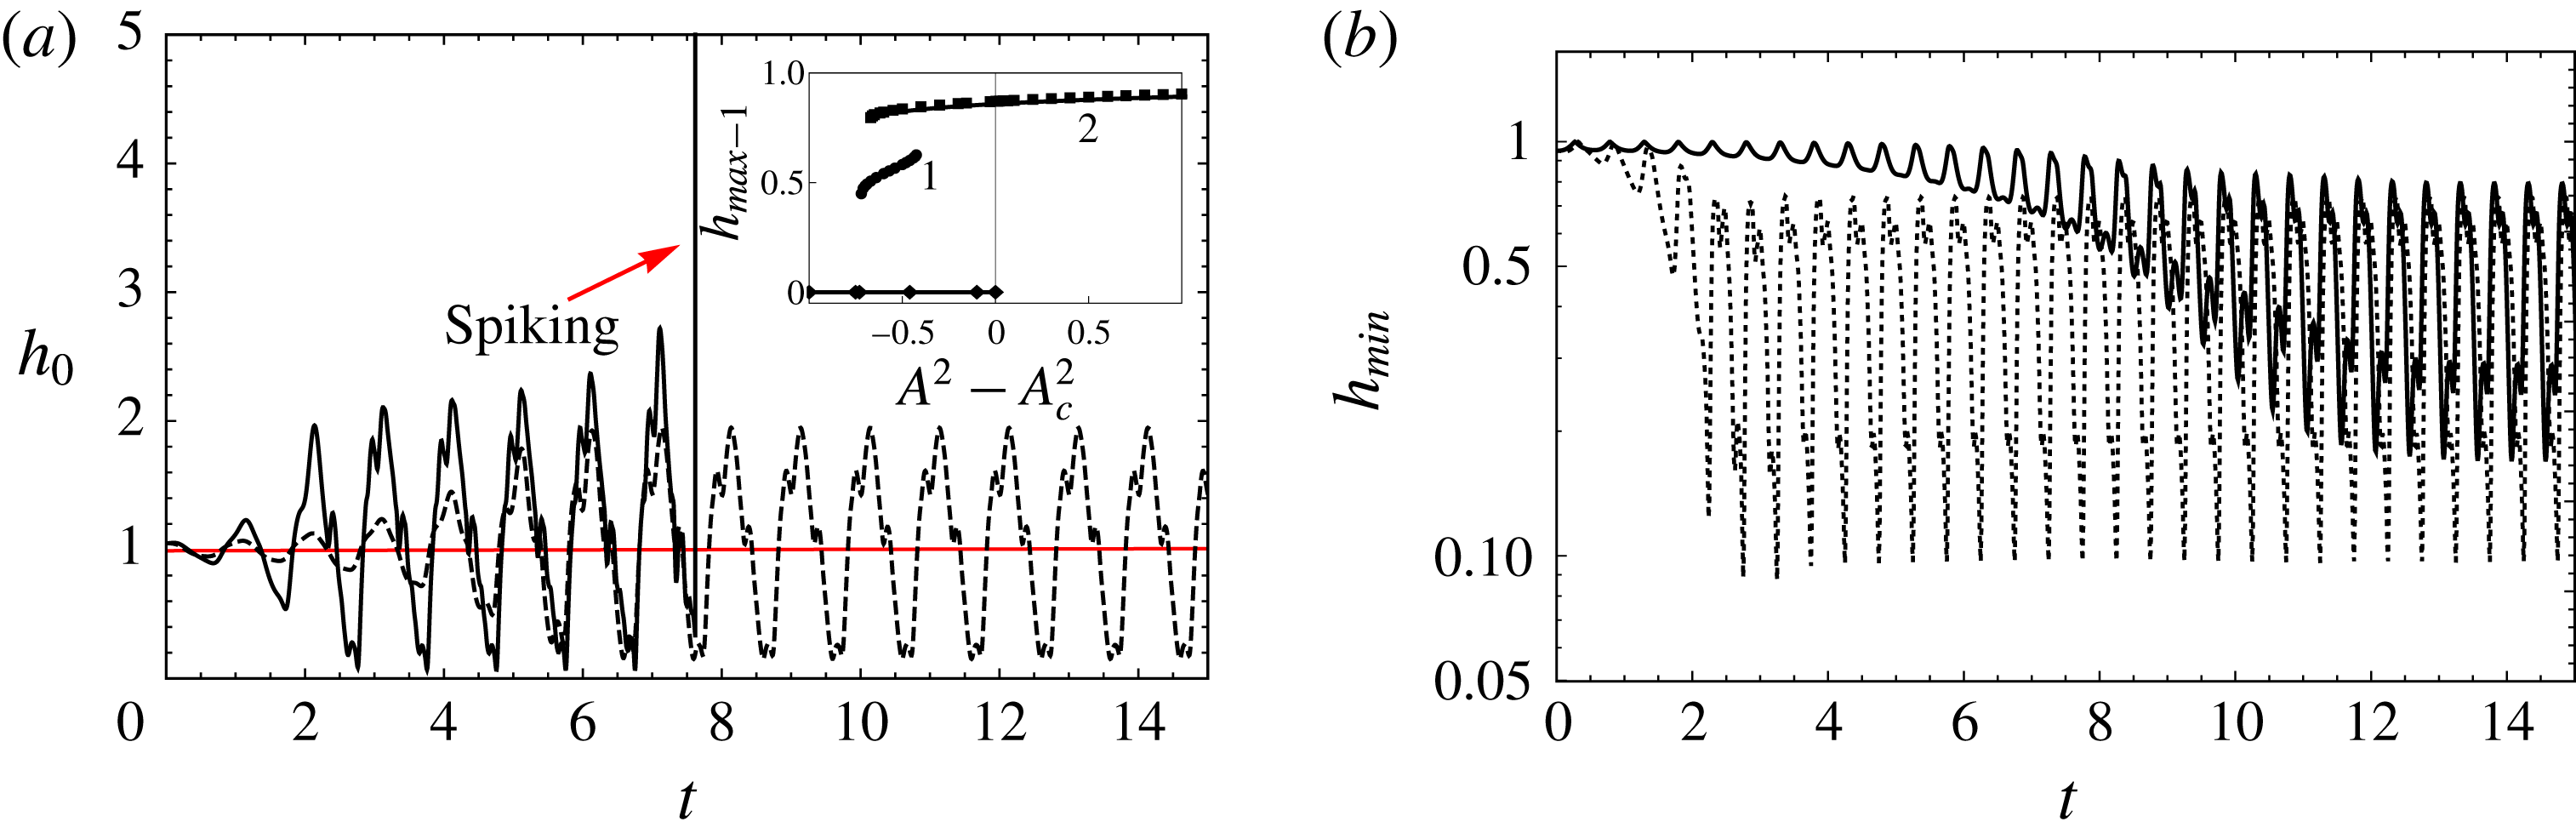
In figure 4(a,b), the linear (dashed) and nonlinear (solid) responses corresponding to subharmonic and harmonic Faraday modes are plotted (also see movie 2). It can be seen that the linear Mathieu response is oscillatory with an exponentially increasing amplitude, corresponding to the second kind. From figure 4(a), it is evident that the subharmonic response of the interface saturates nonlinearly to standing waves, isosynchronous with the forcing frequency. This is because the forcing ‘felt’ by the interface due to the electrostatic Maxwell stress has a quadratic dependence on the applied potential. Similarly, the harmonic response has a frequency that is twice that of the forcing frequency, as is evident from figure 4(b), and the interface oscillates twice every forcing cycle. The amplitude of the standing waves increases with an increase in the forcing amplitude, and the interface may approach either wall depending on the liquid–gas holdup. Figure 5(a) shows that for a large liquid–gas holdup (
 $\unicode[STIX]{x1D6FD}=5$
), the wave amplitude increases with an increase in the applied potential, and the interface spikes up towards the top wall. The inset of figure 5(b) is a plot of
 $(h_{max}-1)$
of the standing wave solutions as a function of
 $A^{2}-A_{c}^{2}$
. Here,
 $A^{2}-A_{c}^{2}$
is the bifurcation parameter, while
 $(h_{max}-1)$
acts as an ‘order parameter’ of the standing wave solutions (Cross & Greenside Reference Cross and Greenside2009). Simulations are carried out with various initial conditions of the form
 $h(x,0)=1+\unicode[STIX]{x1D712}\,\cos (kx)$
and
 $q(x,0)=0$
, wherein
 $\unicode[STIX]{x1D712}$
is varied from 0.005 to 0.9 and therefore also includes finite-amplitude perturbations. It is clear that the interface saturates to standing waves of amplitude
 ${\sim}0.9$
(cf. branch 2 in the inset) when
 $A^{2}>A_{c}^{2}$
, and that it is a subcritical bifurcation exhibiting a double hysteresis. For
 $A^{2}<A_{c}^{2}$
, very small disturbances decay to zero (cf. diamonds), consistent with the linear theory, while finite-amplitude disturbances may saturate to either branch 1 (cf. circles) or branch 2 (cf. squares) depending on the initial amplitude of perturbation,
 $\unicode[STIX]{x1D712}$
. Dynamic numeric calculations can saturate only to stable solutions. The unstable solutions are expected to emerge backward from the origin connecting the two stable branches (1 and 2). For lower liquid–gas holdup
 $(\unicode[STIX]{x1D6FD}=10)$
, the interface approaches the bottom wall with an increase in the forcing amplitude (cf. figure 5
b).
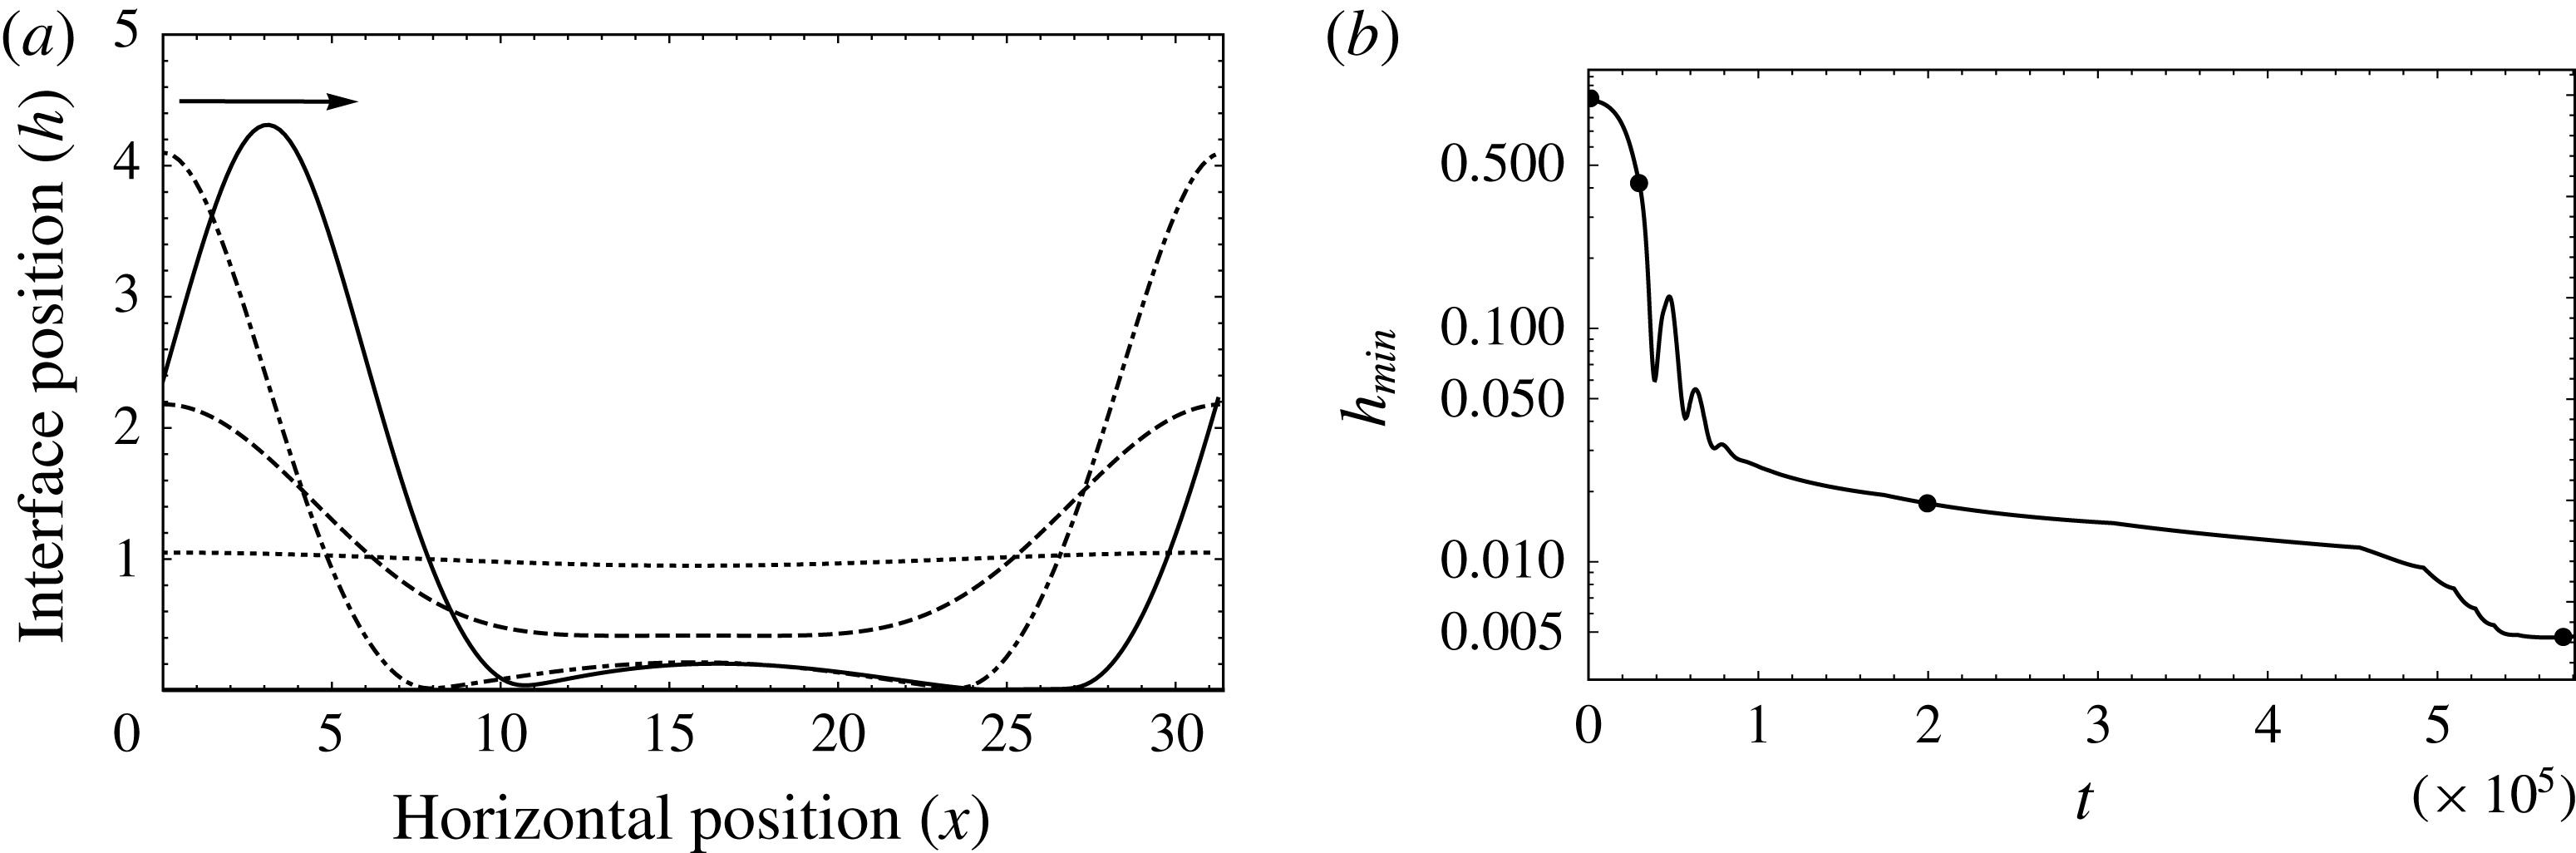
(a) Sliding of the interface as it approaches the wall;
 $t=0$
(dotted),
 $t=0.3\times 10^{5}$
(dashed),
 $t=2\times 10^{5}$
(dot-dashed),
 $t=5.8\times 10^{5}$
(solid). (b) The temporal evolution of
 $h_{min}$
. The markers denote the times corresponding to the interface profiles plotted in (a);
 $\unicode[STIX]{x1D6FD}=10,\unicode[STIX]{x1D714}=0,A=26~\text{kV},k=0.2.$
Also see movie 3 for the interface evolution.
From (2.13), we observe that in the limit of
 $\unicode[STIX]{x1D6FD}\gg h$
and low frequency (
 $\unicode[STIX]{x1D714}\rightarrow 0$
), the system reduces to an RT problem with an effective gravity,
 $\bar{G}$
, given by
 $\bar{G}=2E/\unicode[STIX]{x1D6FD}^{3}-G$
. In figure 6(a), we plot the interface profile with time for such a case, where
 $\unicode[STIX]{x1D6FD}=10$
and
 $\unicode[STIX]{x1D714}=0$
. The corresponding evolution of
 $h_{min}$
is plotted in figure 6(b). The markers denote the times corresponding to the interface profiles in figure 6(a). Since
 $\unicode[STIX]{x1D714}=0$
, the time on the abscissa in figure 6(b) is scaled with the capillary time,
 $\unicode[STIX]{x1D707}H/\unicode[STIX]{x1D6FE}$
. It is seen in figure 6(a) that the primary trough of the interface undergoes a buckling to form secondary troughs as it approaches the wall. This buckled quasi-steady configuration then continues to evolve at a very slow rate and subsequently exhibits ‘sliding’ (also see movie 3) as a consequence of a symmetry-breaking instability, wherein the interface translates parallel to the wall (cf. Lister, Morrison & Rallison Reference Lister, Morrison and Rallison2006; Glasner Reference Glasner2007; Lister, Rallison & Rees Reference Lister, Rallison and Rees2010; Dietze & Ruyer-Quil Reference Dietze and Ruyer-Quil2015). The necessary asymmetric perturbation that triggers the sliding motion is provided by numerical truncation errors, as detailed by Dietze & Ruyer-Quil (Reference Dietze and Ruyer-Quil2015). In an experimental setting, it is impossible to shield the quasi-steady interface from random infinitesimal perturbations, which include symmetric as well as asymmetric components. The presence of any such asymmetric contribution will result in the interface exhibiting sliding dynamics. The onset of sliding coincides with the sharp decrease of
 $h_{min}$
with time at around
 $t=5\times 10^{5}$
in figure 6(b).
3.2 Unstable gravitational configuration
It is known that mechanical Faraday forcing as well as parallel electrical forcing is capable of stabilizing an RT unstable interface (Cimpeanu et al.
Reference Cimpeanu, Papageorgiou and Petropoulos2014; Sterman-Cohen et al.
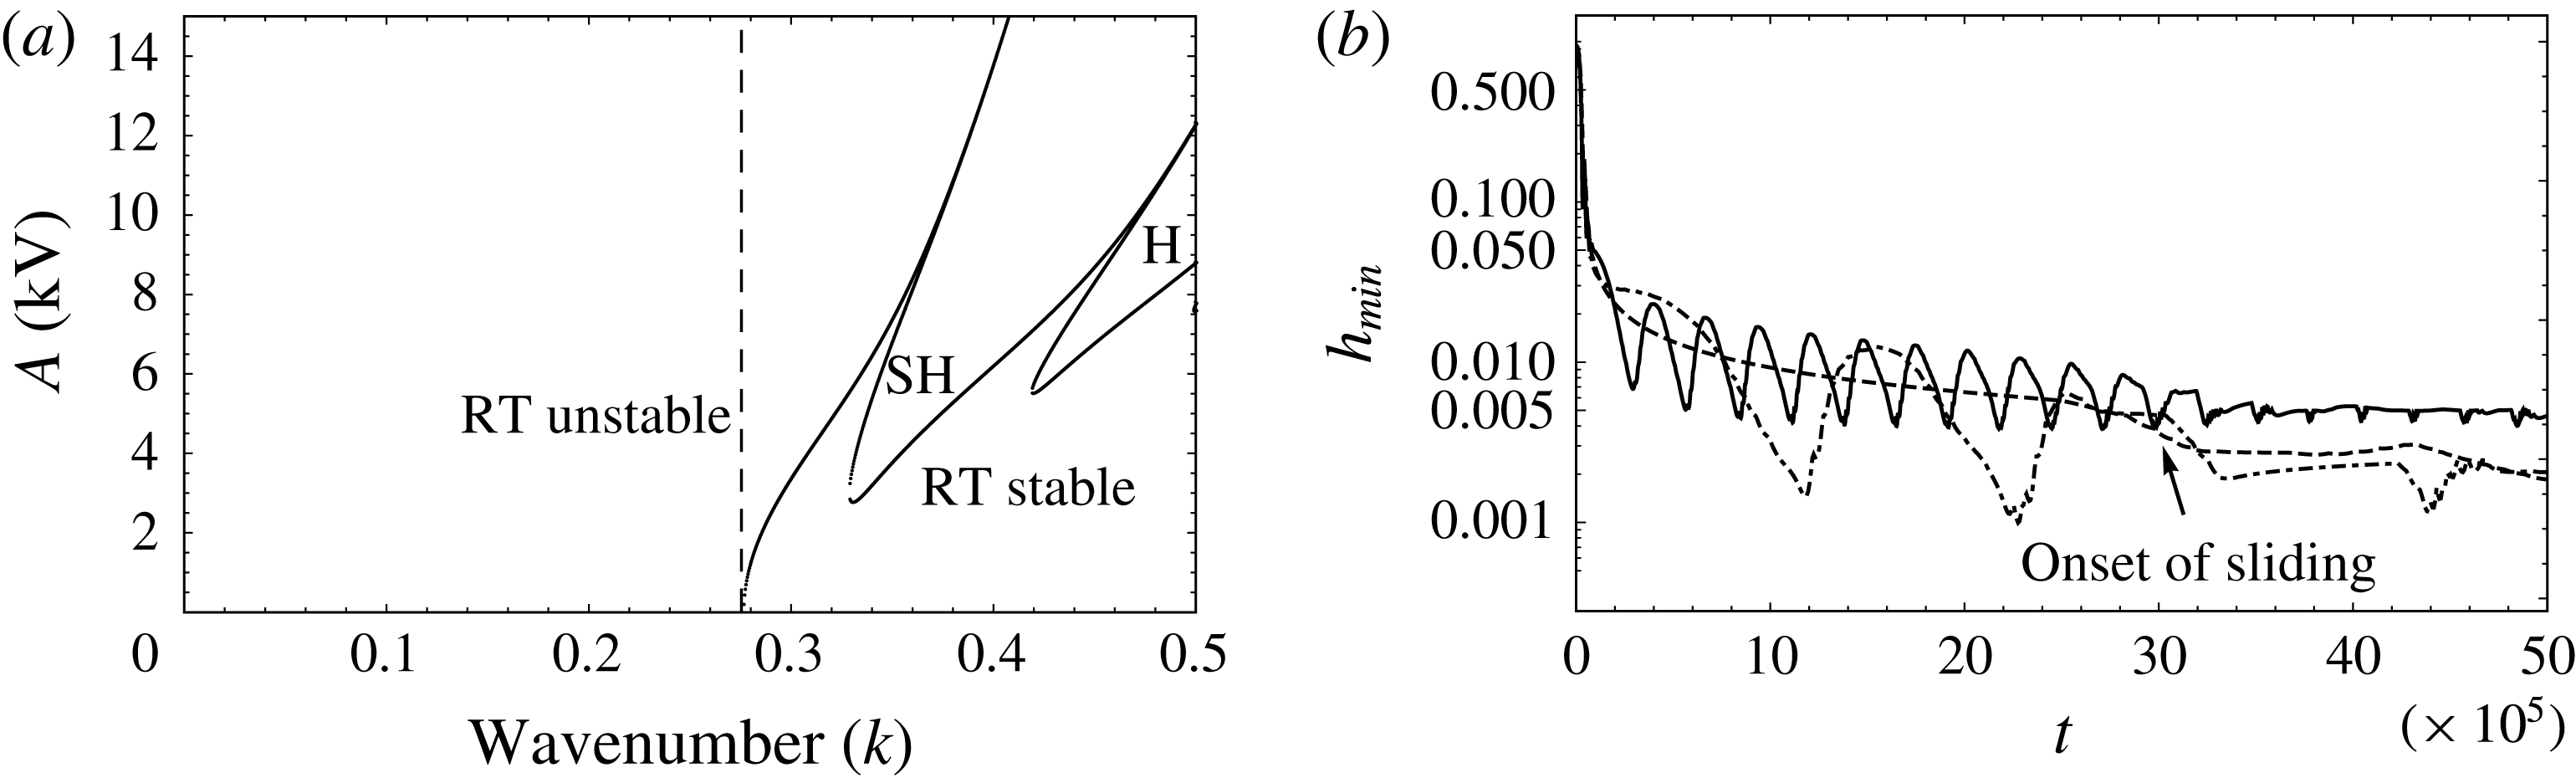
Reference Sterman-Cohen, Bestehorn and Oron2017). Here, we explore the possibility of stabilizing an RT unstable interface using periodic perpendicular electrostatic forcing. In figure 7(a), the neutral stability curve for such a case is plotted (solid curve). The dashed vertical line corresponds to the RT cutoff wavenumber in the absence of forcing. Electrostatic forcing only renders the system more unstable, shifting the cutoff wavenumber to the right and increasing the range of RT unstable wavenumbers. In addition, it also results in the finite-wavelength subharmonic and harmonic Faraday instability for large-amplitude forcings. These Faraday modes behave very similarly to those discussed in the earlier section on the gravitationally stable configuration. Thus, as forecast earlier in § 2.1, the thin-film model shows that an RT unstable configuration of a heavy perfect conducting liquid over a lighter perfect dielectric cannot be stabilized by periodic electrostatic forcing. In figure 7(b),
 $h_{min}$
is plotted with time for the RT unstable configuration with forcing frequencies of 0.2 Hz (solid) and 0.04 Hz (dot-dashed), while the dashed curve corresponds to pure RT instability in the absence of forcing. In order to make a meaningful comparison, the time on the abscissa in figure 7(b) is again scaled with the capillary time,
 $\unicode[STIX]{x1D707}H/\unicode[STIX]{x1D6FE}$
. It is seen that around
 $t\sim 30\times 10^{5}$
, all
 $h_{min}$
curves exhibit a sudden change in their behaviour. This corresponds to the onset of sliding, and in the presence of periodic electrostatic forcing, the interface translates parallel to the wall, exhibiting an ‘earthworm-like’ motion (see movie 4).
(a) The neutral stability curve for an RT unstable interface with AC forcing
 $(\unicode[STIX]{x1D6FD}=5,f=3~\text{Hz})$
. The dashed vertical line is the RT cutoff wavenumber in the absence of forcing. (b) The temporal evolution of
 $h_{min}$
: dashed, pure RT (
 $k=0.2,A=0$
); solid, RT with forcing
 $(f=0.2~\text{Hz},A=2~\text{kV},k=0.2)$
; dot-dashed, RT with forcing
 $(f=0.05~\text{Hz},A=2~\text{kV},k=0.2)$
. Also see movie 4.
4 Summary
Using a long-wavelength model for electrostatic Faraday instability, it is shown that gravitationally stable inertial thin films exhibit Faraday modes of instability prior to the long-wavelength pillaring instability. Due to a quadratic dependence of the Maxwell stress on the applied potential, the subharmonic Faraday response is synchronous with the forcing frequency while the harmonic response occurs at twice the forcing frequency. The pillaring mode exhibits a subcritical behaviour, with the interface approaching either wall depending on the liquid–gas holdup, while the Faraday modes saturate to standing waves. In this case, the interface may approach either wall, again depending on the liquid–gas holdup. In the limit of low liquid–gas holdup and time-independent forcing, the interface exhibits sliding dynamics akin to what has been observed by earlier workers in RT instability.
The long-wave model also shows that a gravitationally unstable interface cannot be stabilized by periodic perpendicular electrostatic forcing. In this case, the interface exhibits oscillatory sliding behaviour with an earthworm-like motion as it approaches the wall.
Acknowledgements
We acknowledge financial support from NSF (NSF-0968313), NASA (NNX17AL27G) and the Florida Space Grant Consortium (FSGC-08-NNX15-023). R.N. is grateful to the Institute of Advanced Study, Durham University, UK for a fellowship.
Supplementary movies
Supplementary movies are available at https://doi.org/10.1017/jfm.2018.682.



