I. INTRODUCTION
AZ91D, AM60B, and AE44 alloys have been in widespread use in the automotive industry processed mainly by casting. In designing cast automotive components, it is important to know how these alloys solidify at different cross sections of the casting resulting in precise structure and mechanical properties. Cooling rate is one of the many factors that affect the solidification behavior of castings, which influences the thermophysical properties and consequently the microstructure and mechanical properties. As a result, these castings are prone to the development of porosity and other microstructural defects that lead to local variation of mechanical properties. Therefore, the knowledge of the thermophysical properties during solidification enables the designer to ensure that the casting will achieve the desired properties for its considered application.
Thermal analysis technique is a useful tool to obtain the value of phase-transformation temperature and heat of solidification of multicomponent alloys. Many researchersReference Luo1–Reference Riddle, Barber and Makhlouf13 studied the solidification behavior of magnesium alloys, but the effect of cooling rate on phase-transformation temperatures and enthalpy of solidification has not been investigated extensively in the literature. Hence, this work has been initiated to investigate experimentally the effect of cooling rate on phase-transformation temperatures and heat of solidification of the AZ91D, AM60B, and AE44 magnesium alloys using differential scanning calorimetry (DSC). The heat transfer method (HTM) based on the Tian equationReference Chen and Huang14–Reference Mirković, Gröbner and Schmid-Fetzer16 has been applied to DSC measurements to determine the solidification curves of the studied alloys. Computational thermodynamics has been used in this study to simulate the solidification behavior of the alloys.
II. METHODOLOGY
A number of experiments at different cooling rates have been performed using the following techniques.
A. Thermal analysis
Thermal investigation of the alloys has been performed using a Setaram Setsys DSC-1200 (France) instrument. Temperature and enthalpy calibrations of the DSC equipment are done using pure magnesium and aluminum. The samples were cut and mechanically polished to remove any possible contaminated surface layers. Afterward, they were cleaned with 1 vol% nital solution (HNO3 in ethanol) and placed into a graphite crucible with a lid cover to contain magnesium vapors and protect the apparatus. The weight of the samples was kept around 30 ~ 60 mg. To avoid oxidation, three evacuations followed by rinses with argon were done. The DSC measurements were carried out under flowing argon atmosphere with scanning rates of 5 to 45 °C/min. Although the cooling rate is one of the DSC parameters set by the user, temperature and time have been recorded during the experiment and as a further verification the cooling rate is calculated as ΔT/Δt. The cooling rate calculated this way was found consistent with the value set in the computer. The mass difference, before and after the experiment, is measured to insure if there is any mass loss, in reality there is negligible mass loss, which is around 0.02 mg. The reproducibility of every measurement was confirmed by collecting the data during three heating and cooling cycles. The estimated error between the repetitive heating and cooling is ±1 °C or less. All the required data (temperature and heat flow with time) were recorded from the cooling region of the DSC spectra and the enthalpy of solidification was obtained by taking the area under the cooling peaks. The solidification curve has been established from the DSC measurement based on the HTM as discussed below.
B. Extrapolation of the thermophysical properties
A general power law has been used to establish the relationships between cooling rate and transformation temperatures as well as between cooling rate and enthalpy of solidification [Eqs. (1) and (2)] as suggested byReference Kuang, Zhang, Zhang, Liang and Fung17, Reference Zhang, Zhong and Siu18

where α is a scaling exponent, A is a constant, L 0 is the enthalpy of solidification at a quasi-static state, and (CR) is the cooling rate. In quasi-static equilibrium, a thermodynamic system goes from one equilibrium state to another such that at every moment in time the state of the system is close but not equal to an equilibrium state.
A similar type of power law equation has been used to develop the relationship between transition temperatures and cooling rates:

where n is a scaling exponent, (CR) is the cooling rate, T 0(T 0s-quasi-static solidus temperature and T 0l-quasi-static liquidus temperature) is the transition temperature at the quasi-static state, and B is a constant. After the relationship has been developed, calculations were made to obtain the thermophysical properties of the alloys at extremely high cooling rates and compared with available experimental data.
C. HTM
The solidification curve established from the DSC measurement is based on the heat transfer between the sample and the reference, as shown in the Tian equation.Reference Chen and Huang14–Reference Mirković, Gröbner and Schmid-Fetzer16 Heat flow produced through transformation inside the sample is given by

where Φ = Φfr − Φfs is the heat flow difference between the sample and the reference, which is directly measured from the DSC experiment, t is the time. The heat transfer resistance (R) and the heat capacity (C) of the reference (R fr, C r) and the sample cell (R fs, C s) are approximated to be identical (R = R fr= R fs; C = C r= C s). The temperatures T r and T s are assumed to be uniform inside the cells. The heat flow generated by exothermic or endothermic reactions, Φr and phase transition of the sample can be expressed by heat evolution h, which occurs in the sample:

Chen and HuangReference Chen and Huang14 assumed a linear dependence of the rate of heat evolution during solidification on the rate of solid phase fraction:
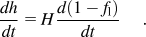
The heat of solidification H is assumed to be constant.
Finally, Eq. (3) can be modified as

The terms H and RC were treated as two adjustable parameters determined from the measured DSC curve of the sample by Chen and Huang.Reference Chen and Huang14 The heat of solidification, H, is obtained by integration of the DSC curve after the baseline is subtracted, and the term RC was iteratively obtained from the after reaction part of the DSC curve as no phase transformation occurs there.Reference Chen and Huang14
The enthalpy, which is the area under the DSC peak, was measured after the subtraction of the baseline. The baseline was obtained using empty crucibles in the sample and reference pans. Finally, the solidification curves were drawn from the DSC data using HTM.Reference Aljarrah, Parvez, Li, Essadiqi and Medraj15
D. Thermodynamic calculation of solidification
FactSage software along with the FSlite databaseReference Bale, Belisle, Chartrand, Decterov, Eriksson, Hack, Jung, Kang, Melancon, Pelton, Robelin and Petersen19 has been used to simulate the solidification curves of the three alloys. These calculations are compared with the experimental results. Phase distribution diagrams have also been analyzed to understand the solidification sequence, the phases to be present in the final microstructure, and the formation and decomposition temperatures of the phases.
III. RESULTS AND DISCUSSION
A. The effect of cooling rate on phase-transformation temperatures
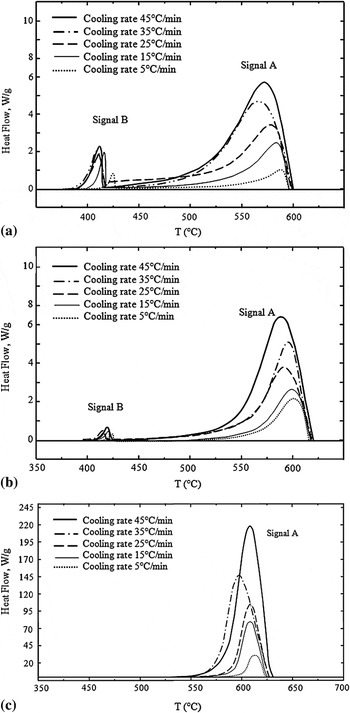
Figures 1(a)–1(c) show typical DSC curves of the AZ91D, AM60B, and AE44 alloys, respectively, during continuous cooling at 5–45 °C/min. The spectrum has two peaks for the AZ91D and AM60B alloys and one peak for the AE44 alloy. The peaks reflect the specific phase changes and the peak area is proportional to the enthalpy of chemical reaction associated with the phase transformation. For both the AZ91D and AM60B alloys the first peak (signal A) represents the formation of the primary α-(Mg) phase and the second peak (signal B) stands for the eutectic transformation. The only peak for the AE44 alloy represents the formation of the α-(Mg) phase and the absence of the second peak indicates either that no eutectic reaction occurs during its solidification or maybe the amount of eutectic is so small that it cannot be detected by the DSC experiment.
DSC spectra of (a) AZ91D, (b) AM60B, and (c) AE44 at different cooling rates after subtracting the baseline.

For all the alloys, it has been found that the liquidus temperature slightly increases, instead of the supercooling effect, and this is attributed to the fact that a higher cooling rate causes more driving force for nucleation.
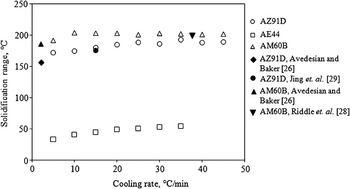
On the other hand, solidus temperature decreases due to the supercooling effect. As a result, the solidification range increases for all the alloys when the cooling rate increases, as shown in Fig. 2. AZ91D and AM60B alloys have a wider solidification range; however, AE44 solidifies within a narrow temperature range. The current results are compared and found to be in excellent agreement with the values from the literature, as can be seen in Fig. 2.
Solidification range versus cooling rate of the AZ91D, AM60B, and AE44 alloys.

It is well know that solidification range (freezing range) is a key point to determine shrinkage porosity. In casting regions with a wide solidification range (such as central region of ingots), the feeding melt will not be able to infiltrate through the interlacing dendrites. Therefore, the local microspaces between the dendrite arms remain isolated from the melt-forming shrinkage porosity. On the basis of this fact, in similar solidification conditions, AE44 will form less shrinkage porosity compared with AZ91D and AM60B. Moreover, the small freezing range of the alloys (at a cooling rate of 5 °C/min, the freezing range for AE44 is 33 °C, compared to 172 and 191 °C for AZ91D and AM60B, respectively) helps to determine if an alloy is suitable to cast into a certain product with good quality. Furthermore, the high enthalpy of formation of the rare earth (RE) containing precipitates may act to slow the solidification. This observation is well supported by KielbusReference Kielbus20 for the case of the AJ62 alloy where the precipitation of thermally stable compounds such as Al4Sr slow the solidification of this alloy. This phase has high enthalpy of formation and thus analogous to RE precipitates.
B. The effect of cooling rate on enthalpy of solidification
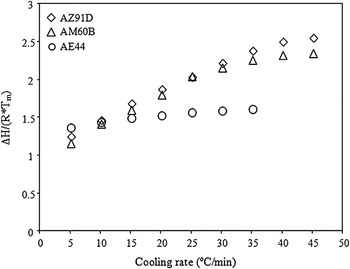
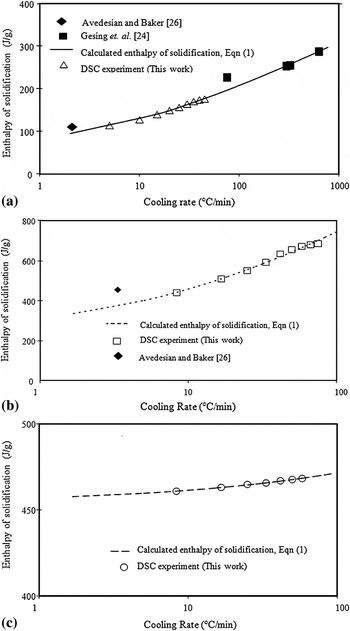
Experimentally, it has been found that the peak area of the DSC curve increases for all the alloys when the cooling rate increases, and this area is proportional to the heat released during solidification. Therefore, the enthalpy of solidification clearly shows an increasing trend with the increasing cooling rates as shown in Fig. 3. This trend verifies the fact that the enthalpy of solidification is sensitive to the solidification speed. The rapid grain growth at the beginning of the solidification process gives a solid phase with a large fraction of lattice defects such as vacancies, which increase the energy of the solid phase.Reference Mahamoudi and Fredriksson21 The fraction of vacancies increases with increasing cooling rate. These vacancies will diffuse and create clusters, form dislocation or move to grain boundaries during solidification resulting in increasing heat release and, therefore, the enthalpy of solidification increases.Reference Mahamoudi and Fredriksson21 The enthalpy of solidification is unique for a specific alloy under equilibrium conditions. In actual melting and casting processes, however, equilibrium conditions are not followed. This is because during solidification the exothermic phase transition is also accompanied by dissolution of the solid phase into the liquid. These processes are ruled by the heat and mass transfer phenomena, which are a function of time. During solidification, the type of the structure resulted by a particular system shall minimize the interfacial free energy. According to the simple theory developed by JacksonReference Jackson22 the optimum atomic arrangements depend mainly on the heat of solidification. This theory predicts that there is a critical value of ΔH s / R* T m. A flat interface occurs at ΔH s / R*T m > 1 while a value below 4 predicted a diffuse interface. Most metals have ΔH s / R* T m ≈ 1 and are therefore predicted to have a rough interface. On the basis of this equation and because the melting temperature increases with increasing cooling rate, the enthalpy of solidification must increase as well to maintain this ratio constant. It is worth mentioning that high cooling rates may lead to metastable phases, which in turn may also affect the enthalpy of solidification. This is also supported by the findings of Yu.Reference Yu23
ΔH/(R*T m) versus cooling rate of the AZ91D, AM60B, and AE44 alloys.

C. Extrapolation of the thermophysical properties
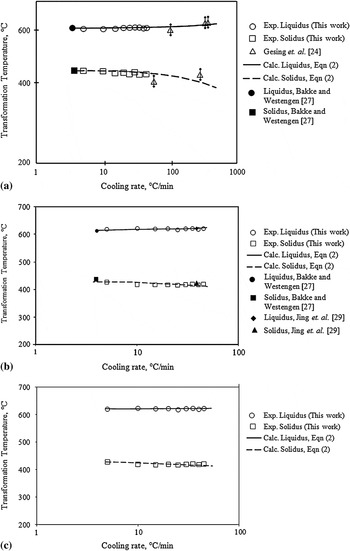
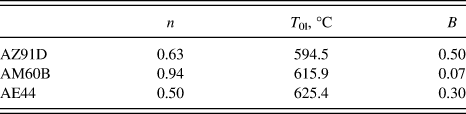
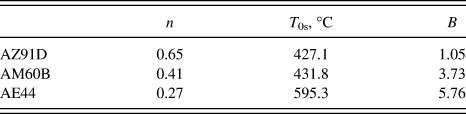
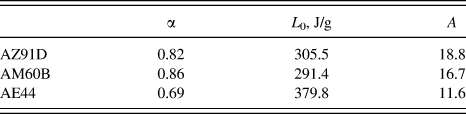
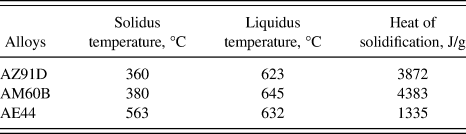
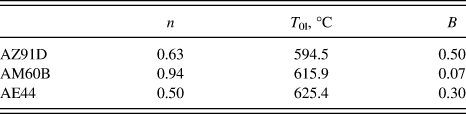
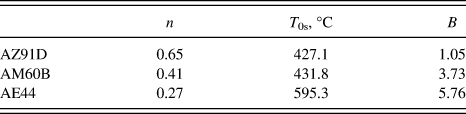
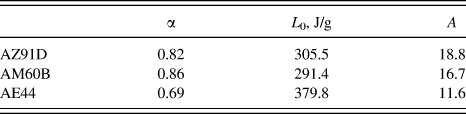
Table I summarizes the results of the thermophysical properties obtained from the DSC experiment. Equations (1) and (2) have been used to establish relationships between phase-transformation temperatures and cooling rate and between enthalpy of solidification and cooling rate. The scaling exponent α, n, and the constant A, B have been obtained using the least squares method from the experimental data and the quasi-static phase-transformation temperature T 0(T 0s- quasi-static solidus temperature and T 0l– quasi-static liquidus temperature) and the quasi-static enthalpy of chemical reaction L 0 that are obtained from the experimental data by back extrapolation to zero cooling rate. After obtaining all the parameters shown in Tables II-IV, predictions of phase-transformation temperatures and enthalpy of solidification at high cooling rates have been obtained as shown in Figs. 4 and 5, respectively. Reasonable agreement has been observed between the calculation and experimental data from the literatureReference Gesing, Reade, Sokolowski, Blawert, Fechner and Hort24, Reference Avedesian and Baker26–Reference Zhang, Li, Guo and Pan29.
Extrapolation of the transformation temperatures of (a) AZ91D, (b) AM60B, and (c) AE44 to high cooling rates using log–log scale.

Extrapolation of heat of solidification of (a) AZ91D, (b) AM60B, and (c) AE44 to high cooling rates using log–log scale.

Experimental results of the thermophysical properties of the studied alloys.

Liquidus temperature extrapolation parameters.
Solidus temperature extrapolation parameters.
Extrapolation parameters of enthalpy of solidification.
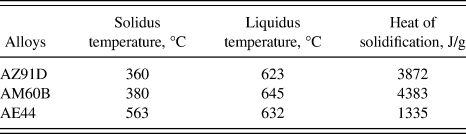
According to this extrapolation, the thermophysical properties have been calculated at 600 °C/min cooling rate, as shown in Table V. This calculation can be used during solidification modeling for the optimization of the casting process.
Calculation of thermophysical properties at 600 °C/min cooling rate.
D. Solidification curves and thermodynamic calculation
Solidification curves of the alloys have been calculated using both equilibrium and Scheil models and compared with experimental solidification curves obtained by HTM. Experimental solidification curves are generally consistent with those obtained by Scheil cooling except for solidus temperature, because in Scheil cooling a small amount of liquid stays at low temperature before the end of solidification. This does not reflect what happens in reality. According to the suggestion of Zhao et al.,Reference Zhao, Zhao, Li, Chen, Zhang and Chou25 a 2% cutoff limit has been used to terminate the solidification process in the current work.
The solidification curves of the AZ91D alloy are shown in Fig. 6. Here, the experimental solidification process begins at around 600 °C, which is consistent with both equilibrium and Scheil cooling conditions. This consistency continues until ~50% of the liquid turns into solid. Under equilibrium condition the solidification ends at 440 °C, which is higher than the solidus temperature obtained by Scheil simulation and the experiments. The kink in the Scheil cooling curve, which corresponds to the precipitation of the eutectic phase, is observed at around 430 °C. This is also consistent with the experimental results.
Solidification curves of the AZ91D alloy at different cooling rates drawn from the experimental data using HTM.

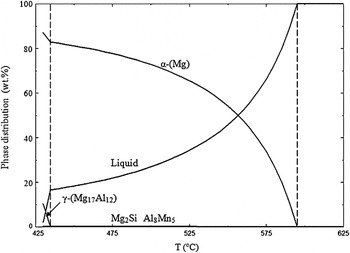
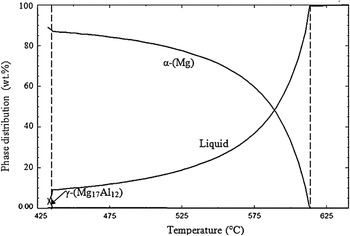
For a better understanding of the phases that evolve during the course of solidification, the phase distribution diagram of AZ91D is calculated using Scheil simulation, as shown in Fig. 7. During solidification, the first phase that precipitates from the liquid is Al8Mn5 followed by Mg2Si, but in a very small amount, and the liquid fraction drops significantly when α-(Mg) phase starts to form. The γ-Mg17Al12 phase appears at 431.5 °C and its amount increases until the end of the solidification. The solidification ends at around 429 °C.
Scheil phase distribution of the AZ91D alloy.

It is worth mentioning that thermodynamic calculations predict the existence of the α-(Mg), γ-Mg17Al12, Al8Mn5, and Mg2Si phases in the final stage of solidification of the AZ91D alloy. However, since the Al8Mn5 and Mg2Si intermetallics precipitate in a very small amount (less than 0.1 wt.%), the DSC signal does not reveal clear thermal events corresponding to the precipitation of these phases.
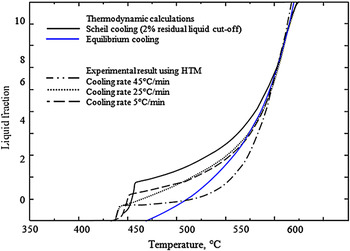
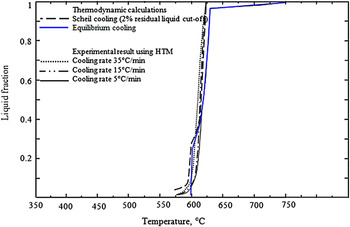
The solidification curves of the AM60B alloy is calculated both in equilibrium and Scheil cooling conditions and shown in Fig. 8. The bend observed in the Scheil cooling curve at 430 °C corresponds to the precipitation of the eutectic phase and this bend is also observed in the experimental solidification curves. According to Scheil cooling the volume fraction of the eutectic is 11%, but experimentally this has been found to be 4% at 5 °C/min cooling rate, which increases with increasing cooling rates.
Comparison between experimental and calculated solidification curves of the AM60B alloy.

The Scheil phase distribution diagram of the AM60B alloy is shown in Fig. 9. During Scheil cooling, the Al8Mn5 phase appears at the beginning of solidification. The liquid fraction decreases significantly when the α-(Mg) phase starts to form. The γ-Mg17Al12 phase appears at 435.6 °C. This alloy has a less amount of the γ-Mg17Al12 phase than in AZ91D. According to Scheil cooling the existing phases in the final stage of solidification of the AM60B alloy would be α-(Mg), γ-Mg17Al12, Mg2Si, and Al8Mn5.
Scheil phase distribution of the AM60B alloy.

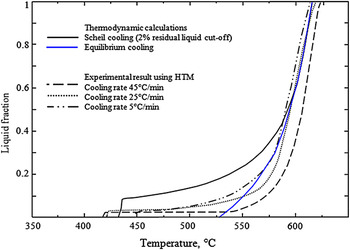
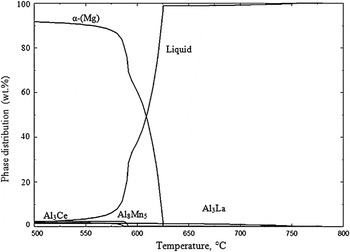
The solidification curves of the AE44 alloy, calculated under equilibrium and Scheil conditions, are compared with the experimental curves in Fig. 10. According to both equilibrium and Scheil cooling conditions, the solidification starts with the precipitation of Al3La at around 750 °C, however, this amount is very small and that is why it is not detected by the DSC. No eutectic formation is observed in the experimental solidification curve. However, the bend in the Scheil solidification curve indicates the formation of other phases such as Al8Mn5 and Al3Ce as can be seen in the phase distribution diagram in Fig. 11.
Comparison between experimental and calculated solidification curves of the AE44 alloy.

Scheil phase distribution of AE44.

According to the Scheil cooling of the AE44 alloy, solidification starts at 759 °C with a small amount of liquid and turns into Al3La until α-(Mg) starts to form at 630 °C. The Al3Ce phase appears at 598 °C and the solidification ends at 575 °C. According to Scheil cooling the α-(Mg), Al3La, Al3Ce, and Al8Mn5 phases exist in the final stage of solidification of the AE44 alloy.
IV. CONCLUSION
In this work, characteristic parameters of the solidification process (such as phase-transformation temperatures, solidification range, and enthalpy of solidification) of three commercial magnesium alloys have been investigated using experimental analysis and thermodynamic calculations. The dependence of transformation temperatures and enthalpy of solidification on the cooling rate has been described by the power law. The calculated phase-transformation temperatures and enthalpy of solidification are in good agreement with the experimental data. Solidification curves have been constructed based on HTM using the DSC experiments and found in accord with Scheil calculation. To simulate the casting process accurately, the effect of cooling rate on the thermophysical properties should be taken into consideration.
ACKNOWLEDGMENT
The authors would like to thank AUTO21 for their financial support of this work.