Implication
In many feeding situations, Lys is estimated as the first limiting amino acid from the ration. This occurs despite the fact that mammary uptake of Lys exceeds output in milk protein and would suggest that Lys catabolism in the mammary gland is needed to support the synthesis of non-essential amino acids.
Introduction
Essential amino acids (EAA) are taken up by the mammary gland (MG) in sufficient or excess amount relative to their output in milk protein. In general, Met, His, Phe (+Tyr) and Trp, referred to as Group 1-AA, are taken up in approximately the same amount as in milk protein secretion whereas Lys and the branched-chain amino acids (BCAA), classified as Group 2-AA, are taken up in excess relative to milk output (Clark, Reference Clark1975; Mepham, Reference Mepham1982). Those AA whose mammary uptake is greater than milk output were initially proposed not to be limiting for typical dairy rations but empirical observations between Lys supply and milk protein yield have identified this AA as limiting in many situations (Rulquin et al., Reference Rulquin, Piselewski, Vérité and Guinard1993; Schwab, Reference Schwab1996). Indeed, despite similarities in their metabolism (Hanigan, Reference Hanigan2005; Lapierre et al., Reference Lapierre, Berthiaume, Raggio, Thivierge, Doepel, Pacheco, Dubreuil and Lobley2005; Reynolds, Reference Reynolds2006), omission of BCAA from an AA mixture infused into the abomasum did not decrease milk protein yield, whereas deletion of Lys did (Weekes et al., Reference Weekes, Luimes and Cant2006).
The magnitude of the excess uptake of EAA relative to output in milk protein is not fixed and, across a range of studies, excess mammary uptake of both Lys and the BCAA, relative to milk output, decreased with reduced protein supply (Rulquin et al., Reference Rulquin, Raggio, Lapierre and Lemosquet2007). Indeed, Leu oxidation across the MG decreased when Leu supply was limited in goats (Bequette et al., Reference Bequette, Backwell, MacRae, Lobley, Crompton, Metcalf and Sutton1996) or when metabolizable protein supply was lowered in dairy cows (Raggio et al., Reference Raggio, Lemosquet, Lobley, Rulquin and Lapierre2006). When only Leu supply was limited (Bequette et al., Reference Bequette, Backwell, MacRae, Lobley, Crompton, Metcalf and Sutton1996), the reduction in mammary Leu oxidation was sufficient to sustain milk protein yield, whereas in contrast, milk protein yield decreased when supply of all the AA was lowered despite a reduction in mammary Leu oxidation (Raggio et al., Reference Raggio, Lemosquet, Lobley, Rulquin and Lapierre2006).
In contrast to the EAA, mammary uptake of many non-essential AA (NEAA) is not sufficient to cover their output in milk protein (Clark, Reference Clark1975; Mepham, Reference Mepham1982). This suggests that the excess of nitrogen (N) and carbons (C) from Group 2-AA may be used to support mammary synthesis of NEAA. Provision of C or N from Group 2-AA for the synthesis of NEAA goes through, however, different pathways. Use of N relies on direct transamination reactions while the C appear as a number of intermediary metabolites that link to precursors of the NEAA. Earlier studies have explored the contribution of the Group 2-AA to the synthesis of NEAA incorporated into milk protein. Studies in vitro have reported that labeled C from Leu could be incorporated into Glu used for milk protein synthesis by mammary tissues in guinea pig (Davis and Mepham, Reference Davis and Mepham1976), cow (Wohlt et al., Reference Wohlt, Clark, Derrig and Davis1977) and goat (Roets et al., Reference Roets, Massart-Leën, Verbeke and Peeters1979), although whether this just represents C–C interchange rather than net production is unclear. In goats in vivo the N of Leu was transferred to a variety of NEAA (Rubert-Alemán et al., Reference Rubert-Alemán, Rychen, Casseron, Laurent and Martin1999) while, in dairy cows, N that originated from Lys, another Group 2-AA, appeared in Arg, Asp, Glu, Ala and Ser, concomitant with an excess mammary uptake of Lys (Lapierre et al., Reference Lapierre, Milne, Renaud and Lobley2003). As deletion of Lys from an AA mixture decreased milk protein yield (Weekes et al., Reference Weekes, Luimes and Cant2006), this might suggest the excess uptake of Lys across the MG may be obligate to maintain milk protein production through support for the synthesis of NEAA.
The current study was therefore designed to test the hypothesis that the excess uptake of Lys by the MG relative to secretion in milk protein is obligate to support mammary synthesis of NEAA and maintain milk protein secretion. Furthermore, the capacity of the dairy cow to limit the detrimental effect of reduced Lys supply was examined, as were the possible underlying mechanisms. The objectives of the current study were to determine how a deficiency of Lys would specifically affect milk protein yield in relation to mammary utilization of Lys for the synthesis of NEAA and net flux of Lys and other AA through splanchnic and mammary tissues.
Material and methods
Animals and treatments
Six multiparous Holstein cows, averaging 733 ± 51 kg body weight and 71.6 ± 17.9 days in milk at the beginning of the experiment, were used in a randomized crossover design, with 7-day periods. Cows had been surgically implanted with abomasal catheters (Doepel et al., Reference Doepel, Lessard, Gagnon, Lobley, Bernier, Dubreuil and Lapierre2006) and with chronic indwelling catheters in the mesenteric, portal, and hepatic veins, and the caudal aorta via a mesenteric artery (Huntington et al., Reference Huntington, Reynolds and Stroud1989), at least 3 months before the initiation of the project. The right carotid artery was surgically raised to a subcutaneous position to allow access to arterial blood in the event that the aorta catheter failed.
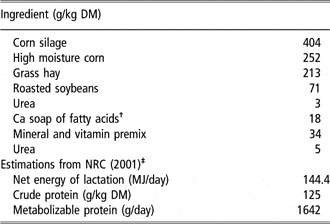
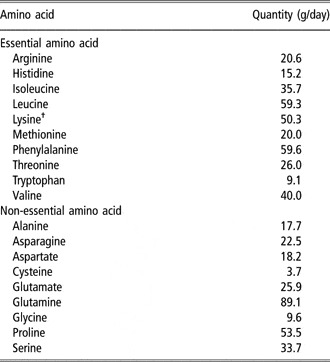
Throughout the study, cows were fed a single diet (Tables 1 and 2) balanced to supply 100% of net energy requirements but only 70% of the estimated requirements of metabolizable protein (MP; National Research Council (NRC), 2001). In addition, cows received an abomasal infusion of a mixture of AA without Lys (Lys−; 560 g/day of the AA mixture; Table 3) or including Lys (Lys+; 610 g/day of the AA mixture, including 50.3 g/day of Lys). The profile of the AA mixture was based on casein profile, with an adjustment to bring the proportion of EAA to 50% of the AA infused, and an additional adjustment for methionine in order to meet the NRC (2001) requirement of 2.4% of MP to ensure that methionine was not limiting (Table 3). In the Lys− and Lys+ treatments, Lys supply averaged 10.3% and 14.7% of EAA, or 4.6% and 6.8% of MP, based on NRC estimation and assuming that all the AA infused were digested. The AA were dissolved in hot tap water as batches every 2 or 3 days. The AA infusions were administered continuously using a peristaltic pump in a daily volume of 6 l per cow. The total mixed ration was fed in 12 equal meals per day delivered at 2-h intervals by automatic feeders (Ankom, Fairport, NY, USA). Cows were fed 97% of ad libitum intake measured the week prior to the initiation of the project. Orts, when present, were recorded and sampled daily. Moisture content of the silages was determined weekly and used to make ration adjustments to ensure constant delivery of dry matter. Cows were given free access to fresh water. Cows were milked twice a day, at 0830 and 1930 h, and milk yield was recorded at each milking. Milk was sampled at each milking on the last 2 days of each experimental period. The experimental protocol was approved by the Institutional Committee for Animal Care of the Lennoxville Research Centre and animals were cared for in accordance with the guidelines of the Canadian Council on Animal Care (1993).
Ingredient and nutrient composition of the total mixed ration fed to the cows through the study

DM = dry matter.
†Megalac, Church & Dwight Co., Inc., Princeton, NJ, USA.
‡Estimated from the measured intake and production of the cows infused with Lys.
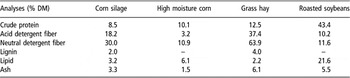
Chemical composition of the feed ingredients

DM = dry matter.
Composition of the amino acid mixture infused to the dairy cows through the study

†Excluded for the Lys deletion treatment.
Infusion of labeled lysine and blood sampling
On day 7 of each experimental period, all cows received a 7.5 h (from 0800 to 1530 h) jugular infusion of [2-15N]Lys (0.8 mmol/h), preceded by a priming dose (0.8 mmol). Concomitantly, para-amino hippuric acid (pAH; 10% wt/vol) was infused into a mesenteric vein catheter from 0900 to 1530 h to determine plasma flow across the splanchnic tissues. The pAH infusion (14.4 g/h) began 1 h before the initiation of blood sampling and was preceded by a priming dose (2 g). Starting at 1000 h, six blood samples were collected simultaneously into heparinized tubes from the arterial, hepatic venous and portal catheters every 45 min for 4 h, covering two cycles of feeding. Blood samples were also obtained from the subcutaneous abdominal vein by venipuncture following the same 45 min sampling schedule. Immediately after collection, blood was placed on ice and centrifuged (15 min, 1800 × g at 4°C) within 30 min of collection to yield plasma. For AA analysis, 1 g of plasma was immediately added to 0.2 g of an internal standard of AA labeled with stable isotopes and the processed samples were kept frozen at −80°C. The internal standard solution was prepared with labeled AA diluted in water with the following concentrations (μM): DL-[α-15N]His (180), L-[15N]Ile (708), L-[1-13C]Leu (864), DL-[2-15N]Lys-2HCl (486), DL-[1-13C]Met (86), L-[1-13C]Phe (247), L-[15N]Thr (375), L-[15N]Val (835), L-[1-13C]Ala (1060), L-[15N]Cys (227), L[1-13C]Glu (273), L-[1-13C]Gln (949), L[1-13C]Gly (1131), L[1-13C]Ser (491) and L-[15N]Tyr (245). Labeled AA (95–99 at%) were supplied by CDN isotopes (Montreal, QC, Canada) for His, Leu, Lys, Met and Phe and Cambridge Isotope Lab (Andover, MA, USA) for others. Label present in plasma Lys following the [2-15N]Lys infusion was allowed for when concentrations were determined by this isotope dilution method. In addition, the cows were milked 6 and 7 h after the initiation of the labeled Lys infusion (1400 and 1500 h) following oxytocin injection. Milk was sampled at the last milking for determination of the enrichment of AA in casein. Arterial and mammary venous blood samples were also collected at the same time as the last milking and centrifuged for the determination of the enrichment of AA in plasma.
Laboratory analyses
Pooled samples of feed ingredients were freeze-dried and ground through a 1-mm screen Wiley mill (standard model 4; Arthur H. Thomas, Philadelphia, PA, USA). Subsamples were ashed at 550°C for 12 h in a muffle furnace. Total N concentration was determined by combustion (LECO model FP-428 Nitrogen Determinator; LECO, St. Joseph, MI, USA), and crude protein (CP) was calculated as N × 6.25. The concentration of neutral detergent fiber (NDF) was determined as described by van Soest et al. (Reference van Soest, Robertson and Lewis1991) using sodium sulfite and heat-stable α-amylase. The acid detergent fiber (ADF) content was determined as described by Robertson and Van Soest (Reference Robertson and Van Soest1981). The NDF and ADF procedures were adapted for use in an Ankom200 fiber analyzer (Ankom Technology, Fairport, NY, USA).
Milk N content (CP = N × 6.38) was also determined by combustion. Milk true protein and casein contents were determined as described by Raggio et al. (Reference Raggio, Pacheco, Berthiaume, Lobley, Pellerin, Allard, Dubreuil and Lapierre2004). Milk fat was measured according to the Roese–Gottlieb method (Association of Official Analytical Chemists, 2000). Plasma concentrations of pAH were determined with an automatic analyzer (Technicon Autoanalyser II; Technicon Instruments Corporation, Tarrytown, NY, USA) on the day of the sampling. Plasma AA concentrations were measured by isotope dilution using gas chromatography/mass spectrometry (Calder et al., Reference Calder, Garden, Anderson and Lobley1999). Milk AA concentration was also analyzed by isotopic dilution after milk samples were hydrolyzed for 24 h, as reported by Borucki Castro et al. (Reference Borucki Castro, Phillip, Lapierre, Jardon and Berthiaume2007). The IE of 15N-AA were measured in milk casein, after protein hydrolysis, using gas chromatography/combustion/isotope ratio mass spectrometry (Delta plus XL fitted with a GC C II–III interface; Thermo Scientific, Winsford, Cheshire, UK), as previously described (Lapierre et al., Reference Lapierre, Ouellet, Berthiaume, Martineau, Holtrop and Lobley2008).
Calculations
Plasma flow across the splanchnic tissues was calculated from downstream dilution of the infused pAH. Milk AA output in protein was calculated using milk CP yield measured during the last 2 days of each period, with a 3.5% correction for blood-borne proteins. The milk AA compositions per treatment obtained from our analyses were used for Leu, Lys, Phe, Thr and Tyr concentrations. Concentrations of these AA in milk, on a CP basis, were almost identical to those reported previously (Swaisgood, Reference Swaisgood1995) for the Lys+ treatment, and were 10% higher than concentrations of milk of cows on Lys−. Therefore, for the other AA, reported values (Swaisgood, 1995) were used for Lys+ and concentrations for Lys− were calculated so that concentrations of Lys+ were 10% higher than the Lys−. Table values were used for other AA because no performic acid oxidation was performed prior to hydrolysis and only a single time of hydrolysis was used. In summary, the values (mg of AA per g of CP) used were: Ala: 30.0 v. 33.0, Asp: 30.9 v. 34.0, Asn: 38.2 v. 42.0, Cys: 6.4 v. 7.0, Gln: 86.0 v. 94.0, Glu: 110.0 v. 121.0, Gly: 16.4 v. 18.0, His: 24.5 v. 27.0, Ile: 53.6 v. 59.0, Leu: 88.7 v. 96.0, Lys: 77.5 v. 85.0, Met: 25.5 v. 28.0, Phe: 44.5 v. 48.9, Pro: 91.0 v. 100.0, Ser: 57.3 v. 63.0, Thr: 39.6 v. 43.6, Trp: 13.6 v. 15.0, Tyr: 44.8 v. 49.6, Val: 60.0 v. 66.0, for Lys− v. Lys+, respectively. Mammary plasma flow was estimated according to the Fick principle using Phe and Tyr as internal markers, again with allowance for a 3.5% contribution from blood-borne proteins: mammary plasma flow = ([milk Phe + Tyr] × 0.965)/(AV difference Phe + Tyr) (Cant et al., Reference Cant, DePeters and Baldwin1993). The net fluxes of AA across the portal-drained viscera (PDV), liver, total splanchnic tissues (TSP) and MG were calculated for each cow period as the product of the average plasma venous–arterial concentration difference and the average plasma flow. A negative flux indicates utilization or removal, whereas a positive flux indicates net production or release of the nutrient across the tissue.
Net mammary flow of 15N-AA was calculated as

where [A] and [M] represent the concentration, and IEA and IEM the enrichment of each AA in the artery and in the mammary vein, respectively.
The rate of 15N-AA in milk output was calculated using the IE of the AA in milk casein and the average milk protein yield observed during the last 2 days of each period. The IE of milk casein was found to be similar to the IE of whey protein with a [15N]Leu infusion (Rubert-Alemán et al., Reference Rubert-Alemán, Rychen, Casseron, Laurent and Martin1999). The distribution of 15N in milk was calculated as the rate of 15N-AA in milk for each AA relative to their summation. When individual AA data were expressed relative to Lys enrichments, the assumption was made that the fractional inflows from plasma and protein breakdown were similar for all AA. An estimation of the fraction of other AA-N in milk protein derived from Lys was obtained from the ratio of the IE of the relevant AA to that of Lys in casein. This estimation is a simplification as throughout the infusion other AA became labeled and could act as 15N donors, but labeled Lys dominated the total enrichment and the contribution from other AA would probably be minor. This amount relative to the total secretion of this AA in milk protein yielded the proportion of each AA in milk protein that originated via N transfer from Lys.
Statistical analysis
The AA concentrations and net flux data were averaged over the six sampling times on the last day of each period, and dry matter intake (DMI), milk yield and milk composition were averaged over the last 2 days of each period. Data from one cow on the last period were deleted due to mastitis (treatment Lys−). All data were statistically analyzed using the GLM procedure of SAS (SAS Institute Inc., 1999) with treatment, period and cow as the main effects according to the crossover design. When different sites were analyzed, treatment and period effects were tested using cow nested in (period × treatment) as the error term, and the site was considered as a repeated measurement. Treatment differences were considered significant if P ⩽ 0.05 and as a tendency with 0.05 < P ⩽ 0.10. All data are reported as least-squares means with pooled standard error of the means (s.e.).
Results
Milk production
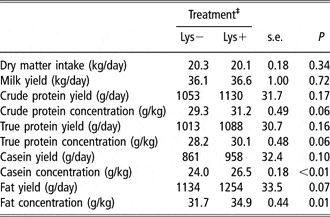
DMI, milk and milk CP yields were not affected (P > 0.10) by treatments. Nonetheless, Lys deletion tended (P = 0.06) to decrease crude and true protein concentrations whereas casein was lowered in both concentration (P < 0.01) and yield (P = 0.10). Deletion of Lys from the infusate also decreased both fat concentration (P ⩽ 0.01) and yield (P < 0.10; Table 4).
Effect of lysine deletion from an abomasal infusion of amino acids on milk production and composition in lactating Holstein cowsFootnote †

† Least-squares means with s.e. given for n = 5.
‡ Lys−: Lys removed from the AA mixture; Lys+: Lys included in the AA mixture.
Arterial concentrations and net fluxes of amino acids across tissues
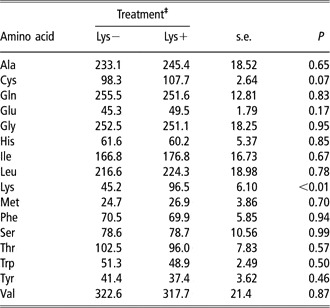
Concentrations of Lys in the artery decreased markedly (P < 0.01) from 96.5 to 45.2 μM with Lys deletion as it did in the mammary vein (from 38.4 to 5.5 ± 4.73 μM, P = 0.02). Of the other AA measured, however, only cysteine arterial concentration tended (P = 0.07) to decrease with Lys deletion (Table 5).
Effect of lysine deletion from an abomasal infusion of amino acids on arterial concentrations of amino acids (μM) in lactating Holstein cowsFootnote †

† Least-squares means with s.e. given for n = 5.
‡ Lys−: Lys removed from the AA mixture; Lys+: Lys included in the AA mixture.
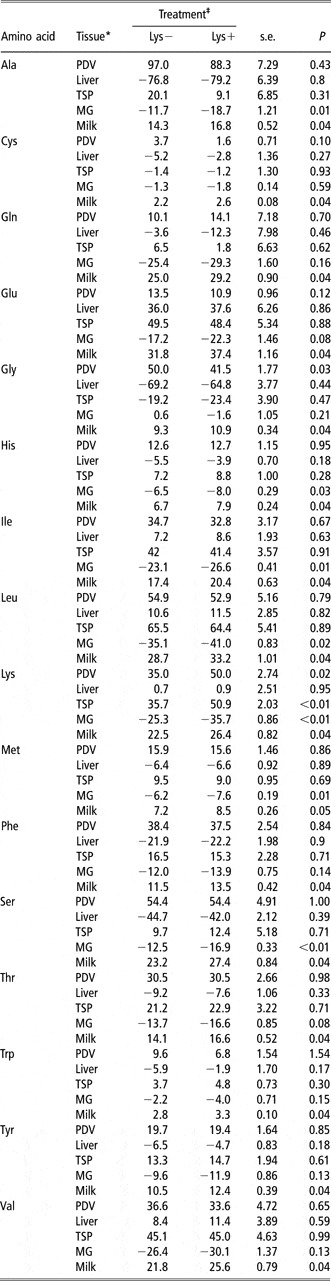
Plasma flow across the PDV, liver and MG were not affected by treatment and averaged 1619 v. 1646 ± 30.8, 1978 v. 1952 ± 49.4 and 587 v. 592 ± 34.2 l/h for Lys− v. Lys+, respectively. Net fluxes of individual AA across tissues are presented in Table 6. Lysine net portal appearance increased (P = 0.02) with abomasal infusion of Lys and this was reflected in a similar increment (P < 0.01) in net splanchnic flux, as net hepatic flux of Lys was not affected by treatments and was not different (P < 0.01) from 0. Otherwise, there was little effect of treatment on net splanchnic flux of individual AA, with only portal flux of Gly being increased (P = 0.03) by Lys deletion. The Lys− conditions had, however, a more pronounced effect at the MG level, with lowered (P < 0.05) mammary uptake of not only Lys but also Ala, His, Ile, Leu, Met, Ser, with a tendency (P ⩽ 0.10) for Glu and Thr. Secretion of all AA in milk protein increased (P = 0.04) with Lys+. The mammary uptake to output ratio of Lys decreased (P = 0.04) from 1.37 to 1.12 ± 0.053 whereas mammary Lys extraction increased (P < 0.01) from 0.61 to 0.85 ± 0.022 with Lys deletion. The uptake to output ratios of other EAA across the MG were not affected by treatments (P > 0.05; data not shown).
Effect of lysine deletion from an abomasal infusion of amino acids on splanchnic and mammary net fluxes of amino acids (mmol/h) in lactating Holstein cowsFootnote †

† Least-squares means with s.e. given for n = 5; a positive value denotes a release and a negative value an uptake across the tissue.
‡ Lys−: Lys removed from the AA mixture; Lys+: Lys included in the AA mixture.
* Tissue: PDV = portal-drained viscera; TSP = total splanchnic tissue; MG = mammary gland.
Transfer of N from lysine to other amino acids across the mammary gland and in milk
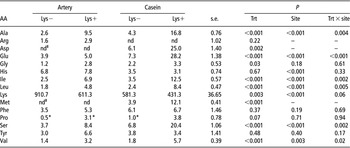
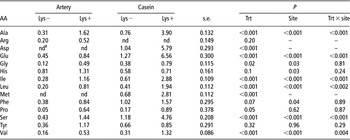
The isotopic enrichments (IE) of individual AA in arterial plasma and in milk casein are presented in Table 7. The IE of all AA studied were greater than 0 (P ⩽ 0.05) except for Pro. The IE of Lys was greater (P < 0.001) in arterial plasma than in milk casein and was also higher (P = 0.003) in Lys− compared with Lys+. Conversely, Lys deletion decreased the IE of Asp and Met in casein (these AA were not determined in plasma) and in both casein and plasma for Ala, Glu, Gly, Ile, Leu, Ser and Val. Except for Gly, the decrease was larger in milk casein than in arterial plasma (treatment × site interaction; P ⩽ 0.02). Enrichments of His, Phe and Tyr were not affected by treatment but His IE were lower (P < 0.001) in milk casein than in plasma. When expressed relative to the IE of Lys, a similar picture is obtained except that the site effect became significant (P < 0.05) for Gly and Phe (Table 8).
Effect of lysine deletion from an abomasal infusion of amino acids (AA)-N on the enrichments (at% excess × 1000) of AA in arterial plasma and in milk casein after 7 h of an infusion of [15N]lysineFootnote †

† Least-squares means with s.e. given for n = 5; the cows had also been milked with oxytocin 6 h after the start of the infusion; Lys−: Lys removed from the AA mixture; Lys+: Lys included in the AA mixture.
‡ nd: not determined.
* Not different from 0 (P < 0.05).
Effect of lysine deletion from an abomasal infusion of amino acids (AA) on the percentage of the enrichments of the AA relative to lysine in arterial plasma and in milk casein after 7 h of an infusion of [15N]lysineFootnote †

† Least-squares means with s.e. given for n = 5; the cows had also been milked with oxytocin 6 h after the start of the infusion; Lys−: Lys removed from the AA mixture; Lys+: Lys included in the AA mixture.
‡ nd: not determined.
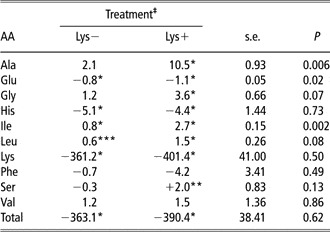
The labeled AA in milk casein can originate from N transfer of 15N of Lys in the MG or from mammary uptake of labeled AA derived from amination reactions in other tissues and exported to plasma either in free form or incorporated into proteins for later transport into milk. Uptake of 15N-AA was therefore calculated for the AA for which both concentrations and IE were available (Table 9). Uptake of 15N via Lys represented more than 99% of the total uptake of 15N. Nonetheless, net uptakes of labeled Glu and His were positive (P ⩽ 0.05), but only uptake of labeled Glu decreased (P = 0.02) with Lys deletion. Interestingly there was net release (P ⩽ 0.05) into the mammary vein of labeled Ala, Gly, Ile, Leu and Ser with Lys+ treatment. Of these, Ala and Ile decreased (P ⩽ 0.01) while Gly and Leu tended to be reduced (P < 0.10) with Lys deletion.
Effect of lysine deletion from an abomasal infusion of amino acids on mammary net flux of 15N amino acids (μmol/h) during an infusion of [15N]lysineFootnote †

† Least-squares means with s.e. given for n = 5; a positive value denotes a release and a negative value an uptake across the mammary gland.
‡ Lys−: Lys removed from the AA mixture; Lys+: Lys included in the AA mixture. Different from 0: *P ⩽ 0.01; **P ⩽ 0.05; ***P ⩽ 0.10.
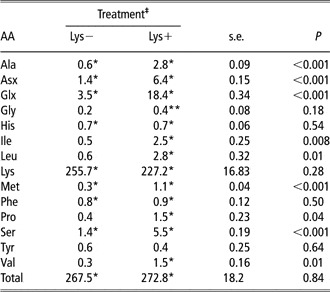
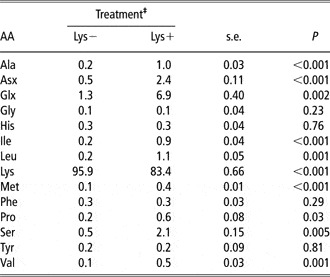
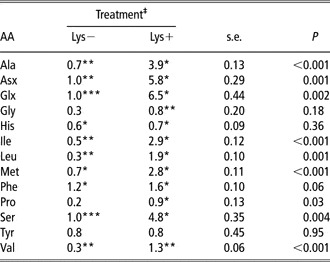
The rate of secretion of 15N-AA into milk protein decreased (P < 0.05) for Ala, Asx, Glx, Ile, Leu, Met, Pro, Ser and Val with Lys deletion (Table 10). The distribution of 15N amongst AA in milk protein followed the same pattern. Most of the labeling in the milk casein was in Lys and this represented a higher proportion (P < 0.001) of total 15N with Lys deletion (Table 11). Deletion of Lys from the infusate also decreased the proportion of AA-N that originated from Lys for Ala, Asx, Glx, Ile, Leu, Met, Pro, Ser and Val (P ⩽ 0.03) and Phe (P = 0.06) while Gly, His and Tyr were unaffected (Table 12).
Effect of lysine deletion from an abomasal infusion of amino acids on 15N-amino acids in milk collected after 7 h of an infusion of [15N]lysine (μmole/h)Footnote †

† Least-squares means with se given for n = 5; a positive value denotes a release and a negative value an uptake.
‡ Lys−: Lys removed from the AA mixture; Lys+: Lys included in the AA mixture. Different from 0: *P ⩽ 0.01; **P ⩽ 0.05.
Effect of deletion of lysine from an abomasal infusion of amino acids (AA) on the distribution of 15N between AA (% of labeled AA-N) in milk collected after 7 h of a [15N]lysine infusionFootnote †

† Least-squares means with s.e. given for n = 5; measured after 7 h of an infusion of [15N]lysine with the cows milked with oxytocin 6 h after the start of the infusion.
‡ Lys−: Lys removed from the AA mixture; Lys+: Lys included in the AA mixture.
Effect of lysine deletion from an abomasal infusion on the percentage of individual amino acids in milk originating from transamination with N from lysineFootnote †

† Least-squares means with s.e. given for n = 5; measured after 7 h of an infusion of [15N]Lys with the cows milked with oxytocin 6 h after the start of the infusion.
‡ Lys−: Lys removed from the AA mixture; Lys+: Lys included in the AA mixture. Different from 0: *P ⩽ 0.01; **P ⩽ 0.05; ***P ⩽ 0.10.
Discussion
Performance and net fluxes of amino acids across tissues
Based on actual DMI and feed ingredient composition, the Lys− treatment was estimated to provide 102 g/day of digestible Lys (NRC, 2001), creating a shortage v. recommended supply that was provided by the addition of 50.3 g Lys for Lys+ cows. The DMI was not affected by the Lys imbalance across any of the 7-day experimental periods (Table 4). This contrasts with the study of Weekes et al. (Reference Weekes, Luimes and Cant2006) who reported a 35% decrease in DMI on days 2 and 3 of Lys imbalance. In their study, however, the basal diet offered contained only 9.3% CP and with the infusion of 1058 g of the AA mixture excluding Lys probably created a more severe imbalance. In the current study, care was taken to avoid a severe deficiency of a single EAA as this is known in all mammalian species to inhibit food intake (Harper et al., Reference Harper, Benevenga and Wohlhueter1970). The current study agrees with Weekes et al. (Reference Weekes, Luimes and Cant2006) in that milk yield was not affected by Lys deletion but disagrees in that fat yield tended to decrease as opposed to a numerical increase in the earlier report. Nonetheless, the combination of trends in decreased milk true protein concentration and milk yield resulted in decreased AA secretion as milk protein with Lys deletion, supporting the decreased milk protein yield observed with more severe Lys depletion (Weekes et al., Reference Weekes, Luimes and Cant2006).
The addition of Lys in the AA mixture increased the net portal absorption of Lys by 15 mmol/h, an amount identical to the quantity infused (50.3 g/day = 14.3 mmol/h). This would suggest little, if any, oxidation of this additional supply by the PDV and supports other work in ruminants based on either direct measurement of systemic Lys catabolism in sheep (Lobley et al., Reference Lobley, Shen, Le, Bremner, Milne, Calder, Anderson and Dennison2003), high portal recovery of Lys from casein infused into the abomasum of lambs (El-Kadi et al., Reference El-Kadi, Baldwin, Sunny, Owens and Bequette2006) or comparison of estimated digestive flow with measured net portal absorption of Lys in dairy cows (Pacheco et al., Reference Pacheco, Schwab, Berthiaume, Raggio and Lapierre2006). While no oxidation of systemic Lys across the PDV was observed in pigs on low-protein diets, catabolism of Lys supplied enterally did occur on high-protein intakes and this represented 31% of the whole-body Lys oxidation (van Goudoever et al., Reference van Goudoever, Stoll, Henry, Burrin and Reeds2000). Currently, it is unclear whether these differences are related to species, technique or experimental design. In the current study, net portal absorption of the other AA was not affected by Lys deletion.
Similarly, net liver flux of AA was unaltered by treatments. Net Lys removal by the liver of the dairy cow is low, even under replete conditions, and therefore net splanchnic release of Lys reflected closely the amounts absorbed and was 15.2 mmol/h lower with Lys−. For both treatments, however, post-liver supply was greater than mammary uptake, which exceeded milk output, as usually observed for Lys (Lapierre et al., Reference Lapierre, Berthiaume, Raggio, Thivierge, Doepel, Pacheco, Dubreuil and Lobley2005). Nonetheless, mammary uptake only decreased by 10.1 mmol/h due to Lys deletion while Lys in milk protein secretion only differed by 3.9 mmol/h compared with Lys+. This supports the outcome of a recent literature review that indicated excess Lys uptake by the MG relative to milk output was reduced as Lys supply decreased (Rulquin et al., Reference Rulquin, Raggio, Lapierre and Lemosquet2007). Similarly, the residuals between measured and ‘predicted’ venous Lys showed a linear bias with increasing Lys supply (Hanigan et al., Reference Hanigan, France, Crompton and Bequette2000) and this would be expected if mechanisms not associated directly with milk protein synthesis account for a variable proportion of Lys uptake as supply varies. Both such model outcomes and the current experimental data may be explained by three mechanisms. First, the cows adapted to the Lys deficiency by reducing net utilization or catabolism of Lys in peripheral (non-mammary, post-splanchnic) tissues. There may be limits to this adaptation, however, because mammary uptake was still impacted negatively by the deficient diet. It is unclear whether this is due to obligate needs for Lys in peripheral tissues or reflects the fact that complete suppression of AA catabolism is difficult to achieve (Lobley and Lapierre, Reference Lobley and Lapierre2003). The second mechanism involved enhanced extraction rate of the Lys supply to the MG. Thus, although arterial Lys concentration was decreased by 53%, the net mammary uptake was reduced by only 29% because the extraction rate was elevated by 28%. This increased efficiency resulted in mammary vein Lys concentrations as low as 5 μM. Such near-complete extraction means that a further increased net Lys removal to any great extent could only have occurred through increased blood flow but this was not triggered by the current deficiency. In this respect, the data do not coincide with observations in lactating goats made His deficient by a similar experimental approach (Bequette et al., Reference Bequette, Hanigan, Calder, Reynolds, Lobley and MacRae2000). In that study, mammary vein concentrations of His were reduced to near zero, as observed here, but net supply was enhanced by increased blood flow and, together, these minimized the impact on milk protein output. The third mechanism involved a decrease uptake : output ratio of Lys under the deficiency conditions. Such decreases in uptake : output have been observed for Lys when total AA supply is varied (Rulquin et al., Reference Rulquin, Raggio, Lapierre and Lemosquet2007). Similarly, the uptake : output ratio was reduced from 2.13 to 1.23 when decreasing doses of Lys infused into the duodenum (Guinard and Rulquin, Reference Guinard and Rulquin1994). In these studies and in the current study, although the MG could decrease the uptake : output ratio, the values always exceeded unity, even at low supply. This suggests there might be an obligate requirement within the gland for additional Lys above that directly targeted for milk protein synthesis. Certainly, it is known that Lys-N can be used to support necessary NEAA synthesis within the MG (Lapierre et al., Reference Lapierre, Milne, Renaud and Lobley2003).
More detailed examination of this third mechanism forms a major component of the current investigation. One objective was to determine whether a reduced supply of Lys could be partially compensated through increased MG uptake of other EAA as these, in theory, could also support the synthesis of NEAA. On a net basis, however, there was no evidence of additional uptake of any AA during Lys deletion. The most obvious candidates are the BCAA as these are taken up in excess by the MG (Rulquin et al., Reference Rulquin, Raggio, Lapierre and Lemosquet2007), and their mammary utilization is sensitive to nutrient supply (Bequette et al., Reference Bequette, Backwell, MacRae, Lobley, Crompton, Metcalf and Sutton1996; Raggio et al., Reference Raggio, Lemosquet, Lobley, Rulquin and Lapierre2006), offering therefore provision of both N and C for NEAA synthesis. In practice, however, their net uptake decreased significantly both as a group and individually (Ile and Leu), whereas the uptake : output ratio was unaffected (P = 0.73) by treatment and averaged 1.26 v. 1.25 ± 0.03 for Lys− v. Lys+, respectively. This meant that, despite their known metabolic flexibility, no extra uptake occurred to compensate for the lowered metabolism of Lys. Not surprisingly, the uptake of Group 1-AA decreased similarly to milk protein production and their uptake : output ratios were unaltered by treatment at 0.93 v. 0.99 ± 0.05 for Lys− v. Lys+, respectively. Furthermore, there did not appear to be any compensation in the Lys− cows of NEAA uptake. Rather, uptakes were actually reduced for some (Ala and Ser, plus a tendency for Glu). Overall, therefore, there was no obvious candidate that replaced Lys uptake under deficiency conditions even though the decreased N supply within the MG was the equivalent to 40% of the lowered milk true protein-N secretion. This then raises the question of how is the Lys used within the gland and is this a unique function? This issue was examined in detail based on the 15N kinetics.
Transfer of N from lysine to other amino acids within the mammary gland and into milk
Unlike many other AA, Lys does not undergo transamination reactions that preserve the C skeleton but, rather, as part of the saccharopine or l-amino acid oxidase pathways, the N atoms are irreversibly transferred to 2-oxoglutarate to form Glu or released as ammonia with again 2-oxoglutarate as probably the preferred acceptor. Transfer (loss) of 15N from Lys therefore represents irreversible breakdown of Lys. Once the 15N is transferred to Glu, this can be involved in a wide range of transamination reactions, some of which may involve simple exchange of 14N with 15N with no real net gain of N. In addition, two other considerations are necessary when using isotope tracers to interpret MG metabolism. First, not all of any AA synthesized within the MG are exported in milk protein and, indeed, approximately, 30% of protein synthesis within the MG supports maintenance of constitutive proteins (Bequette et al., Reference Bequette, Backwell, MacRae, Lobley, Crompton, Metcalf and Sutton1996; Raggio et al., Reference Raggio, Lemosquet, Lobley, Rulquin and Lapierre2006) and this captures a corresponding proportion of the newly synthesized AA. Second, labeled AA sources within the MG are diluted by unlabeled AA released by intracellular protein degradation and this complicates interpretations based on isotopic enrichment. Finally, the current study focuses on the fates of Lys-N but it needs to be remembered that Lys-C flows through glutaryl-CoA and provides ketogenic products, with net outputs for either fat synthesis or energy release. The current observations also relate only to the transfer of the amino-N of Lys into other products but similar transfers would be predicted for the amido-N as both enter intermediary metabolism via glutamate. This was shown to be the case in the preliminary study (Lapierre et al., Reference Lapierre, Milne, Renaud and Lobley2003) and means that the values for transfer observed with the current cows should be doubled to better represent the contribution of Lys total N.
The total amount of 15N in milk protein did not change with treatments but the distribution of the 15N into AA was affected by Lys deletion. In conditions that simulated normal feeding (Lys+ treatment), 83% of the 15N was present as Lys, with Glx, Asx, Ser and Ala harvesting, respectively, 6.8%, 2.4%, 2.1% and 1.0%. Furthermore, together the BCAA represented 2.5% of 15N in milk protein. These various values are similar to those reported in a preliminary study (Lapierre et al., Reference Lapierre, Milne, Renaud and Lobley2003) that infused either [5-15N]Lys or [2-15N]Lys. Both N atoms enter similar products during the catabolism of Lys and therefore would not be expected to differ in either the absolute or proportional transfers, as effectively observed. Glutamate is a key intermediate in amino-N transfers in many tissues of the body including hepatic ammonia capture (Lobley et al., Reference Lobley, Weijs, Connell, Calder, Brown and Milne1996). As a primary outcome of Lys degradation, Glu then acts as a transamination precursor for Asp, Ala and Ser in particular for the NEAA and for the BCAA from the EAA. Indeed, in ruminants, Leu has been shown to be a major intermediate in N-transfers linked to the high transamination rate in many tissues including muscle (Holtrop et al., Reference Holtrop, Lapierre and Lobley2004) and the MG (Bequette et al., Reference Bequette, Kyle, Cromptpon, Anderson and Hanigan2002). Indeed, in goats injected with a single dose of [15N]Leu the distribution of labeled N was in the group order: Ile-Leu > Glx > Asx-Thr-Ser > Pro > Gly-Ala-Val-Met (Rubert-Alemán et al., Reference Rubert-Alemán, Rychen, Casseron, Laurent and Martin1999). Thus, a wide distribution of Lys-N into other AA is expected through these various routes. De-amination of Group 2-AA also releases the C-skeletons to be used either as energy sources or as precursors for intermediary metabolites that may be used in the formation of the NEAA. Release of C-3 intermediates during the degradation of Ile and Val provides such anabolic sources, as shown by isotope incorporation into Glu, Asp, Ala and Ser in the perfused udder of the goat (Roets et al., Reference Roets, Massart-Leën, Verbeke and Peeters1979) and in bovine MG slices (Wohlt et al., Reference Wohlt, Clark, Derrig and Davis1977). Carbon from Leu also appears in these AA (Wohlt et al., Reference Wohlt, Clark, Derrig and Davis1977; Roets et al., Reference Roets, Massart-Leën, Peeters and Verbeke1983), but this may be a result of isotope exchanges across Krebs’ cycle rather than net production.
This metabolic flexibility means that products of Lys catabolism might be synthesized either within the MG or in other tissues and then transported to the udder via plasma. That the latter occurs is shown by the fact that enrichments of all AA, except for Pro, in arterial supply differ from zero. Of course, some of these labeled plasma AA may have been produced within the MG and exported and then re-circulated for subsequent uptake. Indeed, mammary venous enrichments of Ala, Gly, Ile, Leu, Ser and Val exceeded (P < 0.05, data not shown) those in the artery and, therefore, synthesis within, and export, from, extra-mammary tissues must have occurred. The extent of mammary syntheses of the various AA cannot be assessed by the direct comparison of enrichments in milk protein and arterial plasma because the former were always lower due to the intracellular dilution by protein degradation with short-term isotope infusion. Instead, comparisons were made by expressing the IE of individual AA relative to that of Lys as this compensates, in part, for the effect of the intracellular dilution. For all AA analyzed, except His, Pro and Tyr, their IE relative to Lys was greater in milk casein than as arterial free AA, indicating the transfer of Lys-15N to these AA within the MG. Across treatments, the IE relative to Lys in milk protein increased by 1.9 (Gly) to 6.2 (Glu) compared with plasma, demonstrating the activity of the intracellular process.
Nonetheless, although both treatments showed N-transfers from Lys within the MG, the rates were considerably lower with Lys depletion, both in terms of the absolute enrichments of the various AA and when expressed relative to Lys. The reduction in absolute arterial enrichment of Ala, Glu, Gly, Ile, Leu, Ser and Val would suggest that intracellular synthesis and(or) export to plasma was decreased when Lys supply was deficient. Furthermore, the lower values for relative AA IE between milk casein and the artery indicate that intracellular transfers within the MG were also depressed during the deficiency and this supports the observation that a smaller fraction of the 15N in the milk protein was in the non-Lys form. The obvious question is ‘Are transfers to a particular AA “protected” when Lys is deficient?’ as this would indicate a targeted use for Lys. Unfortunately, the answer is somewhat equivocal. For example, if the intermediate Glu is taken as reference then the fraction of N arising from this AA is greater for Ser and Gly. These are NEAA linked metabolically and are both extracted by the MG in considerable deficit to milk protein output needs. The gland, therefore, has to find alternative sources for these AA, including synthesis de novo.
Finally, mention has already been made of the fact that the MG is a potential contributor to N exchanges within the whole body. In addition to their export in milk protein, for example, there was net release of labeled Ala, Gly and Ser into the mammary vein in Lys+, which decreased with Lys deletion. There was even a greater flow of newly synthesized Ala that returned to the mammary vein than that incorporated into milk protein and this occurred for both treatments, albeit at greater amounts under Lys-sufficient conditions. The role of glucose-Ala C transfers between peripheral tissues and liver is well known in mammals (Perriello et al., Reference Perriello, Jorde, Nurjhan, Stumvoll, Dailey, Jenssen, Bier and Gerich1995) and in this way the MG may contribute to conservation of metabolites that form part of the critical gluconeogenic pathways essential to support milk output via supply of lactose precursors. The net export of Ala from the MG can be compared with the directed transfer of Ser towards milk protein synthesis and emphasizes the metabolic flexibility essential to maximize milk output even under unfavorable nutritional conditions. In contrast, the flows of newly synthesized Gly and Ser were directed more towards milk protein than release into the mammary vein. Glu, Gly and Ser were the AA with the lowest uptake : output ratio, indicating high requirement for intra-mammary synthesis.
Conclusion
Despite the fact that the MG of the cow is more efficient in using a larger proportion of extracted Lys towards milk protein secretion under limited supply, a supply limited to only 10.3% of EAA still reduced secreted AA as milk protein. This reduced mammary utilization involves not only less Lys available for direct incorporation into milk protein but also a lower contribution of Lys-N to support mammary synthesis of NEAA, the uptake of which is in deficit relative to milk output. In absolute terms, this reduction affected predominantly Glx-N, including Glu-N, which is a direct product of Lys degradation. The ability of the dairy cow to direct more dietary Lys towards the MG appears to have limits and, even within the udder, some of the Lys enters degradative pathways at a low supply of Lys. This would suggest that part, at least, of Lys catabolism in the MG is either needed or cannot be prevented completely with such catabolism providing N to support the synthesis of NEAA.
Acknowledgements
The authors thank the staff of the Lennoxville Dairy and Swine Research Centre for taking care of the animals, L. Croteau, M. Léonard, J. Renaud and B. Vallerand for their dedicated technical support, and Dr P. Dubreuil for splanchnic surgeries. Part of this work was funded by the core grants from the RERAD of the Scottish Executive to the Rowett Institute of Nutrition and Health at Aberdeen University. The authors also wish to acknowledge the supply of amino acids by Ajinomoto and the financial support of the Natural Sciences and Engineering Research Council of Canada and of Agriculture and Agri-Food Canada (Lennoxville Research Centre Contribution number 974).