


Chain shifts
Vocalic chain shifts are a hallmark of sound change in English, both historically and in ongoing sound changes. Dinkin (Reference Dinkin, Nevalainen and Traugott2012) defines a chain shift as “a set of phonetic changes affecting a group of phonemes so that as one phoneme moves in phonetic space, another phoneme moves toward the phonetic position the first is abandoning; a third may move toward the original position of the second, and (perhaps) so on” (748). The notion of maximal contrast or dispersion has long played a crucial role in modeling the phonetic character of vowel spaces—systems of vowels across languages show a tendency toward maximizing the phonetic space between phonemes within the vowel space (Flemming, Reference Flemming1996; Labov, Ash, & Boberg, Reference Labov, Ash and Boberg2006; Liljencrants & Lindblom, Reference Liljencrants and Lindblom1972). Along these lines, Martinet (Reference Martinet1952) proposed the margins of security explanation for the nature of chain shifts, that is, phonemes move (or remain stable) in order to maintain enough distance between one another to remain perceptually distinctive. Thus, when a given ‘triggering’ movement occurs, the following phonetic movements of adjacent phonemes occur in order to maintain these distinctions in maximal phonological space.
In order to model sound change as a chain shift, the causal nature of links in the chain must be established temporally (Gordon, Reference Gordon2011; Labov, Reference Labov2010:145). If the movement of one phoneme causes the movement of another, we must find evidence of the triggering event pre-dating the later one in a given community in real or apparent time. Furthermore, the shift must be structurally and spatially plausible. For example, if chain shifts occur in response to margins of security in F1-F2 space, we should expect to see causal shifts among phonemes that are differentiated predominantly by their location in this space, and not distinguishable by other phonetic cues like duration or voice quality. Finally, Gordon (Reference Gordon2011) has noted that any model of chain shifting relies on the notion of maximal dispersion or contrast, as described above. Chain shifts should thus show tendencies toward maintaining phonemic distinctions; mergers should not occur between shifting phonemes, and the positioning of the resulting phonemes should maintain spatial margins.
While models of chain shifting offer elegant explanations for historical sound changes, observations of ongoing shifts rarely reveal tidy step-by-step processes of implicational change. This has led to debate regarding the viability of causal chain shift models. For example, Stockwell and Minkova (Reference Stockwell and Minkova1988) disputed the description of the historical Great Vowel Shift in English as a coherent chain shift, citing the frequent merging of phonemes and variation in this shift across dialects as evidence against a margins of security explanation. Dinkin (Reference Dinkin, Nevalainen and Traugott2012) found that in areas of New York's Hudson Valley, some speakers produced more advanced elements of the Northern Cities Shift without their earlier triggering elements and argued that a shift that spreads via spatial diffusion need not maintain the structural relations between phonemes in a chain (see also Labov, Reference Labov2007).
This paper examines the progression of a series of vocalic changes in progress in California. While it is typically described as a chain shift in the front lax and low vowels (e.g., D'Onofrio, Eckert, Podesva, Pratt, & Van Hofwegen, Reference D'Onofrio, Eckert, Podesva, Pratt and Van Hofwegen2016; Hagiwara, Reference Hagiwara1997; Hall-Lew, Reference Hall-Lew2009; Kennedy & Grama, Reference Kennedy and Grama2012; Podesva, D'Onofrio, Van Hofwegen, & Kim, Reference Podesva, D'Onofrio, Van Hofwegen and Kim2015), the chronological and phonological details of this sound change remain largely unknown.
The California Vowel Shift
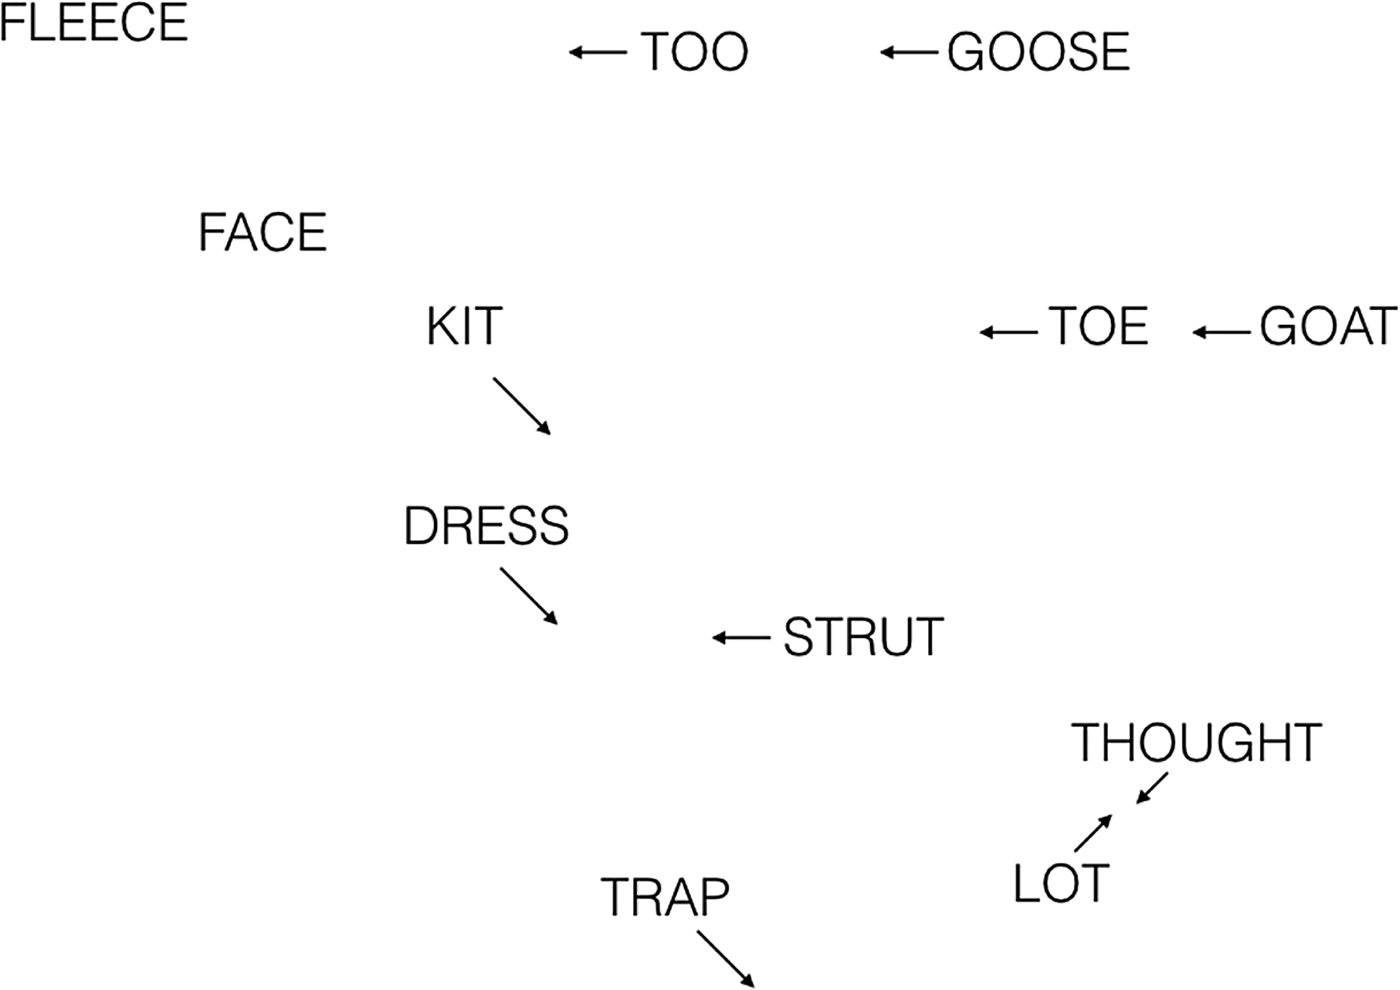
Over the last few decades, researchers have identified a vocalic change in progress in Californian speakers, often deemed the California Vowel Shift (CVS). The CVS is characterized by three major components (Figure 1): (1) merged or merging lot and thought vowels in the low-back corner of the vowel space; (2) the lowering and retraction of lax front vowels kit, dress, and trap; and (3) the fronting of high- and mid-back vowels goose, goat, and strut (D'Onofrio et al., Reference D'Onofrio, Eckert, Podesva, Pratt and Van Hofwegen2016; Hagiwara, Reference Hagiwara1997; Hall-Lew, Reference Hall-Lew2009; Hinton, Moonwomon, Bremner, Luthin, Van Clay, Lerner, & Corcoran, Reference Hinton, Moonwomon, Bremner, Luthin, Van Clay, Lerner and Corcoran1987; Kennedy & Grama, Reference Kennedy and Grama2012; Labov, Ash, & Boberg, Reference Labov, Ash and Boberg2006; Podesva, D'Onofrio, Van Hofwegen, & Kim, Reference Podesva, D'Onofrio, Van Hofwegen and Kim2015).
California Vowel Shift.
The low-back merger and lowering/backing of the front lax vowels have been similarly observed in the Canadian Vowel Shift, which has been framed by some researchers as a chain initiated by the merger of lot and thought to a relatively raised position, pulling trap, dress, and kit into lower and retracted positions in succession (Clarke, Elms, & Youssef, Reference Clarke, Elms and Youssef1995; Labov et al., Reference Labov, Ash and Boberg2006). Others have posited that the Canadian shift is in fact a series of analogous movements (Boberg, Reference Boberg2005; Roeder & Jarmasz, Reference Roeder and Jarmasz2010) that, although not constituting a temporal chain, are driven by pressures of maximal dispersion (Roeder & Gardner, Reference Roeder and Gardner2013).
Perhaps due to the parallels in movement between the California and Canadian vowel shifts, the sound change observed in California has been characterized as a chain shift along the same lines. Many researchers have framed the shift as a pull-chain (or drag-chain), in which a chain shift is initiated by the vacating of a vowel from an area of the vowel space, likely because of the relatively early observation of the lot-thought merger in California (Gordon, Reference Gordon, Kortmann and Schneider2005; Hagiwara, Reference Hagiwara1997). By contrast, Kennedy and Grama (Reference Kennedy and Grama2012) suggested that the change may, in fact, constitute a push chain, in which a chain shift is set off by the movement of one vowel into the territory of another in the vowel space. In their data from Californian speakers, the merged lot-thought vowel remained relatively low compared to those of Canadian speakers. Because this leaves less space into which trap could retract, they suggested a push chain initiated by kit. In addition to this ambiguity, it is unclear whether and how the movement of the back vowels toward the front of the vowel space might be chronologically or phonologically related to the other components of the CVS. Moreover, it is unclear whether vowels outside of the aforementioned components of the CVS, for example, tense vowels fleece and face, remain stable within Californians’ vowel spaces, as assumed.
Though the evidence is solely suggestive, we have some indication that the California Vowel Shift could be related to a general change in articulatory setting, leading to an overall front-back compression of the vowel space. In an analysis of parodic portrayals of Californian speakers, Pratt and D'Onofrio (Reference Pratt and D'Onofrio2017) found that actors deployed open or protruded jaw settings as part of their exaggerated performances. These, in turn, led to changes in the articulatory space in which the actors produced vowels, such that playing a Californian character involved an articulatory compression of the F2 range that coincided with some aspects of the CVS (e.g., backed front lax vowels, fronted back vowels). While not a proxy for actual Californians’ speech patterns, these parodies may provide an indication of an articulatory means of achieving California-shifted vowels.
This paper provides a detailed examination of the CVS in California's Central Valley, aiming to uncover the chronological progression of the shift and thereby illuminating the mechanisms responsible for the change. To examine the CVS's progression, we present a general apparent time analysis treating speaker age as linear, as well as a more in-depth generational analysis of four age groups, to examine how these changes progressed in stages. We search for evidence for or against the notion that the shift occurred in a vowel-by-vowel ordering as predicted by a chain-shift model. These analyses demonstrate that, in the Central Valley, components of the CVS are shifting concurrently and rapidly—most within the span of one generation—rather than in a gradual phoneme-by-phoneme fashion across time as posited by a chain shift. Following a more holistic view of the vowel space changes suggested by ideological performances of California-ness (Pratt & D'Onofrio, Reference Pratt and D'Onofrio2017), we conduct an analysis of how the entire vowel space has changed in size and spread over time, finding that a reanalysis of these changes via measurements of both area and dispersion of the vowel space more clearly reveals the nature of the vocalic change in apparent time.
METHODS
Speakers
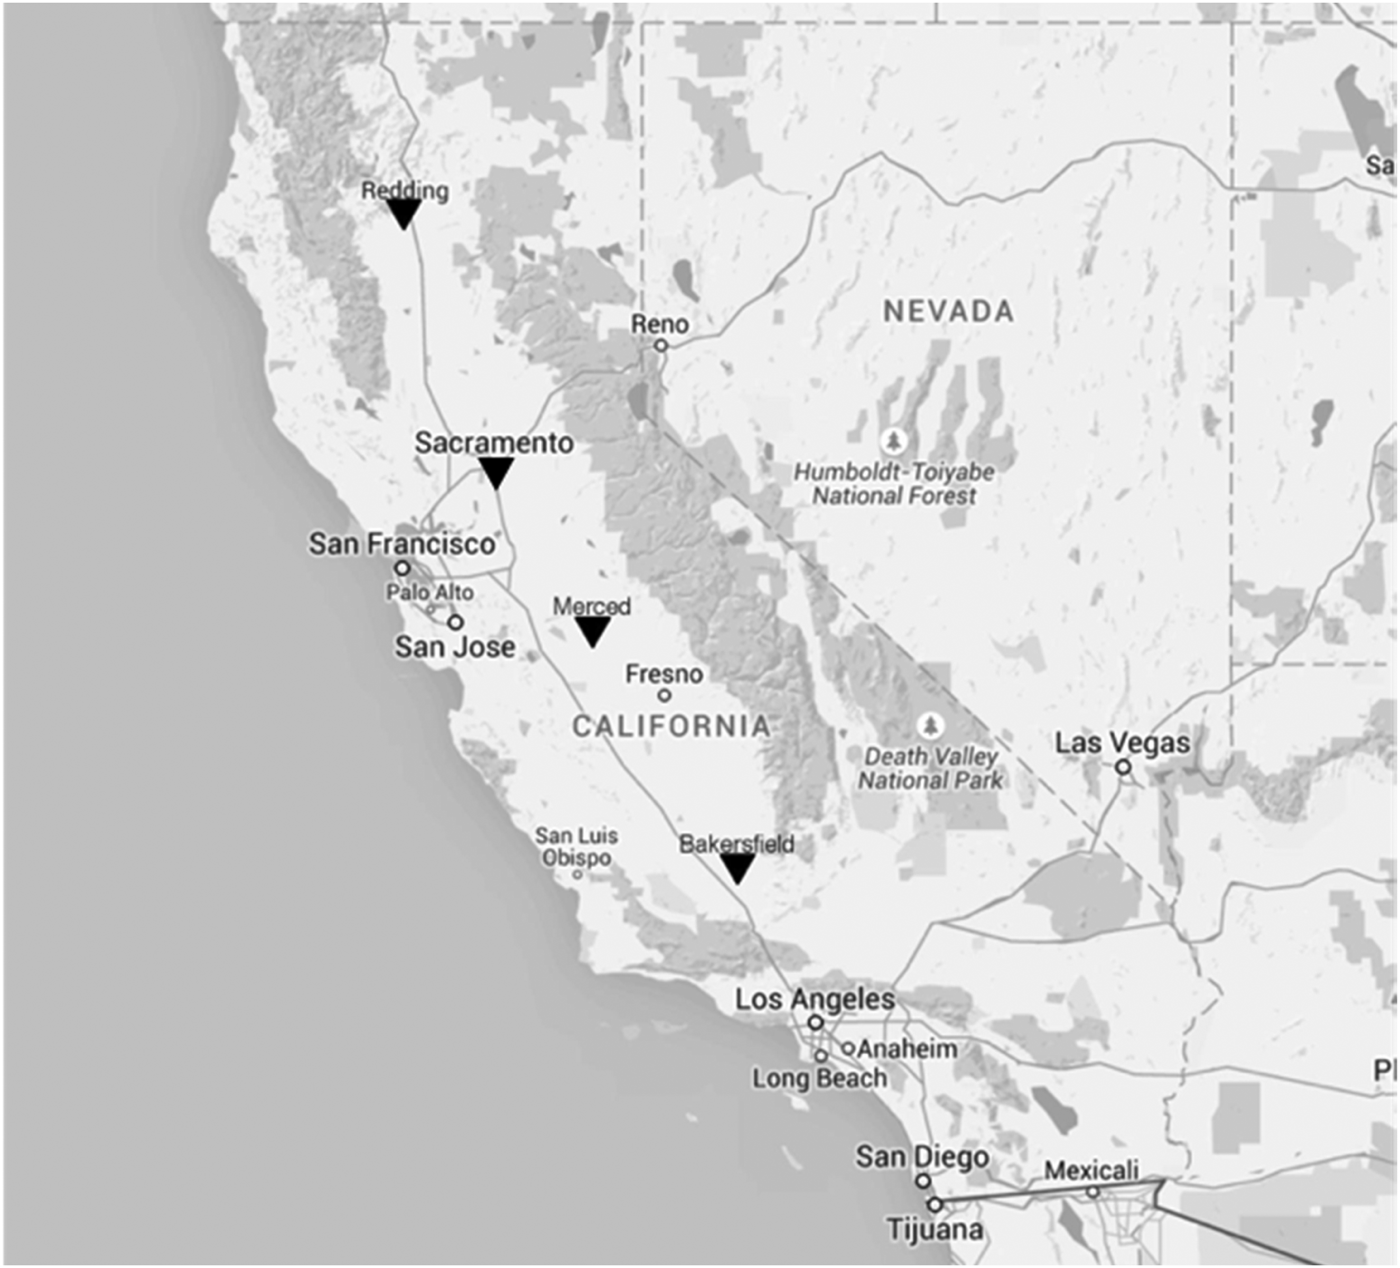
This study draws upon interviews conducted between 2010 and 2014 through Stanford University's Voices of California project. Speakers grew up and currently reside in one of four field sites: Redding, Sacramento, Merced, or Bakersfield (Figure 2). This builds on prior work establishing that the CVS is advancing in California's Central Valley, which makes up a large portion of California geographically (D'Onofrio et al., Reference D'Onofrio, Eckert, Podesva, Pratt and Van Hofwegen2016; Geenberg, Reference Geenberg2014; Podesva et al., Reference Podesva, D'Onofrio, Van Hofwegen and Kim2015).
Map of field sites.
Eighteen speakers per site were selected for analysis, totaling 72 speakers. All were native speakers of English and evenly spanned ages 18–83 at the time of interview (approximate ages were matched across sites). In an open-ended question asking each speaker to report their gender, half of the speakers from each site self-identified as men or male and half as women or female. All speakers in the sample analyzed here were white (on the vowel spaces of other racialized groups in these areas see, e.g., King [Reference King2015]; King & Calder [Reference King and Calder2016]).
We use an apparent time analysis to examine the overall changes that have occurred in these sites, first modeling speaker age as continuous predictor. For the second portion of our analysis, we examine the unfolding of the CVS at a more incremental level, observing how the shift progressed in stages over time, which can more clearly illustrate whether an ordered relation existed between elements of the shift (for example, indicating a pull chain initiated by movement of trap versus a push chain initiated by movement of kit). Speakers were binned into one of four generation groups, using labels and birth year ranges from Pew Research Center (2015) shown in Table 1.
Generation birth year ranges

Speech data and vocalic tokens
We derive all vocalic measurements from conversational speech in sociolinguistic interviews. A variety of interviewers on the Voices of California team, including the authors, completed these interviews. Speakers were digitally recorded at a 44.1 kHz sampling frequency with a bit rate of 16, using Zoom H2, Zoom H2n, Sony PCM-M10, or Marantz PMD660 recorders with Audio Technica AT831b or ATPro70 lavalier microphones. All interviews were transcribed and phonemically aligned using FAVE align (Rosenfelder, Freuhwald, Evanini, & Yuan, Reference Rosenfelder, Fruehwald, Evanini and Yuan2011).
Tokens from twelve vowel classes (lot, thought, kit, dress, trap, strut, too, goose, toe, goat, fleece, and face) were extracted via script in Praat (Boersma & Weenink, Reference Boersma and Weenink2012) (total n = 16,481). All of these classes are documented to be undergoing change in apparent time in California except for the front tense vowels fleece and face. As trap has been found to show different patterning depending on whether or not it precedes a nasal segment (e.g., Eckert, Reference Eckert2008), we used only tokens of trap that preceded nonnasal segments. Further, we split goose and goat into subclasses according to preceding phonological segment. Postcoronal goose and goat (which we call too and toe, respectively), have been found to show more advanced fronting than in other environments (e.g., Hall-Lew, Reference Hall-Lew2009; Podesva et al., Reference Podesva, D'Onofrio, Van Hofwegen and Kim2015). Note that we have chosen to restrict our focus to tokens that do not precede liquids (for GOOSE, GOAT, TOO, and TOE tokens) or nasals (for TRAP tokens), which are shown to behave differently than other phonological environments in various vowel classes of the CVS (e.g., Cardoso, Hall-Lew, Kementchedjhieva, & Purse, Reference Cardoso, Hall-Lew, Kementchedjhieva and Purse2016).
Up to 25 tokens were hand-selected for each speaker for each of the twelve vowel classes, and vowel boundaries for each token were hand-corrected. Only vowels from stressed syllables with a duration of at least 75 milliseconds were considered. Vowels preceding and following liquids, glides, and other vowels were excluded. No more than two tokens per word lemma were selected per vowel class, and no vowels were taken from function words.
Praat scripts measured formant values for F1–F5 at the token's midpoint as well as vowel duration. All measurements were then converted to a Bark scale and normalized using the Nearey single log-mean normalization method (Adank, Smits, & van Hout, Reference Adank, Smits and van Hout2004; Nearey, Reference Nearey1977), through the vowels package (Kendall & Thomas, Reference Kendall and Thomas2012) in R (R Core Team, 2016). We use Nearey normalization here because it maintains interspeaker differences in the ratio of vowel space width to height (Adank, Smits, & van Hout, Reference Adank, Smits and van Hout2004).
Individual vowel analyses
Normalized F1 and F2 measurements were submitted to separate linear mixed-effects regression models for each vowel class (2 formant measures x 12 vowel classes = 24 models in all). The fixed effect of age was included in each model, as were the following fixed effects that served as controls: log-transformed duration, preceding place (labial, coronal, dorsal, glottal), preceding manner (obstruent, nasal), following place, following manner, participant gender, and field site. Speaker and lexical item were included as random intercepts. Each of these models was tested, using age as a linear predictor, to assess overall change in apparent time, and age as a categorical generational factor, to assess incremental change between generations.Footnote 1
Additionally, the Pillai-Bartlett trace (Pillai score) was calculated by speaker to assess the degree of overlap of lot and thought categories as a measure of merger (Hay, Warren, & Drager, Reference Hay, Warren and Drager2006; Nycz & Hall-Lew, Reference Nycz and Hall-Lew2013). Following Hall-Lew (Reference Hall-Lew2010), we calculated this score as an output from multivariate analysis of variance (MANOVA) models fitted on the lot and thought F1 and F2 measurements, by vowel class, for each speaker. These models assess the degree to which vowel class (lot versus thought) predicts differences in the distributions of both formant measures simultaneously for a given speaker. These by-speaker scores were submitted to a linear regression model, with fixed effects of age (linear or categorical generation group), gender, and field site.
Holistic vowel space analyses
In addition to measuring how each component of the CVS unfolded over apparent time, we analyzed the ways in which the size and spread of the entire vowel space may have shifted in apparent time. Though studies have shown a relation between vowel space and social factors, including gender and sexuality (Heffernan, Reference Heffernan2010; Pierrehumbert, Bent, Munson, Bradlow, & Bailey, Reference Pierrehumbert, Bent, Munson, Bradlow and Bailey2004), place-related identity (Habick, Reference Habick and Frazer1993; Labov, Reference Labov1963), and dialect (Fox & Jacewicz, Reference Fox and Jacewicz2017; Jacewicz, Fox, & Salmons, Reference Jacewicz, Fox, Salmons, Trouvain and Barry2007), holistic vowel space measures have primarily been used to assess the impact of particular speech styles (i.e., intraspeaker variation) on vowel centralization or vowel space expansion. For example, vowel spaces of speakers in a more casual register are typically more compact, whereas vowel spaces in more careful registers are more peripheral (Bond & Moore, Reference Bond and Moore1994; Lindblom, Reference Lindblom1990; Picheny, Durlach, & Braida, Reference Picheny, Durlach and Braida1986). Following Bradlow, Torretta, and Pisoni (Reference Bradlow, Torretta and Pisoni1996), we use two holistic measures of the vowel space to examine the relation between expansion of the vowel space and intelligibility of the speech: Euclidean vowel space area and vowel space dispersion.
Vowel Space Area
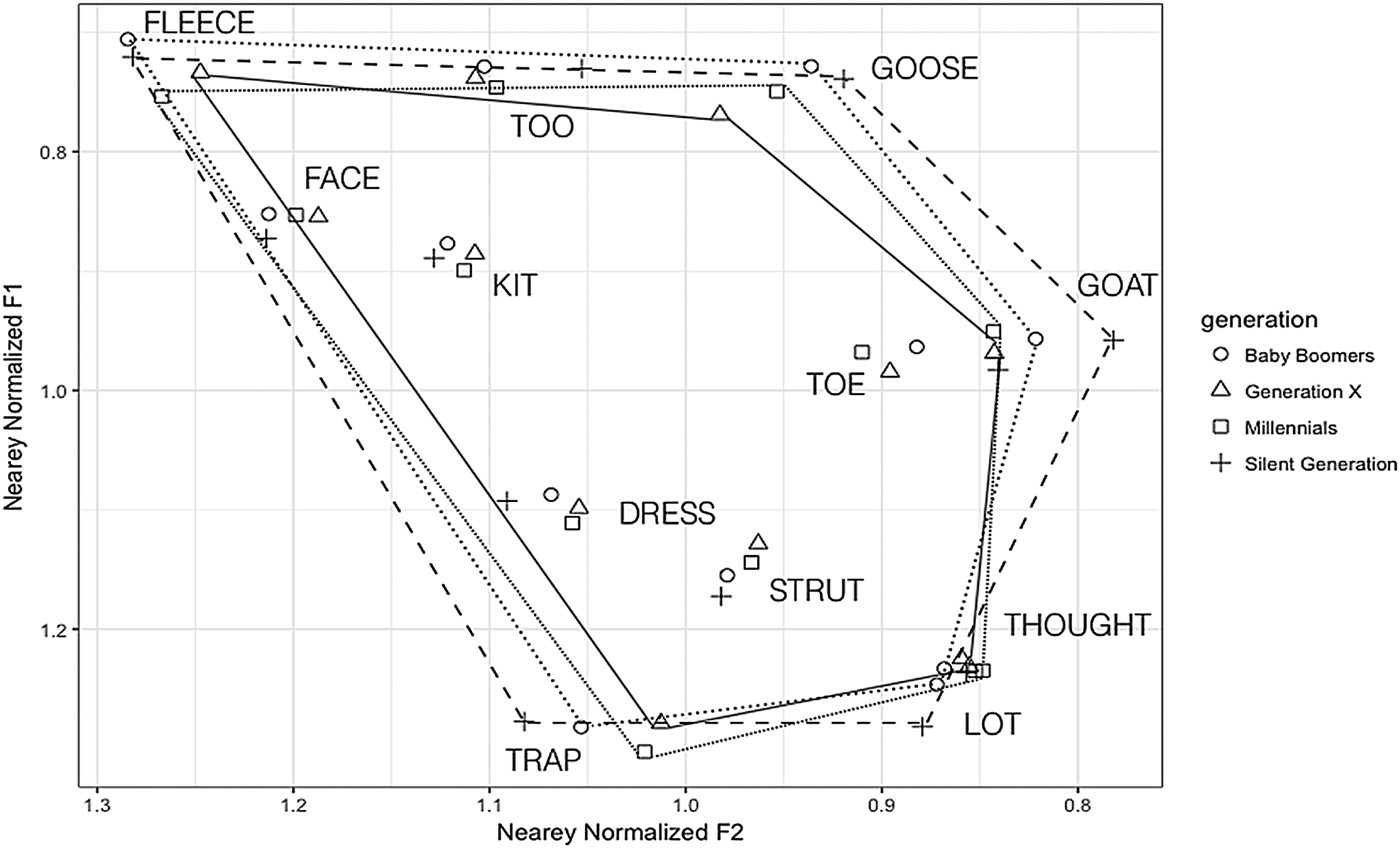
The Vowel Space Area (VSA) measure assesses the Euclidean area of the polygon formed by the outer points of a speaker's vowel space in F1/F2 space (Bradlow, Torretta, & Pisoni, Reference Bradlow, Torretta and Pisoni1996; Jacewicz, Fox, & Salmons, Reference Jacewicz, Fox, Salmons, Trouvain and Barry2007). We follow Jacewicz, Fox, & Salmons (Reference Jacewicz, Fox, Salmons, Trouvain and Barry2007) and use five outer points to calculate, vowel space area in normalized F1/F2 space: fleece, trap, lot, goat, and goose (as seen in Figure 5). For each speaker, mean midpoint measurements were calculated for Nearey-normalized tokens of each of the five anchors. Then, Euclidean area of the polygon created by those five points was calculated using Heron's method, in which the areas of three component triangles are summed (fleece-goose-goat [or T1] + fleece-trap-goat [or T2] + trap-goat-lot [or T3]).
Jacewicz, Fox, and Salmons (Reference Jacewicz, Fox, Salmons, Trouvain and Barry2007) found large gender differences in vowel space area calculated with raw Hertz (such that women's mean vowel spaces were approximately twice the size of men's vowel spaces), but VSA calculated with Lobanov-normalized measurements exhibited no vowel space differences by gender. They did not explicitly test whether vocal tract size differences, as opposed to more agentive stylistic work related to gendered identity performances, drove this difference in VSA using nonnormalized values. Regardless, in order to focus on vowel space area shifts in apparent time over and above speaker-specific physiological differences, we opt to use Nearey-normalized values in both of our holistic vowel space measures.
We submitted the by-speaker vowel space area measurements to a linear regression model, with fixed effects of age (linear or generation group), gender, field site, and speaker's log-transformed overall mean vowel duration, to control for any between-speaker differences in speech rate or in vowel duration that may have affected measures of area or dispersion (Bradlow, Torretta, & Pisoni, Reference Bradlow, Torretta and Pisoni1996). Significant differences between generation groups would indicate that, between generations, the area of the vowel space either increased or decreased over apparent time.
Vowel Space Dispersion
Vowel space dispersion serves as a holistic measure of the spread of the vowel space, incorporating all twelve vowel classes of interest. Drawing from Bradlow, Torretta, and Pisoni (Reference Bradlow, Torretta and Pisoni1996), for each speaker we calculated the Euclidean distances of each of the twelve vowel class midpoint means from the centroid of that speaker's vowel space (see Figure 6). The mean of these twelve Euclidean distance measures was then taken for each speaker, providing a single measure of holistic vocalic dispersion by speaker. Again, the by-speaker dispersion measurements were submitted to linear models with the same fixed effects as described for vowel space area.
RESULTS
Individual vowel analyses
Models testing F1 and F2 of individual vowels and treating age as continuous show that the majority of vowel classes exhibit change over time (summarized in Table 2).
Summary of Results: Regression table showing main effect of age for predicting Nearey-normalized F1 and F2 of vowels (* = p < 0.025; ** = p < 0.01; *** = p < 0.001)
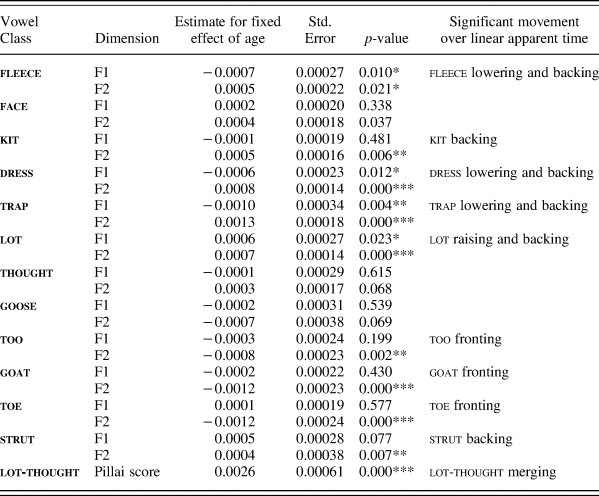
The regression models for front tense fleece show that fleece F1 is negatively correlated with speaker age, and F2 is positively correlated with speaker age. This indicates that fleece is lowering and backing over apparent time. No significant movement was observed for face (Table 2).
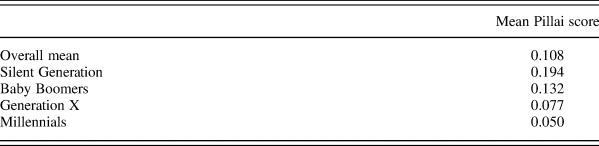
Analyses of front lax vowels dress and trap indicate the lowering and backing of both vowel classes in apparent time; F1 values decrease as speaker age increases, and F2 values increase as speaker age increases. Additionally, we find a positive correlation between age and kit F2, such that kit is backing in apparent time. kit does not show evidence of movement in the F1 dimension. For lot, F1 and F2 values increase as speaker age increases, indicating that lot is raising and backing in apparent time. We observe no significant changes for thought in either dimension. The analysis of the low back merger of lot and thought using Pillai score shows a main effect of age, such that younger speakers show more overlap in normalized values for lot and thought than their older counterparts, or greater degree of merger.
F2 values of goat, too, and toe decrease as speaker age increases. This indicates that goat, too, and toe are all fronting in apparent time; goose does not show significant movement. Finally, strut shows F2 values that increase as speaker age increases, indicating that strut is backing in apparent time.
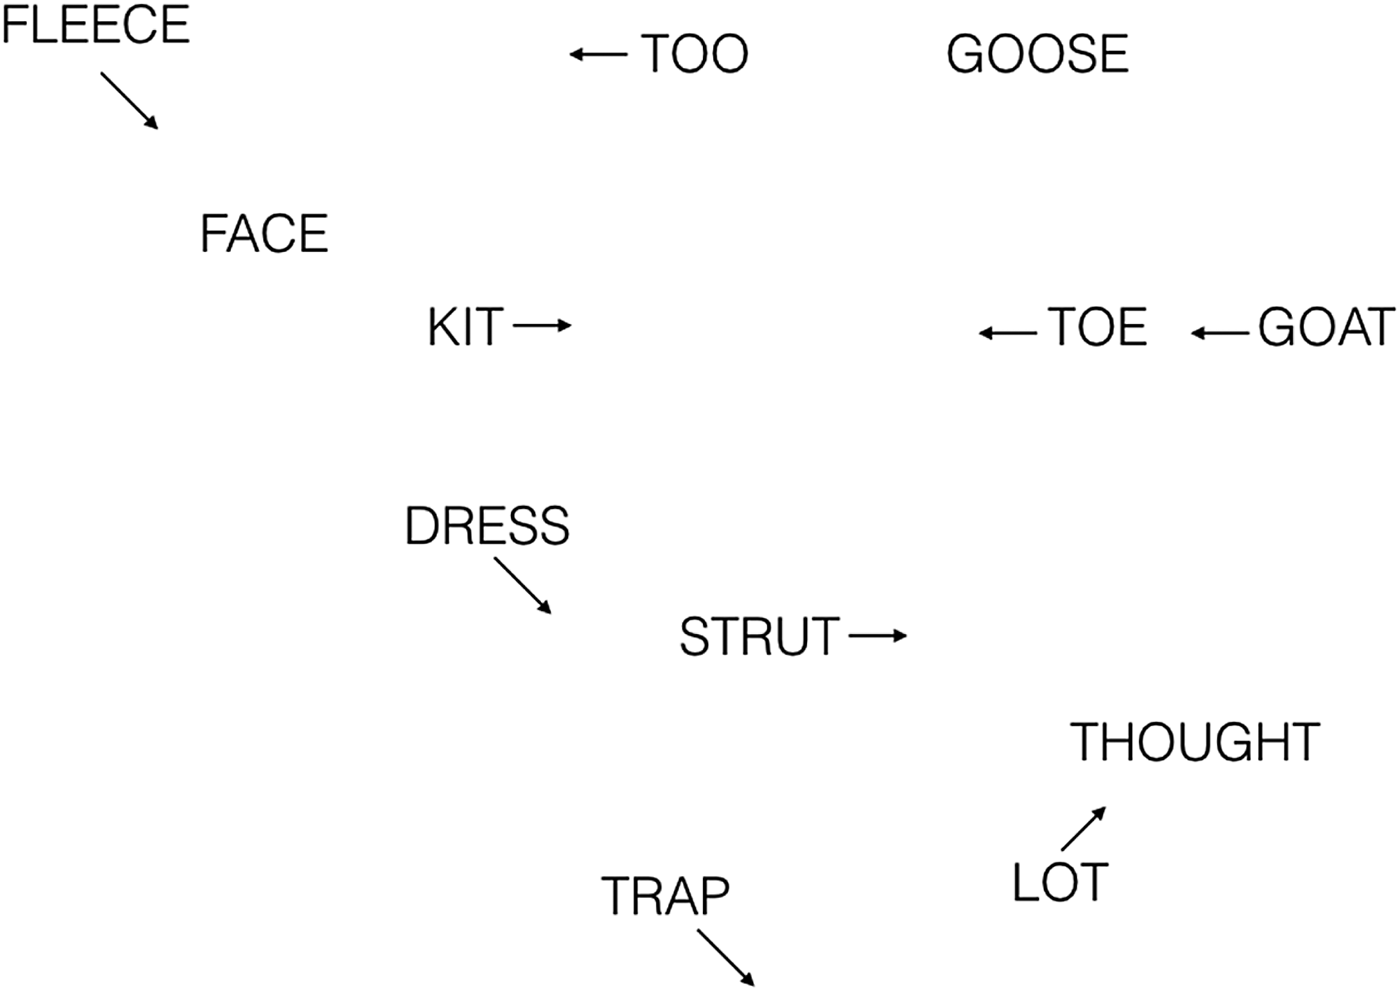
Results indicate that many of the previously observed components of the CVS are progressing in the Central Valley. The lowering and backing of dress and trap, the backing of kit, the raising of lot, and the merging of lot and thought are consistent with previous findings, as is the fronting of high back goat and post-coronal too and toe. There are two exceptions to the CVS as it has been theorized, namely, that goose is not significantly shifting in apparent time, and strut is backing, rather than fronting. Notably, we see movement in high tense fleece, which is backing and lowering over time with no significant movement for face. Based on these results, we present an updated schema of our CVS sound change patterns in Figure 3.
Updated schematic of the California Vowel Shift, as progressing in the Central Valley.
Incremental analysis by generation
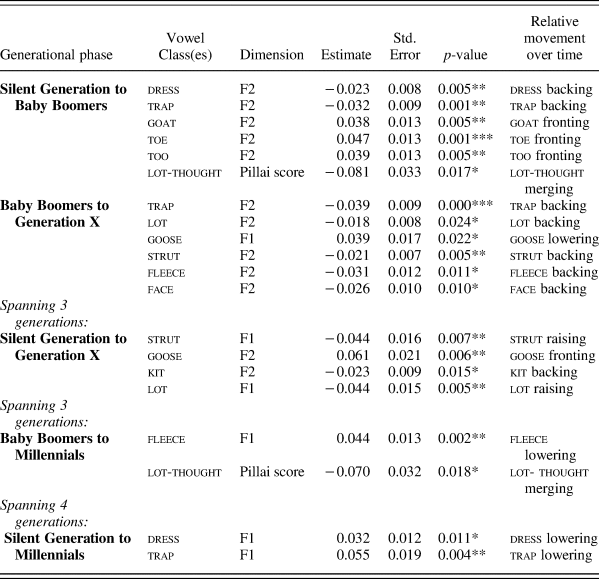
To assess the step-by-step progression of the California Vowel Shift, we conducted an incremental generation-based vocalic analysis. Models tested generation group (Silent Generation, Baby Boomer, Generation X, and Millennials) as a categorical variable in order to assess evidence of chronological ordering of the shift. Results indicate that these changes in apparent time unfolded in phases that are not neatly implicational in terms of phonological expectations of a chain shift. In fact, many of the changes happened contemporaneously within the span of two subsequent generational categories. Here we present results for each generational phase, providing the model coefficients that showed significant differences between two adjacent generation groups, always treating the older generation group as the default. That is, we report on components of the shift that show significant movement between subsequent generations (Table 3).
Summary of Results: Regression table showing main effect of generation group for predicting Nearey-normalized F1 and F2 of vowels
Silent Generation to Baby Boomers
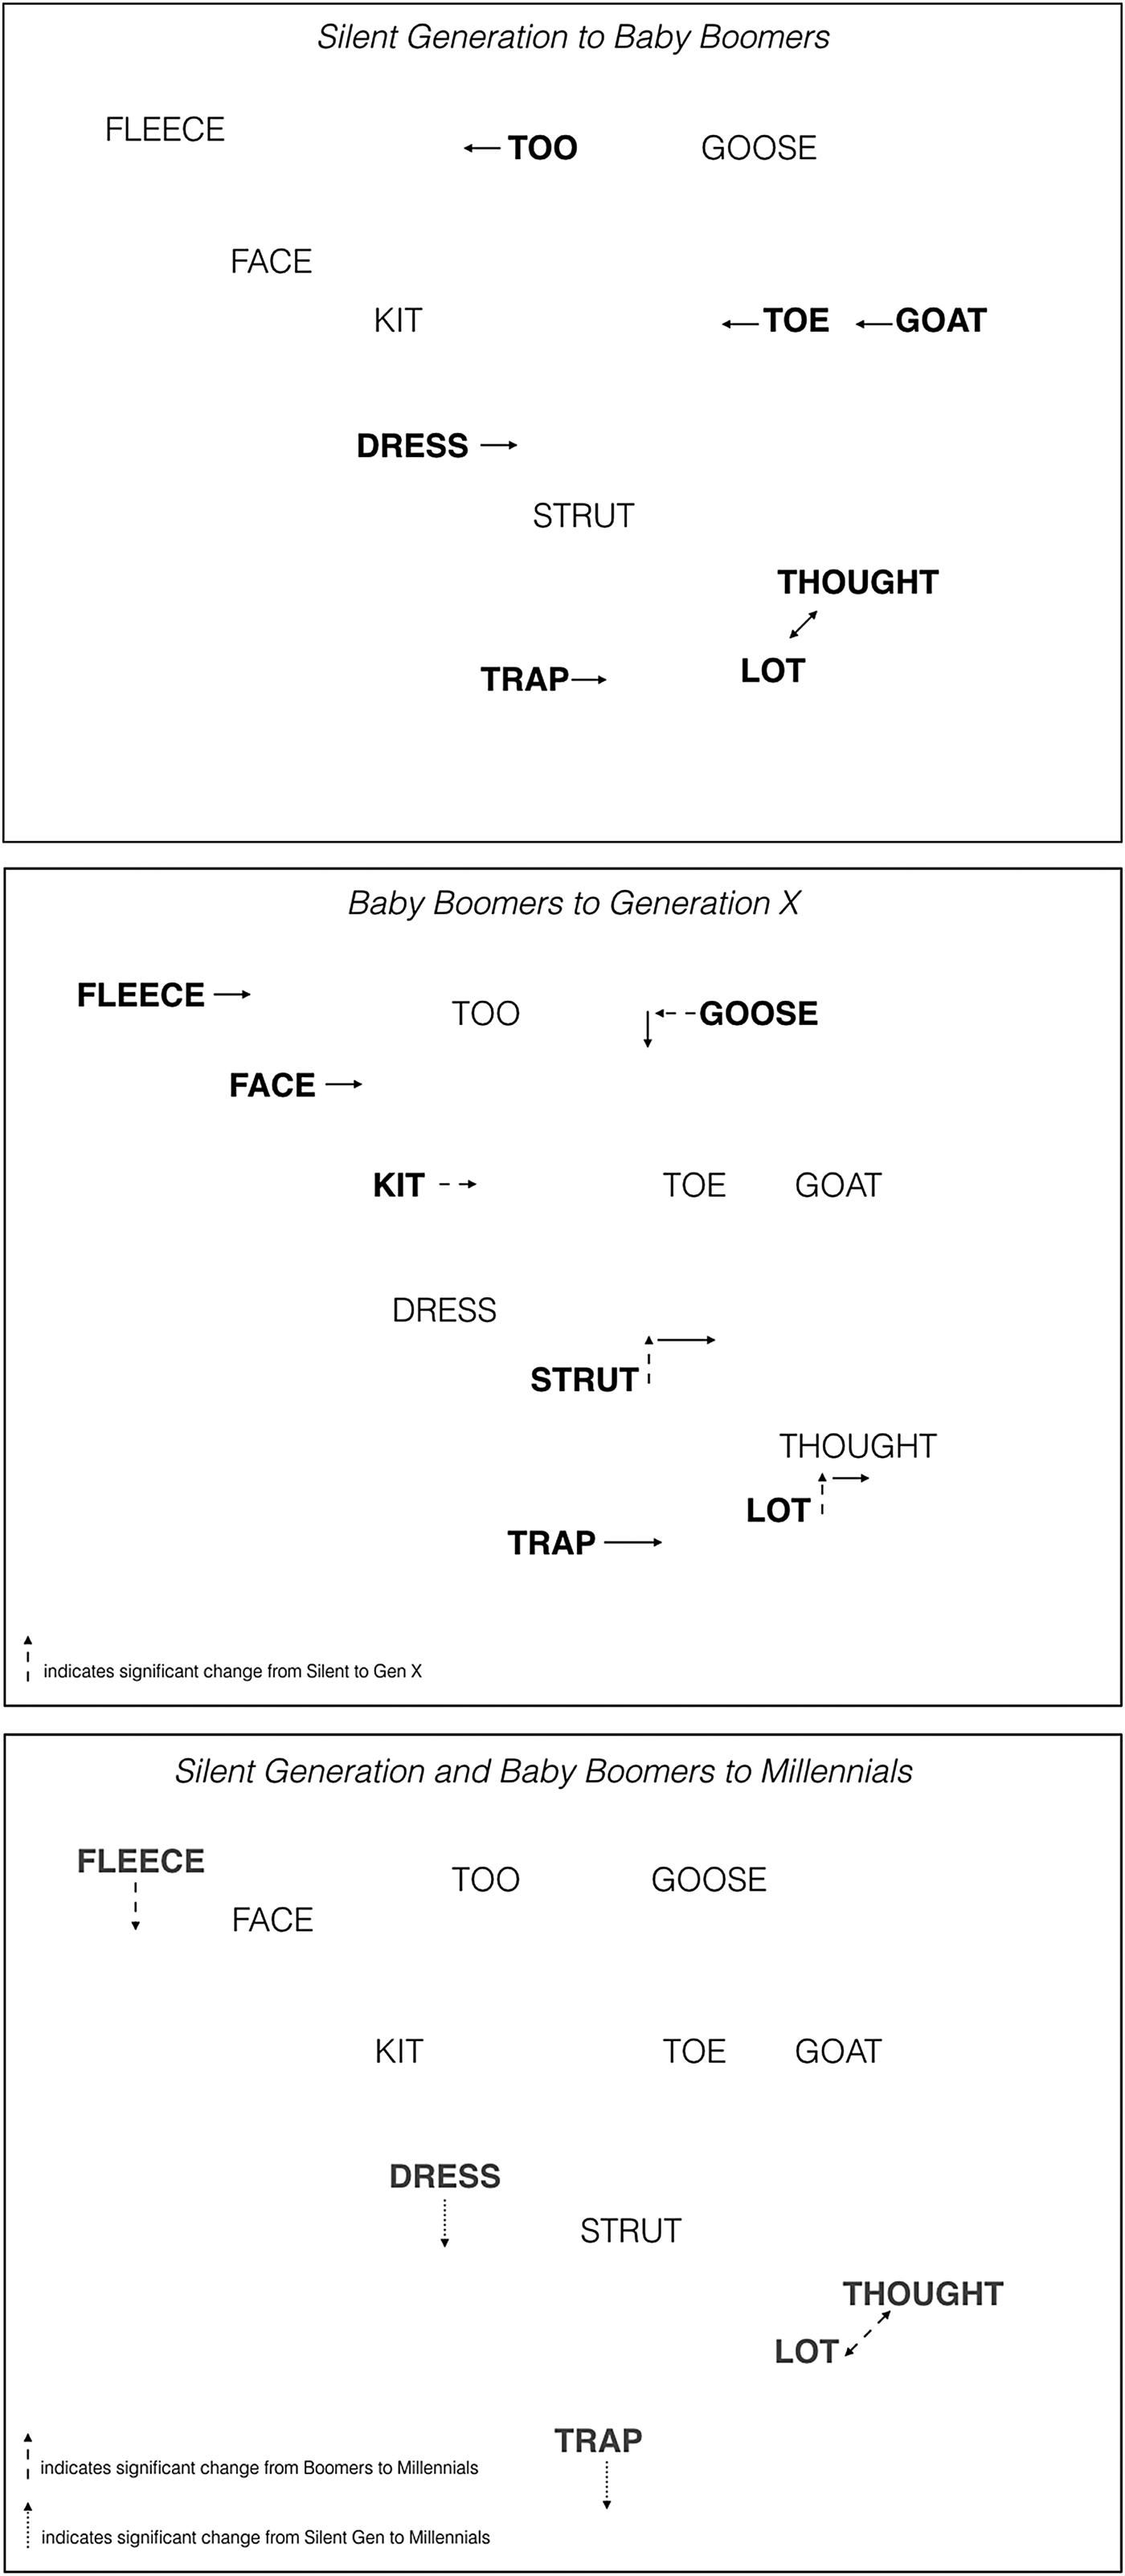
Regression models show generation to be a significant predictor of Pillai score of lot and thought between Silent generation and Baby Boomer speakers, such that Pillai score decreases between these two generations, indicating greater degree of overlap (merger) in Baby Boomers. Similarly, Baby Boomers show smaller F2 values for dress and trap than their Silent generation counterparts, providing evidence that the front lax vowels are backing. F2 values for postcoronal toe and too as well as goat are greater for Baby Boomers than Silent Generation speakers, suggesting that the fronting of the back vowels was underway between these two generational groups. Between Silent and Baby Boomer generations overall, we observe simultaneous backing of the front lax vowels, fronting of high back vowels and merging of lot and thought (Figure 4, top).
Stages of change between generations, from Silent Generation to Baby Boomers (top), Baby Boomers to Generation X (middle), and Silent Generation/Baby Boomers to Millennials (bottom). Bold and solid arrows indicate significant change between generations. Dashed arrows indicate gradual change significantly different across three successive generations.
Baby Boomers to Generation X
Between the Baby Boomer and Generation X groups, regression analyses reveal generation to be a significant predictor of normalized F2 values for five vowel classes: trap, lot, strut, fleece, and face. Generation X speakers show backer productions of all five of these vowels than their Baby Boomer counterparts. Additionally, Generation X speakers show lower goose vowels. This stage of the shift is shown in Figure 4, middle. No significant differences emerged between Generation X and Millennials.
Spanning multiple generations
Additionally, several elements of the shift reach significant change only over the course of three successive generations, such that generation is only a significant predictor of normalized formant values between Silent Generation and Generation X speakers (with the intervening Baby Boomer generation not significantly different from either), or between Baby Boomer and Millennials speakers (with Generation X not different from either). Significant predictors in these cases indicate more gradual change (dashed arrows in Figure 4). There were also changes that occurred gradually across all four generations, such that the only differences that reached significance were between the Silent Generation and Millennials (dotted lines in Figure 4, bottom).
Generation X speakers show significantly smaller F1 values for lot and strut than those in the Silent Generation with Baby Boomers not significantly different from either. Furthermore, Generation X speakers show significantly greater F2 values for goose than their Silent Generation counterparts, and significantly smaller F2 values for kit. These results indicate a more gradual change toward higher lot and strut vowels, fronter goose vowels, and backer kit vowels occurring between the Silent Generation and Generation X.
Models reveal that Millennials show significantly greater F1 values for fleece, and a smaller lot- thought Pillai score than Baby Boomers, with Generation X speakers not showing significant differences from either in these measures. This indicates a gradual lowering of fleece and increase in overlapping lot and thought across this multiple-generation span.
Finally, changes in dress and trap F1 showed even more gradual progressions, only showing significant differences between Silent Generation speakers and Millennial speakers. Millennials were significantly more likely to have lower dress and trap vowels than their Silent Generation counterparts.
Summary and discussion of individual vowel results
Generational analysis reveals that components of the shift in nearly all areas of the vowel space move within the span of the same generation, between Silent Generation speakers and Baby Boomers: dress and trap backing, goat, toe, and too fronting, and lot-thought overlap, with only trap backing and lot-thought overlap continuing in later generations. Additional changes occur in subsequent generations as well: between Baby Boomers and Generation X speakers, we see goose fronting, lot and strut backing, the continued backing of trap, and fleece and face backing. In more gradual changes, spanning Silent Generation speakers and Generation X, we observe lot and strut raising, kit backing, and goose fronting. Millennials show significantly lower fleece vowels and more overlapping lot and thought vowels than Baby Boomers, and significantly lower dress and trap vowels than Silent Generation speakers.
Taken together, we do not see evidence of a step-by-step chain, insofar as we might have expected the low back merger to predate the movement of trap, and trap to predate movement of dress, for example. Instead, we see a simultaneous merging of lot-thought and backing of trap and dress, along with frontward movement of the back vowels, within one generation span. This suggests that, at least by this time period, the change constituted? a more holistic reconfiguration of the vowel space rather than a stepwise incremental development of a vowel shift as it is most often theorized. The parallel movement of the front, lax vowels backward, and likewise the fronting of mid- and high-back vowels frontward, could be described independently as processes of phonological analogy, by which vowel classes with similar features mirror movement in one another (e.g., Winter & Wedel, Reference Winter and Wedel2016). However, the simultaneity of these movements toward centralization is unexpected, and is especially striking within the span of one generation.
We also observe that the majority of early contemporaneous shifts involve F2 movement characterized by a horizontal compression of the vowel space. That is, the backing of dress, trap, and kit, and the fronting of goat, toe, and too all involve inward movement, or centralization, within the vowel space. This contradicts assumptions of a phonological chain that operates to maintain maximal dispersion, with a wider trapezoidal vowel space appearing to give way to a substantially narrower system in the Central Valley. Further, with the exception of kit-backing, all of these occur within the generational shift from Silent Generation to Baby Boomer speakers. Even more striking examples of this movement can be found in the backing of tense vowels fleece and face over time, not traditionally theorized as part of the CVS. Though it is not immediately clear how the lot-thought merger or strut-backing relate directly to the narrowing of the vowel space, it is possible that the process of compression leaves less room for phonemes in general, perhaps hastening the merger of lot and thought. Overall, this rapid and holistic movement suggests that a change may be happening at the level of the vowel space rather than by movement of individual vowels. For these reasons, we engaged in an analysis of the vowel space as a whole to test the possibility that the overall vowel space had decreased in size and dispersion in apparent time. Results of both these analyses are consistent with the indicators of the individual vowel analyses, namely that younger speakers have smaller vowel space areas and less dispersed vowel spaces than their older counterparts.
Holistic vowel space analyses
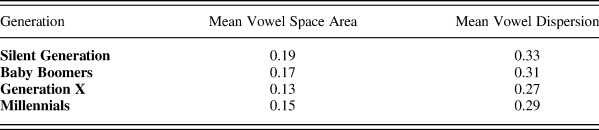
First, we assess the degree to which linear age or generation group predicts by-speaker vowel space area using the five-sided polygon described in the methods section. Mean vowel space areas and dispersion measures by generation group are reported in Table 4 in Nearey-normalized values.
Mean vowel space area and dispersion measures, by generation (in Nearey-normalized values)
Two linear regression models were fit on by-speaker area measures with fixed effects of age (one model treating age as linear, one treating age as a generational factor), field site, speaker gender, and speaker's log-transformed overall mean vowel duration.
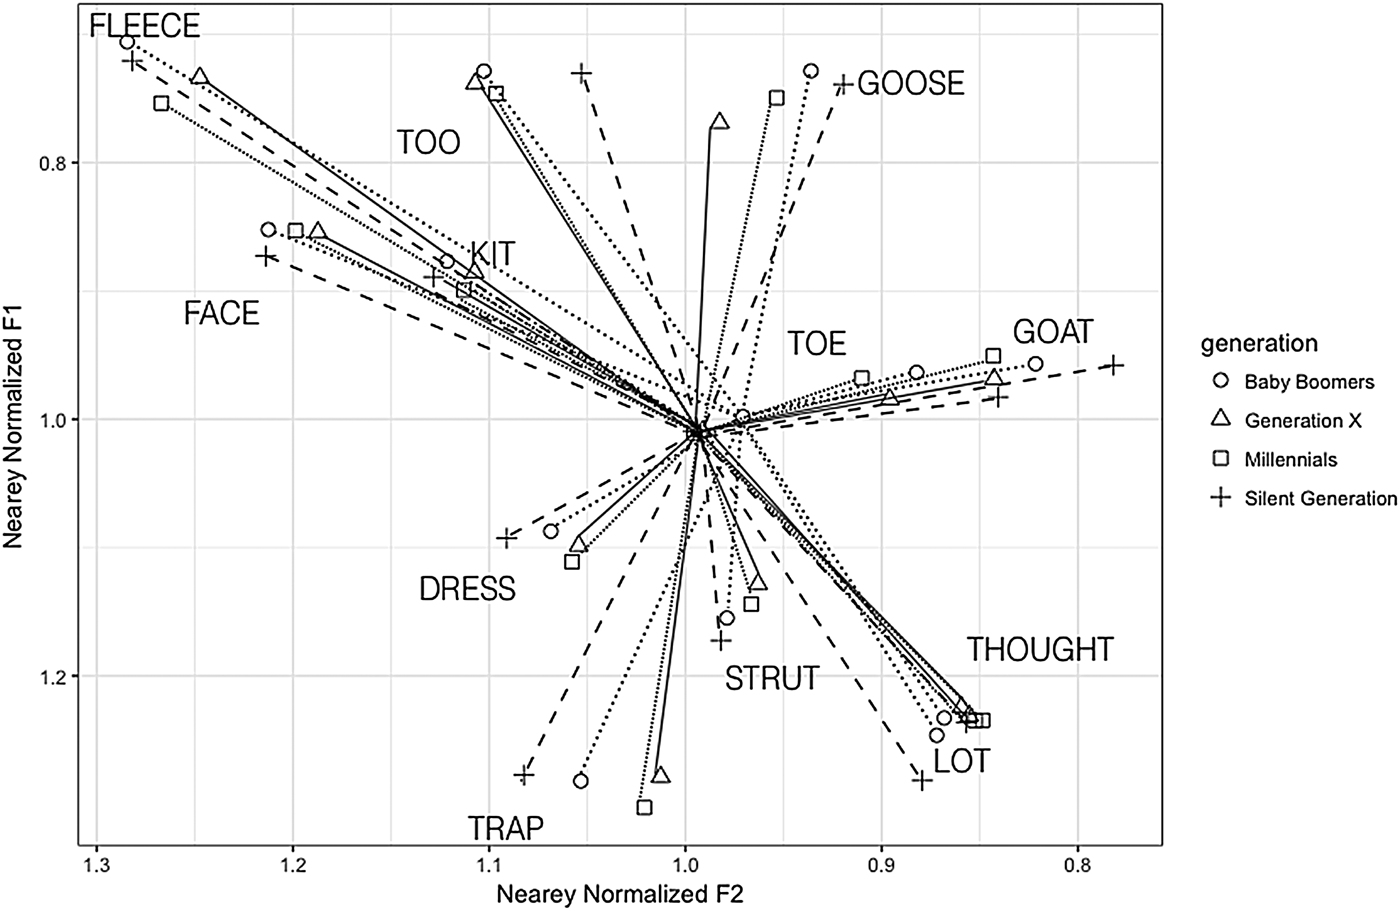
Linear age is a significant predictor of vowel space area, such that younger speakers have smaller vowel space areas than older speakers. A second model reveals generation to be a significant predictor of vowel space area (visualized in Figure 5). While Baby Boomer speakers had slightly smaller areas than Silent Generation speakers, this difference was not significant. However, Generation X and Millennial speakers showed smaller vowel space areas than Baby Boomer speakers. Generation X speakers showed the smallest vowel space areas, with an increase in the Millennial generation, though the difference between the two was not significant.
Vowel Space Area by Generation.
As a second measure of the vowel space as a whole, we again follow Bradlow, Torretta, and Pisoni (Reference Bradlow, Torretta and Pisoni1996) and analyze mean dispersion of the entire vowel space by speaker, again fitting separate models for linear and generational age. Linear age is a significant predictor of dispersion, such that dispersion decreases as speaker age decreases (Table 5). Likewise, generation is a significant predictor of dispersion, displayed in Figure 6, such that Silent Generation and Baby Boomer speakers are more dispersed than Generation X speakers. The difference between Generation X and Millennials was not significant.
Regression table showing age effects for predicting vowel space area and dispersion as measured on Nearey-normalized vowel spaces, by speaker. (* = p < 0.025; ** = p < 0.01; *** = p < 0.001)
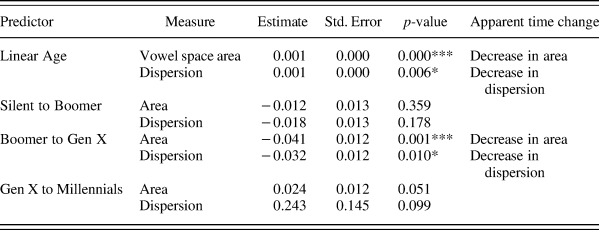
Vowel Space Dispersion by Generation.
Summary of holistic vowel space results
These findings indicate that, across the span of four generations, the progression of the CVS can be characterized as a compression of the vowel space over time. This is evident in analyses using both continuous and incremental approaches to quantifying apparent time. Specifically, Silent Generation and Baby Boomer speakers’ vowel space areas are significantly larger, and significantly more dispersed, than those of Generation X and Millennial speakers. Along with the evidence for contemporaneous shifting of individual components of the CVS, these results suggest that, at least since the time period at which our oldest speakers were born, the shift has not unfolded in a stepwise reconfiguration in these communities. Instead, many of the component vowels have shifted in tandem with each other and result in a general pattern of horizontal compression that implicates most of the vowels examined in the system. This illustrates that several components of a vowel shift can occur swiftly and concurrently, and that this particular shift is occurring against the phonological tendency toward maximal dispersion.
DISCUSSION AND CONCLUSIONS
By investigating the progression of the CVS with both continuous and incremental measures of apparent time, we both substantiate past work on the CVS and find results that deviate from its previously theorized trajectory. In particular, we find evidence that the fleece and face vowels are moving in apparent time. Further, our data provide little evidence for chronologically ordered, vowel-by-vowel chain shifting across these generations, which suggests that previously proposed models of the CVS as a push or pull chain are either inaccurate or must have occurred in the time periods preceding those in which our oldest speakers were born. While our data cannot disambiguate between these possibilities, it is worth noting that California experienced its most extreme demographic changes across the entire apparent time span of our speaker sample. These changes occurred via migration from other parts of the United States and immigration from other nations throughout the twentieth century, increasing California's population from 5.7 million in 1930 (the point at which our oldest speakers were born) to approximately 30 million in 1990 (the point at which our youngest speakers were born). The Dust Bowl migration during the 1930s resulted in an influx of migrants from the U.S. South into the Central Valley. It seems possible that these drastic demographic changes could have catalyzed, or at least shifted the course of, any sound change predating the movement. While this does not preclude the possibility that the CVS originated as a chain shift prior to these changes, it seems likely that, due to this rapid social change, the most dramatic sound changes occurred in the Central Valley within the apparent time span we analyze.
Though neither variationist nor phonological theory assumes that vocalic sound change always progresses as an incremental chain, the CVS has been almost exclusively theorized as a chain shift. Yet the rapid horizontal compression of speakers’ vocalic systems that we observe requires exposition outside of the most commonly invoked phonological explanations for vocalic sound change, such as chain shifts or phonetic analogy. While many phonological explanations of sound change predict maximal dispersion of discrete phonemic categories, we, in fact, see a pattern that represents a reduction of dispersion. Notably, this occurs in both lax and tense vowels at the front boundary of the vowel space, sets of phonemes that would not be predicted to proceed in the same direction by theories of chain shifts (e.g., Labov, Reference Labov2007). Further, in their analysis of vowel space area across four generations in three dialect regions, Fox and Jacewicz (Reference Fox and Jacewicz2017) showed that children have the most dispersed vowel space and oldest speakers the most compact. This makes the findings of the present analysis, a reversal of this age-based tendency, even more striking.
We suggest that these findings occasion a reanalysis of the CVS in relation to the vowel space as a whole. The holistic vowel space measures used here further illustrate the trend suggested by the individual vowel analyses: speakers’ vowel spaces underwent significant horizontal compression over time. That is, individual vowel analyses indicate significant centralization in the F2 dimension for eight vowel classes in our linear analysis: kit, dress, and trap backing, fleece and face backing, and too, goat, and toe fronting. Generational analysis reveals that most of these changes occur between the Silent and Baby Boomer generations. This trend toward horizontal compression is followed by a more general lowering of a number of front vowel classes over apparent time: not only do dress and trap lower between Baby Boomer and Millennial generations, we also see a corresponding gradual lowering of fleece, a tense vowel that would not fall into the same phonological category as dress and trap and is thus much less likely to be subject to analogical processes based on phonological similarity. Finally, although lot backing is an occurrence of back-vowel backing, against the trend of centralization, it also raises and converges with thought over time, a pattern that is similarly contradictory to the phonologically-motivated expectation of maximal dispersion. Strut backing is another example of observed movement in the F2 dimension that does not necessarily correspond to convergence, but given its central location in the vowel space, strut backing does not contradict the overall movement toward horizontal compression accomplished by more peripheral vowels.
As mentioned previously, it is possible that the vocalic movement we see developing as horizontal compression began as a chain shift in earlier decades. Further, as Dinkin (Reference Dinkin, Nevalainen and Traugott2012) finds in the Hudson Valley, it may have been the case that elements of the California Vowel Shift dispersed via spatial diffusion to communities in the Central Valley and thus should not be expected to follow implicational chain patterns. Under this view, a chain shift may have occurred in urban coastal areas of California, but once diffused to other nearby areas, the components of the shift would no longer be beholden to the uniformity presumed for the point of origin of vocalic shift. Because the present analysis does not examine differences in how the shift played out in varied communities, we cannot speak to the presence or lack of uniformity across regions of California. But even this explanation does not account for the holistic changes we observe within the Central Valley, presumably after any possible point of diffusion.
Similarly, recent work investigating sound change across the lifespan alongside apparent-time sound change (e.g., Harrington, Reference Harrington2006; Harrington, Palethorpe, & Watson, Reference Harrington, Palethorpe and Watson2000; Sankoff & Blondeau, Reference Sankoff and Blondeau2007; Sankoff & Wagner, Reference Sankoff and Wagner2011) indicates that speakers’ longitudinal changes may mirror ongoing community-wide change over time; the oldest speakers in an apparent-time study may have had even more conservative vowel spaces in relation to the innovative sound change in progress than younger people. When applied to the present results, this suggests a few possibilities. First, the overall compression of the vowel space over time may have been even more dramatic if Silent Generation (and even Baby Boomer) speakers had even fronter front vowels and backer back vowels (the conservative variants) in their younger years. Second, Baby Boomers may have exhibited only a few features of the CVS as younger speakers, and gradually acquired others throughout their lifetimes. As such, a comparison with real-time data (e.g., heritage recordings, as in McLarty, Kendall & Farrington [Reference McLarty, Kendall and Farrington2016]) is necessary to most convincingly refute the possibility that these changes occurred rapidly and contemporaneously. In addition, as with any apparent-time study, we cannot account for the physiological effects of aging on the vocal tract; Harrington (Reference Harrington2006) notes, however, a general tendency for formants to lower with age, which would predict a backing and raising of the entire vowel space as opposed to overall expansion or compression. Nonetheless, the overall pattern of horizontal compression is observed across time and requires a new interpretation of the motivating forces of the California Vowel Shift in these communities.
Extraphonological motivations for sound change
Given that the CVS is unfolding in phonologically unexpected ways, we turn to other possible explanations for the shift we observe in vowel space area and dispersion. We ask: what forces, apart from phonological ones, have been shown to correlate with vowel shifts? Further, are there phenomena not typically associated with such phonological shifts that we should consider as possible influences on sound change? In addition to the presocial cognitive models of sound change offered by phonological explanations, we suggest that the social meaning of variation may be a driving force. Considering the semiotic motivations of speakers, who have at their disposal a system of variation full of indexical potential, can lead us to possible explanations for these patterns in the absence of purely phonological motivations. In particular, the general process of compressing the vowel space could indicate that the shape and size of the vowel space itself serves as a sociolinguistic variable that speakers manipulate to project social meaning.
To explore this possibility, we first consider potential articulatory explanations for holistic compression of the vowel space. In parodic performances of Californians, we have seen that articulatory setting correlates predictably with CVS-aligned vowel quality (Pratt & D'Onofrio, Reference Pratt and D'Onofrio2017). Actors in this study appeared to use particular articulatory settings to link parodies to widely circulating media images of ideological Californian social types such as the Surfer Bro and the Valley Girl. By deploying open and protruded articulatory settings in performing these types, the actors produced vowel spaces that were compressed in the front-back dimension, in a strikingly similar fashion to that observed in the younger speakers of the present study's sample. Crucially, we do not wish to suggest here that the compression characterizing the CVS in our data is motivated by a widespread interest in adopting the mediatized jaw settings of these character types. Instead, these performances demonstrate that articulatory setting may play a role in shaping vowel quality, and that such settings can carry indexical meanings in and of themselves. Thus, an observable change in size and shape of the vowel space altogether could potentially be related to a socially meaningful change in overall articulatory setting.
Bourdieu's (Reference Bourdieu1977) notion of the habitus suggests that embodied behaviors and dispositions are learned early and embedded into the habitual, everyday actions of the body. That articulatory setting can constitute one of these embodied behaviors is borne out in the laboratory finding that speakers predictably shift their jaw setting when alternating between different languages (Gick, Wilson, Koch, & Cook, Reference Gick, Wilson, Koch and Cook2004; Wilson & Gick, Reference Wilson and Gick2006), and even when switching between read and spontaneous speech (Ramanarayanan, Goldstein, Byrd, & Narayanan, Reference Ramanarayanan, Goldstein, Byrd and Narayanan2013). For the younger speakers in our study, then, deploying an articulatory setting that leads to compression of the vowel space is perhaps itself part of producing a California-shifted vowel system. In the case of compression, this could be achieved articulatorily through a slightly lowered, open jaw and a relatively fronted lingual setting (i.e. position of the tongue). Notably, this type of articulatory setting accounts not only for the front-back compression of the space, as a lowered jaw reduces the mobility of the tongue in this dimension, but it also accounts for the general lowering of the front vowels observed in the later stages of the shift, as a lowered jaw setting would result in a generally lowered tongue body, leading to lowered vocalic productions. In their large-scale study of vowel space variation, Fox and Jacewicz (Reference Fox and Jacewicz2017) advocated for the use of ‘formant density’ measures, which capture the frequency with which speakers use certain portions of the vowel space. Future work could employ such an approach to explore further these proposed connections between jaw setting and vowel space.
Beyond articulatory explanations, we can also point to the general property of linguistic variation as a system of signs with the potential to index social meaning (Eckert, Reference Eckert and Coupland2016). Studies have provided evidence that variants of vowels undergoing sound change in particular are ripe with indexical value, with speakers’ use of particular variants in a changing system pointing out localized social meanings within a community (e.g., Eckert, Reference Eckert1989; Fought, Reference Fought1999; Labov, Reference Labov1963; Podesva, Reference Podesva.2011). This suggests that the potential for social signaling can serve as the motivation for use of an advanced or conservative variant of a vowel undergoing change (Eckert & Labov, Reference Eckert and Labov2017). While studies have illustrated that speakers deploy individual vowels within the CVS to project varied social meanings (e.g., Fought, Reference Fought1999; Podesva, Reference Podesva.2011; Van Hofwegen, Reference Van Hofwegen2017), we put forth the possibility that the configuration of a vowel space as a whole may itself be imbued with social meaning for speakers. Given that vowel space compression is difficult to explain from a cognitive or phonological standpoint, the compression of the vowel space itself, or an articulatory setting that occasions it, may index social meanings relevant to young Californians. As for the particular social meaning of a compressed vowel space in California, individual components of the CVS have been linked with less rural communities and orientations in the state (Geenberg, Reference Geenberg2014; Podesva et al., Reference Podesva, D'Onofrio, Van Hofwegen and Kim2015), and with enactments of particularized personae within the California context, in interaction (Podesva, Reference Podesva.2011), perception (D'Onofrio, Reference D'Onofrio2015), and performances (Pratt & D'Onofrio, Reference Pratt and D'Onofrio2017). More detailed examination is outside the scope of this paper, but we expect that speakers and listeners may have regional or persona-based associations with vowel systems as a whole as much as they do with phonemic segments individually.
This study has illustrated that speakers spanning the Silent Generation to Millennials in the Central Valley are reconfiguring their vowel spaces in apparent time. However, the changes we observe do not reflect a chain-shift style progression, as the California Vowel Shift has been previously characterized. Through our analysis, we see neither adherence to the principle of maximal dispersion nor evidence of stepwise shifting of individual vowels in apparent time. We instead see rapid, contemporaneous movement of the vowel space toward centralization in the front-back dimension, confirmed through analysis of novel measures of apparent time vocalic change: vowel space area and dispersion. We suggest that the holistic convergence of the front and back vowels of the CVS may be driven at least in part by extraphonological motivators, such as shifts in articulatory setting and/or social meaning associated with the vowel space as a whole. We further argue that the use of methods that treat the size and dispersion of the vowel space itself as a sociolinguistic variable may help characterize aspects of vocalic changes in progress that may not be captured through the analysis of individual vowels.
APPENDIX
Mean Nearey-normalized F1 and F2 values, by vowel class and generation group

Mean Pillai scores, by generation group