


Fish oil supplementation increases the relative proportion of the long-chain (LC) n-3 PUFA, EPA and DHA, in erythrocyte membranes(Reference Brown, Pang and Roberts1). DHA, in particular, is incorporated on the inside of the erythrocyte membrane and is present for the life of the cell(Reference Brown, Pang and Roberts1, Reference Brown, Pang and Roberts2). This provides a readily assessable marker of long-term accumulation and potential bioavailability in other tissues(Reference Harris, Sands, Windsor, Ali, Stevens, Magalski, Porter and Borkon3). Increased incorporation of LC n-3 PUFA in erythrocyte membranes is associated with reduced CVD morbidity and mortality(Reference Harris and von Schacky4). This relationship forms the basis of the Omega-3 Index(Reference Harris and von Schacky4), a concept promoted as a relatively simple means of predicting the likelihood of CVD outcomes. However, it may also be possible to relate erythrocyte LC n-3 PUFA to CVD risk factors rather than morbidity and mortality, thereby allowing for the prediction of improvement in risk factors resulting from dietary intervention.
A high TAG level in fasting blood is an independent risk factor for CVD(Reference Jeppesen, Hein, Suadicani and Gyntelberg5, Reference Assmann, Schulte and von Eckardstein6). LC n-3 PUFA consumption lowers blood TAG levels in healthy subjects(Reference Szapary and Rader7–Reference Howe, Clifton and James11) but the optimal dose for TAG reduction is not clear. While the American Heart Association recommends consuming 2–4 g n-3 PUFA/d for TAG reduction in individuals with hypertriacylglycerolaemia(Reference Lichtenstein, Applel and Brands12), a recent study reported a 23 % reduction in fasting TAG in normolipidaemics with only 0·94 g DHA/d, indicating that lower doses of fish oil may also be effective for TAG reduction(Reference Geppert, Kraft, Demmelmair and Koletzko10). The TAG-lowering effect of fish oil has been variously attributed to EPA(Reference Rambjor, Walen, Windsor and Harris13) or equally to EPA and DHA(Reference Howe, Clifton and James11). Numerous studies with DHA-rich oil have shown reductions in TAG(Reference Buckley, Shewring, Turner, Yaqoob and Minihane9, Reference Geppert, Kraft, Demmelmair and Koletzko10, Reference Nestel, Shige, Pomeroy, Cehun, Abbey and Raederstorff14, Reference Maki, Van Elswyk, McCarthy, Hess, Veith, Bell, Subbaiah and Davidson15), and the addition of EPA in a DHA-rich supplement was previously found to have no additional effect on TAG-lowering(Reference Schwellenbach, Olson, McConnell, Stolcpart, Nash and Merenich16). However, there have been few well-designed studies aimed at establishing a dose–response relationship between DHA intake and TAG reduction. Previous studies used small sample sizes in their intervention(Reference Harris, Rothrock, Fanning, Inkeles, Goodnight, Illingworth and Connor17–Reference Davidson, Maki, Kalkowski, Schaefer, Torri and Drennan20), dietary restriction(Reference Stacpoole, Alig, Ammon and Crockett18) or participants with extreme hypertriacylglycerolaemia (up to 13·45 mmol/l)(Reference Harris, Rothrock, Fanning, Inkeles, Goodnight, Illingworth and Connor17).
The purpose of the present study was to establish a dose–response relationship between moderate levels of DHA-rich fish oil supplementation and changes in both erythrocyte DHA content and blood lipids.
Methods
A randomized, double-blind, placebo-controlled, parallel design dose–response supplementation trial of 12 weeks duration was undertaken. The study was approved by the Human Research Ethics Committees of the University of Adelaide and the University of South Australia (Adelaide, Australia) and conducted according to Good Clinical Research Practice Guidelines. Written informed consent was obtained from all participants prior to commencement.
Subjects
Seventy-five non-smoking volunteers with a BMI>25 kg/m2 and fasting serum TAG ≥ 1·1 mmol/l were recruited for the study. Participants taking lipid-lowering, blood-thinning or antihypertensive medication, fish oil supplements or consuming more than one serving of fish per week were excluded.
Study design
Subjects were block-matched into four groups which were stratified according to fasting serum TAG concentration. The groups were then randomized to consume six 1 g oil capsules/d comprising either 0, 2, 4 or 6 × 1 g capsules of DHA-rich fish oil containing 26 % DHA and 6 % EPA (NuMega Ingredients, Victoria, Australia) with the balance of the capsules made up of 1 g Sunola oil capsules (NuMega Ingredients). The 2, 4 and 6 g/d doses provided 0·52, 1·04 and 1·56 g DHA/d, respectively. Subjects visited the research clinic on two consecutive mornings at baseline, week 6 and week 12 after an overnight (10–12 h) fast. Height and weight were measured and blood was collected by venepuncture on each occasion.
Assessment of erythrocyte fatty acid profiles
The relative proportions of LC n-3 PUFA in erythrocytes were determined as described previously(Reference Murphy, Meyer and Mori21). Briefly, blood samples were collected in EDTA tubes and erythrocytes were isolated within 2 h by centrifugation, washed in isotonic saline and stored at − 80°C. They were subsequently thawed, lysed in hypotonic Tris/EDTA buffered at pH 7·4 then centrifuged at 50 000 g for 30 min in a Beckman L80 ultracentrifuge. The resultant pellet was gently resuspended in the buffer and the fatty acids were extracted, and assayed by flame-ionization GC (model GC-20A; Shimazdu, Kyoto, Japan). Individual fatty acids were identified by comparison with known standards (NuChek Prep Inc., Elysian, MN, USA).
Assessment of fasting serum lipids
Blood samples were also collected in 8 ml serum tubes for determination of TAG, total cholesterol and HDL-cholesterol (HDL-C) levels using a spectrophotometric autoanalyser (Konelab, Model 20 × Ti; Thermo Electron, Waltham, MA, USA) with the manufacturer's assay kits, quality controls and reagents. LDL-cholesterol (LDL-C) was calculated using the Friedewald Equation(Reference Friedewald, Levy and Fredrickson22). Lipid concentrations were averaged from the values for the two blood samples taken at consecutive clinic visits.
Statistical analysis
Baseline markers were compared between groups using one-way ANOVA. CVD risk biomarkers and the DHA content of erythrocytes were compared between time-points by repeated measures ANOVA using Statistica for Windows version 5.1 (StatSoft Inc., Tulsa, OK, USA). The relationship between fish oil dose, DHA dose, or changes in erythrocyte LC n-3 PUFA content and changes in blood lipids (expressed as a percentage of baseline value) were analysed by linear regression. All data are expressed as mean with their standard errors. The level of significance was set at P < 0·05.
Results
Seventy-five volunteers commenced the study and sixty-seven completed. Eight withdrew due to personal time constraints. There were no significant differences in age, BMI or blood lipids between the four dosing groups at baseline (Table 1). BMI was not significantly altered over the 12 weeks with any of the treatments.
Characteristics of the subjects (Mean values with their standard errors)

HDL-C, fasting serum HDL-cholesterol concentration; LDL-C, fasting serum LDL-cholesterol concentration; TC, fasting serum total cholesterol concentration.
* Mean values were significantly different from those for 0 g (P < 0·05).
Increases in erythrocyte n-3 PUFA
There was no difference between treatment groups in either DHA or EPA contents of erythrocytes at baseline. Fish oil supplementation progressively increased the levels of EPA and DHA in erythrocyte membranes over 12 weeks (Fig. 1). The proportion of EPA+DHA in erythrocytes increased by up to 80 % over 12 weeks. Most of this increase was attributable to DHA which rose by 78 % with the 6 g/d of DHA-rich fish oil. There was a strong linear relationship between the fish oil dose and the changes in DHA incorporation by week 6 (r 0·71, P < 0·001) and week 12 (r 0·72, P < 0·001). A weaker relationship was found between fish oil dose and change in EPA incorporation at both week 6 (r 0·49, P < 0·001) and week 12 (r 0·58, P < 0·001).
Dose-dependent effect of DHA-rich fish oil ( , 0; ■, 2;
 , 4; × , 6 g/d) for 12 weeks on DHA (a) and EPA+DHA (b) content of erythrocytes (% of total fatty acids). Values are means with their standard errors depicted by vertical bars. Mean values were significantly different from those of week 0: *P < 0·05. Mean values were significantly different from those of weeks 0 and 6: †P < 0·05.

Changes in fasting serum lipids
Fish oil supplementation was associated with changes in fasting serum lipids (Fig. 2). A significant group × time interaction was demonstrated for TAG, total cholesterol and LDL-C. There was no significant group × time interaction for HDL-C, nor was there any significant time effect when the HDL-C data were pooled. TAG did not change significantly with the 0 and 2 g/d doses, but was reduced significantly after 6 weeks of supplementation with 4 and 6 g/d and remained low after 12 weeks (Table 1). LDL-C was significantly increased at weeks 6 and 12 only with the 4 g/d dose. HDL-C and total cholesterol did not change significantly from baseline with any dose. The change in TAG at weeks 6 and 12 was inversely related to baseline TAG concentrations (week 6, r − 0·69, P < 0·001; week 12, r − 0·44, P < 0·001). There were also significant linear relationships between DHA intake and changes in fasting blood lipids after 12 weeks of supplementation (Fig. 2).
Percentage changes in fasting serum lipid concentration from baseline after 6 (■) and 12 (□) weeks of fish oil (DHA) supplementation. Mean values were significantly different from those of 0 g/d: *P < 0·05. —, linear regressions between dose of fish oil (DHA) and changes in lipids after 12 weeks. HDL-C, fasting serum HDL-cholesterol concentration; LDL-C, fasting serum LDL-cholesterol concentration; TC, fasting serum total cholesterol concentration.

The changes in blood lipid concentrations were also linearly related to changes in EPA and DHA incorporation into erythrocytes (Table 2). The reduction in TAG at 12 weeks correlated more strongly with changes in DHA (r − 0·38) than with changes in either EPA (r − 0·26) or EPA+DHA (r − 0·32) after 12 weeks. There was also a relationship between the increase in erythrocyte DHA after 6 weeks and TAG reduction after 12 weeks (r − 0·44, P < 0·001).
Correlations between changes in serum lipids from baseline to week 12 (mmol/l) and changes in incorporation of DHA and EPA into erythrocytes
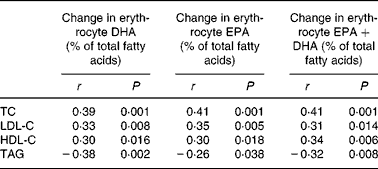
HDL-C, HDL-cholesterol; LDL-C, LDL-cholesterol; TC, total cholesterol.
Discussion
The results of the present study demonstrate that fasting blood lipid levels can be modified in a dose-dependent fashion by moderate levels of supplementation with DHA-rich fish oil. Moreover, beneficial reductions in TAG correlate closely with early rises in erythrocyte DHA levels. LC n-3 PUFA supplementation has been reported to lower TAG concentrations by multiple mechanisms, including by increasing lipoprotein lipase activity and chylomicron clearance(Reference Park and Harris23), inhibiting hepatic synthesis, increasing fatty acid oxidation and decreasing VLDL-cholesterol secretion(Reference Davidson24). In the present study, we observed a dose-related reduction in fasting serum TAG. The greatest reduction in TAG (26 %) occurred after 12 weeks in the group receiving 6 g/d of fish oil, equivalent to 1·56 g DHA/d. Previous studies have shown similar reductions in TAG although the dose of DHA used varied greatly (0·94 to >4 g/d)(Reference Buckley, Shewring, Turner, Yaqoob and Minihane9–Reference Howe, Clifton and James11).
Previous attempts to define a dose–response between LC n-3 PUFA consumption and improvements in CVD biomarkers include multiple dose studies using smaller groups(Reference Harris, Rothrock, Fanning, Inkeles, Goodnight, Illingworth and Connor17–Reference Davidson, Maki, Kalkowski, Schaefer, Torri and Drennan20, Reference Blonk, Bilo, Nauta, Popp-Snijders, Mulder and Donker25) or subjects with severe hypertriacylglycerolaemia(Reference Harris, Rothrock, Fanning, Inkeles, Goodnight, Illingworth and Connor17). Moreover, they have not focused on the role of DHA. In the present study, LC n-3 PUFA bioavailability was manipulated by low (2–6 g/d) doses of DHA-rich fish oil, yielding 0·52–1·56 g DHA/d. Similar intakes could be achieved by eating one serving of fatty fish such as salmon, mackerel or sardines per day(Reference Nichols, Virtue, Mooney, Elliott and Yearsley26). To reduce the risk of mortality from CVD, a daily intake of 250 mg EPA+DHA is recommended for healthy individuals and 1 g for those with CVD(Reference Mozaffarian and Rimm27). Harris & von Schacky(Reference Harris and von Schacky4) previously showed that the latter (1 g/d) was able to increase erythrocyte EPA+DHA levels above 8 %, their target value for cardioprotection. An intake of EPA+DHA of 1·99 g/d in the present study was able to increase erythrocyte EPA+DHA levels to above 8 %, possibly providing increased cardioprotection.
Erythrocyte EPA+DHA content at baseline in the present study was < 5 % of total fatty acids (Fig. 1), which is consistent with previous observations in Australian adults(Reference Murphy, Meyer and Mori21, Reference Mori, Burke, Puddey, Watts, O'Neal, Best and Beilin28). Consuming the 2, 4 and 6 g/d doses of DHA-rich fish oil for 12 weeks increased the proportion of EPA+DHA in erythrocytes to 7·1, 7·9 and 9·0 % of total fatty acids, respectively. Fig. 1 indicates that consumption for a longer duration approaching the lifespan of erythrocytes (4 months) would result in some degree of saturation of erythrocyte membranes so that the linear relationship between dose of fish oil and level of EPA and DHA in erythrocytes would be weaker. The difference between doses was more apparent at 6 weeks than at 12 weeks, suggesting that a maximum level of incorporation would ultimately be reached. The intermediate dose (1·35 g/d of EPA+DHA) raised erythrocyte EPA+DHA to about 8 % after 12 weeks, consistent with the observation that this level can be achieved by long-term supplementation with about 1 g/d of EPA+DHA(Reference Harris and von Schacky4). The highest dose may be reaching the upper limit for LC n-3 PUFA incorporation into erythrocytes. As erythrocyte n-3 PUFA levels reflect changes in other tissues, including cardiac cells(Reference Harris, Sands, Windsor, Ali, Stevens, Magalski, Porter and Borkon3), this could explain the apparent maximum for mortality benefits seen in populations such as Japan which have a high intake of n-3 PUFA(Reference Mozaffarian and Rimm27).
High levels of LDL-C and low levels of HDL-C are well-recognized risk factors for the development of atherosclerosis and CVD(Reference Szapary and Rader7, Reference Ross29). There were strong linear relationships between changes in total cholesterol, LDL-C and HDL-C, and increasing dose of fish oil. The literature has not reported consistent findings in relation to the effect of fish oil supplementation on cholesterol. No change has been found in total cholesterol with varying doses of LC n-3 PUFA(Reference Brown, Roberts, Pritchard and Truswell8, Reference Howe, Clifton and James11, Reference Nestel, Shige, Pomeroy, Cehun, Abbey and Raederstorff14, Reference Goodfellow, Bellamy, Ramsey, Jones and Lewis30). Fish oil has been reported to increase total HDL-C(Reference Hill, Buckley, Murphy and Howe31) or, alternatively, to increase the HDL2 subfraction without increasing total HDL-C(Reference Mori, Burke, Puddey, Watts, O'Neal, Best and Beilin28, Reference Lungershausen, Abbey, Nestel and Howe32). However, a review of thirty-six crossover and twenty-nine parallel design studies concluded that fish oil supplementation has a minimal effect on HDL-C concentration(Reference Harris33). Others have also found modest and possibly transient elevations of LDL-C following fish oil supplementation(Reference Harris33). While increases in LDL-C are generally associated with an increase in CVD risk(Reference Sharrett, Ballantyne, Coady, Heiss, Sorlie, Catellier and Patsch34), fish oil supplementation may have increased LDL particle size which could offset some of the risk associated with elevated LDL-C(Reference Mori, Burke, Puddey, Watts, O'Neal, Best and Beilin28, Reference Meyer, Hammervold, Rustan and Howe35, Reference Kelley, Siegel, Vemuri and Mackey36). Increases in LDL-C particle size after fish oil supplementation have also been negatively correlated with changes in plasma TAG(Reference Suzukawa, Abbey, Howe and Nestel37). LDL particle size was not measured in the present study, so it is not clear how the increase in LDL-C from fish oil supplementation may influence overall CVD risk and more research is needed into this area.
The linear relationships between dose of DHA and fasting serum lipid concentrations outlined in the present study could be used to predict changes in CVD risk factors which might be expected after consuming diverse sources of DHA for 12 weeks. For every 1 g/d increase in DHA intake, the present data would predict a 23 % average reduction in TAG, 4·4 % increase in HDL-C and 7·1 % increase in LDL-C. However, at 0·5 g/d, the present data predict virtually no effect on LDL-C (0·2 % reduction), whilst still providing a 13 % reduction in TAG.
A potential application of the work described in the present study would be to predict the effects of consuming DHA-rich foods on blood lipids and possibly other biomarkers of health status based on their ability to increase the proportion of DHA in erythrocytes in healthy subjects over a 6-week period, rather than having to test the effects of consuming foods on individual risk factors in long-term studies with appropriate at-risk subjects, as has previously been the case(Reference Murphy, Meyer and Mori21, Reference Howe, Downing, Grenyer, Grigonis-Deane and Bryden38, Reference Metcalf, James, Mantzioris and Cleland39).
Conclusion
Moderate DHA intakes are related, in a dose-dependent manner, to incorporation of DHA in erythrocytes and changes in blood lipids. The close association between incorporation of DHA in erythrocytes and its effects on serum lipids highlights the importance of erythrocyte DHA as an indicator of cardiovascular health status.
Acknowledgements
This study was supported by an Australian Research Council linkage grant (LP0561211) in association with Bartlett Grain Pty. Ltd. and Australian Pork Ltd. Supplement capsules were donated by NuMega Ingredients. The authors would like to thank Amanda Jager for measuring erythrocyte fatty acid composition and blood lipids, and Erin Riley, Alicia Thorp, Tahna Pettman and Keren Kneebone for administrative support. A. M. C., J. D. B. and P. R. C. H. initiated the study. Data were collected by C. M. M., A. M. C. and A. M. H. All authors contributed to analysis and preparation of the manuscript. We declare that we have no conflicts of interest.



