Introduction
A possible forcing role of predation in evolution has become an important theme in recent discussions of major evolutionary radiations—a viewpoint with an ancient pedigree championed by Vermeij (e.g., Stanley Reference Stanley1973; Vermeij Reference Vermeij1993; Bengtson Reference Bengtson2002; Hull Reference Hull2017; Bicknell and Paterson Reference Bicknell and Paterson2018). Notable examples of faunal turnovers or radiations where predation has been considered to be of particular importance include the growth of scleritized organisms during the Cambrian explosion (Bengtson Reference Bengtson2002; Bicknell and Paterson Reference Bicknell and Paterson2018), perhaps related to growing sophistication of both prey and predator (cf. Budd Reference Budd, Yu. Zhuravlev and Riding2000; but see also Budd and Mann Reference Budd and Mann2018); and the so-called Mesozoic marine revolution, a coordinated pattern of change in cryptic habitats and defensive structures seen in, for example, mollusks that is particularly clear from the Cretaceous onward and that seems to have built on changes from as far back as the Devonian (Vermeij Reference Vermeij1977; Signor and Brett Reference Signor and Brett1984; Harper Reference Harper2006). Conversely, the relationship between predator and prey has been shown to be more complex than a simple “arm's race,” both in theoretical and inferential terms (e.g., Abrams Reference Abrams1989; Leighton Reference Leighton2002). Irrespective of this centrality of predation in understanding how faunal changes take place, however, little direct evidence is available from which levels of predation through time can be estimated, partly because victims of successful predation rarely survive to leave a fossil record. This failure of fossil survival is nevertheless strongly dependent on mode of predation. For example, drilling predators such as the modern naticid gastropods may leave the shells of their prey more or less intact apart from characteristic drill holes (Carriker and Yochelson Reference Carriker and Yochelson1968), a mode of predation that has been claimed to exist as far back as the Ediacaran period (Bengtson and Zhao Reference Bengtson and Zhao1992).
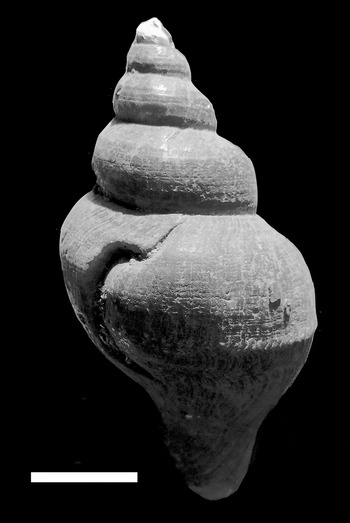
One opportunity is presented by those organisms that most clearly preserve evidence of at least failed durophagous predation—the gastropods (e.g., Alexander and Dietl Reference Alexander, Dietl, Kelley, Kowalewski and Hansen2003). Modern-day predators on gastropods such as decapod crustaceans have a variety of ways of attacking their prey, such as crushing the apex of the shell and then extracting the soft tissue from the top, but one common approach is so-called peeling, whereby the predator inserts a claw into the aperture of the prey and breaks the shell along the whorl spirally toward the apex (Shoup Reference Shoup1968: Fig. 1). This method of attack is, however, relatively time-consuming, as the prey can retreat the soft parts up toward the apex of the shell, so that a considerable amount of shell may need to be peeled away before the prey can be reached. Gastropods possess considerable powers of repair and regeneration, however, as the edge of the living mantle can rebuild the broken rim of the shell (Andrews Reference Andrews1935). Failed attempts at predation may thus leave a characteristic scar on the rim of the shell that eventually becomes incorporated into a whorl as the gastropod continues to grow (Fig. 1). During its lifetime, a gastropod may survive multiple attempts of predation that will leave a series of scars. The average rate of unsuccessful predation on a gastropod population may thus be estimated by the number of scars on each gastropod in a fossil population, assuming one can estimate age from size (see “Age–Size Relationship”; for a discussion of the various metrics of scarring, see, e.g., Alexander and Dietl [Reference Alexander, Dietl, Kelley, Kowalewski and Hansen2003]; Ebbestad and Stott [Reference Ebbestad and Stott2008]). This sort of record of attempted predation can be traced far back in the fossil record (Lindström and Peel Reference Lindstrom and Peel2005) and thus provides a potential insight into how such attacks have evolved through time.
Example of a large healed injury (scar) in the buccinid Neptunea angulata from the Pliocene–Pleistocene Red Crag of East Anglia (from the Phillip Cambridge collection in the Sedgwick Museum, Cambridge, UK). Scale bar, 1 cm.

The importance of apertural attack on gastropods may be inferred by the growing elaboration of apertural defenses in gastropods through the fossil record, such as narrowing the aperture into a slit, thickening of the apertural margin, and growth of apertural spines (e.g., Vermeij Reference Vermeij, Tevesz and McCall1983). However, the problem that remains to be solved is to be able to estimate the (unknown) rates of lethal predation from the (known) rates of failures, and this has proved to be challenging. While the rate of scarring within a population has often been taken as a proxy of intensity of the total rate of attack (Leighton Reference Leighton2002; Molinaro et al. Reference Molinaro, Stafford, Collins, Barclay, Tyler and Leighton2014; Stafford et al. Reference Stafford, Tyler and Leighton2015), consideration of what the fossil record is reflecting suggests that this relationship is far from certain (see, e.g., Harper and Peck Reference Harper and Peck2016). Is a population of gastropods with few apertural scars indicative of low absolute predation rates, with a low number of failures correlated with a low number of successes, or does it indicate a high ratio of success, which might also be expected to leave relatively few survivors with few scars (e.g., Leighton Reference Leighton2002; cf. Vermeij et al. Reference Vermeij, Schindel and Zipser1981)? If snails that were successfully predated were preserved intact and could be identified as such, rather than being destroyed, then the solution to the ratio between success and failure of predation would be trivial to solve, being merely the inverse of the average number of failed predation scars on each snail that ultimately died from predation. However, in general, it is hard to show that a particular fossil shell was actually damaged during lethal predation. While it is possible to find modern shells that appear to have been lethally damaged by predation (Vermeij Reference Vermeij1982), these clear-cut examples seem rare in the fossil record (J. S. Peel personal communication 2010), or at least difficult to identify as such. The problem is thus that the preserved shells represent a biased subset of the total population, with those that died from (destructive) predation essentially excluded from the record. The question then becomes: Is there enough information preserved in the shells in the fossil record, with their record of survived attacks, to deduce the structure of the entire population, including the ones no longer preserved?
While various authors have indicated some of the potential problems involved in making direct inferences about predation rates from the fossil record, this discussion has been hampered by the lack of an explicit model that relates scar frequency to predation rates. One recent paper (Ishikawa et al. Reference Ishikawa, Kase and Tsutsui2018) considers a formal mathematical approach for the case of drilling predation. They too focused on possible ambiguity between rates of attack and success in previous empirical analyses and built a model to resolve this ambiguity from fossil data. The key difference between their approach and ours outlined here is that instances of successful predation by drilling leaves shells available to be fossilized, whereas peeling predation occludes successfully predated specimens from the fossil record. Another mathematical model developed for an analogous problem is provided by Schoener (Reference Schoener1979), who modeled healed injuries in lizard tails. Here, we present a explicit model for the case of durophagous predation and show both the consequences of that model in terms of the likely observable data and the inverse problem of identifying predation rates from such data. We derive a full distribution for the age and scar distribution in an idealized living population under a range of possible scenarios, and then relate this distribution to the possible observations that can be made from the fossil record. We consider the likely selection biases and data occlusions that are likely in the fossil record, and we additionally discuss a range of more qualitative deviations from our model (and from standard assumptions made elsewhere) resulting from complexities of predation and population dynamics in reality. This extends significantly upon the results of Schoener (Reference Schoener1979), who derived expressions only for the proportion of individuals with at least one injury, and considered a limited set of possible deviations from an idealized model.
A General Model of Scar Production
An assemblage of fossil snails is created by an interaction of two sets of processes: ecological processes that affect the living snails, and biostratinomic processes that affect the dead ones. These can together be considered to be composed of destructive and nondestructive processes. Destructive processes encompass successful predation that destroys the shell, and biostratinomic processes such as breakage, dissolution, and so on that remove dead shells from the record. The recovered fossil record thus lacks snails that were destroyed by either of these processes. We make the initial assumption here that biostratinomic processes are nonselective, that is, that dead shells all have an equal chance of being fossilized. After the model is presented, we consider the case of when this is not the case (as indeed seems likely [Cooper et al. Reference Cooper, Maxwell, Crampton, Beu, Jones and Marshall2006]). Nondestructive processes include: failed attacks (which leave scars but do not destroy the shell); death from nonpredatory causes (e.g., starvation); and death from predation or other biological processes that do not destroy the shell (e.g., drilling predation or important predators such as asteroids that remove the prey without affecting the shell [Carter Reference Carter1968; Feder Reference Feder1963]; death from disease, parasitism, etc). In the following, “predation” refers only to durophagous predation that leaves a scar if unsuccessful (for the significance of this simplification, see discussion below), and thus necessarily neglects predation by, for example, asteroids. We note that both failed and successful attacks are likely to have been carried out by a variety of different predators (e.g., Birkeland Reference Birkeland1974; Sih et al. Reference Sih, Englund and Wooster1998), so that our model treats the effects of all scarring predators in aggregrate.
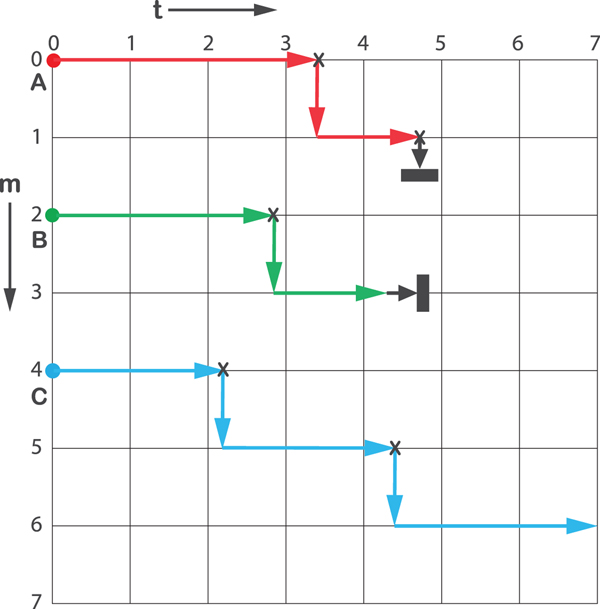
In our model, we consider a population of snails, each of which is characterized by its age and the number of healed scars it possesses. Within this population, we denote the number of snails of age a, with marks m at time t as N(a, m, t). This population changes over time as a result of various processes. Snails are attacked at a rate R per unit time, independent of time, age, or current number of scars. A proportion, ρ, of these attacks are successful, again independent of time, age, or scar number. Snails also die of nonpredative causes at a rate d(a), which may depend on the age of the snail (e.g., by senescence). The effect of these processes on the fate of the snails is illustrated in Figure 2. Over a short time window, there are four possible outcomes for a focal individual: (1) successful predation leading to death and thus destruction of the shell, at a rate Rρ; (2) unsuccessful predation leading to the formation of a scar, at a rate R(1 − ρ); (3) death from nonpredatory causes, leading to potential preservation of the shell in the record, at a rate d(a); and (4) the snail ages without being attacked or dying of any other cause, at rate 1 − d(a) − R. Therefore, over some short interval of time Δt the dynamics of the population can be described by the following master equation.
 $$\eqalign{N\lpar {a + {\rm \Delta} t,m,t + {\rm \Delta} t} \rpar & \, = \, N\lpar {a,m,t} \rpar \lpar {1-d\lpar a \rpar {\rm \Delta} t-R{\rm \Delta} t} \rpar \cr & \qquad \ \, + N\lpar {a,m-1,t} \rpar R\lpar {1-{\rm \rho}} \rpar {\rm \Delta} t,} $$
where the first term on the right-hand side represents all snails that previously had m scars and were neither predated nor died of nonpredatory causes, and the second term represents those that previously had m − 1 scars and faced an unsuccessful predatory attack. These are the only two ways in which a snail may have m scars at the subsequent time point (see Fig. 2).
A conceptual plot of number of survived predation scars (m) against time (t), showing possible fates for three snails A, B, and C of varying ages a A, a B, and a C at time t = 0. Attacks are marked with an “X.” Snails can survive periods without attacks (horizontal colored branches) or survive attacks (vertical colored branches). Death can come from successful attack (vertical black branches terminated with black bar) or from nonpredatory causes (horizontal black branches terminated by black bar). At every point in the grid, there are two recent possibilities for having arrived there: either surviving from t − 1 with or without scarring. The exception is provided for points along m = 0, where only arrival without scarring is possible. Snail C survived the time period under question.

Ignoring the number of scars, the number of snails of age a is determined by the proportion of younger snails surviving both predatory and nonpredatory possibilities of dying. The proportion of snails of age a that will make it to the age of a + Δt is 1 − d(a)Δt − RρΔt; that is, those that are neither successfully predated (rate Rρ) or suffer a nonpredatory death (rate d(a)). Hence, we can formulate a second master equation for the age distribution:
 $$\matrix{ \hfill {N\lpar {a + {\rm \Delta} t,t + {\rm \Delta} t} \rpar } &\!\!\!\!\! {\equiv \mathop \sum \limits_{m = 0}^\infty N\lpar {a + {\rm \Delta} t,m,t + {\rm \Delta} t} \rpar } \hfill \cr & \!\!\!\!\! { = N\lpar {a,t} \rpar \lpar {1-d\lpar a \rpar {\rm \Delta} t-R{\rm \rho \Delta} t} \rpar}. \cr} $$
The first line of this equation expresses the fact that the total number of snails of a given age must always equal the sum of those with that age with each possible number of scars.
Steady-State Solution
In a steady-state solution, N(a, m, t) does not vary with t:  $N\lpar {a,m,t} \rpar \equiv N\lpar {a,m} \rpar \,\forall \,a,m,t$. Using this assumption, we can derive a solution for the steady-state population. Taking equation (1), we have:
 $$\eqalign{& N\left( {a + {\rm \Delta }t,m} \right) = \left[ {N\left( {a,m} \right)\left( {1-d\left( a \right){\rm \Delta }t-R{\rm \Delta }t} \right)} \right. \cr & \qquad\qquad \quad \ \ \left. {\quad + N\left( {a,m-1} \right)R\left( {1-{\rm \rho }} \right)} \right]{\rm \Delta }t.} $$
From equation (2) we also have:
 $${N\lpar {a + {\rm \Delta} t} \rpar = N\lpar a \rpar \lpar {1-d\lpar a \rpar {\rm \Delta} t-R{\rm \rho \Delta} t} \rpar}.$$
From the above equations, we can determine the evolution of the conditional probability P(m|a), that a snail of age a has m scars:
 $$\scale80%{\eqalign{&P\left( {m{\rm \mid }a + {\rm \Delta }t} \right) \cr &\quad= N\left( {a + {\rm \Delta }t,m} \right)/N\left( {a + {\rm \Delta }t} \right) \cr &\quad = \displaystyle{\matrix{\left[ {N\left( {a,m} \right)\left( {1-d\left( a \right){\rm \Delta }t-R{\rm \Delta }t} \right)} { + N\left( {a,m-1} \right)R\left( {1-{\rm \rho }} \right)} \right]{\rm \Delta }t \hfill} \over {N\left( a \right)\left( {1-d\left( a \right)\Delta t-R\rho \Delta t} \right)}} \cr &\quad = P\left( {m {\rm \mid} a} \right)\left( {1-R\left( {1-{\rm \rho }} \right){\rm \Delta }t} \right) \cr &\qquad + P\left( {m-1{\rm \mid }a} \right)R\left( {1-{\rm \rho }} \right){\rm \Delta }t + O\left( {{\rm \Delta }t^2} \right),}} $$
where O(Δt 2) stands for terms of order Δt 2 that can be neglected as Δt  $\to $ 0. Taking the limit as Δt → 0, we therefore have:
 $$\displaystyle{{dP\lpar {m \vert a} \rpar } \over {da}} = R\lpar {1-{\rm \rho}} \rpar [ {P\lpar {m-1 \vert a} \rpar -P\lpar {m \vert a} \rpar } ] .$$
Solution of this differential equation (see Appendix) reveals that P(m|a) therefore follows a Poisson distribution with mean R(1 − ρ)a:
 $$P\lpar {m \vert a} \rpar = \displaystyle{{{(R\lpar {1-{\rm \rho}} \rpar a)}^m{\rm exp}\lpar {-R\lpar {1-{\rm \rho}} \rpar a} \rpar } \over {m!} }.$$
If we assume that the fossilization and collection processes are not biased with respect to scar number, we can expect that the distribution of scars with age in the population of fossil shells will be the same as in the living population, that is:
 $${P_f\lpar {m \vert a} \rpar = P\lpar {m \vert a} \rpar} .$$
Two key insights can be gleaned from this result. First, the distribution of the number of scars as a function of age (in both living and fossil assemblages) depends entirely on the predation parameters R and ρ and excludes factors related to the nonpredatory death rate. We can therefore make inferences about R and ρ from this information without a detailed understanding of the life table of the gastropod species.
The second insight, however, is that this Poisson distribution of unsuccessful attacks per unit time depends solely on the product R(1 − ρ), which we label Ω. This implies that inferences based on the age-dependent scarring alone can never reveal a unique combination of R and ρ that best fits the available data. Instead, inferences will identify an optimal value of R(1 − ρ), and thus a contour in the R, ρ parameter space. Without further information or assumptions, no further disambiguation is possible. This result confirms the intuition of some previous workers (e.g., Leighton Reference Leighton2002) that a high number of scars per year of life can only ambiguously indicate high predation rates or low success rates. Our Ω broadly corresponds to the λ of Kosloski et al. (Reference Kosloski, Dietl and Handley2017). Note that, like Ω, the λ of Kosloski et al. (Reference Kosloski, Dietl and Handley2017) thus corresponds only to R(1 − ρ) and not to predation pressure itself, Rρ.
To proceed further, then, it is necessary to also examine the distribution of shell ages. To do so, we need to consider the nonpredatory death rate, d(a). Various models for death rates for different ages exist (Caddy Reference Caddy1991). These include (broadly): increasing death rates through age; decreasing death rates through age; and constant death rates through age. The first model characterizes organisms such as mayflies and high-income humans, and seems intuitively most likely. However, many marine organisms, including gastropods (e.g., Suzuki et al. Reference Suzuki, Hiraishi, Yamamoto and Nashimoto2002; Perron Reference Perron1986), do not appear to exhibit this sort of mortality, but rather appear to have a constant death rate throughout most of their lives. The exception, in gastropods as in all marine invertebrates, especially those with planktotrophic larvae, would be extremely high mortality in their earliest months (Rumrill Reference Rumrill1990; Perron Reference Perron1983; Gosselin and Qian Reference Gosselin and Qian1997), probably largely through predation. For the purposes of our study, however, the mortality rates of such young snails can be disregarded, as they are essentially invisible in the fossil record. Constant death rates from all causes after this early period would imply that marine invertebrates do not seem to show senescence (i.e., they rarely die from “old age” [Britton and Morton Reference Britton and Morton1994]). It should be noted that if overall mortality is constant through age, then both death from predation and from nonpredation are also likely to be constant. If not, then increase in one would have to be balanced by decrease in another, and it is hard to think of a theoretical reason for this. Thus, although one might expect that invertebrates become more resistant to predation as they grow (see age refuges, below), a body of empirical evidence suggests that at least some maintain constant death rates throughout their lives (see, e.g., the red abalone, Haliotis rubescens, and other examples in Jones et al. [Reference Jones, Scheuerlein, Salguero-Gómez, Camarda, Schaible, Casper, Dahlgren, Ehrlén, García, Menges and Quintana-Ascencio2014]).
Modeling Attack and Success Rates with a Constant Nonpredatory Death Rate
The age distribution in the population can be determined from equation (4). Taking the limit as Δt → 0, we arrive at a simple differential equation, whose solution, if d(a) is constant, specifies an exponential distribution of ages:
 $${\matrix{\hfill {\displaystyle{{dP\lpar a \rpar } \over {da}}} & \!\!\!\!{ = 1-d-R{\rm \rho}} \hfill \cr {\Rightarrow P\lpar a \rpar } & \!\!\!\!{ = \lpar {R{\rm \rho} + d} \rpar {\rm exp}\lpar {-\lpar {R{\rm \rho} + d} \rpar a} \rpar}. \cr}} $$
For d(a) to be constant (but of significant size) implies that the distribution of ages in the fossil shells, P f(a), is the same as in the living population, as nonpredatory death samples these shells into the pool of potential fossils in a unbiased fashion.
 $${P_f\lpar a \rpar = P\lpar a \rpar = \lpar {R{\rm \rho} + d} \rpar {\rm exp}\lpar {-\lpar {R{\rm \rho} + d} \rpar a} \rpar}. $$
Given both this age distribution of fossil shells (eq. 10) and the distribution of scars conditioned on age (e.g., eq. 8), we can also derive the distribution of scars in the fossil (or living) population as a whole, P f(m):
 $${\eqalign{ { {P_f\lpar m \rpar } \;& { = \int \nolimits_0^\infty P_f\lpar {m \vert a} \rpar P_f\lpar a \rpar da} } \cr &\qquad \ = \displaystyle{{\lpar {R{\rm \rho} + d} \rpar } \over {R + d}}{\left( {\displaystyle{{R\lpar {1-{\rm \rho}} \rpar } \over {R + d}}} \right)}^{m}. $$
That is, m is geometrically distributed with rate  $\displaystyle{{\lpar {R{\rm \rho} + d} \rpar } \over {R + d}}$.
We have thus derived a model that describes the distribution of ages and scars in a fossil assemblage, conditioned on known values of the parameters R, ρ, and d. How are these values to be estimated? Imagine we are presented with a data set of N shells, each of which has a recorded age, a i, and number of scars, m i, i ∈ 1…N. From our model, we can define a log-likelihood function  ${\rm {\cal L}}\lpar {R,{\rm \rho}, d} \rpar $, the (log-)probability of generating these observations from our model with a specific choice of parameters:
 $$\eqalign{{\rm {\cal L}}\left( {R,{\rm \rho },d} \right) & \, = \, {\rm log}P\left( {a_1,m_1,a_2,m_2 \ldots a_N,m_N{\rm \mid }R,{\rm \rho }} \right) \cr & = \mathop \sum \limits_{i = 1}^N {\rm log}P\left( {m_i{\rm \mid }a_i,R,{\rm \rho }} \right) + {\rm log}P\left( {a_i{\rm \mid }R,{\rm \rho }} \right) \cr & = \mathop \sum \limits_{i = 1}^N -\left( {R + d} \right)a_i + m_i{\rm log}\left( {R\left( {1-{\rm \rho }} \right)a_i} \right) \cr & \quad \ \ \ \ \ \ \, + {\rm log}\left( {R{\rm \rho } + d} \right)-{\rm log}\left( {m_i!} \right).} $$
Maximizing this function with respect to the model parameters yields the following relationships between the maximum-likelihood estimators (see Appendix for derivation):
 $$\hat{R}\lpar {1-{\hat{\rm \rho}}} \rpar = {\hat{\rm \Omega}} = \displaystyle{{\mathop \sum \nolimits_{i = 1}^N m_i} \over {\mathop \sum \nolimits_{i = 1}^N a_i}},$$
 $$\hat{R}{\hat{\rm \rho}} + \hat{d} = {\displaystyle{N \over {\mathop \sum \nolimits_{i = 1}^N a_i}}}.$$
With these two simultaneous equations alone we cannot disambiguate the three model parameters. Instead, we can infer two distinct quantities: the rate of unsuccessful attacks, R(1 − ρ), and the total mortality rate, Rρ + d. In particular, without further information, we cannot infer what proportion of overall mortality is caused by predation. However, by making reasonable assumptions regarding this proportion, we can make further progress toward identifying R and ρ, as we show in the next section.
Limits on d(a) and R when d(a) Is Constant
Because d(a) is unknown but assumed to be constant, further deductions about the limits of R, ρ, and d can be made. Adding the two estimator equations (13) and (14) together gives:
 $$\hat{R} + \hat{d} = \displaystyle{{\mathop \sum \nolimits_{i = 1}^N m_i + N} \over {\mathop \sum \nolimits_{i = 1}^N a_i}}. $$
In other words, the scar distribution with age adds certain constraints on d and R, even when d is unknown. In general, as setting d = 0 implies that  $\hat{R} = \displaystyle{{\mathop \sum \nolimits_{i = 1}^N m_i + N} \over {\mathop \sum \nolimits_{i = 1}^N a_i}}$ and setting ρ = 0 implies that
 $\hat{R} = \displaystyle{{\mathop \sum \nolimits_{i = 1}^N m_i} \over {\mathop \sum \nolimits_{i = 1}^N a_i}}$, the possible range both in R and d is
 $\displaystyle{N \over {\mathop \sum \nolimits_{i = 1}^N a_i}}$, irrespective of the number of scars. The limited range of possible values of R and ρ is shown by the shaded portion of Figure 3.
Example plot of inferred contour of Ω ≡ R(1 − ρ) as a function of R and ρ from our simulated data set of 100 shells. Dashed lines give the  $95\% $ confidence intervals. The black circle shows values of R and ρ when d = 0, and the gray box indicates the possible ranges of R and ρ (including confidence intervals) when d is constant.

Estimation of Mortality Rates
It is worth noting that estimation of overall mortality rates, as per equation (14), is a well-studied and complex problem in its own right. Notoriously, in natural populations, this problem has been exacerbated by modern fishing (see, e.g., Kenchington Reference Kenchington2014), one of the few biases that does not affect the fossil record. One simple and classical approach has been to use the Hoenig estimator (Hoenig Reference Hoenig1983). This method takes the view that, as all individuals in a population must essentially have died by the time of the oldest specimen, then determining the age of such a specimen will allow estimation of the death rate, and thus proposes a relationship of the form:
 $${\rm ln}\lpar {\hat{R}{\hat{\rm \rho}} + \hat{d}} \rpar = {\rm \alpha} + {\rm \beta ln}\lpar {a_{max}} \rpar ,$$
where a max is the maximum age. α and β are two constants determined by Hoenig from published longevity data sets for mollusks to be 1.23 and −0.832 respectively. For example, if the age of the oldest specimen is 15 years, then  $\hat{R}{\hat{\rm \rho}} + \hat{d} = 0.36$. Within a given data set, this estimator naturally emerges as a case of ordinal statistics; because the ages of specimens are exponentially distributed (assuming constant mortality), the expected age of the oldest specimen is given by considering the expected value of the largest of N exponential random variables, each with mean 1/(Rρ + d), giving the relationship:
 $${\rm {\opf E}}\lpar {a_{{\rm max}}} \rpar = H_N/\lpar {R{\rm \rho} + d} \rpar ,$$
where  $H_N = \mathop \sum \nolimits_{i = 1}^N 1/i$ is the Nth harmonic number. Hence, the theoretical expectation for the Hoenig estimator is:
 $${\rm ln}\lpar {\hat{R}{\hat{\rm \rho}} + \hat{d}} \rpar = {\rm ln}H_N-{\rm ln}\lpar {a_{max}} \rpar .$$
A Simplified Scenario with Negligible and Constant Nonpredatory Death Rate
Given the difficulties with estimating d, it is nevertheless possible with the above result to make further progress with the problem if one is willing to make another simplifying assumption, that is, that most invertebrates eventually die from predation (e.g., Britton and Morton Reference Britton and Morton1994; for a case involving vertebrates, see, e.g., Linnell et al. [Reference Linnell, Aanes and Andersen1995]). There are, of course, some exceptions, such as the mass deaths of some cephalopods after spawning (Rocha et al. Reference Rocha, Guerra and González2001) and certain disease-related catastrophic mass deaths (e.g., Lessios Reference Lessios1988; Fey et al. Reference Fey, Siepielski, Nusslé, Cervantes-Yoshida, Hwan, Huber, Fey, Catenazzi and Carlson2015), but it could be argued that these represent the exception rather than the rule (Britton and Morton Reference Britton and Morton1994). Classical experiments that aim to exclude the effects of predation tend to suggest that predation plays an important role in structuring communities (and thus that it is an important source of death; e.g., Reise Reference Reise, Keegan, Boaden and Ceidigh1977). Here, then, we consider the case that a constant d(a) (i.e., the nonpredatory death rate) might always be small compared with the death rate from predation, that is,  $R{\rm \rho} \gg d\lpar a \rpar \equiv d\,\forall \,a$. It should be noted that, in this instance, the fate of the individuals that made it into the fossil record would be highly unusual, as those individuals would represent the small number of snails that died nonpredatory deaths. The assumption that d(a) is constant implies that the age structure of the fossils would again faithfully reflect that of the living population but would be controlled almost entirely by predation, following equation (19):
 $${P_f\lpar a \rpar = R{\rm \rho exp}\lpar {-R{\rm \rho} a} \rpar}. $$
The distribution of scars in both the living and fossil populations will follow a geometric distribution, as in equation (11). However, if d ≪ Rρ, the rate of the geometric distribution simplifies to  $\displaystyle{{\lpar {R{\rm \rho} + d} \rpar } \over {R + d}}\simeq {\rm \rho} $, with the straightforward corollary that the proportion of shells with at least one scar is 1 − ρ. Hence, and somewhat counterintuitively, the scar distribution would depend only on the success rate of predation and not on the attack rate of predation. This important result shows that for cases of overwhelming destructive predation as cause of death, the proportion of scarred snails in the fossil population (a statistic often collected) can be used to estimate the success rate of predation, without having to explicitly consider the distribution of ages of the preserved specimens. However, it should be noted that such an estimate will only be accurate if the fossils examined are not size (and thus age) biased. For example, if many small shells happen to be missing from the sample, then (as they are less likely to be scarred than larger, older shells), the proportion of scarred shells in the sample will be higher than in the unbiased population, leading to an underestimate of ρ. Given that biased samples are likely to be biased in this direction (see below), analysis of such would at least set a lower limit to ρ.
Are the assumptions behind this simplified model reasonable? A constant death rate after the juvenile stage has often been argued for (e.g., Perron Reference Perron1983; Brey Reference Brey1999). Whether or not predation is overwhelmingly dominant is less clear, but in studies of Conus pennaceus, for example, Perron (Reference Perron1983) showed or argued that both our conditions, of constant adult death rates (ca. 42% per year in his study) and overwhelming death from predation were likely to pertain, as empty shells were rare in his assemblages (cf. Britton and Morton Reference Britton and Morton1994). Interestingly, he also showed that 46.7% of adults showed at least one trace of an unsuccessful attack, which would imply a success rate of attack of about 53.3%, and thus an overall rate of attack of ca. 0.79 per year per snail. We employ these numbers in the following section as an example. Nevertheless, even if predation per se is an important control on population structure, it seems unlikely that predation from peeling would be dominant over all other forms of death. This is an important caveat to be entered in consideration of the simplified model below.
A Simulated Demonstration
To demonstrate the process of making inferences from real data sets, we outline the procedure on a simulated sample of 100 fossil shells, with parameters ρ = 0.533 and R = 0.79 (illustrative parameter values calculated from Perron [Reference Perron1983], as above). Simulated data were generated by randomly sampling 100 ages from the exponential distribution specified in equation (19), and then sampling the number of scars for each specimen, conditioned on the simulated age, from the Poisson distribution specified in equation (8). The code used can be found in Supplementary File 1. Our simulated data set is summarized in the histograms in Figure 4.
Shell age distribution and scars per shell from a simulated data set where ρ = 0.533 and R = 0.79.

To perform the inference, we need to define a log-likelihood function: the log-probability of generating the observed data from the model, conditioned on putative values of the parameters R and ρ. Let a 1, a 2, …a N be the recorded ages of the N fossil shells (here N = 100) and m 1, m 2, …, m N be the corresponding number of scars. Then the log-likelihood function  ${\rm {\cal L}}\lpar {R,{\rm \rho}} \rpar $ is:
 $$\eqalign{{\rm {\cal L}}\left( {R,{\rm \rho }} \right) & = {\rm log}P(a_1,m_1,a_2,m_2 \ldots a_N,m_N{\rm \mid }R,{\rm \rho )} \cr & = \mathop \sum \limits_{i = 1}^N {\rm log}P\left( {m_i{\rm \mid }a_i,R,{\rm \rho }} \right) + {\rm log}P\left( {a_i{\rm \mid }R,{\rm \rho }} \right) \cr & = \mathop \sum \limits_{i = 1}^N -Ra_i + m_i{\rm log}\left( {R\left( {1-{\rm \rho }} \right)a_i} \right) \cr & \quad + {\rm log}\left( {R{\rm \rho }} \right)-{\rm log}\left( {m_i!} \right).} $$
Maximizing  ${\rm {\cal L}}\lpar {R,\rho} \rpar $ with respect to changes in R and ρ we obtain the following maximum-likelihood parameter estimates (see Appendix):
 $$\matrix{ \hfill {\hat{R}} & \!\!\!\!\!\!{ = \displaystyle{{N + \mathop \sum \nolimits_{i = 1}^N m_i} \over {\mathop \sum \nolimits_{i = 1}^N a_i}},} \cr \hfill {{\hat{\rm \rho}}} & \!\!\!\!\!{ = \displaystyle{N \over {N + \mathop \sum \nolimits_{i = 1}^N m_i}},} \cr} $$
with the following asymptotic expressions for the standard errors in these estimates (see Appendix):
 $$\matrix{ \hfill {{\rm \sigma} _{\hat{R}}} \hfill { \,= \, \displaystyle{{\hat{R}} \over {\sqrt {\mathop \sum \nolimits_{i = 1}^N (m_i + 1)}}},} \cr \hfill {{\rm \sigma} _{{\hat{\rm \rho}}}} \,{ = \, \displaystyle{{{\hat{\rm \rho}} \sqrt {\lpar {1-{\hat{\rm \rho}}} \rpar }} \over {\sqrt N}}.\hskip23pt} \cr} $$
In the case of the simulated data shown in Figure 4, we have the following summary statistics:  $N = 100,\mathop \sum \nolimits_{i = 1}^N m_i = 87,\mathop \sum \nolimits_{i = 1}^N a_i = 235.84$, giving parameter estimates (with 95% confidence intervals) of:
 $\hat{R} = 0.79 \pm 0.11,{\hat{\rm \rho}} = 0.53 \pm 0.07$, in close agreement with the original parameters used.
How reliable are these estimators? We created 1 million simulated data sets of 100 shells from our model and performed the above inference procedure on each, recording the maximum-likelihood estimates of R and ρ. The results of this test are presented in Figure 5, showing the joint and marginal distributions of  $\hat{R}$ and
 ${\hat{\rm \rho}} $. These results show that the inferred values are centered on the true parameter values, that estimates of both R and ρ are normally distributed and typically lie within 0.1 of the true value, and that errors in the two estimates are independent of each other.
Results of inference on simulated data. One million data sets of 100 shells were simulated and the values of R and ρ inferred. The true values are marked by the dashed lines.

What could we deduce from these numbers if we assumed that d was constant but unknown? As  $N = 100,\mathop \sum \nolimits_{i = 1}^N m_i = 87$ and
 $\mathop \sum \nolimits_{i = 1}^N a_i = 235.84$, from equation (15), we can see that the estimates of R = 0.79 (and thus ρ = 0.53) in our example when d = 0 are therefore maximum values. Similarly, even if ρ implausibly = 0, R cannot be below the limit set by the number of scars per shell, that is, 0.36; and thus, d cannot be more than 0.43. The limits set by constant d are indicated in Figure 3.
Modeling when the Model Assumptions Are Violated
We have considered scenarios where d is constant and small, and where d is constant but unknown. Furthermore, in the development of our model, we have made several assumptions about parameter dependencies that are open to question. We examine some of the possible violations of these assumptions and their likely consequences in this section. In general, violations of the model assumptions lead to great uncertainty in expected outcomes unless the form of the violation is well characterized.
The model we have described assumes that ρ and R are independent of both snail age and number of preexisting scars (i.e., the individual's past experience of predation). Here we will consider two further scenarios. The first is that R and/or ρ are no longer constant, but instead may depend on a and/or m. Such violations include so-called size refuges and snail resistance to predation being weakened by previous, unsuccessful attacks. Second, we consider the possibility that the nonpredatory death rate is both large and age dependent. If the form of these dependencies is known, our model could be reformulated to account for them. However, given that our model is already generally underdetermined by the likely available data, as illustrated in the examples above, it is unlikely that any precise age dependence on predatory or nonpredatory effects can be inferred directly from observations. It should also be noted that previous analyses, made without a generative model, have implicitly made an assumption of age-independent predation by not modeling the effect of size refuges; our model simply makes this explicit. However, it will be instructive to consider the effect of each violation in terms of the qualitative effects on the likely observable data.
After discussing these two scenarios, we will then explore what analyses are appropriate when the age structure of the fossil assemblage does not align with that of the living. This may result through collection bias or via the scenarios discussed earlier.
Size Refuges
Prey species can attempt to reduce predation pressure in a variety of ways, especially through use of refuges—adapting habitats or behaviors that allow them to at least partly evade their predators (e.g., Sih Reference Sih1987; Ray and Stoner Reference Ray and Stoner1994; Wang and Wang Reference Wang and Wang2012). One way of achieving this is by attaining a large size (Paine Reference Paine1976; Vermeij Reference Vermeij1976; Chase Reference Chase1999; Schindler et al. Reference Schindler, Johnson, MacKay, Bouwes and Kitchell1994) that is beyond the handling capacity of a particular predator (e.g., a particular crab may not be able to manipulate or break a very large gastropod shell). Indeed, such effects have been investigated in the fossil record (e.g., Harper et al. Reference Harper, Peck and Hendry2009). However, as discussed by Harper et al. (Reference Harper, Peck and Hendry2009), the effects of size refuges are potentially complex. Experimental evidence shows that predators are indeed typically prey-size selective (e.g., Paine Reference Paine1976; Harding Reference Harding2003) Nevertheless, larger individuals of a particular prey species may be vulnerable to larger members of a predator species, or indeed to different predators (Birkeland Reference Birkeland1974). Furthermore, the refuge may be achieved by being attacked less often, or being less vulnerable to attack. In terms of our model then, size refuges might conceivably create a dependence of either R and/or ρ upon the size of the individual, and thus indirectly upon the age of the snail, thus violating the assumptions made earlier. These new dependencies may be of two varieties: decreasing attack rates, R, with increasing age, and/or decreasing success rates, ρ. If R decreases, then the rate at which large snails both die and accumulate scars will decrease, leading to an overabundance of large, relatively unscarred individuals in the population. This would increase the summed age of specimens, while decreasing the summed scars, creating a lower apparent rate of unsuccessful predations. However, if ρ decreases, then the rate of death for large snails will decrease via the replacement of lethal attacks with nonlethal, scarring attacks. Overall the rate of unsuccessful predation will increase, increasing the ratio in equation (21). It is likely, however, simply from the overall population structure, that the proportion of gastropods in a particular population that manage to reach a size refuge is likely to be low. This, combined with what will presumably be a differential effect of predation protection, implies that the effect of size refuges on our model is likely to be small.
Scar Weakening
Another possible effect on scar distribution might be that previously scarred individuals are more vulnerable to either future attack or future death from predation, that is, that R and/or ρ are dependent on m. In principle, if scarred individuals are more vulnerable to death from predation, then one would expect a lower number of scarred shells in the preserved assemblage, and heavily scarred individuals would be particularly underrepresented. In addition, as large shells are more likely to be scarred than small ones, one would expect a preferential removal of large shells. Naturally this perturbation would affect the estimators in, for example, equation (21). However, once again, in the absence of a clear model of what effect these vulnerabilities would have, it is likely to be very difficult to detect their influence in a typical assemblage. It should be noted that the experimental evidence available does not support the view that the shell itself is weakened by scarring (Blundon and Vermeij Reference Blundon and Vermeij1983).
Variable Nonpredatory Death Rates
We now wish to consider the case in which the predatory death rate is neither small nor constant. If d(a) varies with age, then fossils will be recruited preferentially from snails of ages that have higher rates of death from causes other than durophagy, because all fossils must originate from non-durophagous deaths (cf. Rigby Reference Rigby1958; Hallam Reference Hallam1967). In addition, the age structure of the living population also depends on the integral of the nonpredatory death rate through age:
 $$P_f\lpar a \rpar \propto d\lpar a \rpar {\rm exp}\lpar {-R{\rm \rho} a} \rpar {\rm exp}\left( {-\mathop \int \nolimits_0^a d\lpar {a^{\prime}} \rpar da^{\prime}} \right).$$
If we had perfect knowledge of the nonpredatory death rate d(a), then inference of R and ρ would remain possible. Unfortunately, without simplifying assumptions, full knowledge of d(a) is generally lacking, both in terms of its magnitude and age dependence, even in living populations, and its inference from fossil ones seems implausible. Thus, in the case in which d(a) is assumed to vary in an unknown way, we are forced to conclude that the age distribution of fossil shells can give us no useful information about the values of R and ρ. However, we can still make inferences on the basis of the conditional scar distribution, P f(m|a). Recall (eq. 8) that this distribution does not depend on the nonpredatory death rate, and thus is independent of any variations within it, or uncertainty as to its value.
As noted previously, the distribution P f(m|a) depends solely on the combination of parameters Ω ≡ R(1 − ρ). From this observation, it is clear that we can only hope to infer this combined value, and will not be able to disambiguate R and ρ. By defining and maximizing a log-likelihood based on equation (8) (see Appendix), we show that we retrieve the following estimator and standard error:
 $${\rm \widehat{\Omega}} = \displaystyle{{\mathop \sum \nolimits_{i = 1}^N m_i} \over {\mathop \sum \nolimits_{i = 1}^N a_i}}$$
 $${{\rm \sigma} _{\rm \Omega} = \displaystyle{{{\rm \widehat{\Omega}}} \over {\sqrt {\mathop \sum \nolimits_{i = 1}^N m_i}}}.} $$
We show the result of applying this estimator to the same simulated data set used earlier, but with no assumptions about d in Figure 3. Here we can see that the estimator (and associated standard error) defines a contour band in the R and ρ space that contains the values of R and ρ used to generate the data.
Comparison of Predation Parameters without Knowledge of Age Structure
Suppose that the age–size relationship (ASR) of a particular gastropod is unknown, but that two different assemblages are available for study, which can be assumed to have the unknown ASR. Application of the estimators derived earlier, and thus estimation of the relative values of R and ρ, depends on our ability to determine the relative ages of different snails. What can we still infer, then? We consider first the simple case, wherein there is an unknown linear ASR: a = k × l, where l is the shell length. In this case, we can immediately estimate the ratio of Ω ≡ R(1 − ρ) in the two populations:
 $${\displaystyle{{\rm \widehat{\Omega}}_A} \over {{\rm \widehat{\Omega}}_B}} = {\displaystyle{{\mathop \sum \nolimits_A m\mathop \sum \nolimits_B a} \over {\mathop \sum \nolimits_B m\mathop \sum \nolimits_A a}}} = {\displaystyle{{\mathop \sum \nolimits_A m\mathop \sum \nolimits_B l} \over {\mathop \sum \nolimits_B m\mathop \sum \nolimits_A l}}\ , $$
where the subscripts of the summations indicate the assemblage over which ages, scars, or lengths are to be summed. This can give us an estimate of the relative rates of nonlethal predation in the two populations, if not their absolute magnitudes in terms of specific time units. If, furthermore, either R or ρ were known to be the same across the two populations, this could give an estimate for the relative values of the other predation parameter.
What can we do if we do not know the form of the ASR with enough precision to estimate the relative ages of snails with confidence? In this case, the relative estimation above would no longer be possible. With a suitable data set we can nonetheless ask a simpler question: Are the predation parameters that generated the two assemblages the same? Consider the following procedure: for every shell in assemblage A, find a shell of matching size (within some tolerance) in assemblage B, discarding shells that cannot be matched. If Ω is the same for each population, the number of scars on each of two matching shells should come from the same Poisson distribution with an unknown mean (eq. 8). Therefore, the shell with the most scars should be from assemblage A with probability q = 0.5 (discarding instances in which the number of scars are the same). Aggregating over many such pairings, we can perform a binomial significance test for the null hypothesis H 0:q = 0.5. If either R or ρ were known to be the same between the two populations, then such a comparison of Ω would equate to a comparison of the nonfixed predation parameter.
Practical Problems
We have derived a set of equations that allows us to relate scar and age frequency in fossil populations to important parameters that are governed by predation and success rates and have shown that these can even be disambiguated under certain assumptions. However, various practical problems in extracting useful data from fossils are likely to hinder the unbiased reconstruction of these parameters.
Age–Size Relationship
The most obvious problem with the general and constant d models presented earlier is that they depend on age as an important parameter, but this cannot be directly observed in the fossil record: typically, it must be inferred from size. The relationship between size and age in organisms is an often complex one and cannot easily be established, especially in an extinct taxon. Various methods have been used to age living gastropods (e.g., opercular growth rings [Ilano et al. Reference Ilano, Ito, Fujinaga and Nakao2004; Miranda et al. Reference Miranda, Fujinaga and Nakao2008]; statolith variation or element variation in the shell [Richardson et al. Reference Richardson, Saurel, Barroso and Thain2005]; or stable isotope variation [e.g., Wefer and Berger Reference Wefer and Berger1991; Purton and Brasier Reference Purton and Brasier1997; reviewed in Ivany Reference Ivany2012]), but these are not always applicable to fossil examples. If there is a strong nonlinear relationship between size and age, then the size distribution of a fossil population will not be indicative of the age distribution, and even if death rates are constant, unusual fossil size distributions may thus result (Rigby Reference Rigby1958). Gastropods, like most organisms, show slowing rates of growth as they age, until eventually they will grow very little even as time marches on. Needless to say, if size cannot reliably be translated into age, then fossil data cannot be brought to bear on the inference problems we discuss, except in the simple case of small constant d, where ρ (but not R) can be inferred.
Preexisting Data Sets
Another issue that arises is that our model relies on measurements of the actual number of scars in individuals and their age (or at least size). Typically, however, data have been collected at a much lower resolution than this, for example consisting simply of what proportion of snails in a collection show signs of predation, or further dividing shells into simple size classes (see Alexander and Dietl [Reference Alexander, Dietl, Kelley, Kowalewski and Hansen2003] for a discussion of how such data can be collected, and Harper et al. [Reference Harper, Peck and Hendry2009] for a notable exception). While it would be possible to generate expressions for both of these data sets from our equations (with suitable definitions for small and large), this would further reduce the resolving power of our approach.
Another problem with preexisting data sets is that any sort of collection is likely to show collection bias if it has not been specifically bulk collected (Powell and Kowaleski [Reference Powell and Kowaleski2002]; or perhaps target sampled in the sense of Ottens et al. [Reference Ottens, Dietl, Kelley and Stanford2012]) to avoid such bias. Notable biases include preferential collection of larger, perfect (i.e., unscarred) or more interesting (i.e., more scarred) specimens. Measurements of both age and scar distributions would obviously be adversely affected by these biases.
Biostratinomic Processes
Fossil assemblages, even when collected in bulk or otherwise (Ottens et al. Reference Ottens, Dietl, Kelley and Stanford2012) to avoid collection bias, still show various types of preservation biases (Kidwell Reference Kidwell2002). These include (nonexhaustively): preferential preservation of larger, more robust individuals; hydrodynamic sorting through transport (Molinaro et al. Reference Molinaro, Collins, Burns, Stafford and Leighton2013; Chattopadhyay et al. Reference Chattopadhyay, Rathie and Das2013a,Reference Chattopadhyay, Rathie, Miller and Baumillerb) and nonuniform sampling of living populations (e.g., fossilization of organisms where young and adults live in different environments), with the general tendency being to remove smaller specimens from the record, as shown by Cooper et al. (Reference Cooper, Maxwell, Crampton, Beu, Jones and Marshall2006). Museum collections, suffering from both biostratinomic and collection bias, are likely to be particularly unrepresentative. This bias suggests that it may prove profitable to consider only the larger sizes in an assemblage when performing the inferences we demonstrate herein, and to condition our estimators on having excluded specimens below a certain size.
Another issue would be time averaging of assemblages (Kidwell et al. Reference Kidwell, Bosence, Allison and Briggs1991; Kidwell Reference Kidwell2002), but the effect of this will partly depend on whether or not the populations being recruited from were steady state or not (see below). If populations were steady state but noisy, however, time averaging might have the effect of making the parameter estimations from particular assemblages more representative of the overall predation pressure on the parent living ones (for a useful discussion of collection bias and averaging, see Cadée et al. [Reference Cadée, Walker and Flessa1997]).
Finally, the confounding effects of other organisms should not be neglected. For example, it seems that postmortem attack of shells by crabs is common, either because they mistakenly think the shells might be occupied or because the shells are occupied, for example, by hermit crabs (Walker and Yamada Reference Walker and Yamada1993). In addition, hermit crabs from the early Jurassic onward are likely to exert significant controls on shell-frequency distributions by preferentially concentrating shells of their preferred size (see e.g., Shimoyama Reference Shimoyama1985; Walker Reference Walker1989). Furthermore, as commented on earlier, many predators (especially the asteroids) do not leave clear traces of their attacks, successful or otherwise (Carter Reference Carter1968). The complex effects of multiple predators, either on the snails or each other, can unfortunately only be treated in aggregrate in our method.
Nonstationary Populations and Events
So far, we have considered living populations in a steady state, at least relative to the timescale of the fossil record: for a given assemblage, population size and structure and rates of predation remain steady. However, we know that populations are often highly unstable through time, including predictable predator–prey patterns of population oscillations (cf. Leighton Reference Leighton2002). The effect of these sorts of fluctuations on the fossil record will partly depend on the timescale of fossilization relative to them. For example, an obrutional deposit that provides a snapshot of the living and dead populations at a particular time will relate in a different way to an assemblage that slowly formed in a low sedimentation rate environment.
Empirical Studies
We wish finally to comment briefly on the empirical studies by various authors that have examined the numbers of scars in living gastropod populations in different environmental conditions (e.g., Cadée et al. Reference Cadée, Walker and Flessa1997; Schmidt Reference Schmidt1989; Molinaro et al. Reference Molinaro, Stafford, Collins, Barclay, Tyler and Leighton2014; Stafford et al. Reference Stafford, Tyler and Leighton2015). One notable feature of all these studies is the high degree of variation of scar frequency between different microhabitats; other features, such as potential evidence for size refuges (i.e., larger shells being less vulnerable to attack; Vermeij Reference Vermeij1982; Schmidt Reference Schmidt1989; Harper et al. Reference Harper, Peck and Hendry2009), are less consistently attested to. In any case, it should be noted that assessment of relative rates of scarring in different size classes is problematic without an explicit ASR model.
Nevertheless, a series of studies have shown that scar frequency, as measured by the proportion of snails with at least one scar, seems to track predator frequency, with the conclusion being drawn that, in general, scar frequency can be taken as a proxy of predation intensity (our R) and thus predation mortality (our Rρ): Stafford et al. (Reference Stafford, Tyler and Leighton2015); Molinaro et al. (Reference Molinaro, Stafford, Collins, Barclay, Tyler and Leighton2014); Cadée et al. (Reference Cadée, Walker and Flessa1997). For example, the data set of Molinaro et al. (Reference Molinaro, Stafford, Collins, Barclay, Tyler and Leighton2014) shows that more snails in calmer, sheltered environments tend to have at least one scar compared with those in more exposed environments, and the authors relate this to the greater densities of predators (in this case, crabs) in the former environment. If we make the assumption of both small and constant d, then these data seem to suggest that ρ is not the controlling variable, contrary to our model. However, it might be that in an environment with many predators, any particular attacker is more likely to be disturbed by a competitor or (indeed) its own predator. If we make the assumption that d(a) is constant but of unknown size, then the proportion of snails with at least one scar in a population is given by  $1-\displaystyle{{\lpar {R{\rm \rho} + d} \rpar } \over {R + d}}$ (from eq. 11). Our model shows that when only R is varying from site to site, one would indeed expect to see more scars in snails from sites with higher attack rates. However, the rate of scarring derived from this equation can vary with any of d, ρ, or R, suggesting that varying attack rates might not be the only possible explanation for these data. For example, if the snails living in a calmer environment had on average a lower rate of nonpredatory death compared with those in more exposed environments, then one expect them to accumulate more scars too. The weak inverse correlation that Molinaro et al. (Reference Molinaro, Stafford, Collins, Barclay, Tyler and Leighton2014) demonstrate between amount of scarring and body size would be consistent with this view. In general, then, our model provides a theoretical background against which to interpret summary field data and offers pathways toward understanding the meaning of the data more fully.
Discussion
Our model provides a theoretical approach to estimating rates of predation and predation success that goes considerably beyond previous theoretical treatments of the subject. Such a model is necessary for relating observations in the fossil record to inferred underlying processes such as predation. However, our model shows that in practice, predation and predation success rates cannot be fully disambiguated, except under specific assumptions of constant and low rates of nonpredatory death, which do however have some empirical support. Even in such circumstances, the vagaries of the fossilization and collection processes would make estimation of the parameters of interest unreliable without further assumptions. The model we have used and the obstacles we discuss clarify the sorts of data and their associated biases that would need to be considered to in fact draw reliable inferences about the evolution of predation through time from healed scars in gastropods.
Despite these somewhat pessimistic conclusions, our model points toward various lines of future research that may help improve prospects of predation rate estimation. These include: comparing fossil assemblages of living taxa with live populations (e.g., Shimoyama [Reference Shimoyama1985] or recently extinct taxa with their close living relatives; see Cooper et al. [Reference Cooper, Maxwell, Crampton, Beu, Jones and Marshall2006]); comparing different living or fossil assemblages where we have reason to believe that many factors have remained the same between them (e.g., two or more populations where predation success is thought to be the same; here changes in scar numbers would thus be indicative of changes in attack rate. For a detailed discussion of such standardization procedures see Dietl and Kosloski [Reference Dietl and Kosloski2013] and Kosloski et al. [Reference Kosloski, Dietl and Handley2017]); incorporation of absolute age estimates into size data (e.g., from stable isotope fluctuations [Purton and Brasier Reference Purton and Brasier1997]); bulk or targeted collection of specimens to eliminate collection bias and explicit modeling of population predatory–prey or other nonstationary models with respect to fossilization regimes. In other words, consideration of the long-standing problem of estimating predation rates through time illuminates many of the classical problems associated with inference of life processes from the fossil record in general.
Acknowledgments
We are grateful for discussions with J. S. Peel, A. Lindström, and J.-O. Ebbestad over the many years that what became known as the “blue snail problem” took to be formulated, and for very helpful reviews, including those by E. M. Harper and G. Dietl. This work was funded by the Swedish Research Council (Vetenskapsrådet, VR, grant no. 621-2011-4703 to G.E.B.).
Appendix
Derivation of Poisson Distribution for P(m|a)
From the main text, recall that the process of scar acquisition with age follows the following master equation:
 $${\displaystyle{{dP\lpar {m \vert a} \rpar } \over {da}} = R\lpar {1-{\rm \rho}} \rpar [ {P\lpar {m-1 \vert a} \rpar -P\lpar {m \vert a} {\rpar ].$$
Consider the following generating equation
 $$F\lpar z \rpar = \mathop \sum \limits_{m = -\infty} ^\infty z^mP\lpar {m \vert a} \rpar .$$
From this definition, we have the following identities:
 $$\displaystyle{{dF} \over {da}} = \mathop \sum \limits_{m = -\infty} ^\infty z^m\displaystyle{{dP\lpar {m \vert a} \rpar } \over {da}},$$
 $$zF = \mathop \sum \limits_{m = -\infty} ^\infty z^mP\lpar {m-1 \vert a} \rpar .$$
Combining these identities, we can rewrite equation (A.1) as:
 $$\displaystyle{{dF} \over {da}} = R\lpar {1-{\rm \rho}} \rpar \lpar {z-1} \rpar F,$$
with the elementary solution:
 $$F = {\rm exp}\lpar {R\lpar {1-{\rm \rho}} \rpar \lpar {z-1} \rpar a} \rpar .$$
To retrieve the probability distribution, we note that:
 $$P\lpar {m \vert a} \rpar = \displaystyle{{d^mF} \over {dz^m}} \vert _{z = 0} = \displaystyle{{{(R\lpar {1-{\rm \rho}} \rpar a)}^m{\rm exp}\lpar {-R\lpar {1-{\rm \rho}} \rpar a} \rpar } \over {m!}},$$
and hence P(m|a) is Poisson-distributed with mean R(1 − ρ)a.
Derivation of Maximum-Likelihood Estimates for Constant d, Unbiased Age Sample
Consider a data set of N fossil shells, where shell i has age a i and number of scars m i. For a model with a constant nonpredatory death rate, we have the following log-likelihood function for the model parameters R (attack rate), ρ (success probability), and d.
 $$\eqalign{& {\rm {\cal L}}\lpar {R,{\rm \rho}, d} \rpar = \mathop \sum \limits_{i = 1}^N (-\lpar {R + d} \rpar a_i + m_i{\rm log}\lpar {R\lpar {1-{\rm \rho}} \rpar a_i} \rpar \cr & \qquad\qquad\qquad\qquad\qquad\qquad + {\rm log}\lpar {R{\rm \rho} + d} \rpar -{\rm log}\lpar {m_i!} \rpar )}. $$
To derive the maximum-likelihood estimators for this model, we must maximize this log-likelihood. First, we take the derivatives of  ${\rm {\cal L}}$ with respect to R, ρ, and d:
 $$\displaystyle{{\partial {\rm {\cal L}}} \over {\partial R}} = \mathop \sum \limits_{i = 1}^N \left(-a_i + \displaystyle{{m_i} \over R} + \displaystyle{{\rm \rho} \over {R{\rm \rho} + d}}\right),$$
and
 $$\displaystyle{{\partial {\rm {\cal L}}} \over {\partial {\rm \rho}}} = \mathop \sum \limits_{i = 1}^N \left(-\displaystyle{{m_i} \over {1-{\rm \rho}}} + \displaystyle{R \over {R{\rm \rho} + d}}\right),$$
and
 $$\displaystyle{{\partial {\rm {\cal L}}} \over {\partial d}} = \mathop \sum \limits_{i = 1}^N \left(-a_i + \displaystyle{1 \over {R\rho + d}}\right). $$
To maximize the likelihood, these derivatives must be zero evaluated at the maximum-likelihood estimate values  $\hat{R},{\hat{\rm \rho}}, \hat{d}$. Therefore, from equation (A.11), we have:
 $$\matrix{ \hfill {} & \hfill {\mathop \sum \limits_{i = 1}^N \left( {-a_i + \displaystyle{1 \over {\hat{R}{\hat{\rm \rho}} + \hat{d}}}} \right) = 0} \cr \hfill \Rightarrow & \!\!\!\!\!\!\!\!\!\!\!\!\!\! {\hat{R}{\hat{\rm \rho}} + \hat{d} = \displaystyle{N \over {\mathop \sum \nolimits_{i = 1}^N a_i}}.} \cr} $$
From equation (A.9), and substituting the previous result, we have
 $$\matrix{ \hfill {} & \hfill {\mathop \sum \limits_{i = 1}^N \left( {-a_i + \displaystyle{{m_i} \over {\hat{R}}} + \displaystyle{{{\hat{\rm \rho}}} \over {\hat{R}{\hat{\rm \rho}} + \hat{d}}}} \right) = 0} \cr \hfill \Rightarrow & \!\!\!\!\!\!\!\!\!\!\!\!\!\!\!\!\!\!\!\!\! {\hat{R}\lpar {1-{\hat{\rm \rho}}} \rpar = \displaystyle{{\mathop \sum \nolimits_{i = 1}^N m_i} \over {\mathop \sum \nolimits_{i = 1}^N a_i}}.} \cr} $$
Derivation of Maximum-Likelihood Estimates and Standard Errors, for Negligible, Constant d, Unbiased Age Sample
Consider a data set of N fossil shells, where shell i has age a i and number of scars m i. For a model with a constant nonpredatory death rate, we have the following log-likelihood function for the model parameters R (attack rate), ρ (success probability).
 $${\rm {\cal L}}\lpar {R,{\rm \rho}} \rpar = \mathop \sum \limits_{i = 1}^N (-Ra_i + m_i{\rm log}\lpar {R\lpar {1-{\rm \rho}} \rpar a_i} \rpar + {\rm log}\lpar {R{\rm \rho}} \rpar -{\rm log}\lpar {m_i!} \rpar ).$$
As above, to derive the maximum-likelihood estimators for this model, we must maximize this log-likelihood. First, we take the derivatives of  ${\rm {\cal L}}$ with respect to R, ρ:
 $$\displaystyle{{\partial {\rm {\cal L}}} \over {\partial R}} = \mathop \sum \limits_{i = 1}^N \left(-a_i + \displaystyle{{m_i} \over R} + \displaystyle{1 \over R}\right)$$
and
 $$\displaystyle{{\partial {\rm {\cal L}}} \over {\partial {\rm \rho}}} = \mathop \sum \limits_{i = 1}^N \left(-\displaystyle{{m_i} \over {1-{\rm \rho}}} + \displaystyle{1 \over {\rm \rho}}\right). $$
To maximize the likelihood, these derivatives must be zero evaluated at the maximum-likelihood estimate values  $\hat{R},{\hat{\rm \rho}} $. From equation (A.11), we have
 $$\matrix{ \hfill {} & \hfill {\mathop \sum \limits_{i = 1}^N \left( {-a_i + \displaystyle{{m_i} \over {\hat{R}}} + \displaystyle{1 \over R}} \right) = 0} \cr \hfill \Rightarrow & \hfill {\hat{R} = \displaystyle{{\mathop \sum \nolimits_{i = 1}^N (m_i + 1)} \over {\mathop \sum \nolimits_{i = 1}^N a_i}},} \cr} $$
and from equation (A.16) we have:
 $$\matrix{ \hfill {} & \hfill {\mathop \sum \limits_{i = 1}^N \left( {-\displaystyle{{m_i} \over {1-{\hat{\rm \rho}}}} + \displaystyle{1 \over {{\hat{\rm \rho}}}}} \right) = 0} \cr \hfill \Rightarrow & \hfill {{\hat{\rm \rho}} = \displaystyle{N \over {\mathop \sum \nolimits_{i = 1}^N (m_i + 1)}}.} \cr} $$
To calculate standard errors for these estimators, we use Laplace's method, which supplies the approximation:
 $${\rm \Sigma} = \left[ {\matrix{ {{\rm \sigma}_R^2} & {{\rm \sigma}_{R{\rm \rho}}} \cr {{\rm \sigma}_{R{\rm \rho}}} & {{\rm \sigma}_{\rm \rho}^2} \cr}} \right]\simeq -H^{-1} = -\left[ {\matrix{ {\displaystyle{{\partial^2{\rm {\cal L}}} \over {\partial R^2}} \vert_{{ {\hat{R}} \atop {\hat{\rho}} }}} & {\displaystyle{{\partial^2{\rm {\cal L}}} \over {\partial R\partial {\rm \rho}}} \vert_{{ {\hat{R}} \atop {\hat{\rho}} }}} \cr {\displaystyle{{\partial^2{\rm {\cal L}}} \over {\partial \rho \partial R}} \vert_{{ {\hat{R}} \atop {\hat{\rho}} }}} & {\displaystyle{{\partial^2{\rm {\cal L}}} \over {\partial \rho^2}} \vert_{{ {\hat{R}} \atop {\hat{\rho}} }}} \cr}} \right]^{-1} $$
where Σ is the covariance matrix of standard errors. To apply this approximation, we require the second derivatives of the log-likelihood function:
 $$\displaystyle{{\partial ^2{\rm {\cal L}}} \over {\partial R^2}} = -\mathop \sum \limits_{i = 1}^N \displaystyle{{m_i + 1} \over {R^2}}, $$
and:
 $$\fleqalign{{\partial ^2{\rm {\cal L}}} \over {\partial \rho ^2}} & = \mathop \sum \limits_{i = 1}^N \left(-\displaystyle{{m_i} \over {{(1-\rho )}^2}}\right)-\displaystyle{N \over {\rho ^2}} \cr& = \displaystyle{{-\rho ^2\mathop \sum \nolimits_{i = 1}^N (m_i)-{(1-\rho )}^2N} \over {\rho ^2{(1-\rho )}^2}} \cr& = \displaystyle{{-\rho ^2\mathop \sum \nolimits_{i = 1}^N (m_i + 1) + 2N\rho -N} \over {\rho ^2{(1-\rho )}^2}} \cr& = \displaystyle{{N\lpar {-\rho^2/\hat{\rho} + 2\rho -1} \rpar } \over {\rho ^2{(1-\rho )}^2}},} $$
and:
 $$\displaystyle{{\partial ^2{\rm {\cal L}}} \over {\partial R\partial \rho}} = \displaystyle{{\partial ^2{\rm {\cal L}}} \over {\partial \rho \partial R}} = 0. $$
Therefore:
 $$\matrix{ \hfill {\sigma _R} \hfill { \, = - {\Bigg( {\displaystyle{{\partial^2{\rm {\cal L}}} \over {\partial R^2}} \vert_{ { {\hat{R}} \cr {\hskip-4pt\vskip7pt\hat{\rho}} \cr}}} \Bigg) }^{-1/2}} \cr {} \hfill \hskip-85pt { = \displaystyle{{\hat{R}} \over {\sqrt {\mathop \sum \nolimits_{i = 1}^N (m_i + 1)}}}\hskip7pt} \cr} $$
 $$\matrix{& \hfill {\sigma _\rho} \hfill \, { = -{\left( {\displaystyle{{\partial^2{\rm {\cal L}}} \over {\partial \rho^2}} \vert_{{ {\hat{R}} \cr {\hskip-4pt\vskip7pt\hat{\rho}} \cr}}} \right)}^{-1/2}} \cr \hfill {} & \hfill \hskip-85pt{ = \displaystyle{{\hat{\rho} \sqrt {\lpar {1-\hat{\rho}} \rpar }} \over {\sqrt N}}.\hskip24pt} \cr} $$
Derivation of Maximum-Likelihood Estimates for Biased Age Distribution
Consider again a data set of N fossil shells, where shell i has age a i and number of scars m i. Because the age distribution is biased, as a result of either biased collection or fossilization (non-constant d), we cannot use P(a) for inference, but instead are restricted to using the conditional distribution of scar numbers, P(m|a):
 $$P\lpar {m \vert a} \rpar = \displaystyle{{{\rm exp}\lpar {-R\lpar {1-\rho} \rpar a} \rpar {(R\lpar {1-\rho} \rpar a)}^m} \over {m!}}. $$
First, we state the log-likelihood for R and ρ:
 $${\rm {\cal L}}\lpar {R,{\rm \rho}} \rpar = \mathop \sum \limits_{i = 1}^N (m_i{\rm log}\lpar {R\lpar {1-{\rm \rho}} \rpar a_i} \rpar -R\lpar {1-{\rm \rho}} \rpar a_i-{\rm log}\lpar {m_i!} \rpar). $$
Because this likelihood has effectively only one parameter, Ω = R(1 − ρ), we will only be able to make estimates of this combined quantity, leaving a fundamental ambiguity between R and ρ. Redefining the log-likelihood in terms of Ω:
 $$\eqalign{{\rm {\cal L}}\lpar {\rm \Omega} \rpar = \mathop \sum \limits_{i = 1}^N (m_i{\rm log}\lpar {{\rm \Omega} a_i} \rpar -{\rm \Omega} a_i-{\rm log}\lpar {m_i!} \rpar ).$$
Now, taking the first derivative with respect to Ω and setting it to zero to identify the maximum-likelihood value:
 $$\matrix{\hfill {} \hfill {\displaystyle{{d{\rm {\cal L}}\lpar {\rm \Omega} \rpar } \over {d{\rm \Omega}}}\vert _{{\hat{\rm \Omega}}}} \hfill { = \mathop \sum \limits_{i = 1}^N \left( {\displaystyle{{m_i} \over {{\hat{\rm \Omega}}}} -a_i} \right) = 0} \cr \hfill \hskip-185pt \Rightarrow \quad\ {\hat{\rm \Omega}} = \displaystyle{{\mathop \sum \nolimits_{i = 1}^N m_i} \over {\mathop \sum \nolimits_{i = 1}^N a_i}}.} \cr} $$
To estimate the standard error, we take the second derivative of the log-likelihood and make a Laplace approximation:
 $$\hskip-35pt\eqalignb{\displaystyle{{d^2{\rm {\cal L}}\lpar {\rm \Omega} \rpar } \over {d{\rm \Omega} ^2}} \vert _{{\hat{\rm \Omega}}} = -\displaystyle{1 \over {{\rm \sigma} _{\rm \Omega} ^2}}\cr \hskip-35pt = - \displaystyle{1 \over {{{\hat{\rm \Omega}}} ^2}}\mathop \sum \limits_{i = 1}^N m_i \cr \hskip-75pt{\Rightarrow \hskip15pt\sigma _\Omega} = \displaystyle{{{\hat{\rm \Omega}}} \over {\sqrt {\mathop \sum \nolimits_{i = 1}^N m_i}}}.}}} $$