


I. INTRODUCTION
Nanocrystalline (NC) materials, which are single or multiphase polycrystals with grain size ranging from 1 to 100 nm, have received more and more attention over the past two decades, because of their outstanding physical and mechanical properties in comparison with conventional coarse-grain polycrystalline materials.Reference Meyers, Mishra and Benson1–Reference Liu, Zhou and Ling5 A good knowledge of NC materials might enable new materials with enhanced properties to be processed, such as ultrahigh yield and fracture strength, superior wear resistance, and enhanced super plastic formability.Reference Meyers, Mishra and Benson1 Among the possible amelioration, the increase of flow stress has been intensively studied. As such, these materials have become more and more important in designing lighter and stronger structures. However, it should be noted that the strength increases simultaneously with a decrease of tensile strain.Reference Koch6,Reference Wang, Wang, Pan, Lu, Hemker and Ma7 The limited ductility has been a major obstacle in the development and application of metals. While it was previously attributed to pre-existed flaws, such as impurities and porosities,Reference Weertman, Farkas, Hemker, Kung, Mayo, Mitra and Swygenhoven8 recent samples of high quality still showed a little ductility in tension tests.Reference Schwaiger, Moser, Dao, Chollacoop and Suresh9,Reference Cheng, Ma, Wang, Kecskes, Youssef, Koch, Trociewitz and Han10 Therefore, the ductility issue remains an important subject of present research.
It has been well established that the macroscopic properties of metallic materials are significantly grain size dependent. Strong grain size effects on the mechanical behaviors of metal material during nonuniform plastic deformation have been investigated by researchers from different countries in various kinds of experiments. For example, the experiment of thin copper (Cu) wires twistingReference Fleck, Muller, Ashby and Hutchinson11 revealed that the scaled shear increases with the decreasing wire diameter. Subsequently, the experiment of ultrathin beams bendingReference Stölken and Evans12 showed that bending hardening increases as the beam thickness decreases and data from simple tension displayed size-independent phenomena. Besides, the increasing experimental phenomena of size-dependence of NC material behavior at the micrometer or nanometer level have been observed in microindentation or nanoindentation tests.Reference Nix and Gao13,Reference Saha, Xue, Huang and Nix14 It is acceptedReference Smyshlyaev and Fleck15 that the grain size effects are due to the presence of spatial gradients of strain in each single grain. These gradients are associated with the plastic inhomogeneity of slip and are expected to be particularly significant near grain boundaries (GBs).Reference Ma, Zhou, Zhu and Li16
To study the effects of grain size on mechanical behaviors of NC materials, several theoretical and experimental investigations have been conducted. It is evident that grain size has a significant influence on mechanical behaviors of materials, in particular, on the yield stress and active deformation mechanism. In the case of coarse grained materials, the grain size effects on flow stress are well known and given by the empirical Hall–Petch relation, which suggests that the yield stress increases with decreasing grain size.Reference Hall17,Reference Petch18 The empirical law seems to fit a wide range of materials very well. Attempts have been made and models have been proposed to interpret this phenomenon.Reference Li19,Reference Ashby20 Among those, the most notable is the dislocation pile up model introduced by HallReference Hall17 and Petch.Reference Petch18 According to the Hall–Petch law, extremely high yield stress is expected to be obtained as the grain size decreases from the micrometer to nanometer scale. However, a negative slope of relationship between the yield stress and the inverse of the square root of the grain size was clearly found,Reference Fougere, Weertman, Siegel and Kim21 which was called as “the inverse Hall–Petch phenomenon”. This inverse Hall–Petch phenomenon was originally attributed to pores and defects produced by preparation processes in NC materials. With the progress of preparation techniques, high quality NC materials could be produced, which still exhibited the inverse phenomenon.Reference Schuh, Nieh and Yamasaki22 In recent years, numerous studies have indicated that such transitions resulted from internal characteristics rather than the sample defects. It was predicted through observed experimentReference Kumar, Suresh, Chisholm, Horton and Wang23 and molecular dynamics (MD) simulationReference Derlet and Van Swygenhoven24 that dislocation motion ceased to be active while the amorphous GB region and its large volume fraction started to play a dominant role below a critical grain size (∼10 nm), and the different strain condition between GB and grain interior (GI) regions became more important for the purpose of analyzing the influence of strain gradient on mechanical behaviors of NC materials. Many researchers suggested that the grain size effects affected the inherent properties mostly while some other physical mechanisms may be expected to attribute to the deformation behavior of NC materials which were different from those of their coarse grain partners.
In fact, contrary to coarse polycrystalline materials, the deformation mechanisms of NC materials are very complicated and remain a controversial issue. Still, the roles of deformation mechanisms, such as GB process, mechanical twinning, and dislocation glide have not been perfectly understood. In the past few years, MD simulations emphasize the role of dislocation activity as the dominant mechanism,Reference Yamakov, Wolf, Phillpot, Mukherjee and Gleiter25 in spite of GB related phenomena, such as GB sliding and diffusion. Even the same material may exhibit different deformation mechanisms with further deformation and increasing strain rate. This is because the mechanical behaviors of metal material with various strain rates are closely related to its microstructure evolution during deformation process. For example, Hung et al.Reference Hung, Sun, Yu, Kao and Chang26 investigated the phenomena of shear band evolution during the plastic deformation process, and pointed out that the deformation became nonuniform even at a strain rate of 10−4 s−1. With the increase of strain rate, the mechanical behaviors of NC materials change meanwhile. To date, the physical and mechanical properties and constitutive models of NC materials under quasistatic state have been discussed carefully. Schwaiger et al.Reference Schwaiger, Moser, Dao, Chollacoop and Suresh9 investigated the rate sensitivity of deformation in full density NC nickel (Ni) through performing systematic experiments using two different techniques: depth-sensing indentation and tensile testing, and they found that there exhibited strain rate-dependent plastic flow for NC Ni sample at different strain rates. Capolungo et al.Reference Capolungo, Jochum, Cherkaoui and Qu27 adopted a homogenization method to describe the grain size and strain rate effects on the stress–strain relation. Meanwhile they assumed that GB phase had an elastic perfect-plastic behavior while GI had an elastic viscoplastic behavior. Nevertheless, the mechanical behaviors and deformation mechanisms at high strain rates (101 s−1–104 s−1) still keep ambiguous for NC materials. Various empirical constitutive models for high strain rate deformation have been proposed in past decades. Follansbee and KocksReference Follansbee and Kocks28 investigated coarse grain materials, and they pointed out that the plastic deformation at very high strain rates was still controlled by the thermally activated dislocation mechanism, and the postulated transition mechanism of rate-controlled deformation from thermal activation control to dislocation drag control does not occur even at a strain rate of 104 s−1. Jia et al.Reference Jia, Ramesh and Ma29 studied the mechanical behaviors of consolidated iron with average grain size from tens of nanometers to tens of micrometers under uniaxial compression over a wide range of strain rates from 10−4 s−1 to 104 s−1, and developed physically based constitutive model to describe the rate-dependent behavior. Kim et al.Reference Kim, Estrin and Bush30 used a phase mixture model, in which a polycrystalline material was treated as a mixture of GB phase and GI phase, to simulate the strain rate-dependent deformation behavior of nanostructure materials. As a matter of fact, these investigations converge to the same conclusion that with the increasing strain rate, the growth rate of dislocation generation begins to accelerate, and in turn, leads to an increase of dislocation density, which induces an upturn of the flow stress. Based on the conclusions above, we can conclude that the dislocation density evolution, which indicates the structure evolution, must be considered in the constitutive model for describing the mechanical behaviors of NC materials at various strain rates.
Although many models based on different mechanisms have been proposed, the physical nature of dislocation generation at high strain rate remains unclear. In this study, we will investigate the evolution of dislocation density together with strain gradient, and incorporate it into Taylor-type hardening expression
 $${\tau _{\rm{p}}} = \alpha \mu b\sqrt \rho \quad ,$$
where τp, α, μ, b, and ρ are the plastic flow stress, empirical constant, shear modulus, Burgers vector, and total dislocation density of materials. The experimental observationReference Shu and Fleck31 and MD simulationReference Yamakov, Wolf, Phillpot and Gleiter32 have suggested that there exists a significant strain gradient near the GB region due to the mismatch between neighboring grains with different lattice orientation. This can be suggested by the fact that a large number of dislocations are accumulated along GB during plastic deformation. So the strain gradient nearby GB is involved in the proposed model to capture the influences of GB on plastic deformation. Inspired by this fact, the GB dislocation pile up zone (GBDPZ) was introduced in nanograin materials.Reference Zhu and Lu33 Here, we suppose that the entire strain gradients are located in GBDPZs. Previous theoretical frameworks mentioned aboveReference Shu and Fleck31,Reference Yamakov, Wolf, Phillpot and Gleiter32 have yet concluded the strain gradient, but they did not consider the different dislocation density between GI and GBDPZ and incorporated it with dislocation density evolution with various strain rates. Furthermore, strain gradient plays a significant role in strain strengthening.
So as to interpret the flow stress upturn phenomenon at high strain rates, sections II and III of the article will set forth how to develop the dislocation density evolution and strain gradient based constitutive model. Section IV will verify the model by comparing the simulated results with experimental data, and the prediction of the new constitutive model over a wide range of strain rates will also be provided. Further discussions will be presented for different stress–strain responses together with strain rate sensitivity and activation volume of NC materials. Finally, dislocation density evolution and strain hardening behavior were analyzed.
II. TWO-PHASE MIXTURE MODEL FOR NC MATERIALS
Generally speaking, the NC materials consist of an array of repeating unit cubic cells. A unit cubic cell is composed of two parts: GI phase and GB phase. In NC materials, the surface-to-volume ratio of the GB is so high that it is not suitable to ignore the influence of GB phase on the deformation behavior of NC materials. ZhouReference Zhou, Li, Zhu, Li and Zhang34 pointed out that the volume fraction of GB phase increases with decreasing grain size. Because of the extremely abundant defects and nonhomogeneous interatomic spacing of GB phase compared with the regular lattice in the GI phase, its significant volume fraction and the amorphous characteristic play a vital function on the mechanical response of NC materials, especially when the grain size decreases to a few nanometers. Usually, the GB region is considered as the source of dislocation nucleation and annihilation. As dislocations nucleate at the GB region of a nanosized grain, they sweep across the whole grain and are captured by the opposite GB along with the deformation process.
To better understand the mechanical behaviors of NC materials, a physical mixture model composed of the GI which is treated as ordered crystal phase and the plastically soft GBDPZ phase with respect to strain gradient will be developed. As shown in Fig. 1, a two-dimensional schematic of the phase mixture model for a NC material grain is presented. The grain solid is assumed as a three-dimensional mixture containing GI, GB, and GBDPZ. To make the analysis simplified, GBs are incorporated in the GBDPZs. This simplification is believed to have no major effect on the results for the material with a grain size larger than 20 nm, due to the thickness of GB which is so thin (∼1 nm).Reference Zhou, Zhu and Zhang35
Schematic phase mixture model of NC materials with dislocation activity under plastic deformation.

In the present study, we adapted d GBDPZ as the thickness of GBDPZ and d as the grain size, respectively. According to the descriptions above, the volume fraction of GI phase f GI and GBDPZ f GBDPZ in each microelement, from a point of view of geometry, can be written as follows:
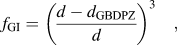 $${f_{{\rm{GI}}}} = {\left( {{{d - d_{{\rm{GBDPZ}}}}} \over d} \right)^3}\quad ,$$
 $${f_{{\rm{GBDPZ}}}} = 1 - {f_{{\rm{GI}}}}\quad .$$
The thickness of GBDPZs is found to be 7–10 lattice parameters away from the atomically sharp GB, and the lattice constant of 0.353 nm for Ni, it can be computed that the thickness of GBDPZ d GBDPZ is about 2.5–3.5 nm. Here, through making use of the average thickness of GBDPZ of 3 nm and keeping it constant during plastic deformation, the variation of the volume fraction of each phase with grain size is obtained, as shown in Fig. 2. It is clear that the fraction of GBDPZ increases significantly as the grain size decreases and GBDPZ has an important numerical equation when the grain is finer than 30 nm. Therefore, the presence of GBDPZ must have a non-negligible role during the deformation process.
Evolution of volume fraction of each part with grain size.
III. CONSTITUTIVE MODEL FOR STRAIN RATE-DEPENDENT DEFORMATION
The plastic deformation of NC materials with grain size larger than 15 nm can be regarded as the process of dislocation motion and accumulation under the rate-control deformation. When the grain size is less than 15 nm, dislocation activity will be replaced by GB related mechanisms, so the constitutive model developed later is confined to NC materials with average grain size larger than 15 nm. In the previous study,Reference Gao and Zhang36 plastic flow was mainly controlled by the motion of dislocations which were opposed by short-range and long-range obstacles. The former, mainly including forest dislocations, alloy elements, point defects, deposits, and impurities may be overcome by thermal activation, while the latter including far-field dislocation forests, GBs, and other microstructure elements with far-field influences are essentially athermal. GaoReference Gao, Huang, Nix and Hutchinson37 and his partners proposed a representative mechanism-based theory of strain gradient plasticity based on multiscale framework linking the statistically stored dislocations (SSDs) and geometrically necessary dislocations (GNDs). Then the general dislocation density was divided into the density of SSD ρS and GND ρG. The concept of GND was introduced to make clear plastic behaviors that internal accumulation of dislocation was acquired to accommodate the plastic strain gradient introduced by deformation. It is generally considered that the SSDs occur in homogeneous deformation and accumulated by random mutual trapping. The GNDs, compared with SSDs, ensure compatibility of deformation and accommodate plastic deformation strain gradients in the case of nonhomogeneous deformations. What is more, the density of GND is directly proportional to plastic strain gradient. Thus, for NC materials in the following description, GNDs and partial dislocations evolution will be consisted in GBDPZ, and GI is supposed to have the same properties with coarse grain-partner, whose yield strength follows the Hall–Petch law.
The strain rate  $\dot \varepsilon$ can be decomposed into two parts: elastic and plastic part,
 $$\dot \varepsilon = {\dot \varepsilon _{\rm{e}}} + {\dot \varepsilon _{\rm{p}}\quad .$$
The elastic strain rate  ${\dot \varepsilon _e}$ is obtained from the stress rate in the linear elastic relation as
 $${\dot \varepsilon _{\rm{e}}} = S:\dot \sigma \quad ,$$
where S is the elastic compliance tensor. The plastic strain rate  ${\dot \varepsilon _{\rm{p}}}$ is proportional to the deviatoric stress, given as
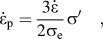 $${\dot \varepsilon _{\rm{p}}} = {{3\dot \varepsilon } \over {2{\sigma _{\rm{e}}}}}\sigma '\quad ,$$
here 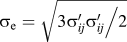 $\sigma _{\rm{e}} = \sqrt {{{3\sigma '_{ij} \sigma '_{ij} } /\mathord{\left {\vphantom {{3\sigma '_{ij} \sigma '_{ij} } 2}} \right. \kern-\nulldelimiterspace} 2}}$ is the von Mises equivalent stress,
 $\sigma '_{ij} = {{\sigma _{ij} - \sigma _{kk} \delta _{ij} } /\mathord{\left {\vphantom {{\sigma _{ij} - \sigma _{kk} \delta _{ij} } 3}} \right. \kern-\nulldelimiterspace} 3}$.
 $\dot \varepsilon$ is the equivalent plastic strain rate which is determined by
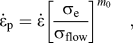 $${\dot \varepsilon _{\rm{p}}} = \dot \varepsilon {\left[ {{{{\sigma _{\rm{e}}}} \over {{\sigma _{{\rm{flow}}}}}}} \right]^{{m_0}}}\quad ,$$
in which 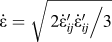 $\dot \varepsilon = \sqrt {{{\,2\dot \varepsilon '_{ij} \dot \varepsilon '_{ij} } /\mathord{\left {\vphantom {{2\dot \varepsilon '_{ij} \dot \varepsilon '_{ij} } 3}} \right. \kern-\nulldelimiterspace} 3}}$ is the equivalent strain rate,
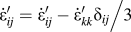 $\dot \varepsilon '_{ij} = {{\dot \varepsilon '_{ij} - \dot \varepsilon '_{kk} \delta _{ij} } /\mathord{\left {\vphantom {{\dot \varepsilon '_{ij} - \dot \varepsilon '_{kk} \delta _{ij} } 3}} \right. \kern-\nulldelimiterspace} 3}$; m 0 is the strain rate sensitivity exponent; and σflow is the flow stress. The bold font is used to designate tensors.
To examine the influence of strain gradient and dislocation density evolution on the stress–strain relationship with various strain rates for NC materials and make the analysis clear, Fig. 1 presents the representative plastic deformation of a typical texture model of NC materials under the action of a given applied resolved shear stress, composing of GI with a small uniform strain εGI and GBDPZ with a nonhomogeneous strain εGBDPZ. GI phase is usually accounted as to generating the uniform plastic deformation that is induced by SSDs, which generally establish in homogeneous deformation process and accumulated by random distributed multi trapping due to extremely ordered atomic structure together with the same oriented atom arrays. However, compared with the perfect lattice structure in GI phase, the GBDPZ region, with large interatomic spacing and distorted atomic structure, is realized to build nonhomogeneous plastic deformation behavior with respect to GNDs. The effects of GNDs on the overall deformation behaviors are to ensure compatibility and accommodate strain gradient under the condition of nonhomogeneous deformation as mentioned before and have not been covered by previous investigators. For simplification, we take the assumption that the idealized dislocation loops corresponding to GNDs are distributed around the GI. Because of the existence of mismatch between the different phases, the dislocation loops are required for strain compatibility. Both the dislocations within GI and those within GBDPZ have contributions to the overall dislocation density ρ and therefore to strain hardening through Taylor theory as described in Eq. (1).
As described above, both dislocations located within GI and GBDPZ contribute to total dislocation density in NC materials. So the total dislocation density can be represented as a sum of the density of SSD and GND by mixture way, which can be achieved by the following equation:
 $$\rho = {f_{{\rm{GI}}}}{\rho _{\rm{S}}} + {f_{{\rm{GBDPZ}}}}{\rho _{\rm{G}}}\quad ,$$
where f GI and f GBDPZ are the volume fraction of GI phase and GBDPZ phase, which can be obtained through Eqs. (2) and (3), respectively. Using Eq. (8), we can discuss distinctly that the dislocation density within GBDPZ will have an increasing role on the whole dislocation density with the decreasing grain size, contrary to that, the contribution of density within GI to the whole dislocation will be reduced. When the grain size stays constant, the dislocation density evolution within the GI and GBDPZ shows strain rate-dependent character. During the constant increasing strain history, dislocations emerge and annihilate, the details about dislocation density evolution will be described as follows.
A. Dislocation density evolution in GI
In this study, the main carrier of deformation in GI phase can be considered as dislocation glide. To describe the constitutive behavior of GI phase in NC materials, a dislocation density evolution related unified constitutive model is utilized to determine the change of the density of SSDs under the effects of strain rate. During the deformation processes that under the thumb of dislocation glide mechanism, the evolution of the density of SSDs is determined by two different dynamic processes: nucleation together with athermal storage of dislocations  $\left( {\rho _{\rm{S}}^ + } \right)$ and trapping together with annihilation of dislocations
 $\left( {\rho _{\rm{S}}^ - } \right)$. For a given overall strain εGI dominated by dislocation glide within GI, one can get
 $${\rho _{\rm{S}}}\left( {{\varepsilon _{{\rm{GI}}}}} \right) = \rho _{\rm{S}}^ + \left( {{\varepsilon _{{\rm{GI}}}}} \right) + \rho _{\rm{S}}^ - \left( {{\varepsilon _{{\rm{GI}}}}} \right)\quad .$$
Based on the statistical approach derived by Kocks and Mecking,Reference Kocks and Mecking38 Capolungo et al.Reference Capolungo, Jochum, Cherkaoui and Qu27 proposed a model accounting for the athermal storage. On the basis of those models, the relationship between  $\rho _{\rm{S}}^ +$ and εGI can be described by
 $${{{\rm{d}}\rho _{\rm{S}}^ + } \over {{\rm{d}}{\varepsilon _{{\rm{GI}}}}}} = {M \over b}\left( {{1 \over d} + \upsilon \sqrt {{\rho _{\rm{S}}}} } \right)\quad ,$$
where M and υ are the Taylor orientation factor and proportional factor, respectively; and the dynamic recovery process that is controlled by the annihilation of stored dislocations can be written as
 $${{{\rm{d}}\rho _{\rm{S}}^ - } \over {{\rm{d}}{\varepsilon _{{\rm{GI}}}}}} = - {C_2}{\left( {{{\dot \varepsilon } \over {{{\dot \varepsilon }_0}}}} \right)^{{{ - 1} \mathord{\left/ {\vphantom {{ - 1} q}} \right. \kern-\nulldelimiterspace} q}}}{\rho _{\rm{S}}}\quad ,$$
where C 2 is the constant,  ${\dot \varepsilon _0}$ is the reference strain rate, and q is inversely proportional to the temperature.
Combining Eqs. (10) and (11), the evolution of dislocation density within GI with the increase of εGI at different strain rates  ${\dot \varepsilon _{{\rm{GI}}}}$ can be obtained as follows:
 $${{{\rm{d}}{\rho _{\rm{S}}}} \over {{\rm{d}}{\varepsilon _{{\rm{GI}}}}}} = {{{\rm{d}}\rho _{\rm{S}}^ + } \over {{\rm{d}}{\varepsilon _{{\rm{GI}}}}}} + {{{\rm{d}}\rho _{\rm{S}}^ - } \over {{\rm{d}}{\varepsilon _{{\rm{GI}}}}}} = \; {M \over b}\left( {{1 \over d} + \upsilon \sqrt {{\rho _{\rm{S}}}} } \right) - {C_2}{\left( {{{\dot \varepsilon } \over {{{\dot \varepsilon }_0}}}} \right)^{{{ - 1} \mathord{\left/ {\vphantom {{ - 1} q}} \right. \kern-\nulldelimiterspace} q}}}{\rho _{\rm{S}}}\quad .$$
It is obvious that grain size has contribution to dislocation storage and therefore strengthening of materials from Eq. (12). It is worth noting that the grain size strengthening effect enters not directly through stress, as in the classical Hall–Petch law, but rather through strain hardening rate, which is proportional to the rate of dislocation density evolution.
B. Dislocation density evolution in GBDPZ
As shown in Fig. 1, the idealized GNDs motion through the GBDPZ around GI and induce a shear strain εGBDPZ. Due to the influence of flow stress together with the different atom arrangement within GBDPZ, it is valuable to denote that the plastic strain of GBDPZ around the surface of GI εGBDPZ is consistent with that of GI εGI, and then gradually increases as the individual slip step moves away from the GI surface. The geometrical mean strain gradient relevant to GNDs within GBDPZ can be denoted by
 $$\eta = {{{\varepsilon _{{\rm{GNDs}}}}} \over {{d_{{\rm{GBDPZ}}}}}}\quad ,$$
here d GBDPZ denotes the thickness of GBDPZ and εGNDs is the plastic strain generated by the dislocations within GBDPZ, according to the geometrical deformation presented in Fig. 1, which can be expressed approximately by the following formula:
 $${\varepsilon _{{\rm{GNDs}}}} = {\varepsilon _{{\rm{GBDPZ}}}} - {\varepsilon _{{\rm{GI}}}} = {{\phi {n_{{\rm{GB}}}}b} \over d}\quad ,$$
where n GB is the number of GNDs around GB in a single grain and  $\phi$ is the geometrical factor. For the sake of simplicity, the average length of the dislocation loop λGBDPZ in the GBDPZ can be assumed as
 $${\lambda _{{\rm{GBDPZ}}}} = \pi \left( {d - {d_{{\rm{GBDPZ}}}}} \right)\quad .$$
The deformed volume of dislocation evolution in a unit grain cell is defined as follows:
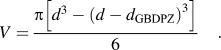 $$V = {{\pi \left[ {{d^3} - {{\left( {d - {d_{{\rm{GBDPZ}}}}} \right)}^3}} \right]} \over 6}\quad .$$
Sequentially, the density of dislocation within the GBDPZ can be obtained by
 $${\rho _{\rm{G}}} = {{{n_{{\rm{GB}}}}{\lambda _{{\rm{GBDPZ}}}}} \over V} = {6 \over {\phi b}}{{d(d - {d_{{\rm{GBDPZ}}}})} \over {{d^3} - {{(d - {d_{{\rm{GBDPZ}}}})}^3}}}\left( {{\varepsilon _{{\rm{GBDPZ}}}} - {\varepsilon _{{\rm{GI}}}}} \right)\quad .$$
We define a structure constant k G related to the grain size and the thickness of GBDPZ as
 $${k_{\rm{G}}} = {{6d\left( {d - {d_{{\rm{GBDPZ}}}}} \right){d_{{\rm{GBDPZ}}}}} \over {\phi \left[ {{d^3} - {{(d - {d_{{\rm{GBDPZ}}}})}^3}} \right]}}\quad .$$
It is obvious that for conventional coarse crystalline materials, k G ≈ 0, which indicates that the density evolution of GNDs can be negligible. Combining Eqs. (13)–(18) leads to the following new form
 $${\rho _{\rm{G}}} = {k_{\rm{G}}}{\eta \over b}\quad .$$
Using the relationship σp = Mτp, and substituting Eqs. (8), (12), and (18) into Eq. (1), we obtain the plastic flow stress–strain relation based on strain gradient at different strain rates,
 $${\sigma _{\rm{p}}} = M\alpha \mu b\sqrt {{f_{{\rm{GI}}}}{\rho _{\rm{S}}} + {f_{{\rm{GBDPZ}}}}{\rho _{\rm{G}}}} \quad .$$
C. Back stress
In general, the GBs act as perfectly opaque barriers, and once the dislocations reach the GBs and form a pile up, a back stress will develop. This back stress of pile ups hinders the movement of similar dislocations. The total back stress stemmed from dislocations accumulated along the GB can be expressed as
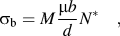 $${\sigma _{\rm{b}}} = M{{\mu b} \over d}{N^*}\quad ,$$
where N* is the number of dislocations stopped at the GBs of NC materials, which is based on the plastic strain following the evolution law below:
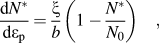 $${{{\rm{d}}{N^*}} \over {{\rm{d}}{\varepsilon _{\rm{p}}}}} = {\xi \over b}\left( {1 - {{{N^*}} \over {{N_0}}}} \right)\quad ,$$
where εp is the plastic strain, ξ and N 0 are the mean distance between slip bands and the maximum number of dislocation loops at the GB, respectively.
Based on the descriptions above, the strengthening effect prompted by dislocations based on strain gradient at various strain rates can be written as
 $${\sigma _{{\rm{flow}}}} = {\sigma _0} + M\alpha \mu b\sqrt {{f_{{\rm{GI}}}}{\rho _{\rm{S}}} + {f_{{\rm{GBDPZ}}}}{\rho _{\rm{G}}}} + {\sigma _{\rm{b}}}\quad ,$$
where σ0 is the lattice friction. There are two categories of the work hardening provided in Eq. (23): isotropic strain hardening and kinematic strain hardening. The first comes from the SSDs in the GI. The second originates from the dislocation accumulation at the GBs.
IV. RESULTS AND DISCUSSION
A. Comparisons between experimental and calculated data
To verify the mechanical model developed in this study, numerical simulations based on the established method are applied to predict the stress-strain relationships of tensile behavior for different strain rates of full density NC materials. Firstly, we choose the experimental results of commercial NC electroplated Ni prepared by Schwaiger et al.,Reference Schwaiger, Moser, Dao, Chollacoop and Suresh9 in which mechanical tests of the Ni samples with average grain size of 40 nm under three strain rates of 3 × 10⁻⁴, 1.8 × 10⁻², and 3 × 10⁻¹ were carried out at ambient temperature. The stress–strain relations for NC Ni were calculated under the same conditions of the experiment described above. Figure 3 gives the compared results of the numerical simulated true stress–strain relations with the corresponding experimental data of NC Ni. The material parameters used for numerical calculations for NC Ni and Cu are shown in Table I.
Comparison of the calculated true stress–strain curves with the corresponding experimental dataReference Schwaiger, Moser, Dao, Chollacoop and Suresh9 under uniaxial tensile loading at different strain rates for NC Ni with average grain size of 40 nm.
Material parameters used during numerical calculations for NC Ni and Cu.
From Fig. 3, it can be found that both the strain rate effects and the stress–strain curves show good agreement with that of the experimental results under uniaxial tensile. From the calculated results, both the calculated Young’s modulus and flow stress increase with increasing strain rate similar to the strain rate dependence seen in the experimental data, which suggest that the stress–strain curves exhibit rate-dependent strength. The compared results indicate that in the mechanical modeling proposed, dislocation glide mechanism and GB dislocation pile up can be taken as the main carriers of plastic deformation, and plastic flow is necessary to accompany glide to accommodate the grains. However, compared with experimental data, the calculated results show that strain hardening is obvious during the plastic deformation. This is mainly due to the obstruction of dislocation motion as observed by Wu et al.Reference Wu, Zhu, Wei and Wei39 At this point, some differences can be seen between the calculated strain hardening behavior and the corresponding experimental data, and the differences increase gradually with the increase of strain. In conventional coarse-grained materials, strain hardening is believed to originate from dislocation pile ups and tangles formed during plastic deformation. However, strain hardening of NC Ni is limited to the initial stage, and then stress levels off to a nearly perfectly plastic deformation, this may be due to that in NC materials both the cell structure and dislocation pile up do not have the same way as known for coarse grain materials. Other mechanisms that have not been considered in our constitutive model are the shear band mechanismReference Dalla Torre, Van Swygenhoven and Victoria40 and/or dislocation penetration through GB mechanism as proposed in our previous study.Reference Wang, Zhou, Zhang, Liu and Dong41 These mechanisms may also play a role during the above tensile experiments, special attention should be paid to incorporate the shear band and dislocation penetration through GB mechanism into future investigations to get a more comprehensive description of the deformation behavior of NC materials at different strain rates.
For the purpose of verifying the accuracy of the constitutive model proposed in this study, the developed method in Ref. Reference Zhu, Zhang, Li and Zhou42 is also applied to predict the higher strain rate deformation behavior of full density NC Ni with average grain size of 50.6 nm and tensile behaviors of full density in situ consolidated NC Cu with various grain size at a strain rate of 10−4 s−1 reported by Cheng et al.Reference Cheng, Ma, Wang, Kecskes, Youssef, Koch, Trociewitz and Han10 The compared results of calculated data with experimental data are presented in Figs. 4 and 5, respectively. In Fig. 4, the tendency of numerical simulations fits well with that of experimental curves although a special phenomenon of vibration occurred at the early stage of plastic deformation under high strain rates, which is due to dispersion effect of dynamic impact during experiment, and the rate-dependent behaviors are obvious within the calculated data together with experimental curves. Amazing is that in the experiment performed in Ref. Reference Zhu, Zhang, Li and Zhou42, the NC Ni sample exhibited a light work hardening behavior at high strain rates, which suggested that at high strain rate loading dislocations had not enough time to annihilate due to the rapid deformation time and brought about a few pile ups. The theoretical model results are consistent with the experimental data as the deformation goes on, more and more dislocations accumulate at the GBs and give rise to strain hardening. From Figs. 3 and 4, it can be seen that the mechanical model proposed in our study is more suitable at higher strain rate, as dislocation mechanisms are dominant under the circumstance and dislocation glide and pile up behavior are the main carriers of plastic deformation of NC materials. As shown in Fig. 5, the calculated curves fit well with the experimental data for NC Cu with various grain sizes of 54 and 62 nm at a strain rate of 10−4 s−1. What can be concluded from Fig. 5 is that there exists a strong grain size dependent mechanical property for the ball milling NC Cu, when the grain size is reduced, an increasing flow stress is obtained and a more obvious strain hardening behavior emerged. It should be noted that the effects of grain size on the whole deformation behavior work not only as the classical Hall–Petch law, but also through the strain hardening rate and the volume fraction of GI phase and GBDPZ phase. Through the description above, we firmly believe that the constitutive model proposed based on dislocation density evolution and strain gradient method is the appropriate method to apply to investigate deformation mechanisms and mechanical properties of NC materials especially at higher strain rates. To make the analysis more exact, we restrict the high strain rates in the article no more than 104 s−1, as strain rates exceed 104 s−1 new deformation mechanisms like drag or relative effects may appear, which will lead the constitutive developed model invalid.
Comparison of the calculated true stress–strain curves with the corresponding experimental dataReference Zhu, Zhang, Li and Zhou42 under uniaxial tensile loading at different strain rates for NC Ni with average grain size of 50.6 nm.
Comparison of the calculated true stress–strain curves with the corresponding experimental dataReference Cheng, Ma, Wang, Kecskes, Youssef, Koch, Trociewitz and Han10 under uniaxial tensile loading of different grain sizes for NC Cu at a strain rate of 10−4 s−1.
Figure 6 gives the prediction of simulated flow stress (at a fixed strain of 2.5%) versus strain rate range of 10−5 to 10−1 s−1 under different grain sizes (60, 120, 180, 240, and 300 nm) of NC Cu in a semi-log format. The calculated results indicate that at constant grain size, flow stress increases with increasing strain rate, which suggests that more dislocations nucleate and accommodate in the vicinity of GBs and do not have enough time to annihilate at higher strain rates, thus bring the hardening effect for NC materials. In addition, the numerical simulation curves in Fig. 6 show remarkable grain size related behaviors, which are in agreement with that presented in Fig. 5. The strengthening effect is still valid even at grain sizes as large as hundreds of nanometers, indicating that the constitutive model proposed is effective with a wide range of grain size.
The calculated strain rate and grain size-dependent flow stress of Cu in a semi-log format.
B. Strain rate sensitivity and activation volume
Another interesting issue is the prediction of strain rate sensitivity m and activation volume V of NC materials through the proposed model, the enhanced strain rate sensitivity has been widely recorded in NC materials when compared with their coarse grain counterparts. Generally speaking, m of NC Ni is currently in the range of 0.01–0.03 at ambient temperature, which is about ten times as high as that of coarse grained Ni (0.001–0.004).Reference Gu, Lian, Jiang and Zheng43 However, the deformation mechanisms underlying the abnormal strain rate sensitivity of NC materials have not been fully understood at present. It is still unclear whether it relates to the participation of GBDPZ deformation due to the increase of GBDPZ fraction as grain size reduced to nanoscale. However, it seems to be more or less credible that for NC Ni with grain sizes larger than 20–30 nm, the deformation is dominated by dislocation motion supported by many research studies.Reference Kumar, Suresh, Chisholm, Horton and Wang23,Reference Yamakov, Wolf, Phillpot, Mukherjee and Gleiter25,Reference Shu and Fleck31,Reference Yamakov, Wolf, Phillpot and Gleiter32 That is, the dislocations are emitted from GB sources and then traverse the tiny grain until they accumulate on the opposing GBs under applied stress. A relationship between strain rate sensitivity and activation volume has been proposed by Gu et al.,Reference Gu, Lian, Jiang and Zheng43 based on the dislocation nucleation or bow-out model for NC Ni.
For the dislocation motion-based deformation behaviors, the activation volume is related to the length L of the dislocation segment:
 $$V = L{b^2}\quad ,$$
where L is the length of dislocation line. Generally recognizing is that the refinement of grain size to nanometer scale leads to evident reduction of dislocation line length and thereby small activation volume, which consequentially results in an increase of strain rate sensitivity of flow stress. In addition, the experimental activation can be measured by
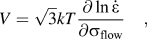 $$V = \sqrt 3 kT{{\partial \ln \dot \varepsilon } \over {\partial {\sigma _{{\rm{flow}}}}}}\quad ,$$
where k and T are the Boltzmann constant and absolute temperature, respectively. And the reciprocal of activation volume may represent physical strain rate sensitivity. The experimental strain rate sensitivity can be generally written as
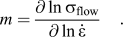 $$m = {{\partial \ln {\sigma _{{\rm{flow}}}}} \over {\partial \ln \dot \varepsilon }}\quad .$$
Figure 7 gives the numerical simulation logarithmic plots of flow stress as a function of strain rate (3 × 10⁻⁴, 3 × 10⁻³, 1.8 × 10⁻², 3 × 10⁻¹, 3 × 101 s−1) for the 40 nm NC Ni through the constitutive model proposed. The value of m is estimated to be about 0.18 from the slope of linear fit, and as shown in Fig. 8, the activation volume V is estimated to be about 15b 3 from the slope of linear fit in the plots of  $\ln \dot \varepsilon$ versus flow stress using Eq. (25). The results are in good agreement with the relation equation between m and V that was established in Ref. Reference Gu, Lian, Jiang and Zheng43 as
 $$m = {{\sqrt 3 kT} \over {0.36{\rm{G}}{b^3}}}{\left[ {\ln \left( {{V \over {{b^3}}}} \right) - 1.65} \right]^{ - 1}}\quad .$$
Logarithmic plots of flow stress as a function of strain rate for NC Ni, m was estimated from the slope of the linear fit.
Plots of  $\ln \dot \varepsilon$ versus flow stress for NC Ni, V was estimated from the slope of the linear fit using Eq. (25).
The enhanced strain rate sensitivity for NC Ni is a result of dislocation length of about 10–100b, and has no direct relation to the GB related deformation. It is anticipated that for NC materials with grain sizes smaller than 15 nm or with dominant high angle GBs, the deformation based on GB motion would give rise to a much higher m and even smaller V.Reference Wang and Ma44
C. Strain hardening description
In general, because two or more nonhomogeneous phases do not deform equally, the strain hardening of alloys is much faster than that of single crystals. With the decrease of grain size, the inherent anisotropy of crystal lattice is expected to become increasingly significant, especially for NC materials with two phases that possess different physical properties: the ordered GI and plastically soft GBDPZ phase. Strain hardening is mainly associated with pile up of dislocations in the vicinity of GB regions. In this section we consider that the SSDs with respect to compatibility of deformation behavior between GI and GBDPZ contribute directly to the work hardening. Due to the continuous appearance of dislocations in GBDPZ, there exists a work hardening layer surrounding GI. Compared with strain gradient method introduced in the above sections, gradient free models only take into consideration of the stored dislocations that distribute uniformly throughout the grains without considering the influence of GNDs connected with strain gradient. For the objective of describing strain hardening behavior using the proposed model, a proportionality factor p is introduced, which can be written as
 $$p = {{M\alpha \mu b\sqrt {{f_{{\rm{GI}}}}{\rho _{\rm{S}}}} } \over {M\alpha \mu b\sqrt {{f_{{\rm{GI}}}}{\rho _{\rm{S}}} + {f_{{\rm{GBDPZ}}}}{\rho _{\rm{G}}}} }} = \sqrt {{{{f_{{\rm{GI}}}}{\rho _{\rm{S}}}} \over {{f_{{\rm{GI}}}}{\rho _{\rm{S}}} + {f_{{\rm{GBDPZ}}}}{\rho _{\rm{G}}}}}} \quad .$$
Because strain hardening behavior is directly related to dislocation motion, dislocation density evolution is necessary to be explicitly shown to better account for the hardening phenomenon. In Figs. 9 and 10, calculated total dislocation density evolution and dislocation evolution in GI are presented with different strain rates for 40 nm NC Ni. It can be seen that the dislocation density increased gradually and tends to saturate eventually, this is in agreement with the results described in the above sections.
Total dislocation density evolution with true strain at three different strain rates for NC Ni with grain size of 40 nm.
Dislocation density evolution in GI with true strain at three different strain rates for NC Ni with grain size of 40 nm.
To show the effect of strain hardening quantitatively, the variation of proportionality factor p versus true strain at different strain rates of 40 nm NC Ni is shown in Fig. 11. It is obvious that along with the deformation process, more and more dislocations nucleate in GI phase and eventually give rise to the value of p. With more and more dislocations generating in the GI, it is possible that more and more dislocations tangle in GI and accumulate in GBDPZ, and eventually give rise to strain hardening. A smaller p is obtained with a higher strain rate, which indicates that more dislocations exist within GBDPZ at higher strain rate.
Variation of proportionality factor p with true strain at three different strain rates for NC Ni.
V. CONCLUSION
A two-phase mixture model composed of the regular crystal GI phase and plastically softer GBDPZ phase with regard to strain gradient has been used to simulate the deformation behavior of strain rate and grain size effect for NC materials. In the model proposed, the total dislocations were divided into two parts: SSDs within GI and GNDs within GBDPZ associated with strain gradient during plastic deformation. Furthermore, a constitutive equation for strain gradient plasticity based on dislocation density evolution by means of Taylor hardening expression was then developed. The calculated stress strain curves at different strain rates show good agreement with that of experimental data under tensile deformation for NC Ni and different grain sizes for NC Cu. The comparison results indicate that NC materials presented intense strain rate dependent mechanical properties that an increasing flow stress was obtained with the increase of strain rate. Contrary to the experimental curves of Ref. Reference Schwaiger, Moser, Dao, Chollacoop and Suresh9, the numerical simulation data showed that strain hardening was obvious during plastic deformation because of dislocation motion and accumulation surrounding GBs. The possible reason for strain softening exhibited in some experiments may be shear band and dislocation permeation of GB and more attention should be paid to investigate the intrinsic mechanism behavior under the special phenomenon.
The strain rate sensitivity m and activation volume V of NC Ni were also predicted and the result fitted well with Eq. (27), the decreased activation volume and increased strain rate sensitivity compared with its coarse grain counterpart were believed to derive from evident reduction of dislocation line length as the grain size reduced to nanoscale.
ACKNOWLEDGMENTS
This work was supported by the Key Project of Chinese Ministry of Education (211061), the National Natural Science Foundation of China (10502025, 10872087, 11272143), and the Program for Chinese New Century Excellent Talents in university (NCET-12-0712).



