INTRODUCTION
Leishmaniases are a serious public health problem caused by Leishmania protozoan parasites and transmitted by sandfly bites. About 14 million people are infected world-wide, with an incidence of 2·357 million new cases per year (WHO, 2002). Parasites of the Leishmania subgenus (Viannia) cause the majority of cutaneous and mucocutaneous leishmaniases cases in South America. More information is needed on the population biology of these pathogens for diagnostic and epidemiological inquiries and for drug and vaccine elaboration (Wolday et al. Reference Wolday, Berhe, Akuffo, Desjeux and Britton2001). In this respect, the use of molecular markers can prove very useful (De Meeûs et al. Reference De Meeûs, McCoy, Prugnolle, Chevillon, Durand, Hurtrez-Boussès and Renaud2007a). For the present study, we tested the usefulness of 12 microsatellite loci published for Leishmania braziliensis (Rougeron et al. Reference Rougeron, Waleckx, Hide, De Meeus, Arevalo, Llanos-Cuentas and Banuls2008) for studying the Leishmania guyanensis complex. In the light of the results obtained, we discuss future possible applications of these markers for the study of this complex.
MATERIALS AND METHODS
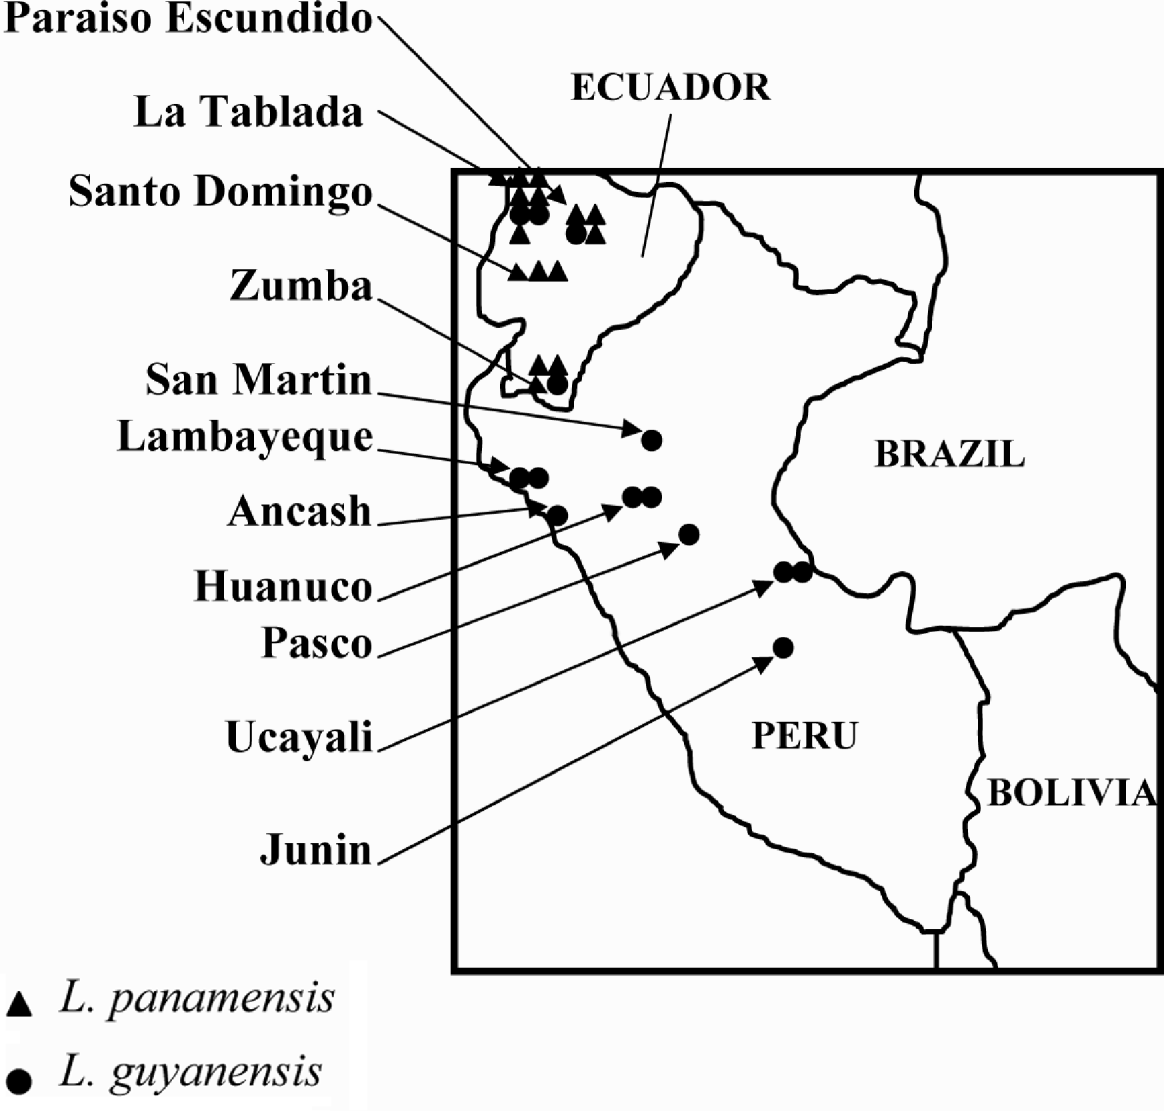
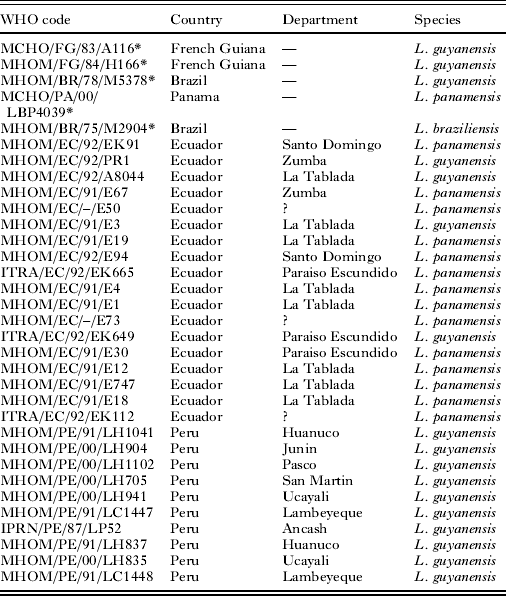
Ten strains from Peru and 18 strains from Ecuador were previously characterized as belonging to the L. guyanensis complex and especially either to L. panamensis or L. guyanensis species using isoenzymes (Bañuls et al. unpublished data; Bañuls et al. Reference Bañuls, Jonquieres, Guerrini, Le Pont, Barrera, Espinel, Guderian, Echeverria and Tibayrenc1999). The Peruvian sample was composed of 10 L. guyanensis and the Ecuadorian sample of 4 L. guyanensis and 14 L. panamensis strains (Table 1, Fig. 1). We also added 5 reference stocks: MHOM/BR/75/M2904 (L. braziliensis from Brazil), MHOM/BR/78/M5378 (L. guyanensis from Brazil), MHOM/FG/84/H166 (L. guyanensis from French Guiana), MHOM/FG/83/CAYA116 (L. guyanensis from French Guiana) and MCHO/PA/00/M4039 (L. panamensis from Panama) in order to validate the technique for the two species. For all the isolates, genomic DNA was extracted from parasite mass cultures (promastigotes) with the DNeasy Blood and Tissue Kit (Qiagen, Venlo, The Netherlands) and eluted in 50 μl.
Localization of each strain in Peru and Ecuador.

Data set of the 33 Leishmania strains studied indicating the World Health Organization code, the country and the department of collection and the species characterized using isoenzymes for each strain

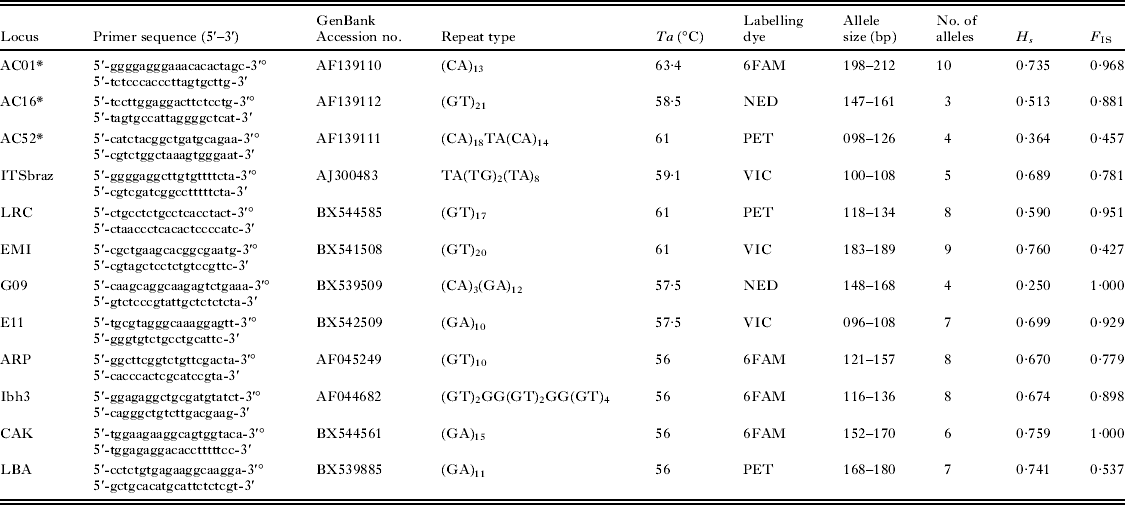
Microsatellites were either taken from the publications by Russell et al. (Reference Russell, Iribar, Lambson, Brewster, Blackwell, Dye and Ajioka1999) or Rougeron et al. (Reference Rougeron, Waleckx, Hide, De Meeus, Arevalo, Llanos-Cuentas and Banuls2008). The 33 strains under study were amplified according to the following conditions. Every 30 μl reaction mix was composed of 1·2 μl of each primer (10 μ m), the forward being labelled, 100 ng template DNA, 0·9 μl of dNTP mix (5 mm), 3 μl of buffer 10X and 0·3 μl of Taq Polymerase (Roche Diagnostics, 5UI/μl). Amplification was carried out in a thermal cycler using the following reaction conditions: 35 cycles of 94°C for 30 s, annealing temperature of each locus (see Table 2) for 1 min, 72°C for 1 min and a final extension step of 72°C for 7 min. Reaction products were visualized on 1·5% agarose gel stained with EnVISION™ DNA Dye as loading buffer (Ambresco). Genotyping in the automated sequencer (ABI PRISM 310 Genetic Analyser, Applied Biosystems, Foster City, CA, USA) was undertaken with 1 μl each of the PCR-amplified DNA sample added into a standard loading mix: 0·5 μl of an internal standard-size Genescan 500LIZ (Applied Biosystems) and 13·5 μl of formamide (HiDi) (Applied Biosystems). Fragment size was determined using ABI PRISM Genescan Analysis 3.7 and Genotyper 3.7 (both from Applied Biosystems). Several trials showed that multiplex was possible, for PCR products characterized by different sizes (no overlapping zones) or labelled with different fluorochromes.
Description of the 12 microsatellite loci of Leishmania (V.) guyanensis complex name; primer sequences; GenBank Accession number to reference clone; structure of repeat array; thermocycling conditions (annealing temperature), Ta; labelling dye noted ‘°’; allele size (bp); genetic variation (alleles number), Na; average estimate within-sample gene diversity computed by FSTAT as H s=[ñ/(1−ñ)]·[1− Σp2ik−Ho/2ñ] where ñ is harmonic mean of sample sizes, and deviation from panmixia measured as F IS.

Some technical problems can be met, such as existence of null alleles (Paetkau and Strobeck, Reference Paetkau and Strobeck1995). Thus, null allele frequencies were computed using the software Micro-Checker (Van Oosterhout et al. Reference Van Oosterhout, Hutchinson, Wills and Shipley2004). We used both Van Oosterhout's and Brookfield's methods (Brookfield, Reference Brookfield1996). This was used to compute the total number of expected blanks in the whole data set and this value was compared to the observed one (0) with an exact unilateral (H 1: there are less blanks than expected) binomial test under the software R (R-Development-core-team, Reference Rougeron, Waleckx, Hide, De Meeus, Arevalo, Llanos-Cuentas and Banuls2008).
For the population genetic study, data were analysed with the software Fstat Version 2.9.3.2 (Goudet, 2002) updated from Goudet (Reference Goudet1995), which computes, estimates and tests the significance of various population genetic parameters. These parameters are H s, Nei's unbiased estimator of genetic diversity, Weir and Cockerham's (1984) unbiased estimator of Wright's F-statistics (Wright, 1965) F IS, which measures deviation from Hardy-Weinberg genotypic frequencies within subsamples, and F ST, which measures differentiation between subsamples. The last was also estimated with its standardized version corrected for polymorphism (F ST′=F ST/(1−H s) (e.g. De Meeûs et al. 2007a).
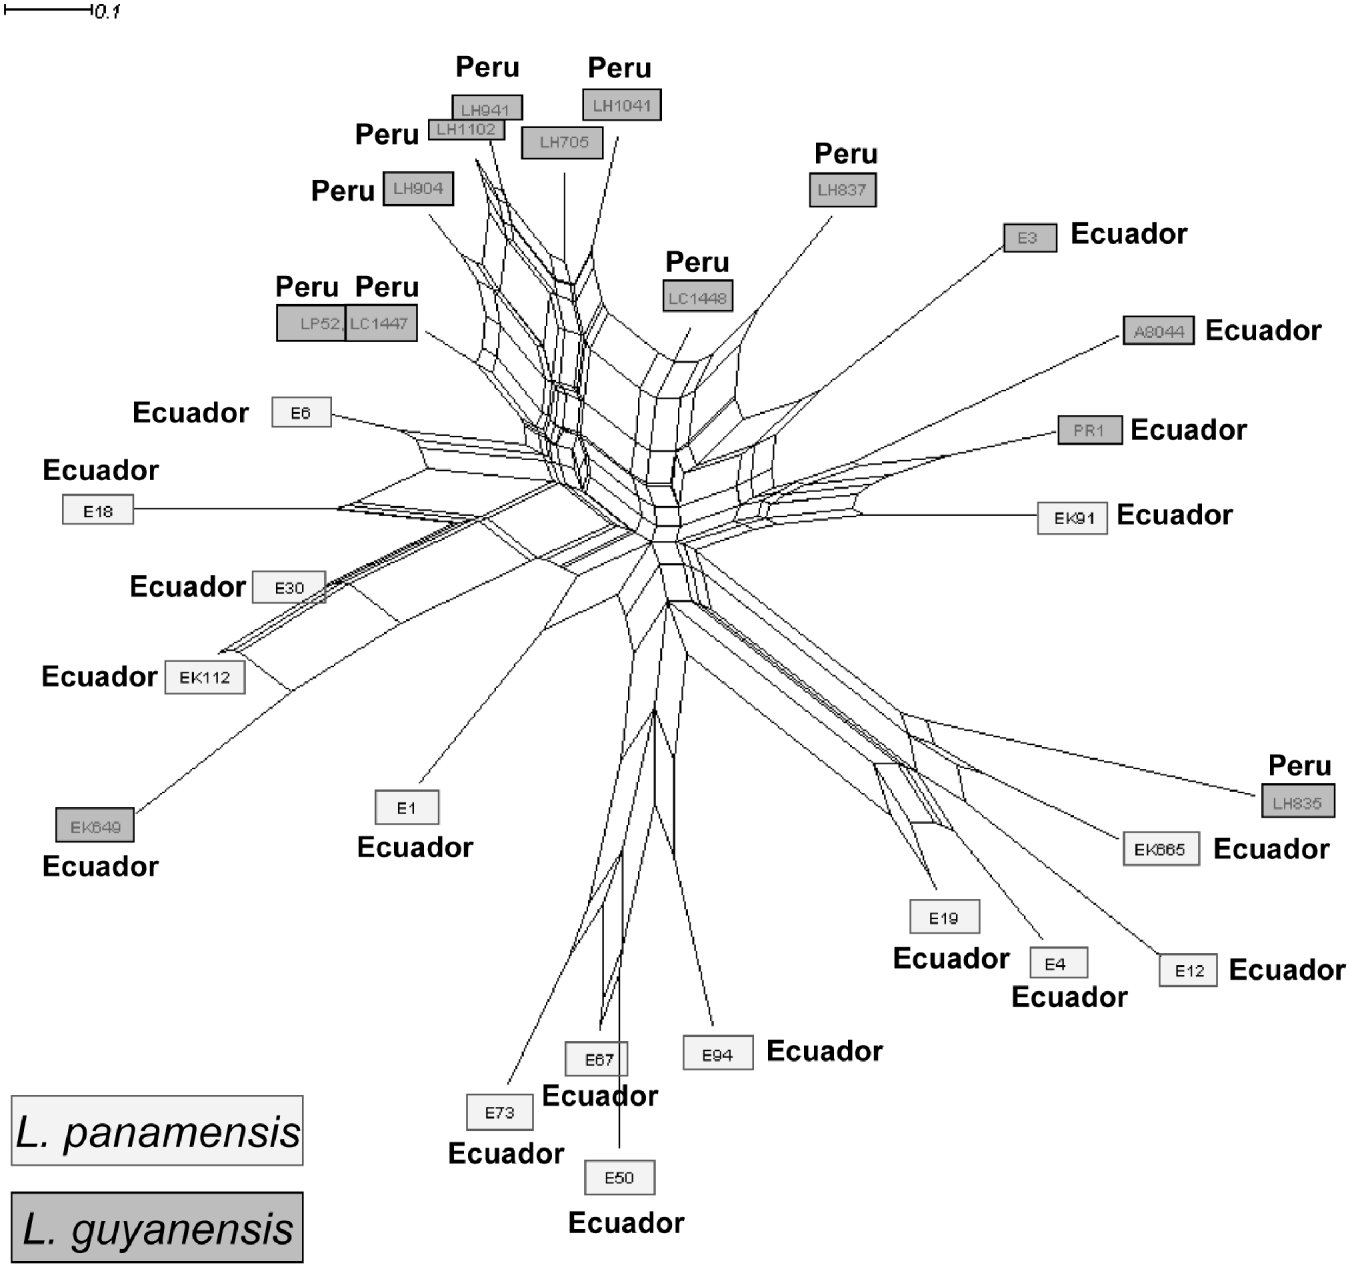
A Neighbor-joining network (NeighborNet) (Saitou and Nei, Reference Saitou and Nei1987), constructed from Cavalli-Sforza genetic distance, was used to cluster the strains from allelic frequencies. Data were computed using the PHYLIP software to build the distance matrix (version 3.5c; J. Felsenstein, Department of Genetics, University of Washington, Seattle, 1993) and network was performed using SplitsTree (Huson, Reference Huson1998) (Fig. 2).
Neighbor-joining network depicting genetic distance relationships based on Cavalli-Sforza's chord distances among 28 strains of the Leishmania guyanensis complex. The network was built using PHYLIP version 3.5c from raw allelic frequencies and performed by SplitsTree software.

RESULTS
We obtained clear electropherograms for all genotypes at all loci investigated, with only 1 or 2 alleles per strain at each locus. This observation excluded events of aneuploidy (for which we could have expected individuals with no allele, 3 or 4 alleles). No blank was ever observed in the genotypes (no missing data, i.e. all individuals were amplified at all loci), suggesting the absence of a null allele. According to Brookfield's and van Oosterhout's methods, null allele frequencies necessary to explain the observed F IS should have generated, under random mating assumption, 33 and 44 null homozygotes (blanks) across the entire sample (among the 336 loci×sample combinations) for Brookfield's and Van Oosterhooot's methods respectively. The difference with the absence of blanks in observed data was highly significant (exact unilateral binomial tests, P-value <0·0001 in both cases). The presence of null alleles is thus highly unlikely.
There was a high genetic diversity, with an average (±S.D.) of 6·58 (±2·19) alleles per locus, ranging from 3 (locus AC16) to 10 (locus AC01). Nei's mean unbiased genetic diversity (Nei and Chesser, Reference Nei and Chesser1983) H s=0·62 (±0·1) was reasonably high. The mean genetic diversity was high either for samples collected in Ecuador (H s=0·69, ±0·17) or for samples collected in Peru (H s=0·55, ±0·22). There was strong and significant (P-value ⩽0·002) heterozygote deficits compared to Hardy-Weinberg expectations in each subsample at all loci. The mean F IS ranged from 0·73 in Peru to 0·89 in Ecuador. For individual loci, the average values ranged from F IS=0·43 for locus EMI to F IS=1 for loci G09 and CAK. According to the species, the F IS values range from F IS=0·726 for L. guyanensis to F IS=0·882 for L. panamensis. The overall mean value is F IS=0·85 (95% CI=0·77–0·92). Between L. guyanensis and L. panamensis in Ecuador, we obtained a moderate and marginally significant genetic differentiation (F ST=0·097; P-value=0·051). If corrected for polymorphism (De Meeûs et al. Reference De Meeûs, McCoy, Prugnolle, Chevillon, Durand, Hurtrez-Boussès and Renaud2007a; Hedrick, Reference Hedrick2005), this differentiation appears more substantial (F ST′=F ST/(1−H s)=0·257). Finally, results showed a high and significant geographical differentiation between Peru and Ecuador for the sample composed of only L. guyanensis strains (F ST=0·324, P-value=0·01). We have calculated the genetic differentiations between L. braziliensis and the two species of the Leishmania guyanensis complex, L. panamensis and L. guyanensis. To estimate this value, we used the L. braziliensis dataset published in our previous publication (Rougeron et al. Reference Rougeron, Waleckx, Hide, De Meeus, Arevalo, Llanos-Cuentas and Banuls2008). We observed significant genetic differentiations between L. guyanensis and L. braziliensis (F ST=0·181, P-value=0·01) and between L. panamensis and L. braziliensis (F ST=0·179, P-value=0·01). In the same way, if we corrected these values for polymorphism (De Meeûs et al. Reference De Meeûs, McCoy, Prugnolle, Chevillon, Durand, Hurtrez-Boussès and Renaud2007a; Hedrick, Reference Hedrick2005), these differentiations appear more substantial (between L. guyanensis and L. braziliensis F ST′=F ST/(1−H s)=0·722 and between L. panamensis and L. braziliensis F ST′=0·704). It is worth noting that geographical localization of the strains cannot entirely explain the structuring of the sample (see Fig. 1).
The network reflects the important genetic heterogeneity within our sample and conflicting phylogenetic signals, suggesting a strong disagreement between loci (Fig. 2). We can also notice that neither geography nor current systematic (i.e. distinction between L. guyanensis and L. panamensis) satisfactorily describes the structuring found in our sample. More especially, it suggested that the NeighborNet network is not sufficiently informative to conclude about the taxonomic distinction between L. panamensis and L. guyanensis.
DISCUSSION
The data point to 3 fundamental purposes relating to the biology, the taxonomy and the population structure of these parasites.
Concerning the biology and particularly the reproduction mode, our findings reveal extreme homozygosity at all loci studied, in agreement with the data obtained by Oddone et al. (Reference Oddone, Schönian, dos Santos de Sousa, Cupolillo, Espinosa, Arevalo, Noyes, Mauricio and Kuhls2009) for L. guyanensis. As discussed for L. braziliensis (Rougeron et al. Reference Rougeron, Waleckx, Hide, De Meeus, Arevalo, Llanos-Cuentas and Banuls2008, Reference Rougeron, Meeûs, Hide, Waleckx, Bermudez, Arevalo, Llanos-Cuentas, Dujardin, Doncker, Ray, Ayala and Bañuls2009), these results seem to be incompatible with the heterozygote excesses that would have arisen in a predominantly clonal diploid organism (Balloux et al. Reference Balloux, Lehmann and de Meeus2003; De Meeûs et al. Reference De Meeûs, Prugnolle and Agnew2007b). Thus, the reproductive mode of these protozoan parasites is yet again questioned (Bañuls et al. Reference Bañuls, Hide and Prugnolle2007; Rougeron et al. Reference Rougeron, Meeûs, Hide, Waleckx, Bermudez, Arevalo, Llanos-Cuentas, Dujardin, Doncker, Ray, Ayala and Bañuls2009).
Regarding the population structure, the data showed an important genetic diversity which could be related to the great ecosystem richness, in terms of vector and/or reservoir diversities involved in the transmission cycle of the parasite in the two countries (e.g. Amazonian forest). Bigger and more accurate sampling (taking into account as many parameters as possible) will improve our understanding of the population biology of the different species belonging to this complex in the two countries.
On a taxonomical point of view, several reports questioned the distinct species status of L. panamensis and L. guyanensis (Bañuls et al. Reference Bañuls, Jonquieres, Guerrini, Le Pont, Barrera, Espinel, Guderian, Echeverria and Tibayrenc1999, Reference Bañuls, Hide and Prugnolle2007). Regarding microsatellite data, we found a marginally significant differentiation between the isolates belonging to the two taxa and a significant genetic differentiation (F ST=0·156, P-value=0·01) between the L. guyanensis complex and the L. braziliensis species. Given the very small sample sizes regarding the L. guyanensis complex, and the substantial F ST′ value between the two strain types, this result suggests the separation between these two entities. Nevertheless, due to the extreme heterogeneity illustrated by the NeighborNet, it is difficult to reach a conclusion and the taxonomic organization of the L. guyanensis complex appears challenging. Our sample sizes do not allow clear conclusions and more extensive studies will be necessary to improve our knowledge on the taxonomy of this group.
In summary, this study allows the addition of 12 other polymorphic microsatellite markers, initially designed for L. braziliensis (Rougeron et al. Reference Rougeron, Waleckx, Hide, De Meeus, Arevalo, Llanos-Cuentas and Banuls2008), to the 13 loci developed by Odonne et al. (Reference Oddone, Schönian, dos Santos de Sousa, Cupolillo, Espinosa, Arevalo, Noyes, Mauricio and Kuhls2009) (13 out of 15 because 2 loci are in common with those of Oddone and coworkers and with the present paper) for the genetic characterization of the L. guyanensis complex. The present data demonstrate that microsatellites can significantly help in raising numerous questions about the biology, population structure and taxonomy of strains belonging to the Leishmania guyanensis complex.
ACKNOWLEDGEMENTS
We acknowledge F. Prugnolle, C. Barnabé and H. Gómez Díaz for helpful discussions. We thank the unit of Molecular Parasitology of the Institute of Tropical Medicine, Antwerpen, Belgium, for their help in obtaining Peruvian parasite isolates and C. Barrera, I. Espinel, R. Guderian, R. Echeverria and F. Le Pont for obtaining Ecuadorian isolates. We acknowledge the genotyping platform of the IFR 119 Montpellier Environment Biodiversité, Montpellier, France. We are grateful to the Institut de Recherche pour le Développement, Centre National de la Recherche Scientifique and the 2 CEE projects : CI1*-CT91-0901 and TS3*-CT92-0129 for their financial support. This work was also supported by a French National Project, ANR 06-SEST-20 IAEL.