Introduction
Tea cultivation in India covers an area of around 0.6 million ha and contributes about 0.23 of the world's total tea production in terms of domestic and international requirements. Currently, poor productivity and stagnant or declining prices affect the tea industry adversely, which in turn affects the profitability of tea cultivation. A substantial proportion of ageing plantations is a critical factor contributing to low productivity and inferior quality. As replantation of these commercially unproductive areas is crucial for sustained productivity, the South Indian tea estates started uprooting and replanting the unproductive seedling teas with improved clones. Generally, South India experiences a drought period from mid-December to mid-March. Occasionally, indeterminate delays in the summer rains and early termination of north-east monsoons stretches drought from the end of November to the end of April/early May. This uneven rainfall distribution results in drought damage in the replanted areas, as well as in young tea plants planted as infills, leading to high mortality rates. On the other hand, the production of high-quality tea is constrained by the low yield potential of available high-quality tea clones. Unless high-quality teas are produced, the industry cannot sustain the increased production costs and poor prices. Even though several tea clones with high-yield/high-quality have been released, the modest drought tolerance level of high-yielding clones and poor yield potential of high-quality clones have been major factors limiting their commercial acceptance.
Grafting in tea offers promising prospects to produce composite plants. Nursery grafting of fresh cuttings consisting of a leaf and an internode combines the yield/quality of the scion and drought tolerance of the rootstock in the resulting composite plant (Sharma and Satyanarayana, Reference Sharma and Satyanarayana1981; Satyanarayana et al., Reference Satyanarayana, Cox and Sharma1992). Based on long-term field assessment, compatible rootstock clones have been identified for only four high-yielding/high-quality scion clones, and recommended for large-scale commercial adoption (Satyanarayana et al., Reference Satyanarayana, Cox and Sharma1992). Due to the rapid field establishment, improved yield and drought tolerance of composite plants, some of the estates in South India are planting more than 0.70 of their replanted area using grafted plants with limited available stock–scion combinations. This will limit the genetic diversity of the rapidly expanding replanted tea plantations. Therefore, a wide choice of proven stock–scion combinations which demonstrate clear advantages over the use of their corresponding self-rooted scion clones is indispensable. Currently, a detailed report on the factors influencing the productivity and drought tolerance of grafted plants in tea is limited. Based on the foregoing, the current study was aimed at evaluating several new graft combinations using potential scions and rootstocks with a view to widening the choice of compatible graft combinations. Additionally, various morphological, physiological and biometric parameters were assessed in the grafted plants to find out the underlying factors contributing to the increased productivity and drought tolerance of composite plants compared with the self-rooted plants.
Materials and methods
Experimental site
Field experiments were carried out at UPASI Tea Research Foundation, Tea Research Institute, Valparai, Coimbatore District, Tamilnadu, India from 2013 to 2017 (10°22′N, 76°58′E, 1050 m asl). The average minimum and maximum temperatures ranged between 15.02 and 26.24 °C and the area received an annual average rainfall of 3500 mm (average of past 10 years).
Plant material
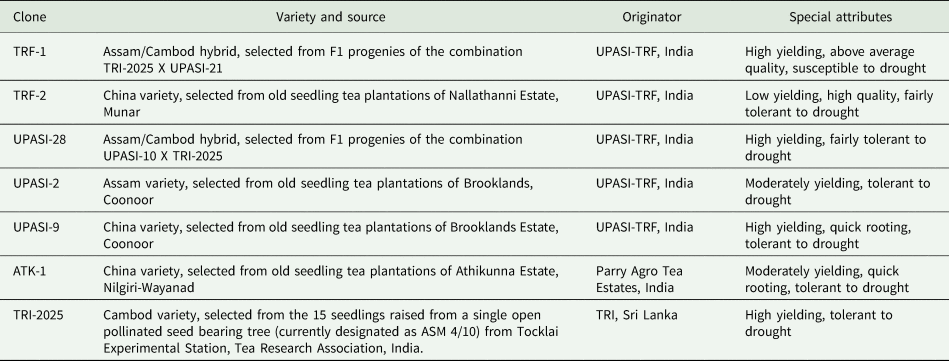
The clones TRF-1, TRF-2 and UPASI-28 were selected as scion clones for grafting onto the drought-tolerant rootstock clones UPASI-2, UPASI-9, ATK-1 and TRI-2025. The detailed description of these tea clones is given in Table 1, as outlined by botanists and breeders (Mohanan and Sharma, Reference Mohanan, Sharma and Vishveshwara1981; Sharma and Satyanarayana, Reference Sharma and Satyanarayana1987; Ranatunga and Gunesekera, Reference Ranatunga and Gunesekera2008; Sharma, Reference Sharma and Sharma2011a). Cleft grafting of soft wood cuttings from each scion clone on all the selected rootstock clones was carried out in the nursery as described by Haridas (Reference Haridas1979). The ungrafted plants of the selected scion and rootstock clones were also included as controls for comparison. Therefore, the study comprised of 19 treatments including 12 new graft combinations and seven ungrafted controls. The grafted and ungrafted scion and rootstock clones were raised in the nursery for a period of 1 year in accordance with standard practice (Sharma, Reference Sharma and Sharma2011b).
Varietal type, source, origin and special attributes of tea clones

UPASI, United Planters Association of South India; TRF, Tea Research Foundation (UPASI); ATK, Athikunna; TRI, Tea Research Institute (Sri Lanka).
Field planting
One year old nursery grown plants of different graft combinations and their respective controls were planted in the open field in June 2013 at a spacing of 135 × 75 × 75 cm. The experiment was setup in a complete randomized block design and replicated twice. Each plot comprised of 30 plants. Fertilizers and nutrients were applied in accordance with standard practice (Verma and Palani, Reference Verma, Palani and Verma1997).
Assessment of field survival rate
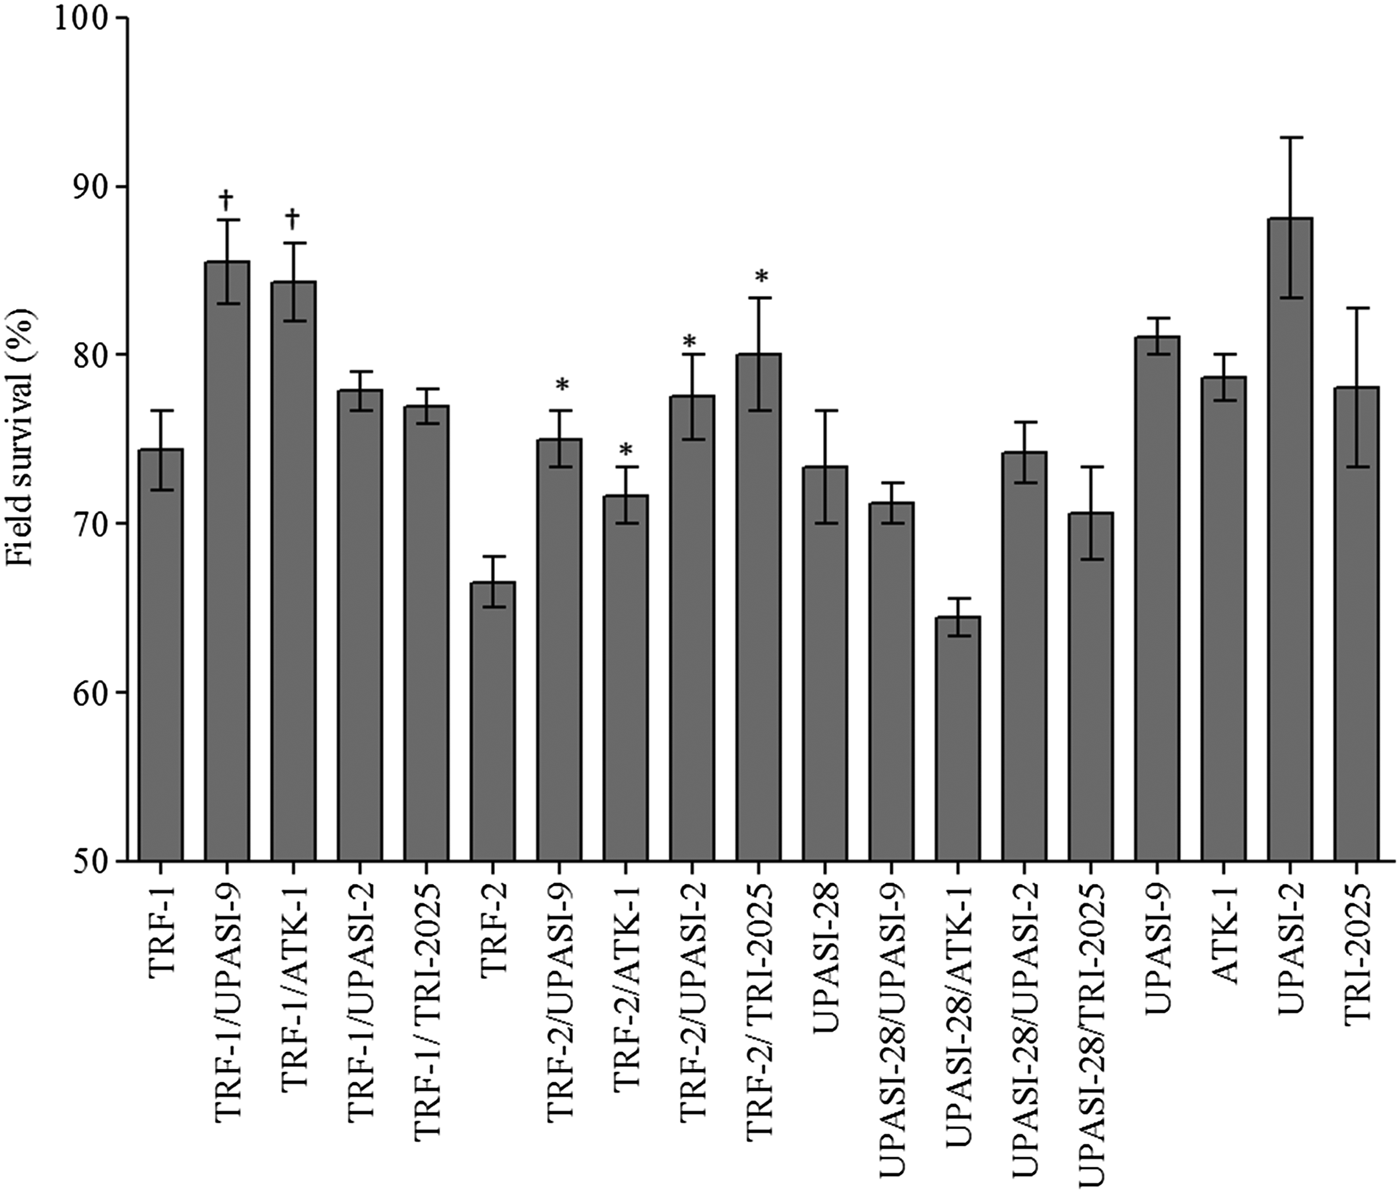
Field survival percentage of grafted and self-rooted plants was assessed after the first dry spell from planting (Fig. 1).
Field survival percentage of grafted and self-rooted plants following the first drought period from planting. Vertical bars represent the standard error (s.e.). Data represent mean values ± s.e. (n = 2). †P < 0.05; Dunnett t-test when compared with TRF-1, *P < 0.05; Dunnett t-test when compared with TRF-2. See Supplementary Materials online for ANOVA tables.

Training of young tea
The young tea plants were de-centred (removal of leader stem) and trained by two stage tipping, as outlined by Sharma et al. (Reference Sharma, Satyanarayana and Cox1990) to establish a ‘plucking table’.
Yield and yield components
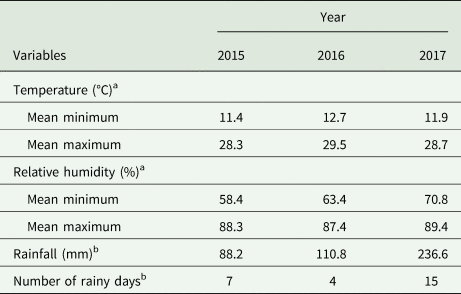
Harvesting commenced in the experimental plots during January 2015 in accordance with standard practice (Sharma, Reference Sharma and Sharma2011c). Yield recorded during January 2015 to December 2017 are presented in Table 2. Green leaf comprising mostly three leaves and a bud were harvested every 18–24 days and weighed fresh using a digital balance. Yield of black tea was estimated from green leaf yield using a standard conversion factor of 22.5% derived from factory records. Yield data from January to March in the years 2015, 2016 and 2017 were analysed separately to assess the performance of grafted plants through the drought periods. Meteorological data monitored during the drought period at UPASI Tea Experimental Farm are given in Table 3. The yield components were assessed at eight occasions during the second year of harvesting (January 2016 to December 2016) and the mean values are presented (Figs 2–6). Yield components assessed from January to March were analysed separately to assess the performance of grafted plants through the drought period.
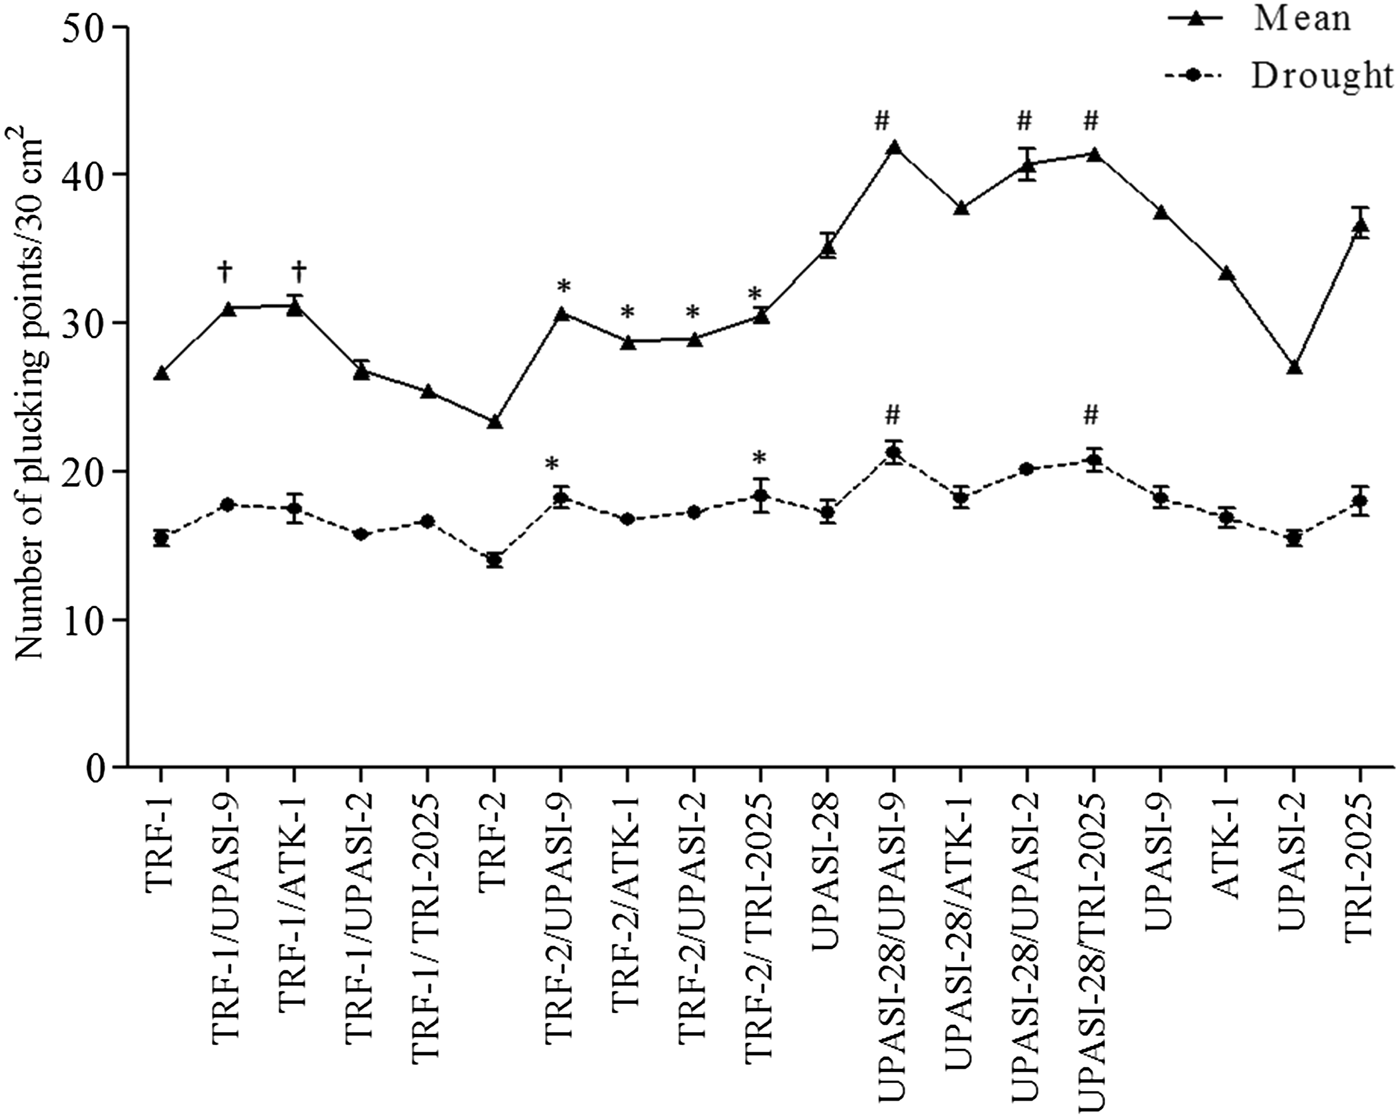
Mean number of plucking points per unit area and their number during drought period in grafted and self-rooted plants. Vertical bars represent the standard error (s.e.). Data represent mean values ± s.e. (n = 2). †P < 0.05; Dunnett t-test when compared with TRF-1, *P < 0.05; Dunnett t-test when compared with TRF-2, #P < 0.05; Dunnett t-test when compared with UPASI-28. See Supplementary Materials online for ANOVA tables.

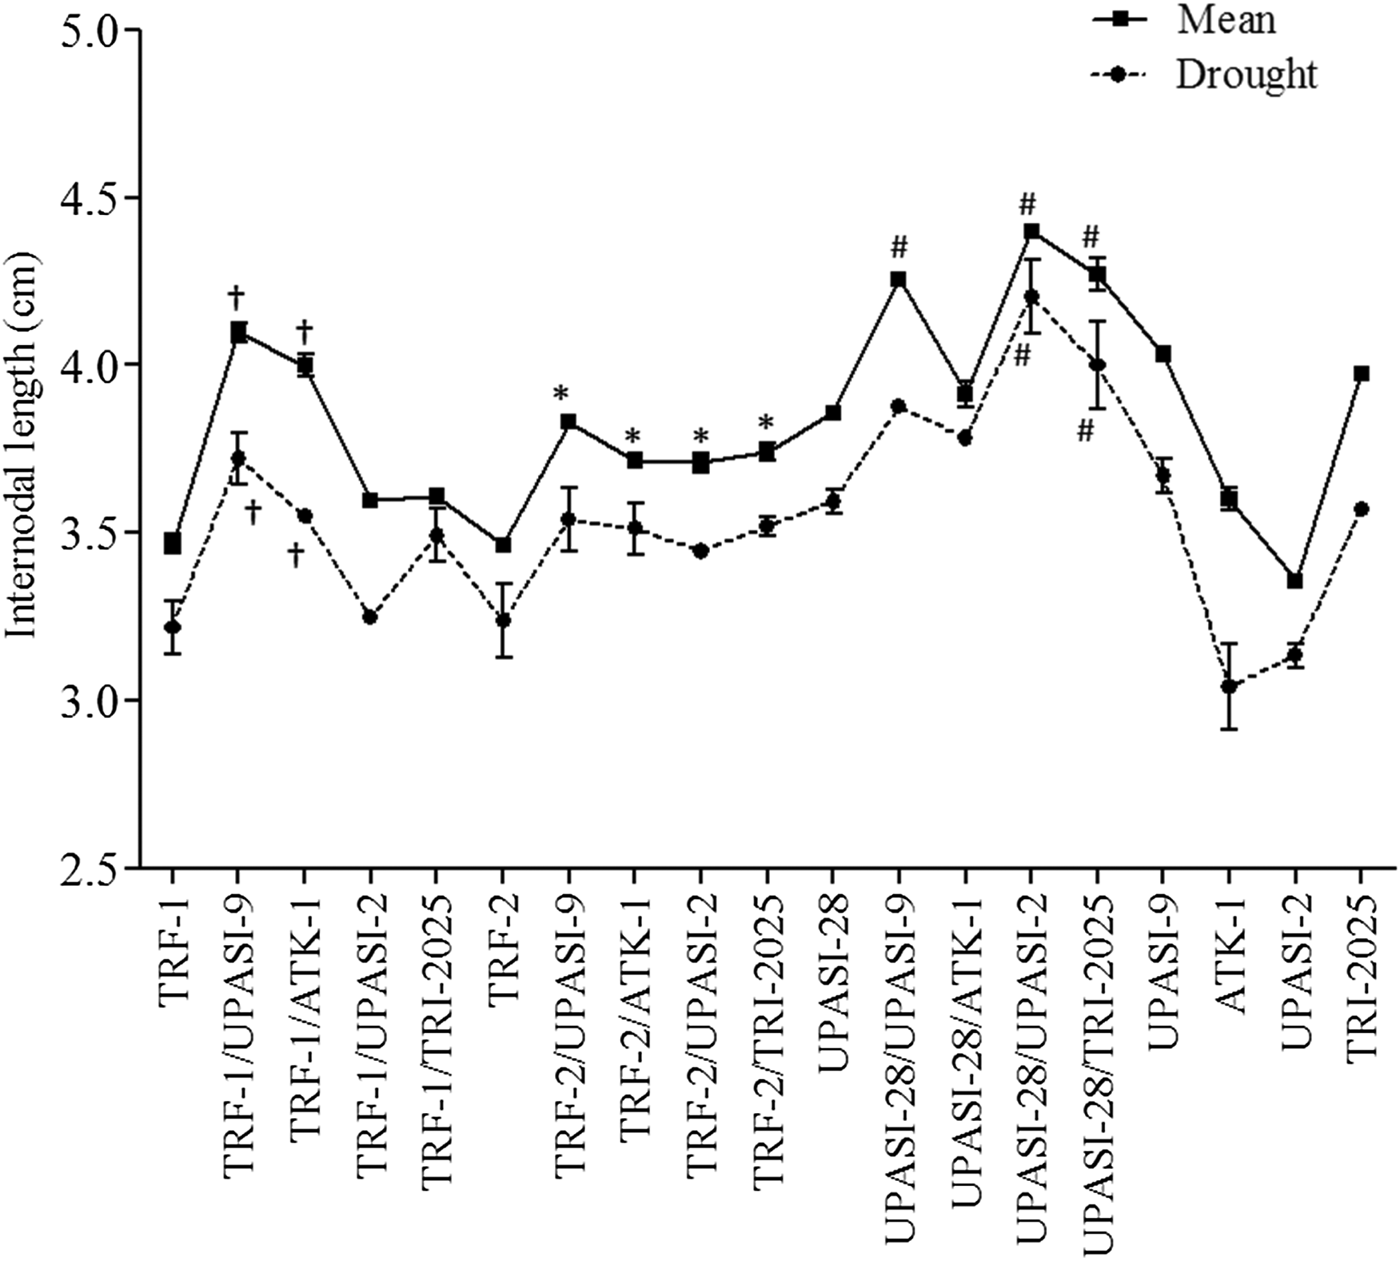
Mean internodal length and internodal length during drought period in crop shoots of grafted and self-rooted plants. Vertical bars represent the standard error (s.e.). Data represent mean values ± s.e. (n = 2). †P < 0.05; Dunnett t-test when compared with TRF-1, *P < 0.05; Dunnett t-test when compared with TRF-2, #P < 0.05; Dunnett t-test when compared with UPASI-28.

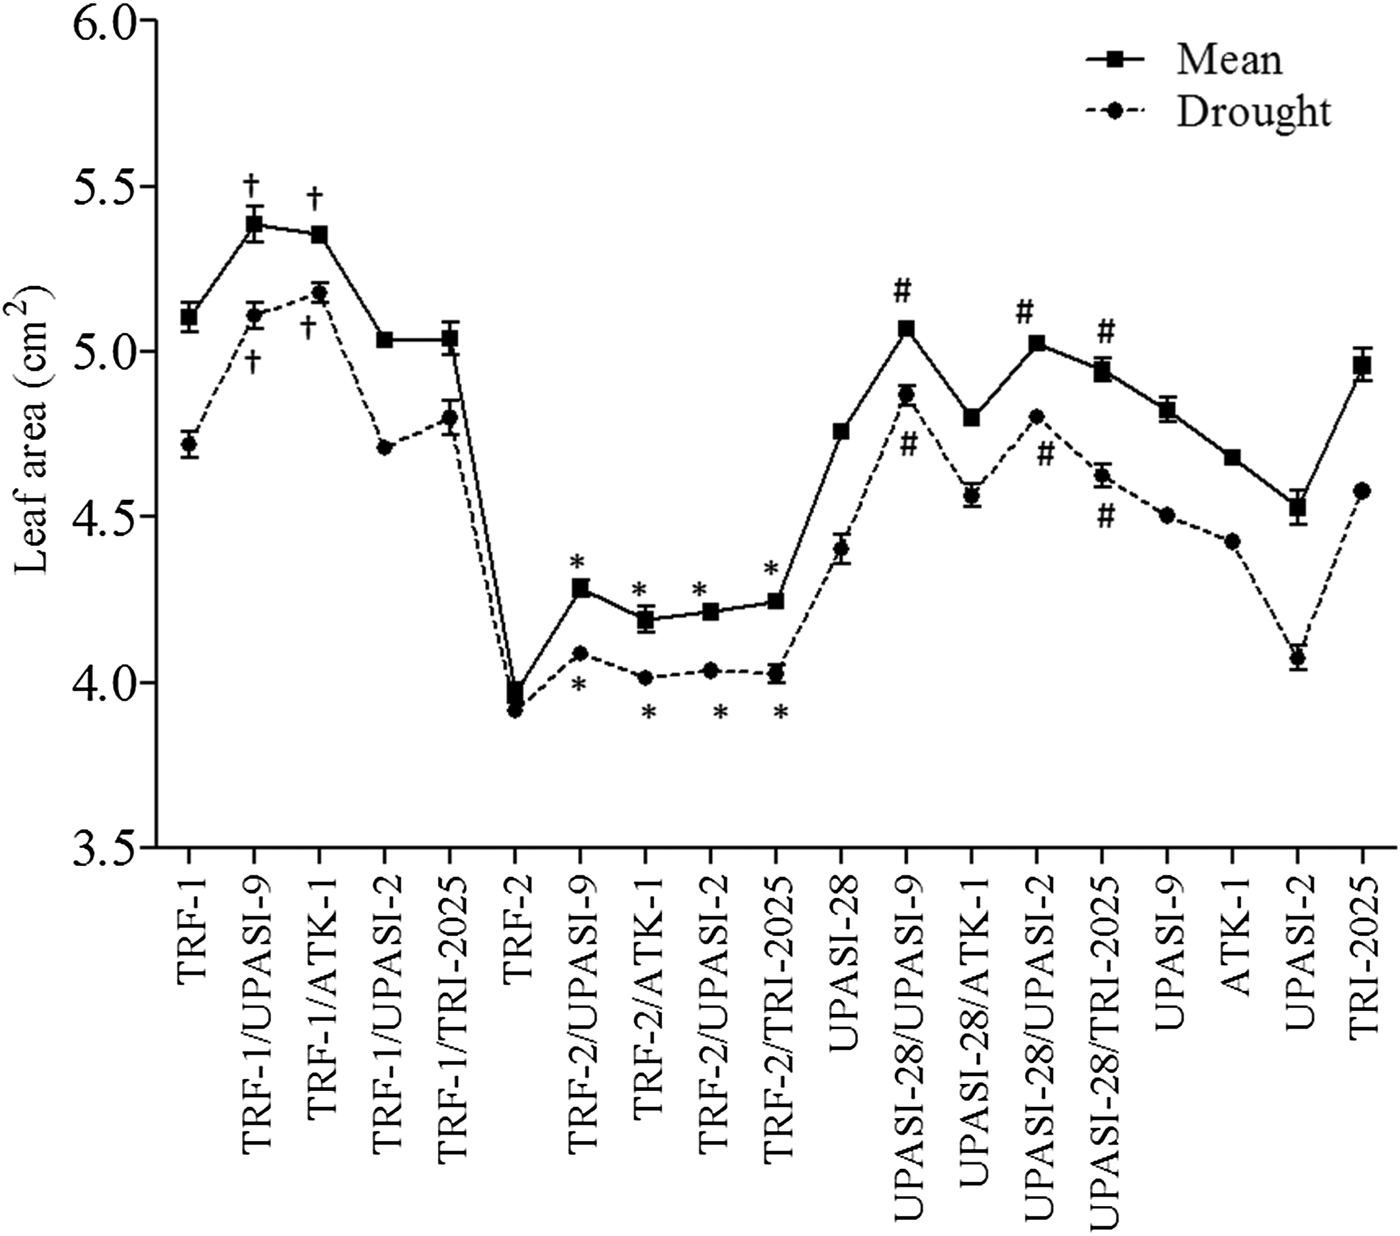
Mean leaf area and leaf area during drought period in the third leaf of crop shoots of grafted and self-rooted plants. Vertical bars represent the standard error (s.e.). Data represent mean values ± s.e. (n = 2). †P < 0.05; Dunnett t-test when compared with TRF-1, *P < 0.05; Dunnett t-test when compared with TRF-2, #P < 0.05; Dunnett t-test when compared with UPASI-28.

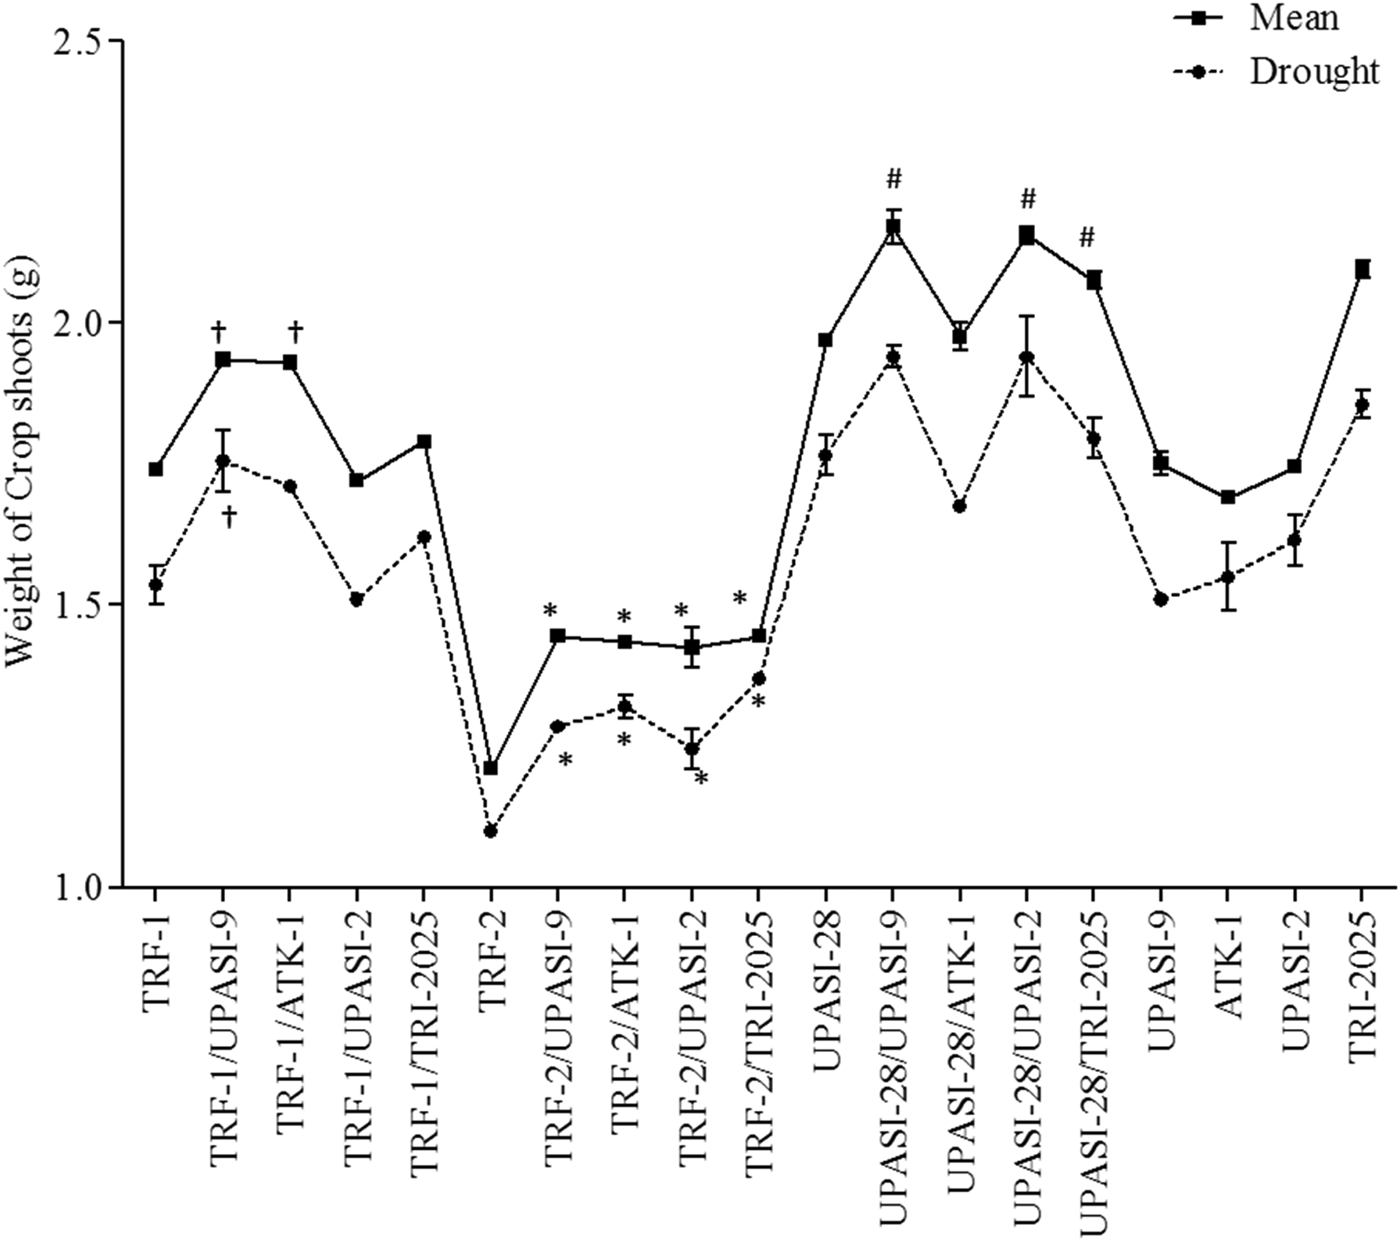
Mean weight and weight during drought period in crop shoots of grafted and self-rooted plants. Vertical bars represent the standard error (s.e.). Data represent mean values ± s.e. (n = 2). †P < 0.05; Dunnett t-test when compared with TRF-1, *P < 0.05; Dunnett t-test when compared with TRF-2, #P < 0.05; Dunnett t-test when compared with UPASI-28. See Supplementary Materials online for ANOVA tables.

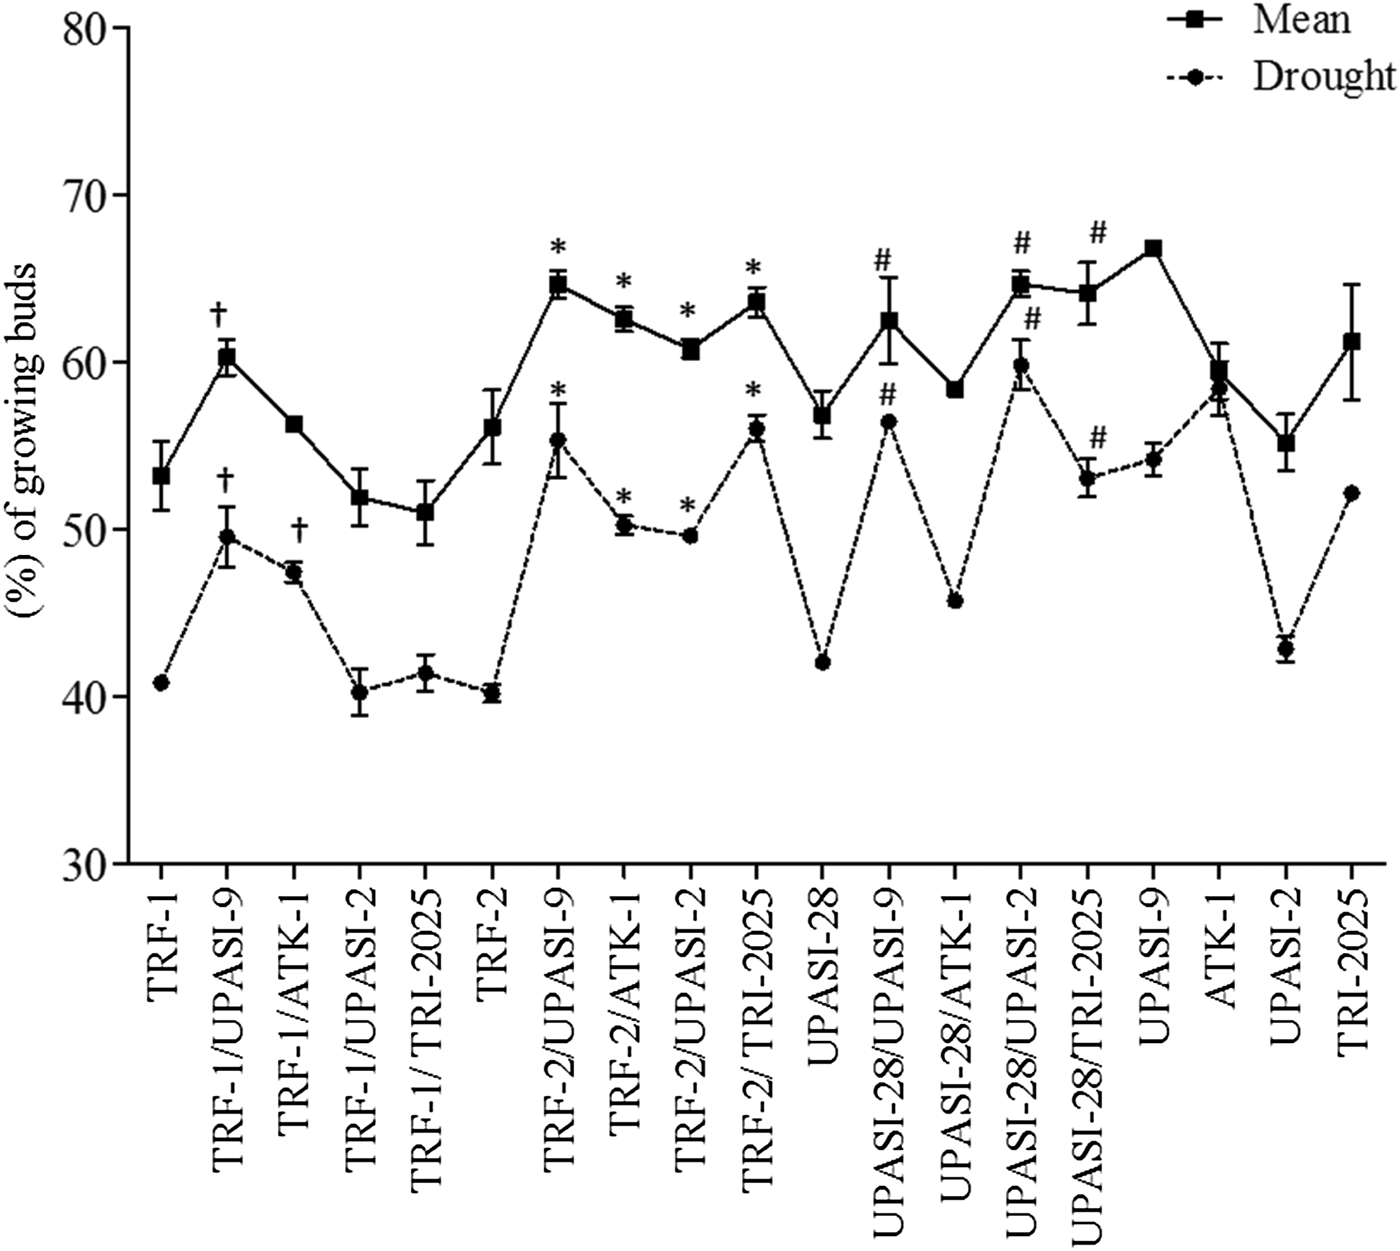
Mean percentage of growing buds and the percentage during drought period in grafted and self-rooted plants. Vertical bars represent the standard error (s.e.). Data represent mean values ± s.e. (n = 2). †P < 0.05; Dunnett t-test when compared with TRF-1, *P < 0.05; Dunnett t-test when compared with TRF-2, #P < 0.05; Dunnett t-test when compared with UPASI-28.

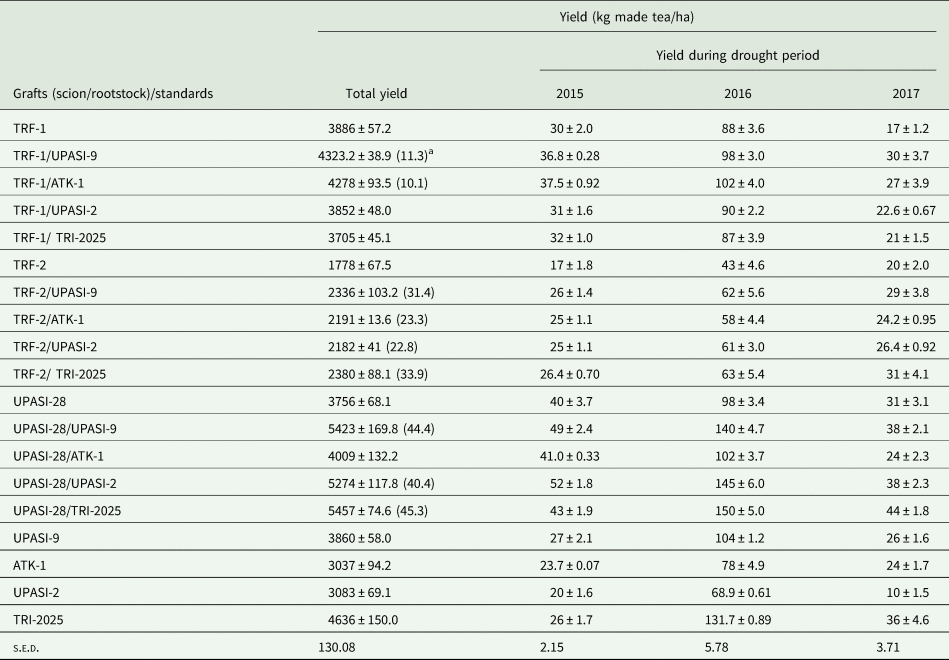
Yield of grafted and self-rooted plants (January 2015 to December 2017)

Data represent means ± standard error (s.e.) (n = 2). s.e.d. represents standard error of the difference.
a Figures in parentheses represent percent increase in yield over that of corresponding self-rooted scion clones.
See Supplementary Materials online for ANOVA table.
Meteorological data monitored during the drought period (January to March)

a Mean of January, February and March.
b Total from January to March.
Number of plucking points per unit area was assessed once the terminal bud had visibly begun to expand (7–10 days after harvesting). A 0.3 m2 quadrat was placed on the centre of the canopy in five randomly selected bushes in a plot and plucking points with both actively growing and dormant shoots were counted. Plot means were attained by averaging the five assessments. Similarly, 1 day before each harvest, a 0.3 m2 quadrat was placed on five randomly selected bushes in each plot and the crop shoots falling inside the quadrat were plucked, weighed and counted. Mean weight of a crop shoot in a quadrat was determined by dividing the total weight by the number of shoots harvested. Inter-nodal length and leaf area were measured in all the crop shoots falling inside the quadrat and quadrat means were computed. Inter-nodal length was measured between the second and third leaves of a crop shoot using a metric scale. Leaf area was measured on the third leaf of the shoot as described by Satyanarayana and Rao (Reference Satyanarayana and Rao1981). By averaging the quadrat means plot means for crop shoot weight, inter-nodal length and leaf area were determined.
Percentage of actively growing buds was assessed by collecting three random sub-samples of freshly harvested shoots, weighing 100 g, from each plot at the time of harvest. The shoots were then sorted into actively growing (buds) and dormant (‘banjhi’ or ‘wangi’) categories based on size of the terminal bud (De Costa et al., Reference De Costa, Mohotti and Wijeratne2007) and mean percentage of buds was calculated.
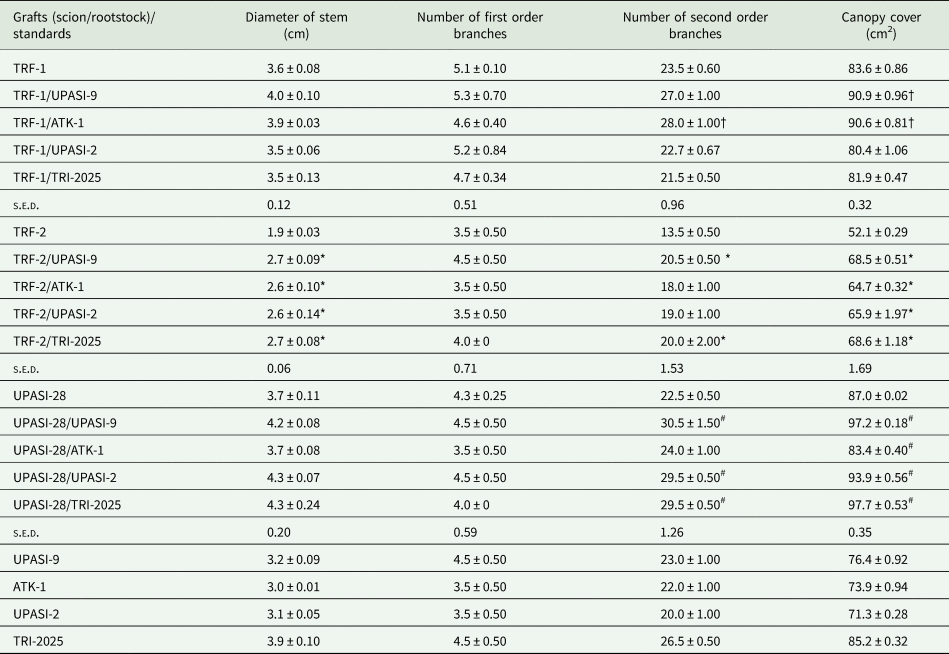
Canopy spread and branching were assessed in randomly selected five bushes of each plot during December 2016. Stem diameter at 3 cm above the graft union/ground level was measured using a Vernier callipers. Branches were counted as first order (branches originated from the main stem) and second order (branches originated from the first order branches). Canopy area of a tea bush was calculated by multiplying the square root values of its length and breadth and expressed in cm2. Plot means were determined from the five assessments.
Estimation of proline and chlorophyll content
Proline and chlorophyll content was assessed during the period of peak water stress (February 2016) in three samples selected at random in each plot and mean values were determined. Proline accumulation in the third leaf of the crop shoot was estimated as per the procedure described by Bates et al. (Reference Bates, Waldren and Teare1973). Chlorophyll contents in tea shoots were quantified by the spectrophotometer method described by Harborne (Reference Harborne1973).
Statistical analysis
Plot means were subjected to analysis of variance (ANOVA) using SPSS software (Version 20) and were expressed as mean ± standard error (s.e.). A general linear model with main effects for blocks and treatments were fitted to the data. Yield data were analysed using Tukey's honestly significant difference, to test the superiority of a genotype in comparison with all other genotypes (t = 19, r = 2; error df = 18). Dunnett t-test was performed to compare the field survival rate, yield components, proline and chlorophyll content of grafted plants of a scion genotype with their respective self-rooted scions (t = 5, r = 2; error df = 4). Statistical significance was declared at P ⩽ 0.05. Correlation of the genotype means of all yield components with total yield was analysed using the Pearson's correlation test with SPSS software (Version 20).
Results
Survival rate
Field survival rate was generally higher in composite plants of TRF-1 and TRF-2 than their corresponding self-rooted scions after the dry spell following planting (Fig. 1). Percentage survival was significantly (P < 0.05) higher when the scions of TRF-1 were grafted onto UPASI-9 and ATK-1 compared with grafting onto UPASI-2 and TRI-2025 (Fig. 1). In the case of the scions of TRF-2, the survival rate was significantly (P < 0.05) higher when grafted on all the four rootstocks (Fig. 1). However, significant variations were not observed in the survival rate between grafted and self-rooted plants of UPASI-28 (Fig. 1). Among the ungrafted scions and rootstocks, survival percentage of UPASI-2 was higher than the other scion and rootstock clones (Fig. 1).
Yield
Yield of the clone TRF-1 was increased by 10–11%, when grafted on UPASI-9 and ATK-1 compared with its self-rooted plants (Table 2). The rootstocks of UPASI-2 and TRI-2025 were not effective at increasing the yield of TRF-1. The scion clones most responsive to grafting were TRF-2 and UPASI-28. The overall yield of TRF-2 was improved by grafting on all rootstocks, by 22–34% compared with TRF-2 on its own root system (Table 2). There were no significant yield differences noticed among the composite plants of TRF-2 grafted on different rootstocks. In the case of the scions of UPASI-28, all the rootstocks except ATK-1 were effective at increasing its yield significantly. Moreover, the magnitude of difference in yield between grafted and self-rooted plants was higher while the clone UPASI-28 was used as the scion. Overall, yield increase in UPASI 28 ranged from 40 to 45% when grafted on UPASI-2, UPASI-9 and TRI-2025 (Table 2). Additionally, yield recorded during the drought periods in the above stock–scion combinations were notably higher than their corresponding self-rooted scions. Among the ungrafted scion and rootstock clones, the clone TRI-2025 recorded significantly (P < 0.05) higher yields. Among all the graft combinations and controls, the compatible composite plants of UPASI-28 established their superiority in terms of growth and productivity.
Components of yield
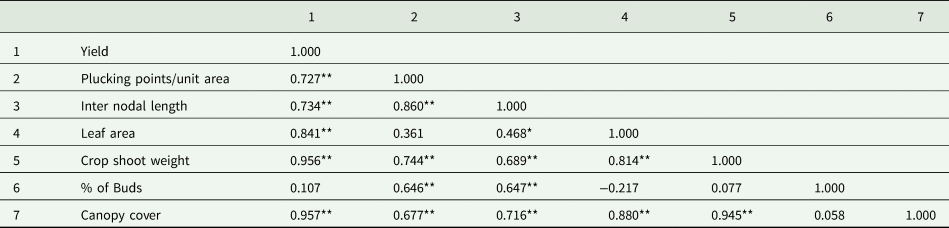
Graft combinations which demonstrated higher yields compared with their corresponding self-rooted scions, also showed significantly (P < 0.05) increased number of plucking points, inter-nodal length, leaf area, crop shoot weight and percentage of buds (Figs 2–6). Similar to yield, all the observed yield components in grafted and self-rooted plants were lower during the drought period when compared with the annual means (Figs 2–6). Number of second order branches and canopy area were found to be significantly (P < 0.05) higher in the compatible stock–scion combinations (which demonstrated higher yield) when compared with their corresponding self-rooted plants (Table 4). Among all the graft combinations and controls, number of plucking points, inter-nodal length, crop shoot weight, branching and canopy cover were higher in the composite plants of UPASI-28, whereas increased leaf area was observed in the composite plants of TRF-1 (Figs 3–5 and Table 4). The percentage of actively growing buds was higher in the ungrafted rootstock clone UPASI-9 (Fig. 6). Among the ungrafted rootstocks and scions, the yield components were higher in TRI-2025 followed by UPASI-9, TRF-1 and UPASI-28 (Figs 3–6). Moreover, a significant positive correlation (P < 0.01) was found between yield and yield components such as number of plucking points, inter-nodal length, leaf area, crop shoot weight and canopy cover (Table 5).
Canopy cover and branching in grafted and self-rooted plants

Data represent means ± standard error (s.e.) (n = 2). s.e.d. represents standard error of the difference. †P < 0.05; Dunnett t-test when compared with TRF-1, *P < 0.05; Dunnett t-test when compared with TRF-2, #P < 0.05; Dunnett t-test when compared with UPASI-28.
See Supplementary Material online for ANOVA tables.
Correlation coefficient values between yield and yield components

*Correlation coefficient values are significant at P < 0.05.
**Correlation coefficient values are significant at P < 0.01.
Proline accumulation and chlorophyll content during drought period
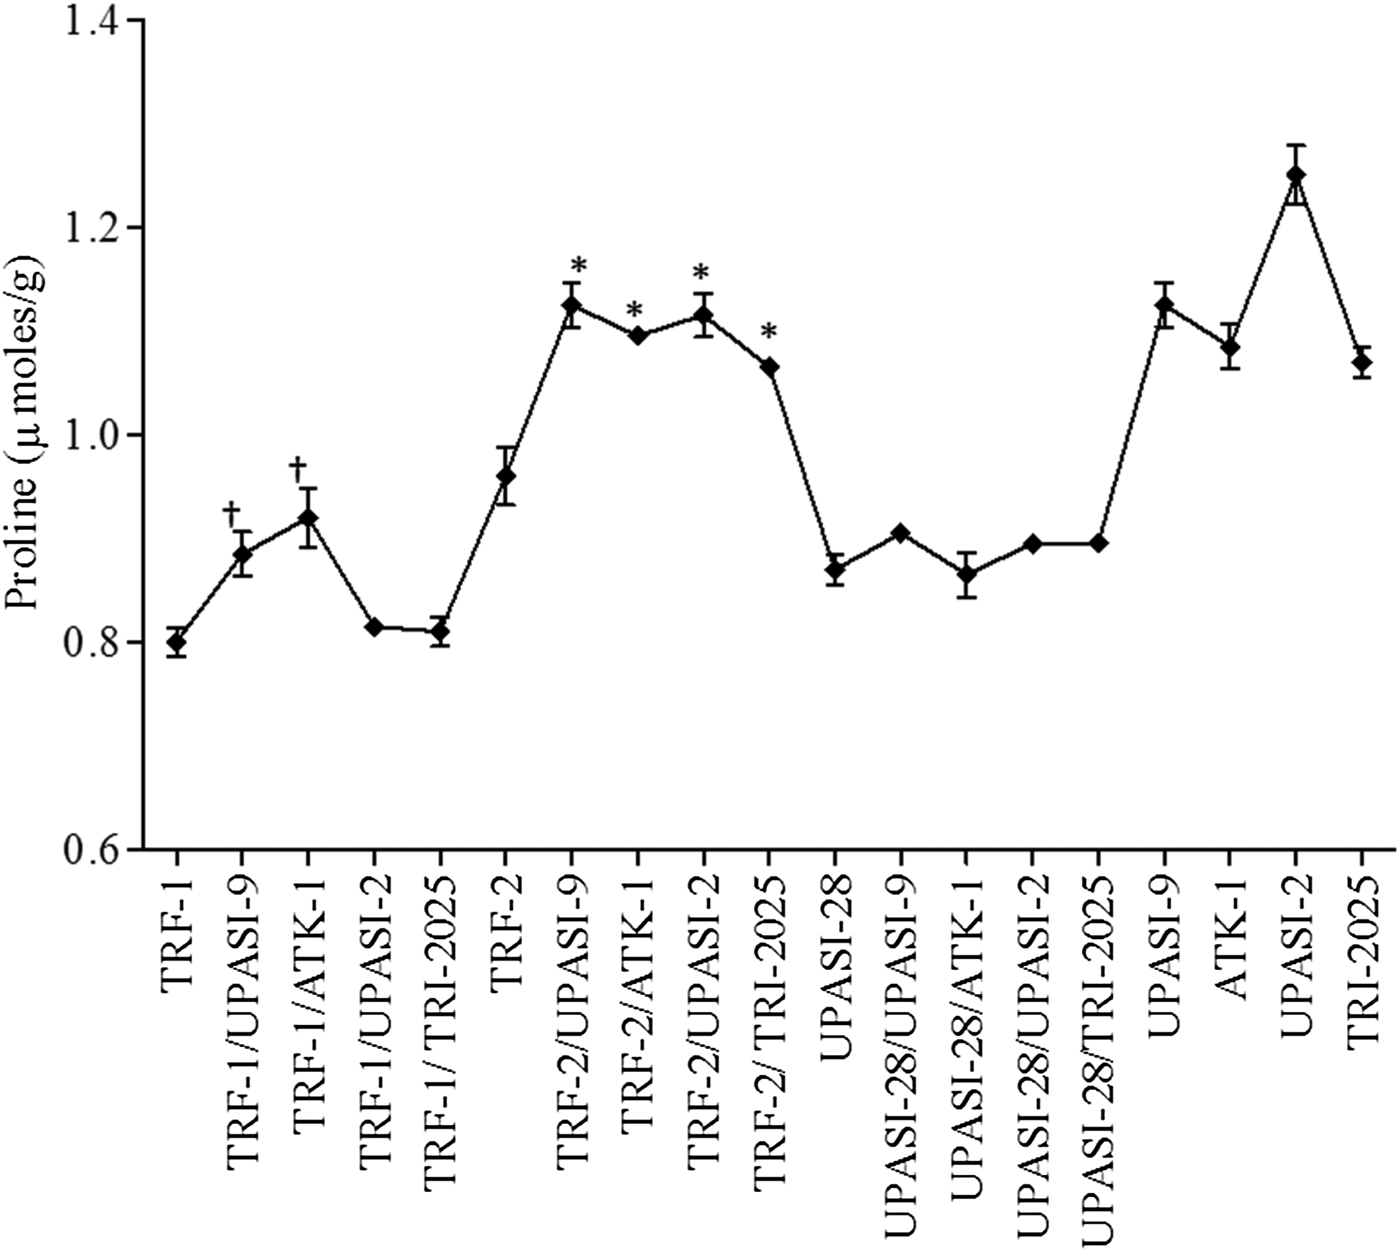
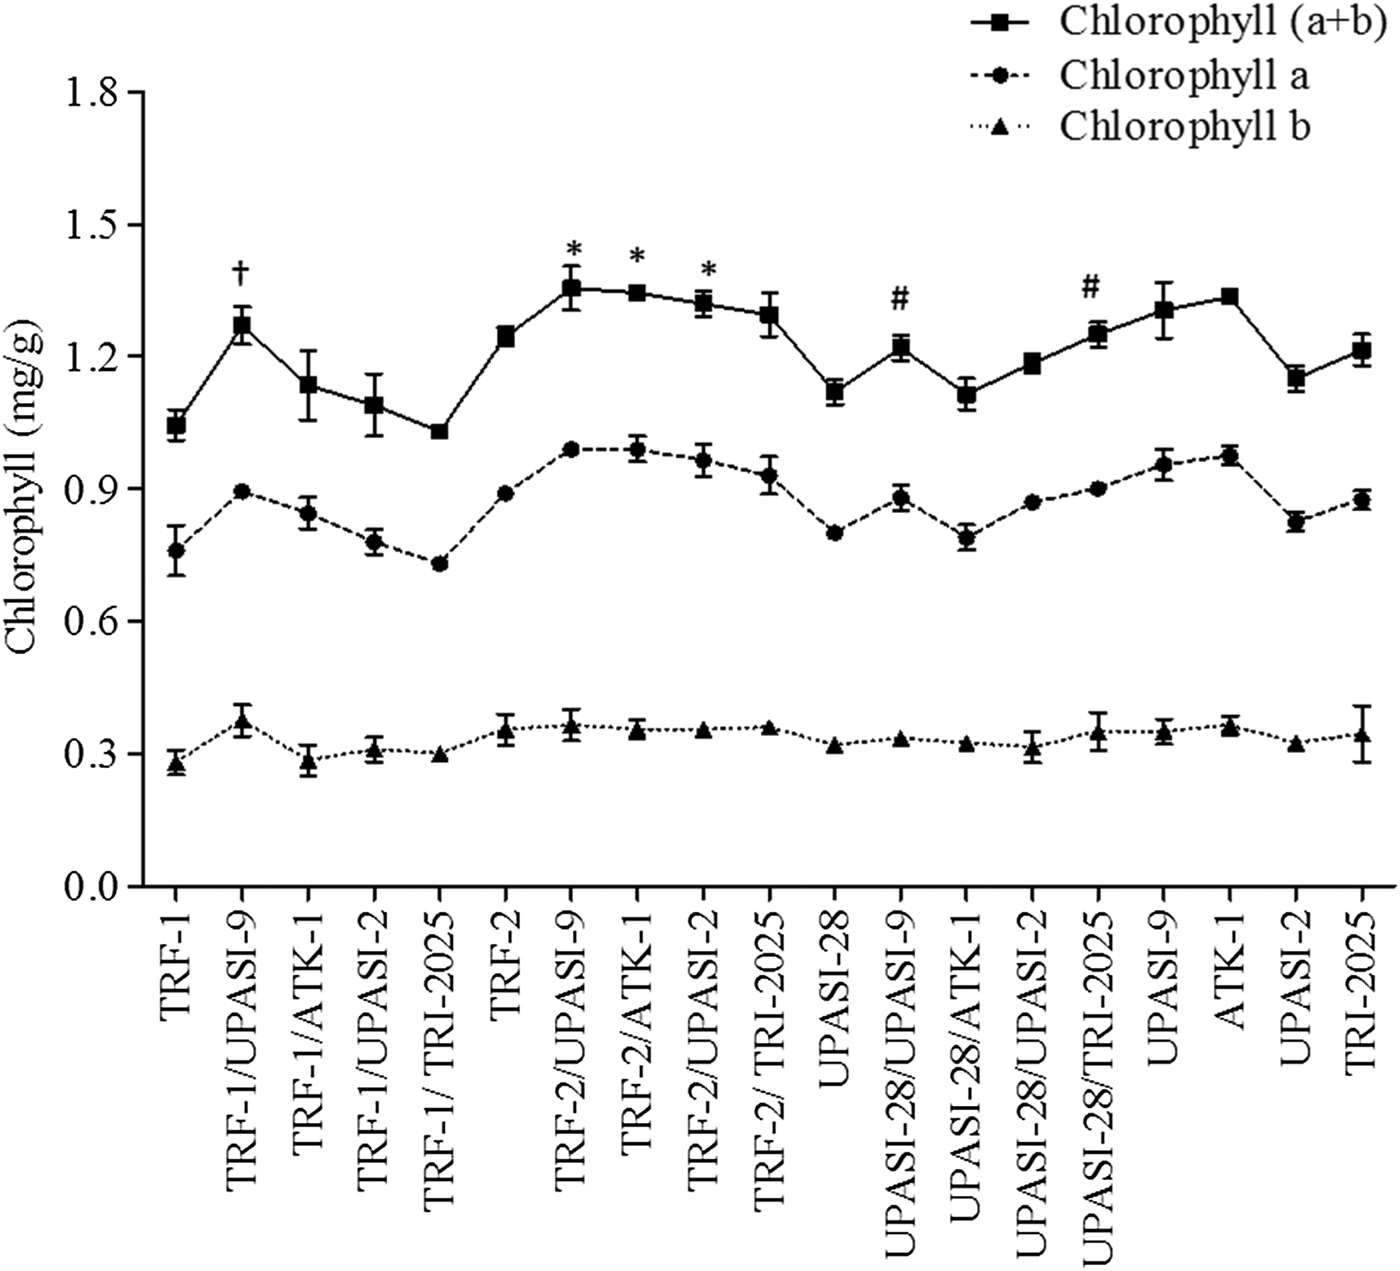
At the time of sampling, the soil moisture level was 85 g/kg at 0–23 cm depth and 127 g/kg at 23–46 cm depth. Significant increase (P < 0.05) in proline content was noticed in composite plants of TRF-1 grafted on UPASI-9 and ATK-1, and TRF-2 grafted on all four rootstocks when compared with their corresponding self-rooted scion clones (Fig. 7). Whereas no clear differences were noticed in the proline content between grafted and self-rooted plants of UPASI-28 (Fig. 7). Chlorophyll content in the dry season was generally higher in the compatible composite plants of TRF-1, TRF-2 and UPASI-28 (Fig. 8). The content of chlorophyll a and chlorophyll b showed the same trend in most of the grafted and self-rooted plants. Slight variations observed in this trend in a few grafted and self-rooted plants were not significant (Fig. 8). Among all the graft combinations and controls, accumulation of proline was the highest in the clone UPASI-2, whereas the highest chlorophyll content was observed in the composites of TRF-2 and the ungrafted rootstock clones ATK-1 and UPASI-9 (Fig. 7).
Proline accumulation in grafted and self-rooted plants during the drought period. Vertical bars represent the standard error (s.e.). Data represent mean values ± s.e. (n = 2). †P < 0.05; Dunnett t-test when compared with TRF-1, *P < 0.05; Dunnett t-test when compared with TRF-2.

Chlorophyll content in grafted and self-rooted plants during the drought period. Vertical bars represent the standard error (s.e.). Data represent mean values ± s.e. (n = 2). †P < 0.05; Dunnett t-test when compared with TRF-1, #P < 0.05; Dunnett t-test when compared with UPASI-28.

Discussion
Influence of scions, rootstocks and scion–rootstock interaction on productivity of grafted plants
Grafted plants demonstrated differential responses in terms of yield depending upon the scion–rootstock combinations. The yield of the low-yielding scion clone TRF-2 improved greatly on grafting, irrespective of the rootstock used. However, when high-yielding clones were used as scions, grafting with only specific rootstocks increased their yield significantly. This shows that the low-yielding clones respond more consistently towards grafting compared with the high-yielding clones. Similar findings on the greater response of low-yielding scion clones for grafting was reported by Kayange et al. (Reference Kayange, Scarborough and Nyirenda1981) and Nyirenda and Kayange (Reference Nyirenda and Kayange1984). Despite the fact that only specific rootstocks were effective in increasing the yield of the high-yielding clones, the magnitude of difference in yield between grafted and self-rooted scions was higher while using the high-yielding clone UPASI-28 as scions. Moreover, the scion clones TRF-1 and UPASI-28 are significantly more vigorous in terms of yield compared with the rootstock clones ATK-1 and UPASI-2. However, grafting the scions of TRF-1 on ATK-1; and UPASI-28 on UPASI-2 resulted in significantly higher yield compared with their respective self-rooted scions. This finding contradicts the earlier reports of Nyirenda and Kayange (Reference Nyirenda and Kayange1984) and Bore et al. (Reference Bore, Njuguna and Owuor1995), which stated that vigorous scions on weak rootstocks depress yield and exert negative growth effects. In contrast, grafting the scions of TRF-1 on the most vigorous and drought-tolerant rootstock clone TRI-2025 had no significant effect on productivity when compared with the self-rooted plants of TRF-1. The results clearly emphasize the scion–rootstock interaction as the critical determinant of productivity in grafted plants compared with vigour, drought tolerance and yield potential of scion and rootstock clones.
The composite plants of the high-yielding clones TRF-1 grafted on UPASI-9 and ATK-1; and UPASI-28 grafted on UPASI-9, UPASI-2 and TRI-2025 recorded significantly higher yield than those of either of the ungrafted partners. Similar results were obtained by Balasubramanian et al. (Reference Balasubramanian, Netto and Parathiraj2010) when grafting the scions of high-quality tea clone Cr-6017 on the rootstocks of UPASI-9. However, composite plants of the low-yielding scion clone TRF-2 grafted on all four rootstocks showed increased yield only over the self-rooted plants of TRF-2. The yield of ungrafted rootstocks was significantly superior to all the composite plants of TRF-2. These results clearly indicate that high-yielding capacity of grafted plants over the ungrafted scions and rootstocks is largely dependent on the yield potential of the selected scion clone and the degree of compatibility between the graft partners.
Role of yield components in productivity
Yield in tea is influenced by the number of pluckable shoots per unit area and their growth rate and weight. The increase in the number of harvestable shoots in the compatible graft combinations shows the influence of grafting on shoot replacement ratio as reported by Tuwei et al. (Reference Tuwei, Kaptich, Langat, Chomboi and Corley2008). Similarly, the increased weight of crop shoots as a result of increased inter-nodal length and leaf area observed in the compatible grafts in the same plucking intervals showed their faster shoot growth rate. In contrast, Tuwei et al. (Reference Tuwei, Kaptich, Langat, Chomboi and Corley2008) found no effects of grafting on shoot growth rate using a single set of measurements on phyllochron interval. However, the increase in percentage of shoots with actively growing buds in the compatible graft combinations compared with their corresponding self-rooted scions further confirms the influence of grafting on shoot replacement ratio and shoot growth rate in young tea plants.
Moreover, the increased number of second order branches in the successful graft combinations compared with their respective self-rooted scions is due to their increased number of pluckable shoots per unit area. As the bush gains height, an increased number of buds is likely to lead to an increase in branch number as observed by Nyirenda and Kayange (Reference Nyirenda and Kayange1984). The higher number of branches helps in establishing a wider canopy. Consequently, all the observed yield components were directly correlated to the total yield and this establishes their role in the productivity of grafted plants. The larger stem diameter and greater number of branches in compatible grafts indicates that the higher yield of composite plants was not obtained at the expense of canalization of dry matter into non-harvestable supporting organs. Hence, this could serve as an additional factor that influences yield, as reported by Satyanarayana et al. (Reference Satyanarayana, Cox and Sharma1992).
Influence of grafting on drought tolerance of composite plants
Performance of grafted plants during the drought period varied significantly depending on the scion–rootstock combinations. The increased field survival rate of TRF-1 grafted on UPASI-9 and ATK-1, and TRF-2 grafted on all four rootstocks after the first drought season showed their improved tolerance to drought. The earlier work of Ranjith and Ilango (Reference Ranjith and Ilango2016) on nursery performance of the grafted plants of TRF-1, TRF-2 and UPASI-28 indicated that root length and root biomass were considerably higher in all composite plants when compared with their respective self-rooted plants. Higher root length and biomass, which in turn could explore a wider area in search of nutrients and soil moisture compared with their respective self-rooted plants, might have contributed to the increased survival rate of grafted plants of TRF-1 and TRF-2 (Nyirenda, Reference Nyirenda1990; Stephens and Carr, Reference Stephens and Carr1991). Also, the higher yield and increased proline and chlorophyll content observed in compatible grafts of TRF-1 and TRF-2 during the drought period showed their improved tolerance to cope with the severity of drought.
However, higher root biomass reported in composite plants of UPASI-28 at the nursery level showed no effect on increasing their field survival percentage. This may be because the clone UPASI-28 shows slow establishment during the initial period of planting. The result also suggests that, other than mass and spread of the root system, the drought tolerance level could be an inherent trait of a variety as reported by Bore (Reference Bore2008). However, the magnitude of differences in yield and yield components recorded in the compatible graft combinations of UPASI-28 during the drought period clearly demonstrates their superiority over the self-rooted UPASI-28.
Proline accumulation in the ungrafted rootstock clones UPASI-9, ATK-1, UPASI-2 and TRI-2025 was considerably higher compared with all composite plants and self-rooted scion clones. Similar findings on proline accumulation in drought tolerant tea clones were reported by Esack et al. (Reference Esack, Shanmugam, Palanisamy, Lakshmipathy, Chandrashekera and Rajagopal2015) in India and Maritim et al. (Reference Maritim, Kamunya, Mireji, Mwendia, Muoki, Cheruiyot and Wachira2015) in Kenya. However, a more detailed study is needed to obtain solid conclusions on proline accumulation in grafted plants in comparison with self-rooted tea plants. The lower values of the observed yield components during the drought season compared with the growing seasons in all the grafts and standard clones are due to the physiological and morphological adjustment undergone by the plant during water stress as observed by Bore et al. (Reference Bore, Ng'etich, Masinde and Kahangi2014). Similarly, differences noticed in the chlorophyll content of ungrafted scion and rootstock clones is because of their clone-specific responses.
Conclusion
The findings of the current study establish the influence of various morphological, physiological and biometric factors on increased productivity and drought tolerance of grafted plants. It is also concluded that nursery grafting can offer a potential solution for overcoming the drought susceptibility of high-yielding clones and low yield potential of high-quality clones. Differences in the yield of a scion with different rootstocks clearly show the significance of stock–scion compatibility. The current results also suggest that drought tolerance and vigour are not the only criteria for a good rootstock, and that yield potential of a scion is not a good guide to judge its response as a scion. Since there is a significant influence of scion–rootstock compatibility, various clonal combinations must be evaluated in the field for identifying better composites for large-scale planting. Based on the results of the current study and an earlier report on compatibility showing percent success in the nursery and growth of grafted plants, the following combinations for commercial adoption are recommended:

Supplementary material
The supplementary material for this article can be found at https://doi.org/10.1017/S0021859619000480.
Acknowledgements
We sincerely thank Dr P. Mohan Kumar and Dr B. Radhakrishnan, former and present directors of UPASI-TRF who provided insights and expertise that greatly assisted the research. Special thanks are due to our former and present farm superintendents Mr A. Robert Gunasekaran and Mr A. Ramesh and the technical staff Mr S. Ramakrishnan of UPASI-TRF for their extensive support and assistance. We are also immensely grateful to the farm workers of UPASI-TRF who provided a great effort in maintaining the experiments. Also, we greatly appreciate the support of Mr Chandrasekar, Field officer and Nursery-in-charge, M/s Nallakathu Estate and the management of Woodbriar group, Valparai for the propagation of grafted plants. Finally, we acknowledge the anonymous reviewers for their so-called insights.
Financial support
This research received no specific grant from any funding agency, commercial or non-profit sectors.
Conflict of interest
None