Introduction
The study and interpretation of changing burial practices has generated an extensive corpus of archaeological literature (Parker Pearson Reference Pearson1999). Within the broad field of mortuary analysis, collective burials present a particular challenge, with repeated use of a single burial focus over longer or shorter periods of time. Yet repeated use does not imply fixed and unvarying funerary practice, and collective tombs provide an excellent basis for the analysis of changing burial practices.
The collective monumental graves of Late Neolithic Western and Northern Europe represent an ideal database for this kind of analysis, with many individual episodes of funerary ritual occurring over a period of several centuries within the same settings (Salanova Reference Salanova2000; Chambon Reference Chambon2003). They extend from Brittany and Atlantic France in the west to Denmark and Sweden in the north, but, among them, the collective graves of the limestone areas of northern France are of particular interest owing to the quantity and excellent preservation of the human remains that they contain. Research has, in particular, focused on using the dead for reconstructing symbolic and social aspects of prehistoric belief and practice (Leroi-Gourhan et al. Reference Leroi-Gourhan, Bailloud and Brezillon1962; Valentin Reference Valentin1997).
An overview of the radiocarbon dates from monumental tombs across northern France demonstrated that the main phase of construction fell around 3200 BC, with continuing use but a decreasing number of burials until the end of the third millennium BC (Chambon & Salanova Reference Chambon and Salanova1996). During the fourth millennium BC, burial practices were quite similar from one monument to another, with access to the grave for a large section of the population and few grave goods (Chambon Reference Chambon2003). Later use of the collective graves during the third millennium BC is, however, poorly represented, except by the presence of grave goods used as markers for differentiating individuals (Salanova & Sohn Reference Salanova, Sohn, Baray, Brun and Testart2007). This is evidenced by, for example, flint daggers, which circulated over long distances, and Bell Beaker pottery, manufactured from around 2500 BC throughout much of Europe (Salanova Reference Salanova and Guilaine2002). The comparatively low number of individuals buried during the third millennium BC in both collective monuments and individual graves throws into question the dominance of this practice during this period (Salanova Reference Salanova, Salanova and Tchérémissinoff2011). Other burial practices, such as the scattering of bones in domestic contexts, have been identified but remain too few to compensate (Pariat Reference Pariat2007). Moreover, the low number of burials also leads us to question whether the population using these graves maintained a continuous identity throughout this period.
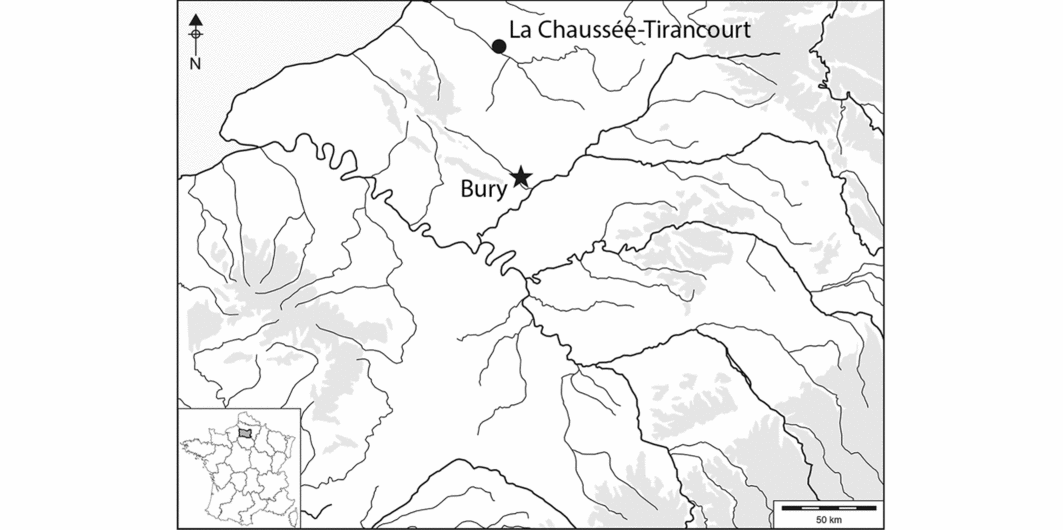
Advances in field and laboratory techniques allow new approaches to understanding these changes that occurred during the third millennium BC. In this study, we consider the gallery grave of Bury, one of the best-preserved sites of its kind known in northern France. Located 60km to the north of Paris, in the Oise department, this grave is unique because excavations revealed that the complete stratigraphic sequence was preserved (Figure 1).
Map showing the location of Bury and La Chaussée-Tirancourt.

Archaeological context
Located in a private garden, the Bury grave was discovered in 1998, just below the modern soil horizon (see Figure S1 in online supplementary material). The grave was built around the middle of the fourth millennium BC on the lower slope of a hill, 30m above the current course of the Thérain, a tributary of the Oise River. It was surrounded by six other collective graves within a radius of 10km, all of which had been destroyed or emptied between the seventieth and the twentieth centuries BC (Bailloud Reference Bailloud1974). The Bury grave was constructed within a forested environment, with no obvious evidence of human activity in the surrounding area.
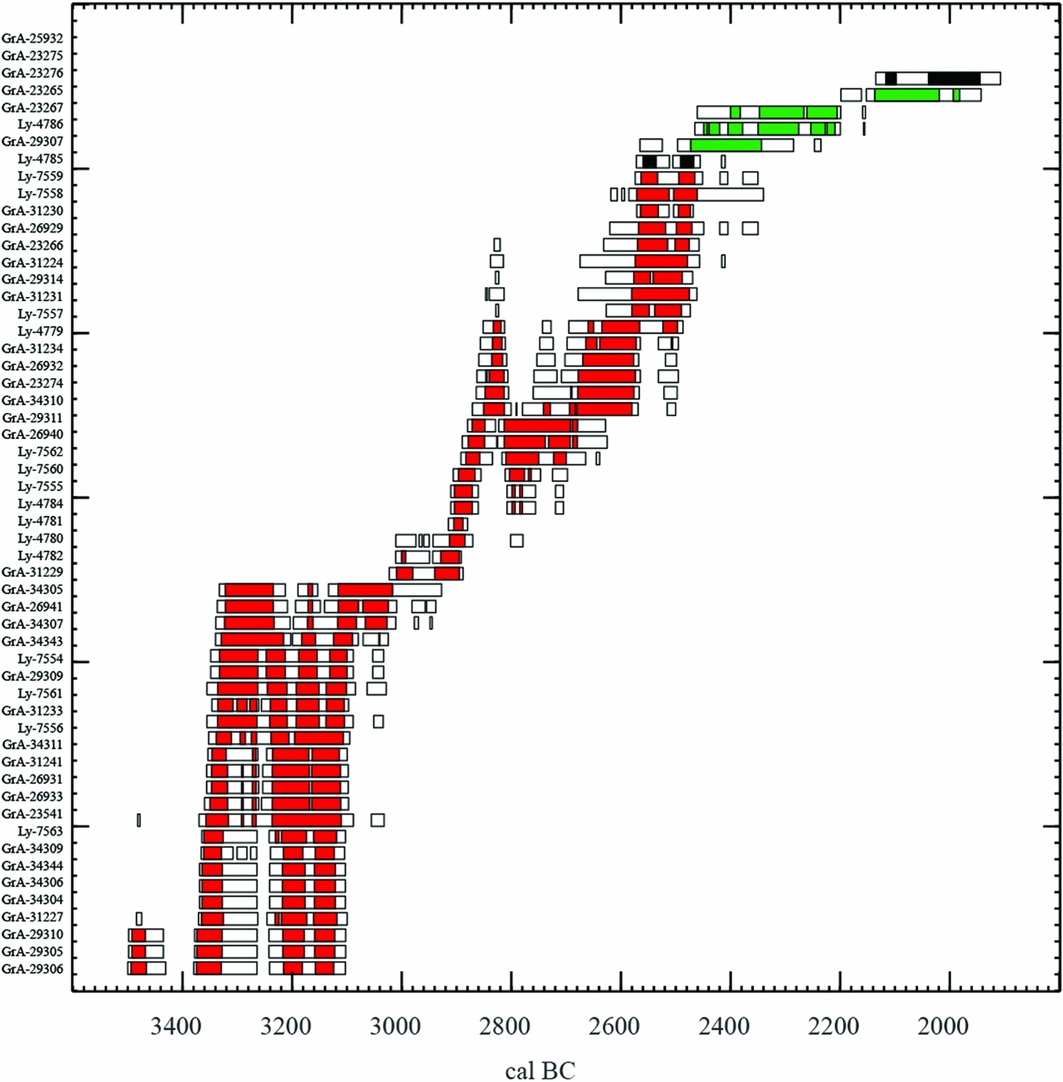
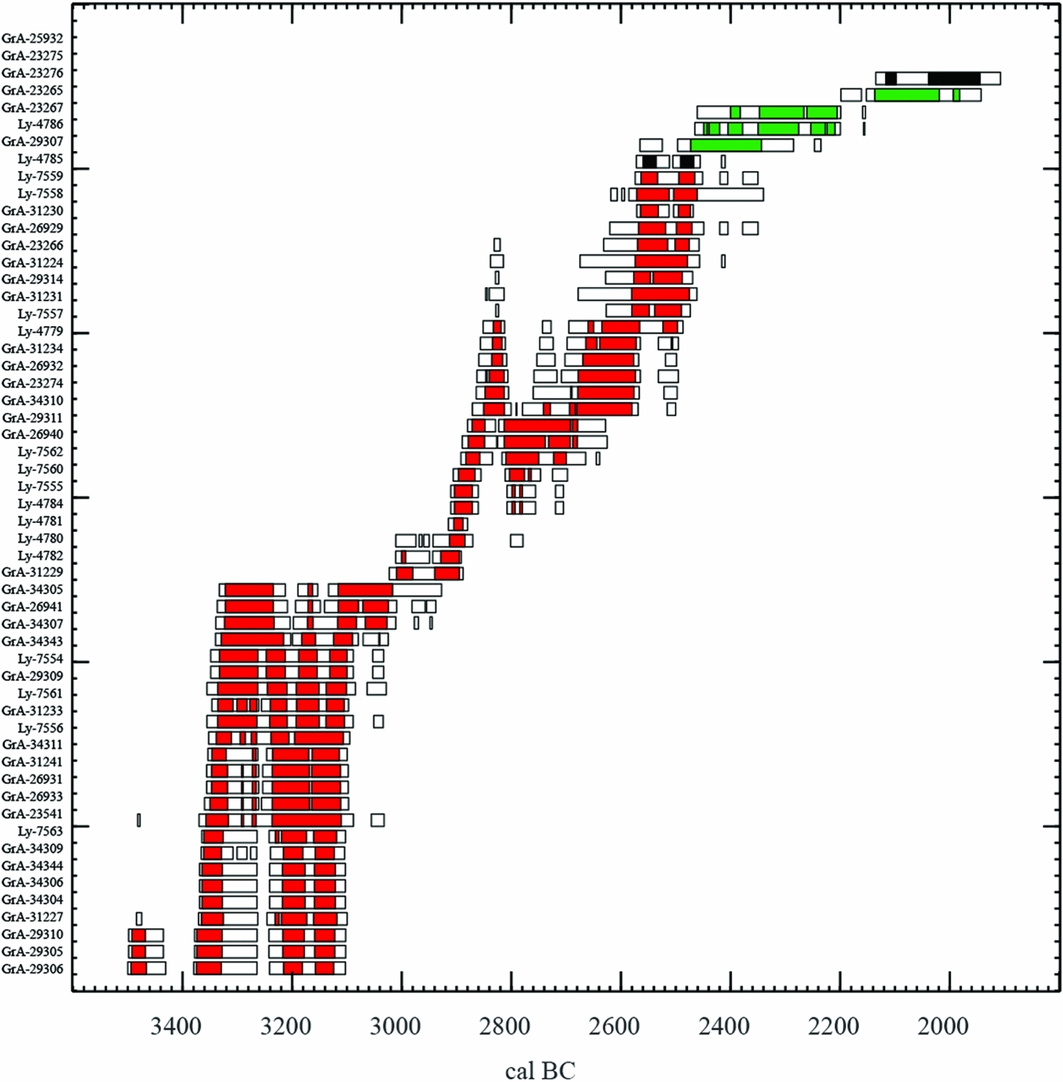
The ongoing ‘Times of Their Lives’ (TOTL) programme, supervised by Alex Bayliss and Alasdair Whittle, is currently working towards a precise chronology of the duration of the events within the formation of the tomb deposits. Initially, 55 dates were obtained from the most complete human skeletons, as well as from animal bones and organic material from a hearth and a pottery vessel. These initial results show, in their maximum ranges, that the grave was used between 3500 and 1950 BC (Figure 2). They also indicate three main phases of deposit. The first, between 3500 and 3000 BC, corresponds to the Late Neolithic of northern France. The second, between 3000 and 2470 BC, includes the Final Neolithic and the first stage of the Bell Beaker group. The third phase, grouping several events until 1950 BC, refers to the developed Bell Beaker group and the Early Bronze Age. This third phase, poorly understood in northern France, is represented only by fauna and pottery deposits, as no human bones were deposited during this final use of the site.
Radiocarbon dates from human bones (red), animal bones (green) and organic material (black). Calibrated with CALIB (Stuiver & Reimer Reference Stuiver and Reimer1993).
The main stages of site use
The building phases
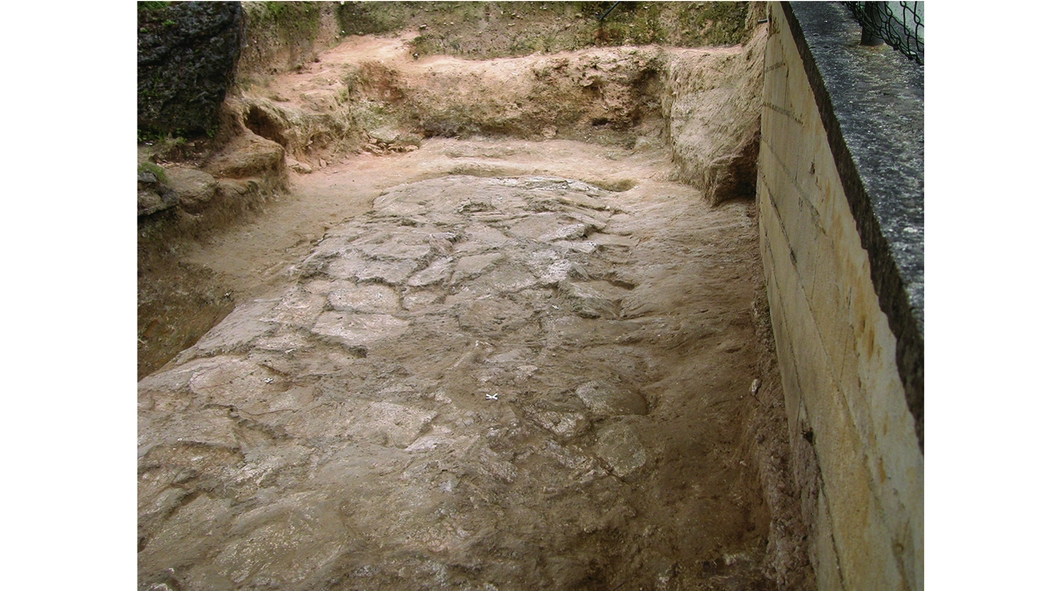
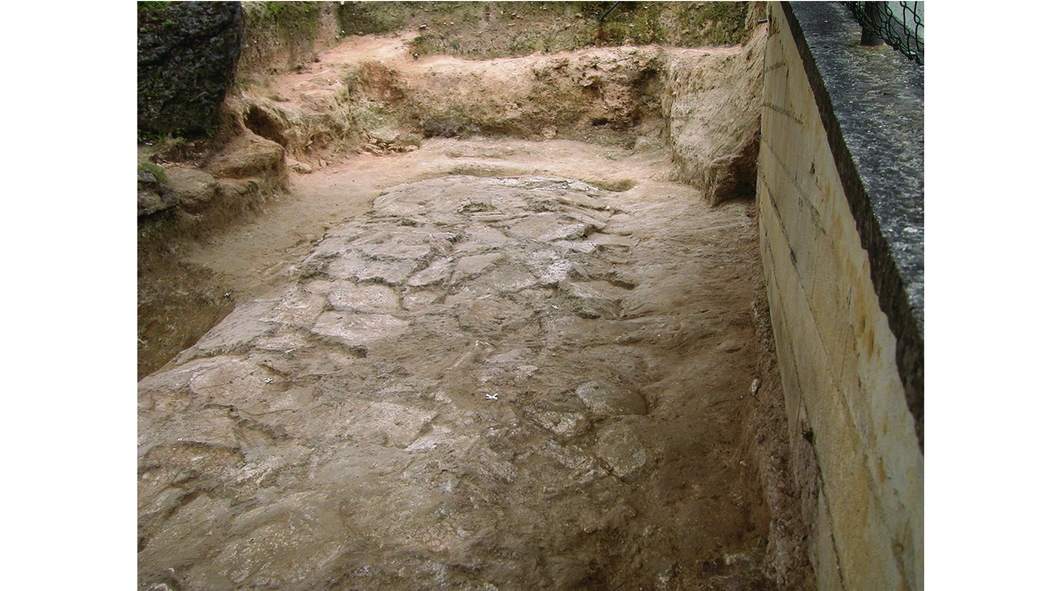
The Bury grave respects the architectural norm of other gallery graves in the Paris Basin, which are always below ground level, with a long, paved rectangular chamber preceded by a short vestibule. The pit in which the monument was initially set is partially preserved. The stratigraphy recorded beneath the pavement of the chamber shows rare examples of earthworks that existed there before the erection of the monument (Figure 3).
View from the south of the monument's pit. In the foreground, the state of the soil beneath the pavement clearly indicates earthworks before the erection of the monument.
At 20m long, Bury is one of the longest known collective graves, which in northern France generally measure around 9m in length. This maximum length was, however, the extent of the grave at the beginning of its use. Many modifications were made over time, and the chamber was finally shortened to around 7m.
Despite the long duration of its use, the original walls of the monument, built mainly of dry stones and perishable materials (primarily earth and wood), remained. The floor of the chamber was paved with flagstones, and the entrance was marked by a porthole slab (see Figure S1). Such porthole slabs are known at several monumental graves from the Paris Basin, but the example from Bury is unique in being equipped with a sophisticated locking system (Salanova Reference Salanova, Sohn, Baray, Brun and Testart2007). A wooden floor probably covered the pavement. Calcareous megalithic slabs, collected within close proximity to the grave, were also used in the construction, but the original positioning of these elements has not been preserved. The unusual length of the grave and the presence of megalithic elements appear to correlate with the grave goods, which are characterised by a higher than normal quantity for collective monuments in this region.
The burial layer
The inhumations, recovered from a layer 200–300mm thick, include a total of 299 identifiable individuals. Of these, 182 were recorded with a precise location within the layer. Despite the fact that the burial practices were collective throughout the use of the grave, the organisation of the dead varied over time.
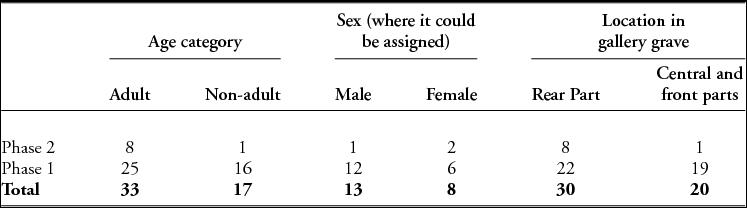
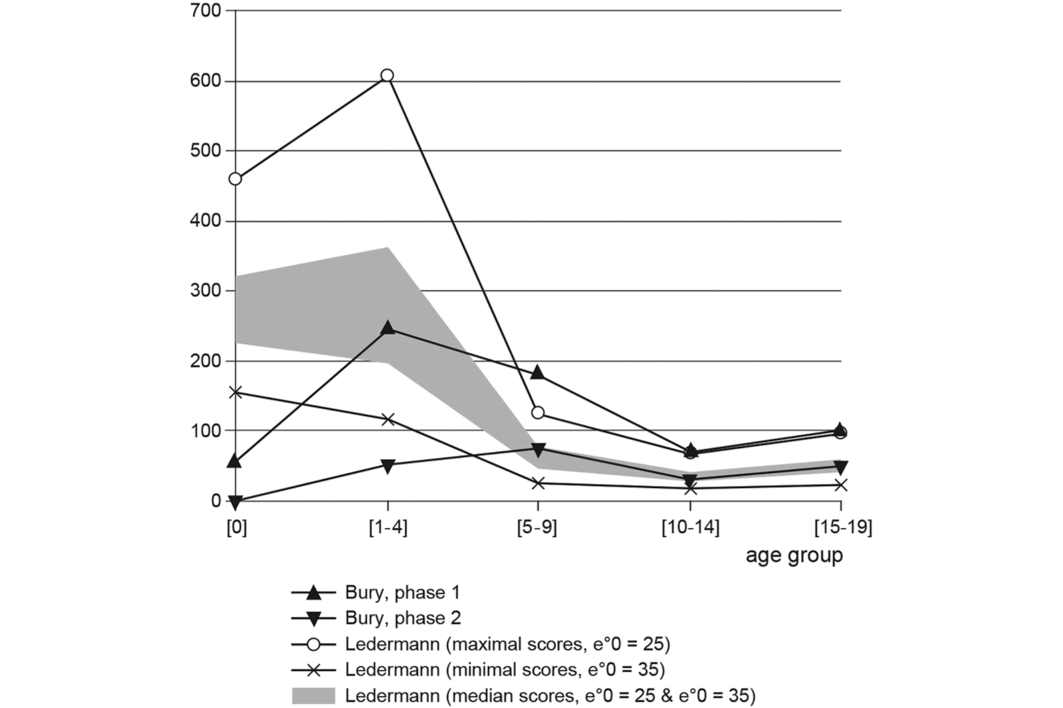
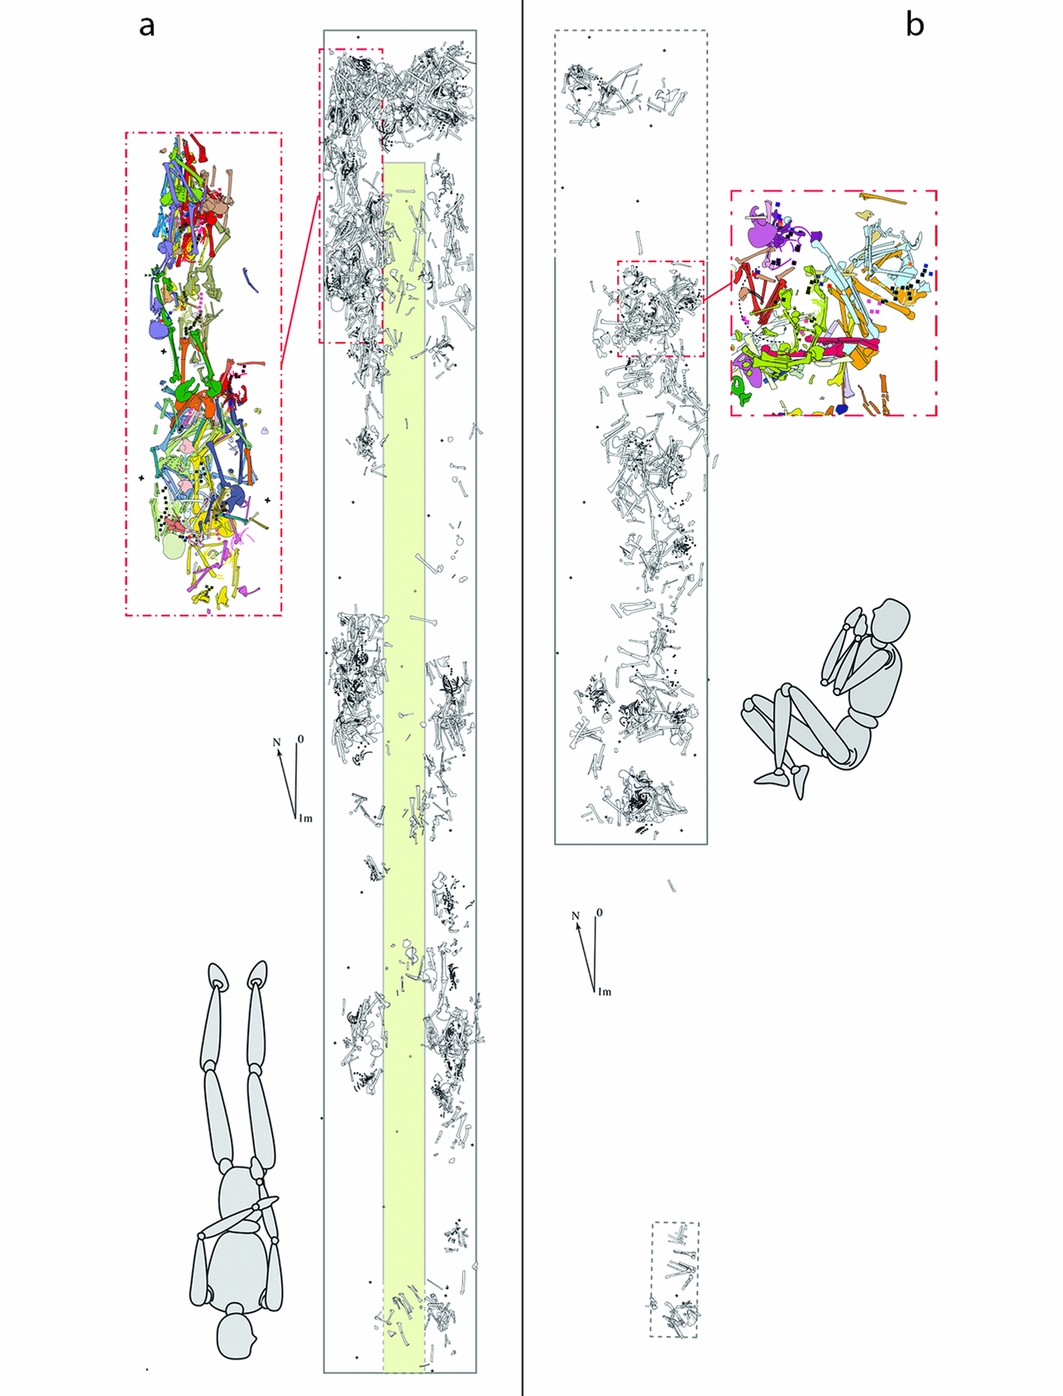
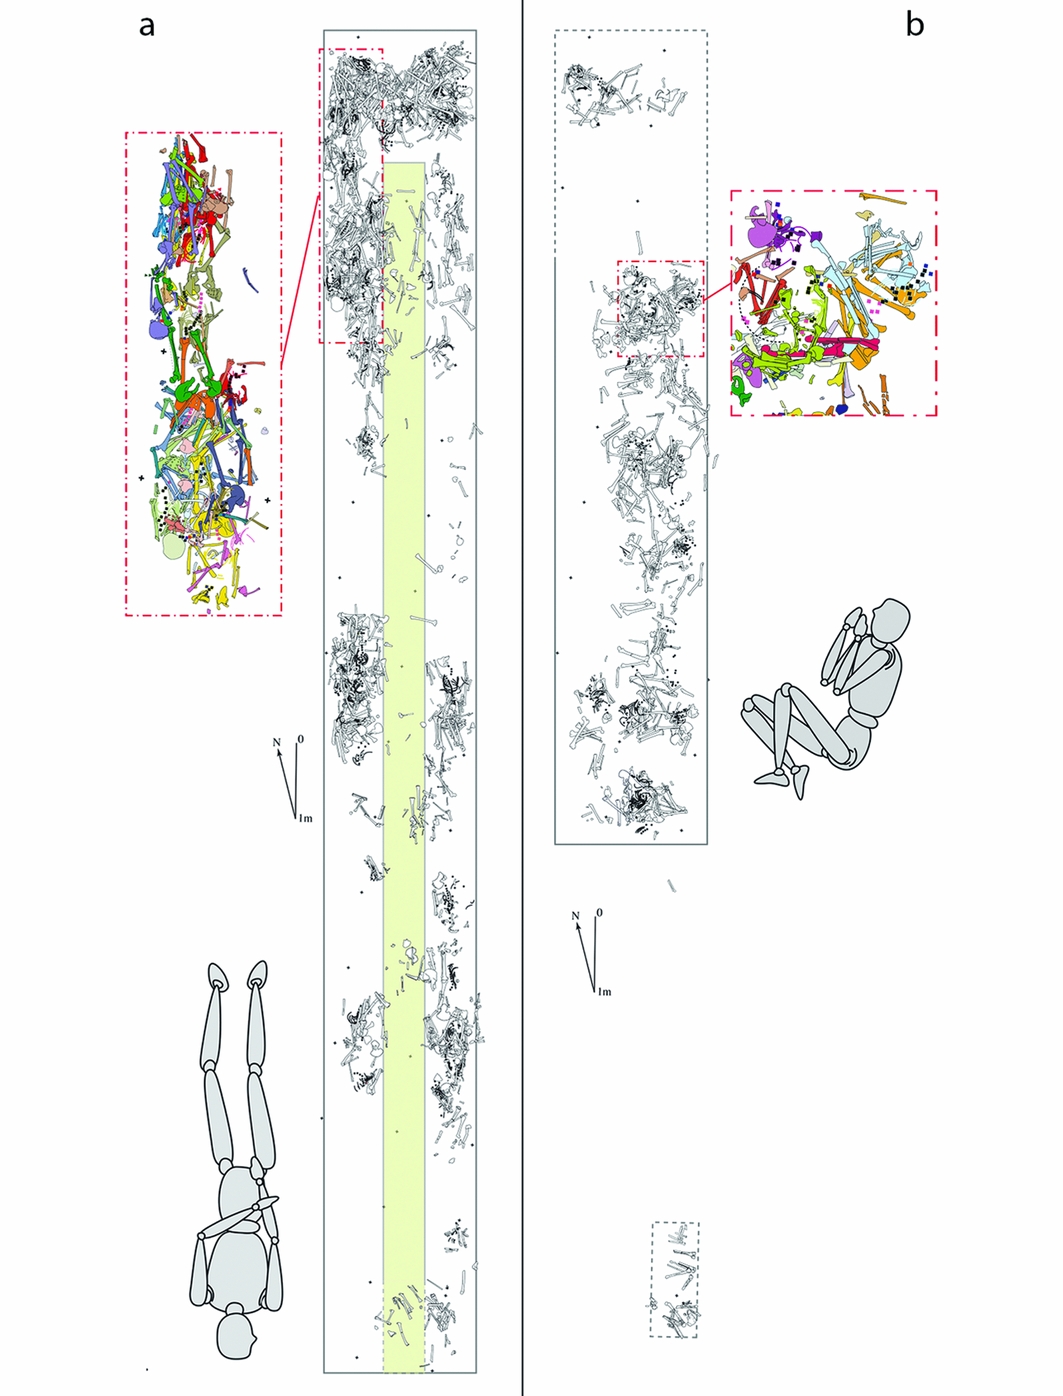
During the earliest phase of the gallery grave (the second half of the fourth millennium BC), the demographic profile of the population is broad, with the exception only of children under one year of age, who are missing (Table 1). Children of the 5–9-year age group are, however, too numerous relative to their expected frequency in a pre-Jennerian population (i.e. before vaccination) (Figure 4; Sellier Reference Sellier and Piningre1996). The burial deposits in this period were divided into three zones: two along the walls, with an empty area separating them, and a third one in the rear of the chamber (Figure 5a). The skeletons were laid on their backs, with extended lower limbs, their arms alongside their torsos, and with forearms flexed or extended. Their orientation respected the main axis of the grave, with their heads towards the entrance. The skulls of the adults were removed after decomposition, but the post-cranial bones remained in situ.
Data on 50 partially articulated skeletons from the Bury gallery grave. Sex of adults was assessed on coxal bones based on Bruzek's (Reference Bruzek2002) methods. Age at death of adults was assessed based on Schmitt's (Reference Schmitt2005) methods. Age at death of non-adults was estimated using the age ranges of dental eruption and mineralisation, of epiphyseal union, and of diaphyseal length (Scheuer & Black Reference Scheuer and Black2000).

Mortality profiles for the two main burial phases. Following Sellier (Reference Sellier and Piningre1996), the table-type of Ledermann (Reference Ledermann1969) was used as a comparison. The principle of ‘minimisation’ of age determination errors was also applied. The distinct representation of the first three age groups between the two phases is very clear.

Organisation of the grave during the two main phases (a: phase 1; b: phase 2), with a focus on a small part of the deposits, and the main burial position. In the earliest period, the deposits are made in two narrow burial areas in both sides of the chamber, preserving an axial passage in the middle. During the second phase, there is no standardised orientation. Note also the small isolated burial cell near the former entrance of the chamber.
The grave goods from the first phase of deposits are mainly characterised by a few arrowheads. A relatively high quantity of pottery (183 fragments) is also attributed to this first series of burials. These vessels were shell tempered with thick, friable, irregular walls. Most of the fragments were found in the closure layer. Along with the polished stone axes that were recovered, the pottery fragments were probably associated with the earliest deposits and were moved together with some bones when the inhumations were finally covered by layers of stones.
The eastern part of the chamber was all but completely emptied following a remodelling of the grave during the first half of the third millennium BC. In the inner area of the new chamber there was no longer any differentiation between spaces left clear for movement within the grave and places reserved for funerary deposits (Figure 5b). During this second phase, the whole of the chamber floor area was used for burials, although the successive interment of a group of two to four individuals in one place suggests that some locations were temporarily reserved as focal points for burial. This second phase of use was more restrictive in its population profile. Almost all children under five years old were excluded. Bodies were hyperflexed, without any preferred orientation. After decomposition, skeletons were often disturbed, and excavation has revealed rearrangements of bones grouped into bundles, and skulls placed along the grave walls. Flint daggers and bone pins were found near the bodies. It seems, however, that no bones were removed from the grave during this period.
The closure events
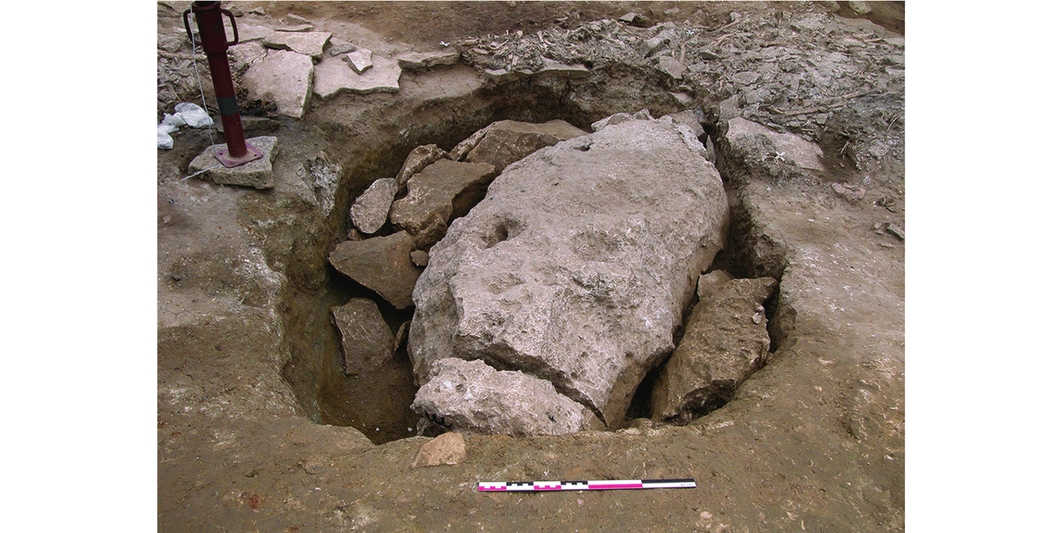
The procedure of the monument closure was complex, and comprised several events of destruction and concealment, using a variety of techniques to hide the burial chamber (Leclerc Reference Leclerc, Duday and Masset1987). A layer of stones was deposited to cover the burial layer after the walls and the roof of the chamber had been partially destroyed. Some of the megalithic slabs were also broken, an undertaking that would have required substantial effort (Figure 6).
View from the west of a megalith, found in the front part of the grave, broken in situ and buried during the closure of the monument.

These closure events occurred in several stages. The most reliable dates come from the layer of stones above the burial layer, and point to the end of the third and beginning of the second millennium BC. The morphology of the stones and their spatial distribution are not uniform from one end to the other across the whole of the grave. The rear of the chamber, where the deposits were sealed by a heavy megalithic slab weighing 5 tonnes, provided a more detailed sequence.
The detailed sequence from the rear of the monument
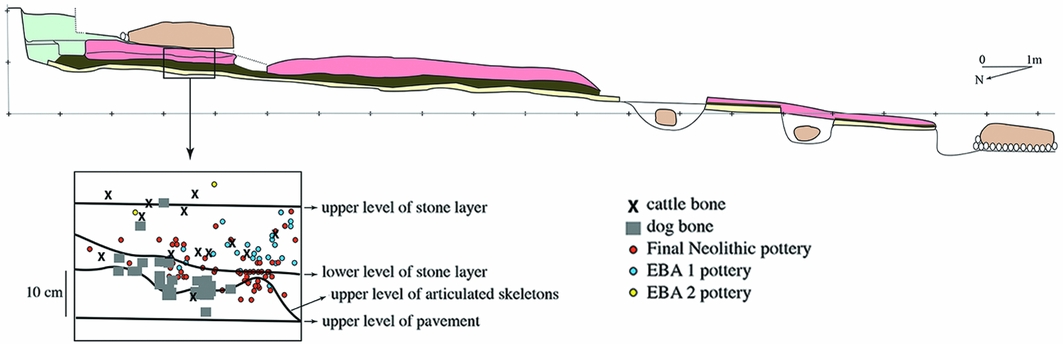
Several sectors of the grave had been disturbed by more recent activities, as demonstrated by the presence of medieval and modern pottery fragments. The detailed sequence from the rear of the monument was protected, however, by a large slab overlying the deposits (Figure 7).
North–south profile of the monument with detailed stratigraphy of the rear sector. The pavement is depicted in yellow, the burial level in khaki, the stone level in pink, the megaliths in light brown, and disturbed layers at the rear of the monument in light green.

The earliest deposits from this sequence yielded the remains of several individuals dated to the Late Neolithic (GrA-26933: 4520±40 BP, 3360–3100 BC; GrA-29305: 4575±45 BP, 3450–3100 BC (all date ranges are given at 95.4% confidence)). Only a few artefacts, mostly flint flakes and arrowheads, were associated with these individuals. The layer directly above this contained unarticulated human bones, associated with fragments of thick-walled red pottery and the remains of at least one dog. A human hand, still articulated, allowed this phase to be dated to the Final Neolithic (GrA-26940: 4190±35 BP, 2890–2640 BC).
The stones that covered the burial chamber were deposited in two layers. In the lower of the two, the stones were laid flat in a green clay soil, and were associated with unarticulated bones and red burnished pottery, including one incomplete undecorated Bell Beaker. The stones of the upper layer, set within brown silt, are more disorganised. They are associated with the remains of cattle and pig and fragments of pottery (Early Bronze Age 1) characterised by shell temper. Organic residues from one vessel were dated to between 2135 and 1905 BC (GrA-25932: 3640±40 BP). In the upper of the two stone layers, two fragments of flat vessel rim with finger impressions (Early Bronze Age 2) provide a chronological marker for the deposition of the huge megalithic slab, which caps the whole sequence.
Palaeobiological variation within the population
Sample and methods
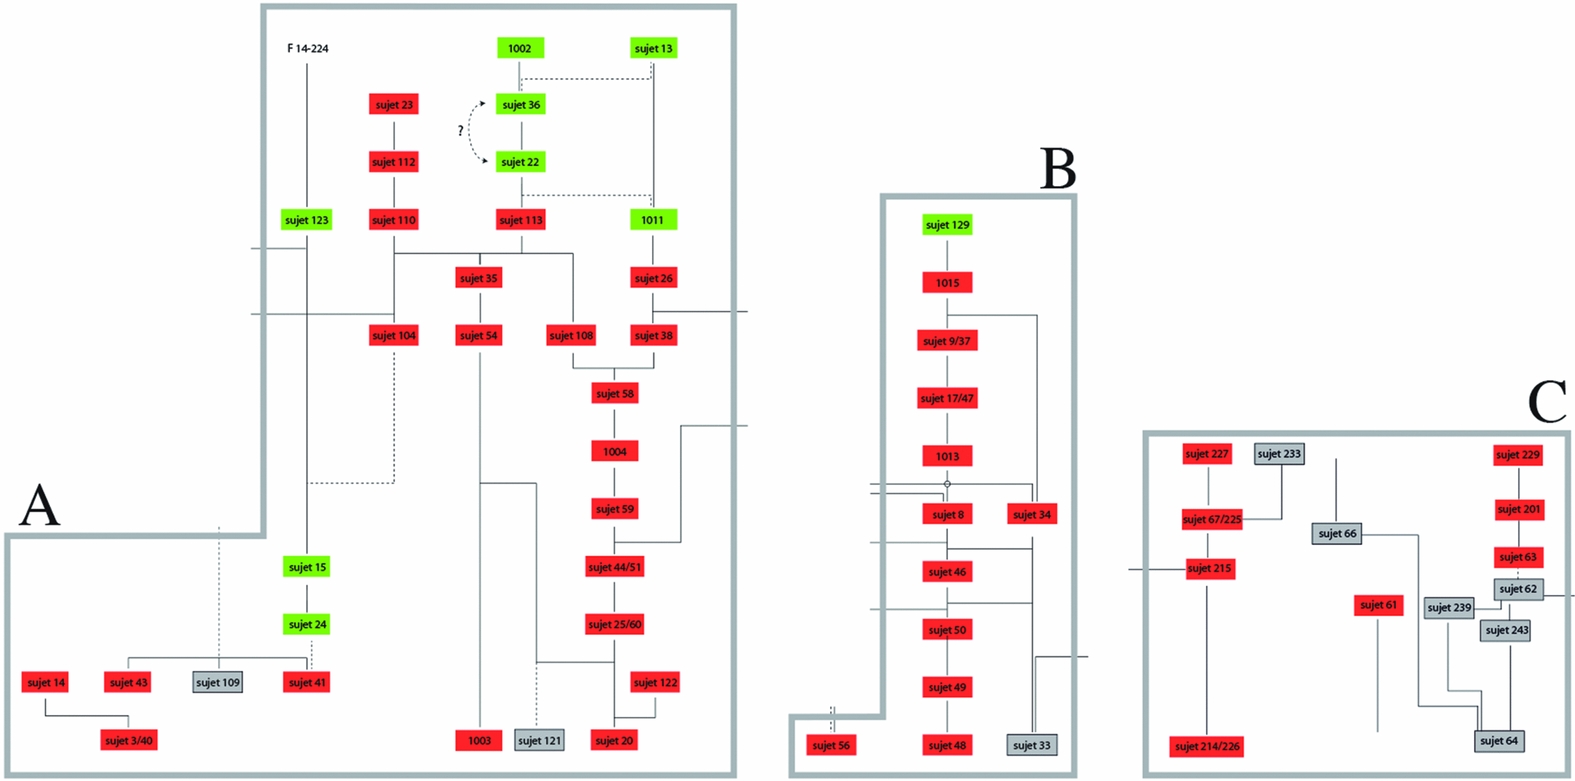
Variation in the morphological features of the buried individuals was assessed across the two chronological phases of human deposits. Data were recorded on 50 partially articulated skeletons, located in the front, centre and rear areas of the tomb (Figure 8; Table 1). The sample includes 41 individuals (including 16 non-adults) from phase 1, and 9 individuals (including one child aged about two years) attributed to phase 2. The selected sequences in the deposition of these selected remains, phases 1 and 2, cover a period between 3500 and 2470 BC (Figure 2). With the goal of deciphering differences between the two periods, we have assessed the age at death and the sex of the adults, measured the length and circumferences of humeri and femora, and recorded 30 humeral and femoral morphological features that are generally recorded in populations from the same period and region (Valentin Reference Valentin1997) (Table 2 and Tables S1 & S2 in online supplementary material). Chi-square tests (at 5% and 10%) were used to compare the individuals from the two phases (Table 2 and Tables S1 & S2).
The three sequences for the study of the population of the grave, selected because they are the most complete: from the rear (A), the centre (B) and the front (C) of the chamber. Individuals in red are from the earliest phase, those in green from the second phase and those in grey could not be used due to age or bone preservation. Sujet = individual.

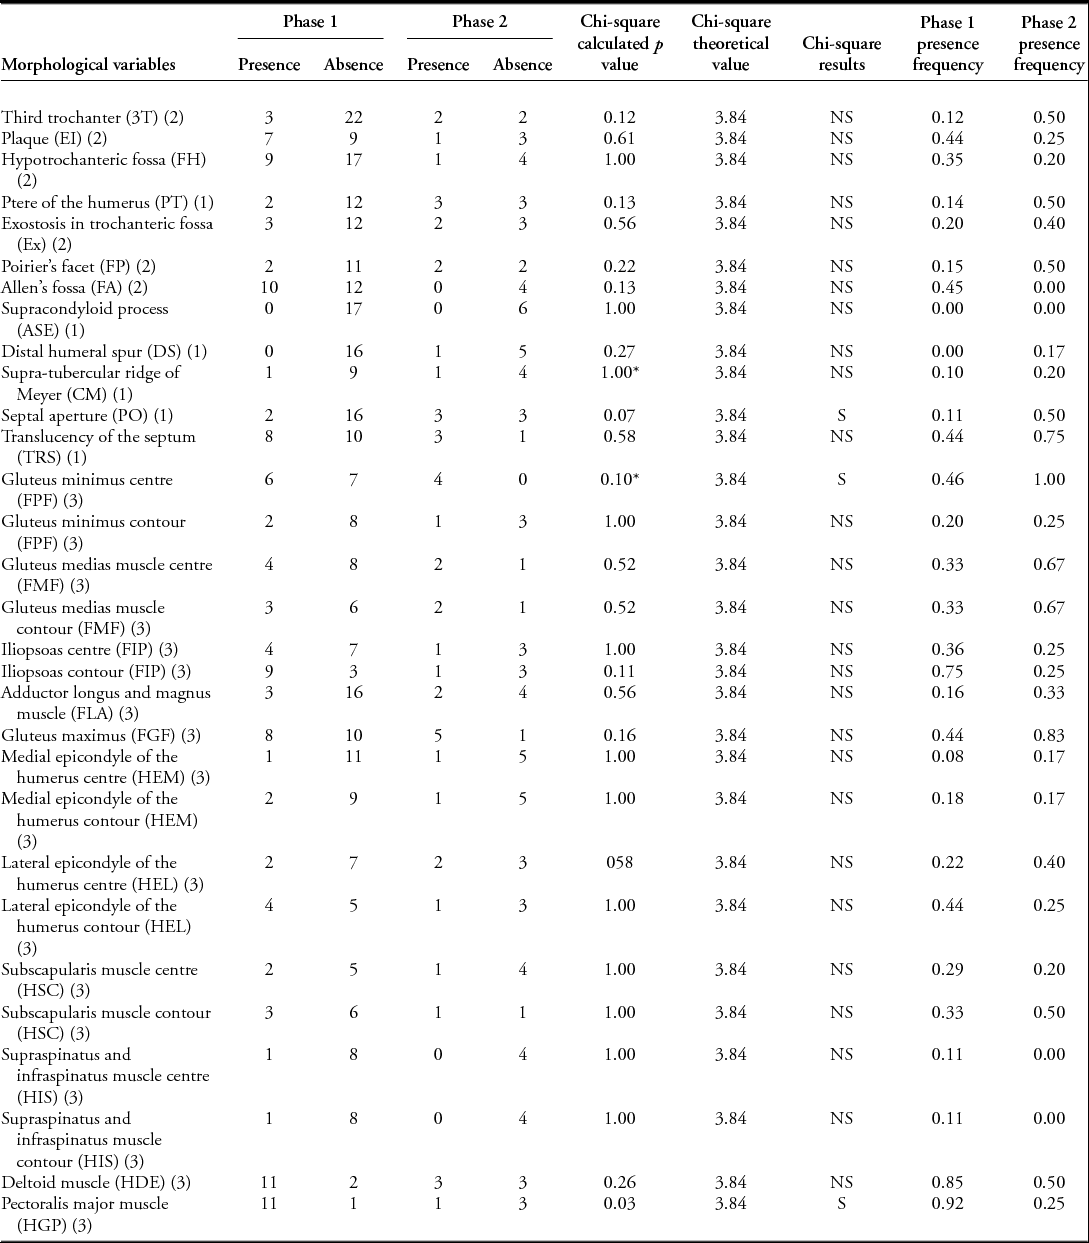
Presence/absence of morphological features by phases (1–2) of inhumation, and chi-square test results; S: significant; NS: non-significant; (1) Voisin Reference Voisin2012; (2) Verna et al. Reference Verna, Pierececchi-Marti, Chaumoitre, Panuel and Adalian2014, (3) Villotte Reference Villotte2009; *: denotes where the statistical limit to be significant was not reached.

Comparison between the two periods of use
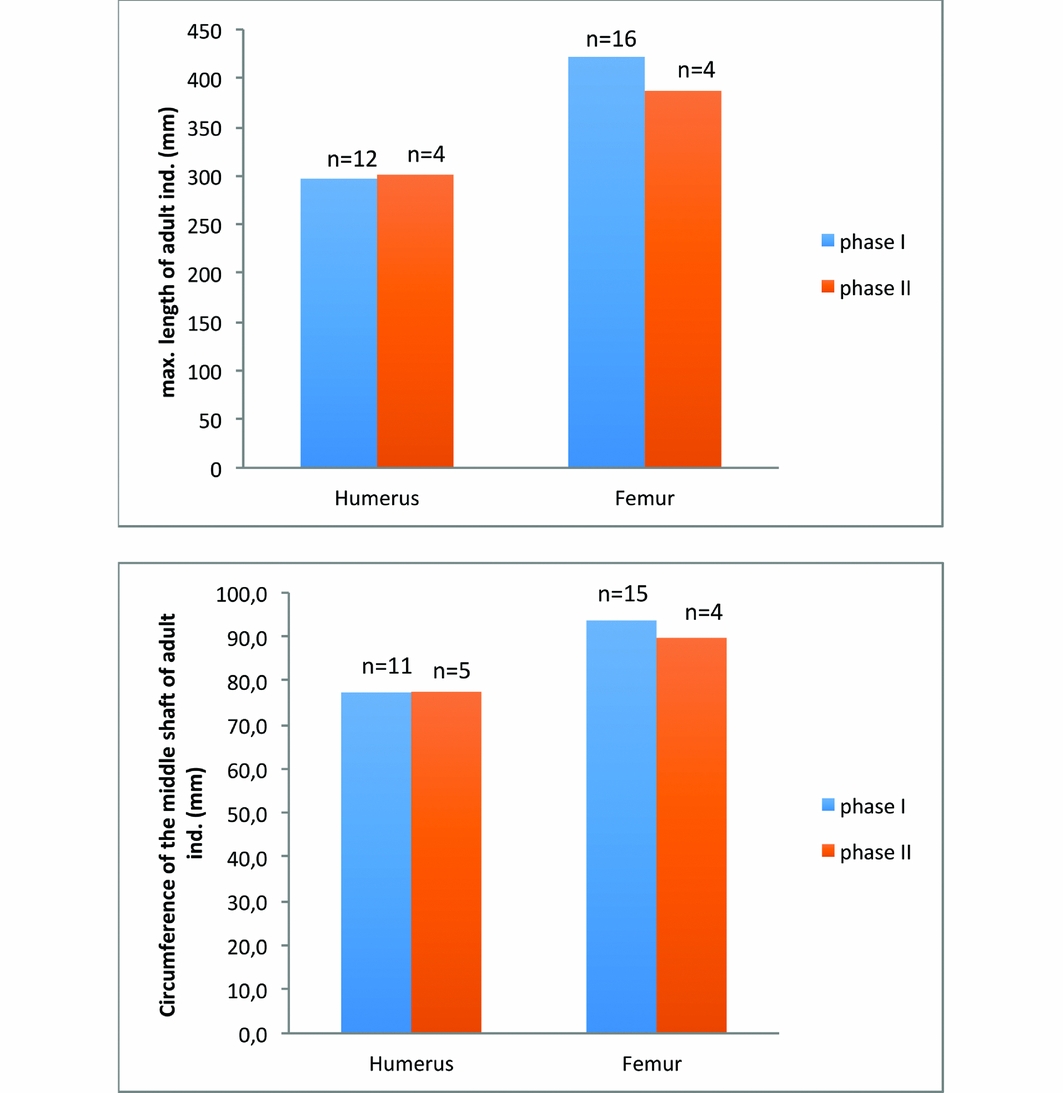
The number of individuals, as well as the number of non-adult burials, varies greatly over time, while the number of males and females is evenly distributed. Change in morphology over time is barely perceptible. The length and circumferences of adult humeri and femora do not change significantly (Figure 9), although 2 of the 30 morphological features that were assessed exhibit a statistically significant difference (at 5%) between the two phases of inhumation (Table 2). A fainter development of the muscular attachments of the pectoralis major (HGP) and the presence of a septal aperture (PO) distinguish individuals from the second phase of inhumation from those of the first. Another comparison, focused specifically on the individuals buried at the rear of the monument (Table S1), further highlights this decrease in the development of the pectoralis major muscle attachment (HGP) and revealed an increased frequency of translucency of the humeral septum (TRS) in the second phase (Table S2). As observed in other populations from the same region and period (Perrier du Carne & Manouvrier Reference Perrier du Carne and Manouvrier1895), at Bury the presence of this feature (TRS) appears to be correlated with the presence of septal apertures (PO).
Maximum lengths and circumferences of adult humeri and femora, measured according to Martin and Saller's (1957) standards, with histograms by phases (1–2) of inhumation.

Permanence and changes
These initial results of the bio-anthropological study show that the gallery grave of Bury was the preferred burial place of a single prehistoric community. There are no real changes in size and shape, and few morphological variations throughout the sequence of the burial layers. Such a pattern does not support the hypothesis of a population replacement over time, but rather suggests a continued use by the same population. The morphological distinction between the two phases is related to a variable development of one muscle attachment site and a particular feature of the ulna, suggesting that individuals from the two phases might have practiced different daily activities. By extension, they may have been affiliated with different subsections of the overall population. Further elucidation of these activities is, however, constrained by both the nature of the skeletal assemblage, as individual patterns of muscle attachment modifications are only fragmentary, and by the nature of the observation, as the aetiology of these alterations appears multifactorial (Villotte & Knüsel Reference Villotte and Knüsel2013). Use of the grave has nevertheless changed over time, mainly seen in the number of non-adult individuals. Fewer people, and almost no children younger than five years old, were buried in the second phase.
Discussion
Collective monuments have often been interpreted as stable markers for a community (Furholt & Müller Reference Furholt, Müller, Furholt, Lüth and Müller2011). The long-term sequence from the Bury gallery grave provides evidence of numerous activities that happened inside the monument, as well as numerous individuals interred with different burial practices. The stratigraphy from the rear of the tomb presented here reveals successive changes in burial rituals from the lowest to the highest layers. In the lower part of the stratigraphy, some articulated skeletons remained undamaged. Indeed, throughout the whole sequence, the human remains were preserved from erosion. The incomplete emptying of the grave after the first period, and the violent breakage of the megalithic components during its closure, after the second period, suggests that the memory of the place and its preservation were not constant over time. The preliminary bio-anthropological results suggest a single population throughout the burial sequence (3500–2470 BC). The most important changes occurred at the beginning of the third millennium BC. Demographic profiles, and grave goods used to mark out particular individuals, suggest that in this final period selection for burial was restricted to a particular subset of society. At the same time, the architecture of the burial chamber was substantially modified, and there were changes in both the use of space and the human remains. Skeletons in this phase were often subjected to intentional disturbance and rearrangement. It is only in this second phase of use that the monument was monopolised by a small part of the initial community.
Points of comparison are scarce, because few monuments have been sufficiently well preserved for long-term spatial analyses (Valentin Reference Valentin1997). Recently published data indicate that changes in burial practice are characteristic of the transition from the fourth to the third millennium BC in France. The stratigraphy from La Chaussée-Tirancourt, 80km north of Bury, showed two main phases of deposition. The dating of the layers is, unfortunately, less precise than in the Bury grave. The first (c. 3300–2800 BC) is characterised by an arrangement of burials in the rear of the chamber. There was a high frequency of children among the dead (Leclerc & Masset Reference Leclerc and Masset2006). During the second phase (c. 2700–2500 BC), the burial chamber was organised into separate cells, which it has been suggested represent kin groups (Scarre Reference Scarre1984). In southern France, the megalithic grave at Ubac, Vaucluse, had a similar history of development, with a shift around 3000 BC marked by a reorganisation of the monument and renewal of burial practices (Bizot & Sauzade Reference Bizot, Sauzade, Robin, D'Anna, Schmitt and Bailly2014).
It is always difficult to interpret changes in burial practices, especially as variability may relate to collective trends, linked to the historical and social contexts, or to the more specific circumstances in which the buried individual died (Binford Reference Binford, Cherry, Scarre and Shennan2004). The archaeological data from other sites in northern France do, however, help to contextualise the Bury gallery grave. The discontinuous events observed during the long-term sequence of inhumation at Bury could be the signature of depopulation over the course of time, although the existence of domestic contexts dated from all of the periods during which the Bury collective grave was in use contradicts this theory (Salanova et al. Reference Salanova, Brunet, Cottiaux, Hamon, Langry-François, Martineau, Polloni, Renard, Sohn, Bostyn, Martial and Praud2011; Cottiaux & Salanova Reference Cottiaux and Salanova2014). Alternatively, each break in the use of the grave corresponds to increased differentiation among the dead (Salanova & Sohn Reference Salanova, Sohn, Baray, Brun and Testart2007). These reorganisations in burial contexts find parallels in the domestic patterns of this period (Salanova Reference Salanova, Koch and Cunliffe2016).
Indeed, the first break was marked in north-western France by the appearance between 2900 and 2400 BC of long domestic buildings with standardised architecture, which suggest the emergence of large isolated farms (Tinevez Reference Tinevez2004). Some of these sites have been interpreted as places dedicated to specialised activities for a larger community (Joseph et al. Reference Joseph, Julien, Leroy-Langelin, Lorin, Praud, Bostyn, Martial and Praud2011). The second break, around 2400 BC, observed both at Bury and in the regional sequence, was marked by the development of the Bell Beaker group (Salanova et al. Reference Salanova, Brunet, Cottiaux, Hamon, Langry-François, Martineau, Polloni, Renard, Sohn, Bostyn, Martial and Praud2011). Bell Beaker domestic contexts are poorly preserved, but are mainly characterised by settlements of short duration in specific positions in the landscape (Salanova Reference Salanova2000). Times of change both in the symbolic and domestic fields have been mentioned widely in different periods. This repeated correlation demonstrates the potential of research integrating the economic systems within the different symbolic templates of the population (Salanova Reference Salanova2014).
Acknowledgements
The CNRS and the local council of Bury (Oise) helped to fund the Bury excavations. The analyses were funded by the CNRS, the Conseil regional d’Île-de-France and the Service Départemental d'Archéologie du Val-d'Oise (SDAVO). We would like to thank the owners of the garden where the graves were discovered, Mr and Mrs Chasseing, for their patience and help during the excavations, as well as the inhabitants of Bury for their help to ensure that the scientific project ran smoothly.
Supplementary material
To view supplementary material for this article, please visit https://doi.org/10.15184/aqy.2016.256