I. INTRODUCTION
As materials with superior properties are continuously searched, high-entropy alloys (HEAs), formed by the physical metallurgy of five or more metallic elements with equal or nearly equal quantities, emerge as a class of revolutionary materials.Reference Yeh, Chen, Lin, Gan, Chin, Shun, Tsau and Chang1–Reference Senkov, Wilks, Miracle, Chuang and Liaw5 HEAs break down the traditional wisdom of alloy design in which a primary element serves as the foundation of properties, and small amounts of additional elements are added for fine tuning, therefore, open innumerable possibilities in developing advanced alloys.Reference Zhang, Liaw and Zhang6 One decade of dedicated research has revealed that many HEAs possess unparalleled properties in comparison with traditional alloys, for instance, great thermal and microstructural stability,Reference Schuh, Mendez-Martin, Völker, George, Clemens, Pippan and Hohenwarter7–Reference Yao, Pradeep, Tasan and Raabe9 high hardness,Reference Hsu, Juan, Wang, Sheu, Yeh and Chen10,Reference Youssef, Zaddach, Niu, Irving and Koch11 high strength at a wide range of temperatures,Reference Senkov, Senkova and Woodward12–Reference He, Wang, Huang, Xu, Chen, Wu, Liu, Nieh, An and Lu15 and excellent resistance to wear,Reference Wu, Lin, Yeh, Chen, Huang and Chen16,Reference Hsu, Sheu, Yeh and Chen17 corrosion,Reference Shi, Yang and Liaw18,Reference Shi, Yang, Xie, Brechtl, Dahmen and Liaw19 fatigue,Reference Hemphill, Yuan, Wang, Yeh, Tsai, Chuang and Liaw20–Reference Chen, Lee, Wang, Seifi, Lewandowski, Dahmen, Jia, Xie, Chen, Yeh, Tsai, Yuan and Liaw22 fracture,Reference Gludovatz, Hohenwarter, Catoor, Chang, George and Ritchie13,Reference Zhang, He and Pan23 and high-temperature softening.Reference Senkov, Wilks, Miracle, Chuang and Liaw5,Reference Senkov, Wilks, Scott and Miracle24,Reference Senkov, Scott, Senkova, Meisenkothen, Miracle and Woodward25 Given these merits, applications of HEAs in various fields, particularly in the structural engineering (e.g., used for gas-turbine engines), is being actively explored.Reference Miracle, Miller, Senkov, Woodward, Uchic and Tiley26–Reference Gao, Yeh, Liaw and Zhang28 Among many performance indices, a thorough understanding of creep, fatigue, and fracture behaviors of HEAs is crucial and indispensable to their sophisticated engineering applications.
The creep behavior of a number of HEA systems has been studied in a range of temperatures, including the Al0.15CoCrFeNi HEA with a face-centered cubic (fcc) structure at 580–700 °C,Reference Cao, Shang, Zhao, Cheng, Wang and Wang29 the Al0.6CoCrFeNi HEA with fcc and body-centered cubic (bcc) phases at 580–700 °C,Reference Cao, Shang, Zhao, Cheng, Wang and Wang29 the Ni47.9Al10.2Co16.9Cr7.4Fe8.9Ti5.8Mo0.9Nb1.2W0.4C0.4 HEA with fcc + L12 phases at 750–982 °C,Reference Tsao, Yeh, Kuo, Kakehi, Murakami, Yeh and Jian30 the Al0.3CoCrFeNi HEA with an fcc structure at room temperature,Reference Zhang, Yu, Cheng, Zhang, Diao, Shi, Chen, Chen, Feng, Bai, Jing, Ma, Liaw, Li and Liu31,Reference Jiao, Ma, Yuan, Wang, Yang and Qiao32 the AlCoCrFeNi HEA with a bcc structure at room temperature,Reference Jiao, Ma, Yuan, Wang, Yang and Qiao32 the CoCrFeMnNi HEA with an fcc structure at room temperature,Reference Lee, Seok, Zhao, Choi, He, Lu, Suh, Ramamurty, Kawasaki, Langdon and Jang33 the as-deposited CoCrFeCuNi HEA film with an fcc structure at room temperature,Reference Ma, Peng, Wen and Zhang34,Reference Ma, Feng, Debela, Peng and Zhang35 the annealed CoCrFeCuNi HEA film with an fcc + bcc structure at room temperature,Reference Ma, Peng, Wen and Zhang34 the as-deposited CoCrFeCuNiAl2.5 HEA film with a bcc structure at room temperature.Reference Ma, Feng, Debela, Peng and Zhang35 The creep response of these alloys at room temperature was mostly characterized by spherical nanoindentation testsReference Lee, Seok, Zhao, Choi, He, Lu, Suh, Ramamurty, Kawasaki, Langdon and Jang33,Reference Ma, Peng, Wen and Zhang34 or Berkovich nanoindentation testsReference Zhang, Yu, Cheng, Zhang, Diao, Shi, Chen, Chen, Feng, Bai, Jing, Ma, Liaw, Li and Liu31,Reference Jiao, Ma, Yuan, Wang, Yang and Qiao32,Reference Ma, Feng, Debela, Peng and Zhang35 by virtue of the highly localized stress field generated in these circumstances, whereas uniaxial creep testsReference Tsao, Yeh, Kuo, Kakehi, Murakami, Yeh and Jian30 and stress-relaxation testsReference Cao, Shang, Zhao, Cheng, Wang and Wang29 were utilized for elevated-temperature probing. Focus was placed on determining the value of such critical material parameters as the stress exponent (n) and activation volume (V*), from which creep mechanisms are likely to be deduced. Besides, the effects of microstructures, grain sizes, temperatures, load levels, and loading rates on the creep responses, creep parameters, and creep mechanisms were explored.
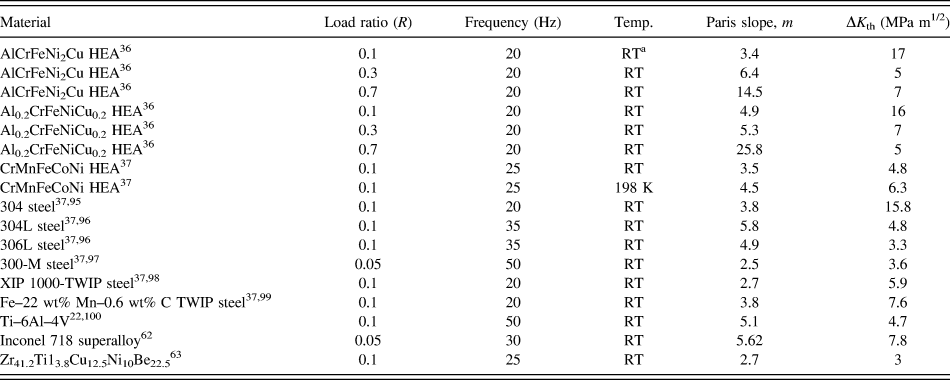
In terms of fatigue, the high-cycle stress–lifetime (S–N) relation and fatigue strength of the as-cast and wrought Al0.5CoCrCuFeNi HEAs with dual fcc phases have been characterized using four-point bending fatigue tests at room temperature and a stress ratio, R = σmin/σmax = 0.1, where σmin and σmax are the applied minimum and maximum stress, respectively. Their fatigue-endurance limit and fatigue-endurance limit to ultimate tensile strength ratio were found to be 540–945 and 0.402–0.703,Reference Hemphill, Yuan, Wang, Yeh, Tsai, Chuang and Liaw20,Reference Tang, Yuan, Tsai, Yeh, Lundin and Liaw21 respectively. These outstanding fatigue properties make this alloy compare favorably with many conventional alloys (e.g., steels and titanium alloys) and potentially exhibit long fatigue lives in practical structural applications even at stresses close to the ultimate stress. The fatigue-crack-growth rate of the AlCrFeNi2Cu and Al0.2CrFeNiTi0.2 HEAs with fcc + bcc phases was investigated by three-point bending tests at room temperature.Reference Seifi, Li, Yong, Liaw and Lewandowski36 By varying the load ratio, R, from 0.1 to 0.7, it was noted that the Paris slope, m, increased from 3.4 to 14.5 for the Al1 alloy and 4.9 to 25.8 for the Al0.2 alloy, and the threshold fatigue-stress-intensity-factor range (ΔK th, representing a stress intensity above which cracks will grow) dropped from 17 to 7 MPa m1/2 for the former and 16 to 5 MPa m1/2 for the latter.Reference Seifi, Li, Yong, Liaw and Lewandowski36 Furthermore, the effect of temperature on the fatigue-crack growth has been studied for the CrMnFeCoNi HEA with disc-shaped compact-tension [DC(T)] samples at a load ratio of R = 0.1.Reference Thurston, Gludovatz, Hohenwarter, Laplanche, George and Ritchie37 As the temperature reduced from room temperature to 198 K, the alloy manifested an ascending tendency in ΔK th from ∼4.8 to ∼6.3 MPa m1/2 whilst m barely changed, i.e., in the range of 3.5–4.5.Reference Thurston, Gludovatz, Hohenwarter, Laplanche, George and Ritchie37 Additionally, fractographic analyses with scanning electron microscopy (SEM),Reference Hemphill, Yuan, Wang, Yeh, Tsai, Chuang and Liaw20,Reference Tang, Yuan, Tsai, Yeh, Lundin and Liaw21,Reference Seifi, Li, Yong, Liaw and Lewandowski36,Reference Thurston, Gludovatz, Hohenwarter, Laplanche, George and Ritchie37 observations of microstructural evolution with transmission electron microscopy (TEM),Reference Tang, Yuan, Tsai, Yeh, Lundin and Liaw21 crack-propagation path monitoring with backscattered electron (BSE) and electron backscatter diffraction (EBSD) imagingReference Thurston, Gludovatz, Hohenwarter, Laplanche, George and Ritchie37 were undertook to unveil underlying deformation and failure mechanisms.
Fracture, referring to the separation of a material into multiple pieces, is the most common form of failure in engineering materials. The fracture process involves crack initiation at pre-existing flaws or microcracks, followed by crack propagation to create new discontinuous surfaces within a solid.Reference Anderson38 Understanding how HEAs fail and then prevent such potential failures through the proper material selection and processing, and careful design of components and parts, is a prerequisite for promoting structural applications of HEAs. To date, HEAs are reported to fail by varied modes, depending on compositions and microstructural constituents. The fracture toughness, fracture under quasi-static uniaxial stress, and high strain-rate loading, fractography, and fracture mechanisms are the topics presently undergoing active investigations.
In spite of a great deal of research devoting to creep, fatigue, and fracture of HEAs, dilemmas still exist, preventing us from gaining a full picture about the merits and shortcomings of HEAs for structural applications. One of such dilemmas is that after a decade of committed investigations, plenty of information in the literature remains scattered and disconnected, making researchers difficult to (i) quickly grasp the essences and limitations of the previous work and (ii) recognize important directions for future endeavors. To alleviate this dilemma and promote the continual scientific progress in HEAs toward applications, we dedicate this article to a comprehensive, yet concise, summary of what have been accomplished in the academia in studying creep, fatigue, and fracture behaviors of HEAs, from which we can spot deficiencies in the present research and recommend future research directions.
II. CREEP BEHAVIOR OF HEAS
A. Uniaxial creep
Creep of the Al0.15CoCrFeNi and Al0.6CoCrFeNi HEAs was explored by employing the uniaxial stress-relaxation tests.Reference Youssef, Zaddach, Niu, Irving and Koch11 The HEA samples, with a diameter of 5 mm and a gauge length of 25 mm, were loaded up to a strain of 0.2% at a loading rate of 8 × 10⁻⁵ s−1 and temperature of 580–700 °C (0.3–0.5 T m, where T m is the melting temperature), followed by a holding period of 4 h for stress relaxation.Reference Youssef, Zaddach, Niu, Irving and Koch11 The recorded stress-relaxation traces at different temperatures for the Al0.15 and Al0.6 HEAs are given in Figs. 1(a) and 1(b), respectively.Reference Youssef, Zaddach, Niu, Irving and Koch11 From the slopes of the curves in these two figures, one can tell that the Al0.60 HEA exhibits a faster relaxation rate than the Al0.60 one. The difference stems from their distinct microstructures—a single fcc structure for the Al0.15 HEA and a fcc + bcc duplex structure for the Al0.60 HEA.
Uniaxial-stress relaxation curves of the (a) fcc Al0.15CoCrFeNi and (b) fcc + bcc Al0.6CoCrFeNi HEAs at varied temperatures. (c) Measured data in the form of  $\ln \left( {{{\dot{\varepsilon }}_{\rm{c}}}\exp \left( {{Q / {RT}}} \right)} \right)$ versus ln σ (symbols) for the two HEAs collected from different testing temperatures along with the best linear fitting lines from which unique values of Q and n were determined for each alloy. (d) The measured data in the form of
 $RT\ln {\dot{\varepsilon }_{\rm{c}}}$ versus σ (symbols) for the Al0.6CoCrFeNi HEAs collected from different testing temperatures along with the best linear-fitting lines from which the activation volume, V*, was determined.Reference Cao, Shang, Zhao, Cheng, Wang and Wang29

Consider that creep of the Al0.15 and Al0.60 HEAs follows the classic Norton’s lawReference Dieter and Bacon39
 $${\dot{\varepsilon }_{\rm{c}}} = A{\sigma ^n}\exp \left( { - {Q \over {RT}}} \right)\quad ,$$
where  ${\dot{\varepsilon }_{\rm{c}}}$ is the creep-strain rate. σ is the applied stress. T is the temperature. R is the gas constant. n is the stress exponent. Q is the activation energy. A is a material constant. By assuming that the deformation of the alloys at high temperatures is composed of the elastic component and viscous (or creep) component, the total applied strain of ε = 0.2% can be written asReference Dieter and Bacon39
 $$\varepsilon = {\varepsilon _{\rm{e}}} + {\varepsilon _{\rm{c}}}\quad .$$
Taking the time derivative to both sides of Eq. (2) and applying the Hooke’s law to the elastic part, the creep rate can be formulated in the form of the stress-relaxation rateReference Dieter and Bacon39
 $${\dot{\varepsilon }_{\rm{c}}} = - {\dot{\varepsilon }_{\rm{e}}} = - {1 \over E}{{{\rm{d}}\sigma } \over {{\rm{d}}t}}\quad ,$$
where E is the Young’s modulus. With Eq. (3), one can calculate the creep rate,  ${\dot{\varepsilon }_{\rm{c}}}$, of both the Al0.15 and Al0.60 HEAs at different temperatures from the stress-relaxation data in Figs. 1(a) and 1(b). By plotting the
 $\ln {\dot{\varepsilon }_{\rm{c}}} - \ln \sigma$ data and performing a linear fit with Eq. (1), one can derive the values of the stress exponent, n, at different temperatures, as shown in Fig. 2(c) in Ref. Reference Cao, Shang, Zhao, Cheng, Wang and Wang29. In a similar fashion, but plotting and fitting the
 $\ln {\dot{\varepsilon }_{\rm{c}}} - {1 / T}$ data points with Eq. (1), one can extract the activation energy, Q, at different stress levels, as given in Fig. 2(d) in Ref. Reference Cao, Shang, Zhao, Cheng, Wang and Wang29.
In a consolidated creep law for an individual alloy, both n and Q should not depend on the applied stress. Therefore, a single value of n or Q can be obtained by first plotting  $\ln \left( {{{\dot{\varepsilon }}_{\rm{c}}}\exp \left( {{Q / {RT}}} \right)} \right)\;{\rm{versus}}\;\ln \sigma$ to cluster the data at different temperatures together, and then fitting with Eq. (1). Such an operation for the Al0.15 and Al0.60 HEAs are given in Fig. 1(c),Reference Cao, Shang, Zhao, Cheng, Wang and Wang29 in which the value of Q needs to be adjusted iteratively to reach the best fit. After obtaining a single Q value for each alloy, the values of n and A turn out to be the slope and intercept of the best fitting line, respectively. The deduced n and Q for the Al0.15 and Al0.60 HEAs are 5.56 and 8.82, and 385 kJ/mol and 334 kJ/mol,Reference Cao, Shang, Zhao, Cheng, Wang and Wang29 respectively. From these values, it is evident that the Al0.15 HEA has greater creep resistance than the Al0.60 HEA. Since n = 3–8 normally signifies dislocation creepReference Dieter and Bacon39 in crystalline metals, the creep mechanisms in both the Al0.15 and Al0.60 HEAs, therefore, were believed to be managed by dislocation motion.Reference Cao, Shang, Zhao, Cheng, Wang and Wang29
It is known that the activation volume, V*, in a plastic deformation can be calculated according to
 $${V^ * } = RT{{\partial \ln {{\dot{\varepsilon }}_{\rm{c}}}} \over {\partial \sigma }}\quad ,$$
where R is the gas constant and T is the temperature.Reference Cao, Shang, Zhao, Cheng, Wang and Wang29,Reference Caillard and Martin40 By plotting  $RT\ln {\dot{\varepsilon }_{\rm{c}}}$ as a function of σ for the HEAs at different testing temperatures and performing linear fittings, the values of V* were derived from the slopes of the fitting lines. In Fig. 1(d), an example of this operation is provided for the Al0.60 HEA.Reference Cao, Shang, Zhao, Cheng, Wang and Wang29 The calculated V* values for the Al0.15 and Al0.60 alloys at varied temperatures range from 3.15 × 10⁻⁴ to 5.22 × 10⁻⁴ m3/mol and 4.3 × 10⁻⁴ to 6.74 × 10⁻⁴ m3/mol, respectively.Reference Cao, Shang, Zhao, Cheng, Wang and Wang29 For the fcc-single-phase Al0.15 HEA, taking
 ${a \over 2}\left\langle {110} \right\rangle$ as the Burger’s vector and a = 3.606 Å as the lattice constant, V* was calculated to be in the range of 32–54b.Reference Miracle and Senkov3,Reference Cao, Shang, Zhao, Cheng, Wang and Wang29 With the established knowledge that a V* value ranging approximately from b3 to 1000b3 is related to dislocation cross-slip,Reference Cao, Shang, Zhao, Cheng, Wang and Wang29,Reference Somekawa and Schuh41 it was concluded that creep in the Al0.15 HEA was dominated by the dislocation slide. This finding essentially agrees with what has arrived through the stress exponent.
Moreover, Tsao et al. investigated the creep behavior of the Ni47.9Al10.2Co16.9Cr7.4Fe8.9Ti5.8Mo0.9Nb1.2W0.4C0.4 HEA with fcc + L12 phases at 750–982 °C using uniaxial creep testsReference Tsao, Yeh, Kuo, Kakehi, Murakami, Yeh and Jian30 and found the excellent creep resistance for this alloy. Specifically, the creep-rupture life of the HEA loaded at 159 MPa and at 982 °C was measured to be 114 h, comparable to some first-generation Ni-based superalloys under similar conditions, for example, NX-188 DS and Rene’ 80 superalloys.Reference Tsao, Yeh, Kuo, Kakehi, Murakami, Yeh and Jian30,Reference Howes42,Reference Ohtomo and Saiga43 Its creep activation energy was determined to be 290 kJ/mol,Reference Tsao, Yeh, Kuo, Kakehi, Murakami, Yeh and Jian30 higher than 230 kJ/mol of CMSX-2 superalloys.Reference Rouault-Rogez, Dupeux and Ignat44 The exceptional creep resistance of this alloy was thought of originating from the stable γ′ phases and lower stacking fault energy.Reference Tsao, Yeh, Kuo, Kakehi, Murakami, Yeh and Jian30
B. Spherical nanoindentation creep
Lee et al. had applied spherical nanoindentation to probe the creep behavior of the CoCrFeMnNi HEAs with an fcc structure.Reference Lee, Seok, Zhao, Choi, He, Lu, Suh, Ramamurty, Kawasaki, Langdon and Jang33 In their tests, a spherical indenter with a tip radius of R = 38.6 μm was used to load the samples to different maximum load levels, P max, at room temperature and a constant loading rate of dP/dt = 0.5 mN−1. The samples were, then, held at P max for 1000 s for creeping, and unloaded thereafter. The creep tests were conducted on the coarse-grained samples with a grain size of ∼46 μm and the nanocrystalline samples with a grain size of ∼49 and ∼33 nm, in both elastic and elastic–plastic regimes. Figure 2(a) gives the load–displacement (P–h) curves of the three HEA samples in the elastic regime.Reference Lee, Seok, Zhao, Choi, He, Lu, Suh, Ramamurty, Kawasaki, Langdon and Jang33 The loading curves were ascertained to be elastic because P max applied on each sample was below their respective yielding load, as determined from a set of separate elastic–plastic transition tests (Fig. 3 in Ref. Reference Lee, Seok, Zhao, Choi, He, Lu, Suh, Ramamurty, Kawasaki, Langdon and Jang33). This assertion can also be easily verified by noticing that the loading and unloading curves run nearly in parallel in Fig. 2(a). A conspicuous feature in Fig. 2(a) is that the penetration depth increases for all three samples at the load-holding stage, implying that they have experienced creep deformation even in the elastic regime. This time-dependent deformation is plastic in nature rather than an elasticity as it remains upon unloading. Holding the samples in the elastic–plastic regime (higher P max) undoubtedly incurs a greater magnitude of creep deformation.Reference Lee, Seok, Zhao, Choi, He, Lu, Suh, Ramamurty, Kawasaki, Langdon and Jang33
(a) Creep tests conducted in the elastic regime of the nanocrystalline (nc) and coarse-grained (cg) CoCrFeMnNi HEAs with a fcc phase at room temperature by spherical nanoindentation. (b) Uniaxial creep-strain rate (converted from the indentation creep-strain rate),  $\dot{\varepsilon }_{\rm{u}}^{{\rm{creep}}}$, as a function of the holding time for the nanocrystalline HEAs with a grain size of ∼33 nm at different load levels, with the inset showing the indentation creep strain,
 $\varepsilon _{\rm{i}}^{{\rm{creep}}}$, as a function of the holding time. (c) Measured creep data in the form of
 $\ln {\dot{\varepsilon }_{{\rm{ssc}}}}$ versus ln σ (symbols) along with the best linear-fitting lines from which the stress exponent, n, was determined. (d) Measured creep data in the form of
 $\ln {\dot{\varepsilon }_{{\rm{ssc}}}}$ versus σ (symbols) along with the best linear-fitting lines from which the activation volume, V*, were determined.Reference Lee, Seok, Zhao, Choi, He, Lu, Suh, Ramamurty, Kawasaki, Langdon and Jang33

To quantify the stress exponent and activation volume in a spherical nanoindentation test, a very first step is to obtain a history of the creep-strain rate during the load-holding stage. To this end, the nanoindentation-creep strain was computed as  $\varepsilon _{\rm{i}}^{{\rm{creep}}} = {{0.2\left( {a - {a_0}} \right)} / R}$, where a 0 and a are the contact radii at the onset of creep and an arbitrary instant of creep, respectively.Reference Lee, Seok, Zhao, Choi, He, Lu, Suh, Ramamurty, Kawasaki, Langdon and Jang33 The instantaneous contact radius was estimated to be
 $a = \sqrt {2hR - {h^2}}$,Reference Lee, Seok, Zhao, Choi, He, Lu, Suh, Ramamurty, Kawasaki, Langdon and Jang33,Reference Choi, Yoo, Kim, Seok, Wang and Jang45 in which h is taken to be the actually measured depth for simplicity instead of the contact depth. An example of the calculated nanoindentation creep strain,
 $\varepsilon _{\rm{i}}^{{\rm{creep}}}$, as a function of the holding time, t hold, for the ∼33 nm nanocrystalline HEA at four different P max values is displayed as the inset in Fig. 2(b).Reference Lee, Seok, Zhao, Choi, He, Lu, Suh, Ramamurty, Kawasaki, Langdon and Jang33 In general, the nanoindentation
 $\varepsilon _{\rm{i}}^{{\rm{creep}}} - {t_{{\rm{hold}}}}$ curves consist of transient and steady-state creep regimes, resembling the uniaxial creep–time relation but with the tertiary stage missing. The nanoindentation
 $\varepsilon _{\rm{i}}^{{\rm{creep}}} - {t_{{\rm{hold}}}}$ curves can then be fitted withReference Lee, Seok, Zhao, Choi, He, Lu, Suh, Ramamurty, Kawasaki, Langdon and Jang33
 $$\varepsilon _{\rm{i}}^{{\rm{creep}}} = \alpha \left( {1 - {{\rm{e}}^{ - r{t_{{\rm{hold}}}}}}} \right) + \omega {t_{{\rm{hold}}}}\quad ,$$
where α, r, and ω are fitting constants. Differentiating the final form of Eq. (5) with respect to t hold then leads to the history of the creep-strain rate, i.e.,  $\dot{\varepsilon }_{\rm{i}}^{{\rm{creep}}} = f\left( {{t_{{\rm{hold}}}}} \right)$. With the empirical relation of
 $\dot{\varepsilon }_{\rm{u}}^{{\rm{creep}}} \approx 0.01\dot{\varepsilon }_{\rm{i}}^{{\rm{creep}}}$,Reference Lee, Seok, Zhao, Choi, He, Lu, Suh, Ramamurty, Kawasaki, Langdon and Jang33,Reference Wang, Lai, Huang and Nieh46 one can derive the equivalent uniaxial creep strain rate,
 $\dot{\varepsilon }_{\rm{u}}^{{\rm{creep}}}$, with the already computed
 $\dot{\varepsilon }_{\rm{i}}^{{\rm{creep}}}$. The variations of the resulting
 $\dot{\varepsilon }_{\rm{u}}^{{\rm{creep}}}$ with t hold for the ∼33 nm nanocrystalline HEA at the varied P max are plotted in Fig. 2(b), from which it is seen that for all load levels, a steady-state creep strain rate is attained after a loading period of ∼400 s.
Recall that the creep-stress exponent of  $n = {{\partial \ln {{\dot{\varepsilon }}_{{\rm{ssc}}}}} \over {\partial \ln \sigma }}$, where
 ${\dot{\varepsilon }_{{\rm{ssc}}}}$ is the steady-state creep rate.Reference Lee, Seok, Zhao, Choi, He, Lu, Suh, Ramamurty, Kawasaki, Langdon and Jang33 Determining
 ${\dot{\varepsilon }_{{\rm{ssc}}}}$ at t hold = 1000 s and estimating σ from the measured hardness, H, at the same t hold by σ = H/3 with C being ∼3,Reference Lee, Seok, Zhao, Choi, He, Lu, Suh, Ramamurty, Kawasaki, Langdon and Jang33,Reference Johnson47 the
 $\ln {\dot{\varepsilon }_{{\rm{ssc}}}} - \ln \sigma$ data points can be constructed [Fig. 2(c)], from which n was determined to be the slope of the linear fits. With the averaged data points, n was determined to be ∼1 for the nanocrystalline HEAs and ∼3 for the coarse-grained HEA. The activation volume was defined as
 ${V^ * } = \sqrt 3 kT{{\partial \ln {{\dot{\varepsilon }}_{{\rm{ssc}}}}} \over {\partial \sigma }}$,Reference Lee, Seok, Zhao, Choi, He, Lu, Suh, Ramamurty, Kawasaki, Langdon and Jang33 where k is the Boltzmann’s constant. In a similar fashion, the values of V* for three different HEA samples were determined from the slopes of the linear fits of the
 $\ln {\dot{\varepsilon }_{{\rm{ssc}}}} - \sigma$ data, as given in Fig. 2(d). The V* values were ultimately converted to be ∼4.6b3 for the coarse-grained HEA and ∼0.8b3 for the nanocrystalline HEAs using a Burger’s vector of
 ${\bi{b}} = l \times {{\sqrt 2 } \over 2} \approx 2.25 \times {10^{ - 10}}\;{\rm{m}}$, where l is the lattice constant and is equal to ∼3.6 Å for the CoCrFeMnNi HEAs.Reference Lee, Seok, Zhao, Choi, He, Lu, Suh, Ramamurty, Kawasaki, Langdon and Jang33
The values of n and V* are important as they are usually implicative of steady-state creep mechanisms in a material. Specifically, n ≈ 1 hints a diffusion-mediated creep (through lattice or grain boundaries) in the nanocrystalline HEAs, whereas n ≈ 3 in the coarse-grained HEA is indicative of dislocation creep.Reference Lee, Seok, Zhao, Choi, He, Lu, Suh, Ramamurty, Kawasaki, Langdon and Jang33 From the activation-volume perspective, in fcc metals, the dislocation glide mechanism corresponds to V* values in the range of ∼100b3–1000b3, and the diffusion-mediated creep takes over when V* goes smaller down to ∼b3.Reference Lee, Seok, Zhao, Choi, He, Lu, Suh, Ramamurty, Kawasaki, Langdon and Jang33,Reference Conrad48–Reference Frost and Ashby50 As a result, V* = 0.8b3 and 4.6b3 in the nanocrystalline HEAs and coarse-grained HEAs indicate a diffusion creep mechanism for the both alloy groups.Reference Lee, Seok, Zhao, Choi, He, Lu, Suh, Ramamurty, Kawasaki, Langdon and Jang33 This conclusion complies with that deduced from the stress exponent for the nanocrystalline HEAs but opposes that for the coarse-grained HEA. However, it was argued that creep in the coarse-grained HEA should be still governed by the dislocation slide, and the reduced value of V* was artificially caused by the interfacial diffusion between the indenter tip and sample surface, which is particularly pronounced for shallow indentations.Reference Lee, Seok, Zhao, Choi, He, Lu, Suh, Ramamurty, Kawasaki, Langdon and Jang33
Spherical nanoindentation tests were also used to study the room-temperature creep behavior of the CoCrFeCuNi HEA film (∼1.45 μm thick), at the as-deposited state with an fcc structure and annealed state with an fcc + bcc structure.Reference Ma, Peng, Wen and Zhang34 For both states, the creep deformation increases with increasing nanoindentation-holding load and loading rate. By defining the strain-rate sensitivity as  $m = {{\partial \ln H} \over {\partial \ln {{\dot{\varepsilon }}_{\rm{c}}}}}$ along with H = P/A, A = 2πR(h i − 0.75 × P/S), and
 ${\dot{\varepsilon }_{\rm{c}}} = {1 \over {\sqrt A }}{{{\rm{d}}\sqrt A } \over {{\rm{d}}t}}$ (H is the hardness, P is the load, A is the contact area, h i is the indentation displacement, and S is the stiffness), m was determined from the slope of the linear fit to the
 $\ln H - \ln {\dot{\varepsilon }_{\rm{c}}}$ data points.Reference Ma, Peng, Wen and Zhang34 When the creep load increases from 15 to 50 mN, the value of m increases from 0.1 to 0.25 for the as-deposited alloy and decreases from 0.27 to 0.21 for the annealed alloy.Reference Ma, Peng, Wen and Zhang34 Since the strain-rate sensitivity is the reciprocal of the stress exponent, i.e., =1/n, the corresponding n values for the as-deposited and annealed alloys are calculated to be 4–10 and 3.7–4.8, respectively. With the loading rate increasing from 0.1 to 5 mN/s, the value of m increases from 0.14 to 0.4 for the as-deposited alloy and remains at ∼0.27 for the annealed alloy.Reference Ma, Peng, Wen and Zhang34 Converting m into n, the former and latter are 2.5–7.14 and 3.7, respectively. The calculated n values indicate that creep in both the as-deposited and annealed CoCrFeCuNi HEA films is dominated by dislocation glide or climb.
C. Sharp nanoindentation creep
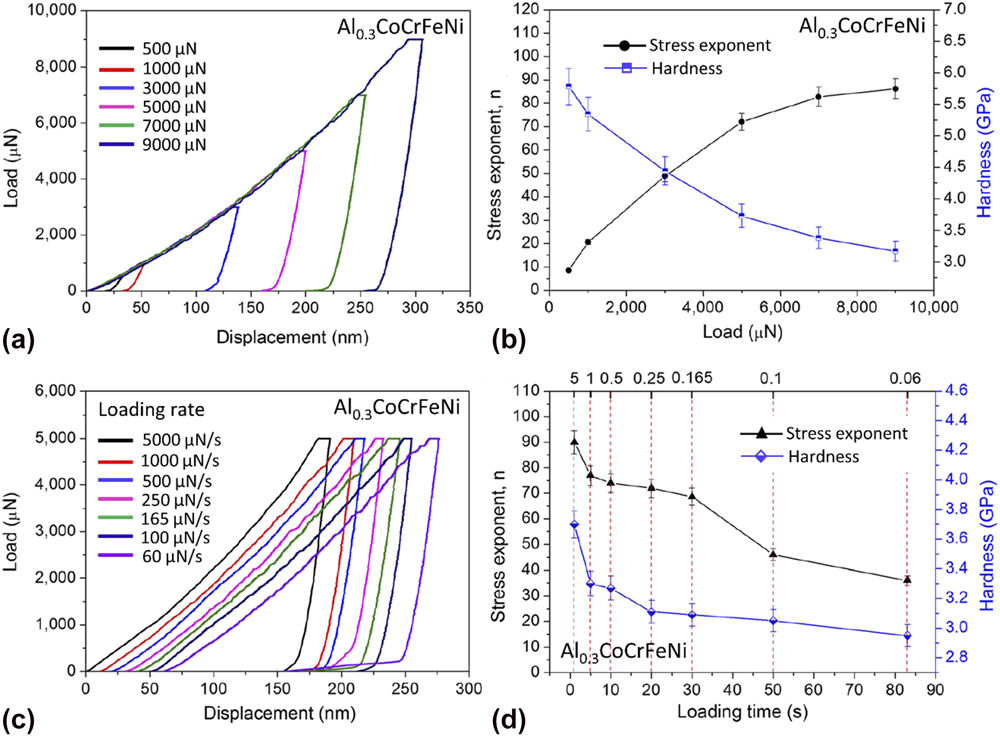
Berkovich nanoindentation has been used for investigating the creep behavior of a coarse-grained Al0.3CoCrFeNi HEA with a single fcc structure at room temperature.Reference Zhang, Yu, Cheng, Zhang, Diao, Shi, Chen, Chen, Feng, Bai, Jing, Ma, Liaw, Li and Liu31 The creep deformation of this alloy is sensitive to both applied loads and loading rates, as given in Figs. 3(a) and 3(c),Reference Zhang, Yu, Cheng, Zhang, Diao, Shi, Chen, Chen, Feng, Bai, Jing, Ma, Liaw, Li and Liu31 that is, the nanoindentation creep depth increases with increasing both the creep load and loading rate. With a power-law creep equation like Eq. (1) and some relations in nanoindentation tests, Zhang et al.Reference Zhang, Yu, Cheng, Zhang, Diao, Shi, Chen, Chen, Feng, Bai, Jing, Ma, Liaw, Li and Liu31 ultimately derived
 $$\ln {H^{ - n}} = A - {Q \over {RT}} + \ln t\quad ,$$
where A is a constant. Obviously, lnH is linearly scaled with lnt. Therefore, conducting a linear fit to the ln H − lnt data enables the determination of the stress exponent, n. The values of n determined at different peak loads are plotted in Fig. 3(b).Reference Zhang, Yu, Cheng, Zhang, Diao, Shi, Chen, Chen, Feng, Bai, Jing, Ma, Liaw, Li and Liu31 It is seen that as the load increases from 500 to 900 μN, the value of n ramps from ∼10 up to ∼90. The dependence of the stress exponent on the loading time and/or loading rate is graphed in Fig. 3(d).Reference Zhang, Yu, Cheng, Zhang, Diao, Shi, Chen, Chen, Feng, Bai, Jing, Ma, Liaw, Li and Liu31 Now, as the loading rate extends from 0.06 to 5 mN/s, n gradually increases from ∼40 to ∼90.Reference Zhang, Yu, Cheng, Zhang, Diao, Shi, Chen, Chen, Feng, Bai, Jing, Ma, Liaw, Li and Liu31 A striking feature of this work is that the value of n is extremely higher than those typically found for crystalline metals (<10). Based on the large n value, the authors argued that the there was a change in the creep mechanism from the diffusion flow to dislocation climb and slip with increasing indentation loads. This trend might be true for some nanoindentation tests as the self-diffusion along the free surfaces of the specimens and the indenter/specimen interface may play a dominant role in shallow indentation depths. However, claiming that a deformation mechanism transition based on n varying from ∼10 to ∼90 is somewhat misleading. This is because a diffusion-dominant creep mechanism in traditional crystalline metals generally occurs at n = 1. The extremely large n value was speculated by the authors to come from three resources: (i) Large grains of the alloy make the grain boundaries barely contribute to creep; (ii) Multiple components and distorted lattices retard the dislocation movement; (iii) The nanoscaled phases with highly concentrated solute atoms can effectively resist creep due to the sluggish diffusion in the multi-element matrix. Nevertheless, justifications of these speculated causes are lacking.
Creep tests conducted on the fcc Al0.3CoCrFeNi HEAs by Berkovich nanoindentation at (a) different maximum loads and (c) loading rates. Variation of the stress exponent and hardness with (b) the applied loads and (d) loading time.Reference Zhang, Yu, Cheng, Zhang, Diao, Shi, Chen, Chen, Feng, Bai, Jing, Ma, Liaw, Li and Liu31

Ma et al. used the Berkovich nanoindentation to study the creep characteristics of the fcc CoCrFeNiCu and bcc CoCrFeNiCuAl2.5 HEA films, which have the thicknesses of 1.45 μm and 1.75 μm,Reference Ma, Feng, Debela, Peng and Zhang35 respectively. Since the strain-rate sensitivity is defined as  $m = {{\partial \ln \sigma } \over {\partial \ln {{\dot{\varepsilon }}_{\rm{c}}}}}$ with
 $\sigma \approx {H / {3\sqrt 3 }}$ and
 ${\dot{\varepsilon }_{\rm{c}}} = {1 \over {{h_{\rm{c}}}}}{{{\rm{d}}{h_{\rm{c}}}} \over {{\rm{d}}t}}$ (h c = h i − 0.72 × P/S is the contact depth), m was determined from the slope of the linear fit to the
 $\ln H - \ln {\dot{\varepsilon }_{\rm{c}}}$ data. m was determined to be 0.035 and 0.0048 for the CoCrFeNiCu and CoCrFeNiCuAl2.5 HEAs, respectively.Reference Ma, Feng, Debela, Peng and Zhang35 Again using n = 1/m, the stress exponents of the CoCrFeNiCu and CoCrFeNiCuAl2.5 HEAs are calculated to be 28.57 and 208.33, respectively. Hence, this work suffers from the same issue as the one by Zhang et al.,Reference Zhang, Yu, Cheng, Zhang, Diao, Shi, Chen, Chen, Feng, Bai, Jing, Ma, Liaw, Li and Liu31 that is, the determined values of the stress exponent, n, are overly large.
D. Comparison of different creep tests
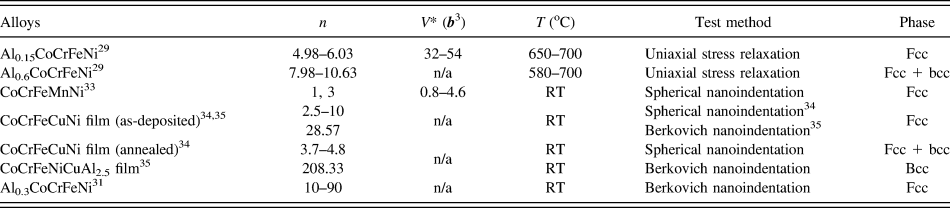
The techniques used for investigating the creep behavior of HEAs and probing their stress exponent, n, and activation volume, V*, include the uniaxial stress-relaxation, spherical-nanoindentation, and Berkovich-nanoindentation experiments, as summarized in Table I. Each testing method has its own advantages and disadvantages. A uniaxial stress-relaxation test is a closest means to mimic the standard creep tests and can directly give out the uniaxial creep strain rate. If the creep-strain rate is calculated correctly, the derived n, V*, and hence the inferred creep mechanism should be reliable. Nevertheless, the correct calculation of these parameters relies on the validity of Eq. (2). ε = εe + εc is only valid when the samples are loaded below the yield point, i.e., no plastic deformation is involved. Moreover, due to the uniform deformation, creep tests by this method only become appreciable at high temperatures. Nanoindentation experiments, either a spherical- or sharp-type, overcome the temperature restriction due to the highly localized large strain and can even detect significant creep at room temperature. This convenience, plus the less demanding sample size, essentially facilitates the creep characterization of HEAs. But one of the issues of using nanoindentation for creep experiments is that the direct use of the nanoindentation creep-strain rate for calculating n and V* is in question.Reference Dean, Bradbury, Aldrich-Smith and Clyne51–Reference Su, Herbert, Sohn, LaManna, Oliver and Pharr54 In the research of HEAs, most authors chose to directly use the nanoindentation-creep-strain rateReference Zhang, Yu, Cheng, Zhang, Diao, Shi, Chen, Chen, Feng, Bai, Jing, Ma, Liaw, Li and Liu31,Reference Ma, Peng, Wen and Zhang34,Reference Ma, Feng, Debela, Peng and Zhang35 except that Lee et al. converted it into an equivalent uniaxial creep-strain rate using a relation of  $\dot{\varepsilon }_{\rm{u}}^{{\rm{creep}}} \approx 0.01\dot{\varepsilon }_{\rm{i}}^{{\rm{creep}}}$ prior to fitting for n and V* values.Reference Lee, Seok, Zhao, Choi, He, Lu, Suh, Ramamurty, Kawasaki, Langdon and Jang33 Unreasonably large n values for HEAs were calculated from the creep data by the Berkovich nanoindentation tests, as given in Table I. The improper usage of the nanoindentation creep-strain rate might be part of causes. This factor may also contribute to the very different n values measured for the as-cast CoCrFeCuNi HEA films by the spherical nanoindentation and Berkovich nanoindentation tests, i.e., 2.5–10 for the former and 28.57 for the latter. The n values from the uniaxial stress relaxation testsReference Cao, Shang, Zhao, Cheng, Wang and Wang29 and corrected spherical nanoindentation testsReference Lee, Seok, Zhao, Choi, He, Lu, Suh, Ramamurty, Kawasaki, Langdon and Jang33 are in the reasonable range in general.
The derived stress exponent, n, and activation volume, V*, of HEAs from different creep tests.

Note: b is the Burger’s vector.
III. FATIGUE BEHAVIOR OF HEAS
A. Fatigue strength and life
High-cycle four-point bending fatigue tests have been carried out on the Al0.5CoCrCuFeNi HEAs to investigate their fatigue strength and life at room temperature. In the early work by Hemphill et al.,Reference Hemphill, Yuan, Wang, Yeh, Tsai, Chuang and Liaw20 the testing samples were made from commercial-purity (> 99%) raw materials, followed by annealing at 100 °C for 6 h, water quenching, and cold rolling with a 84% reduction in thickness. The fatigue tests ran in a load-controlled mode, and different load levels in a sinusoidal waveform were swept through the samples at a frequency of 10 Hz. In all tests, the samples were so oriented that the direction of the stress on the tensile or compressive surface is parallel to the rolling direction. The maximum tensile stress takes place on the convex side of the bent samples, specifically confined to the span of the two outer pins. Assuming stress uniformity in this domain, the peak tensile stress was estimated to be  $\sigma = {{3P\left( {{S_0} - {S_i}} \right)} \over {2B{W^2}}}$, where P, S 0, S i, B, and W are the applied load, outer span length, inner span length, sample thickness, and sample height, respectively. The samples were tested at a stress ratio of R = 0.1 until fatigue failure or reaching 107 cycles.
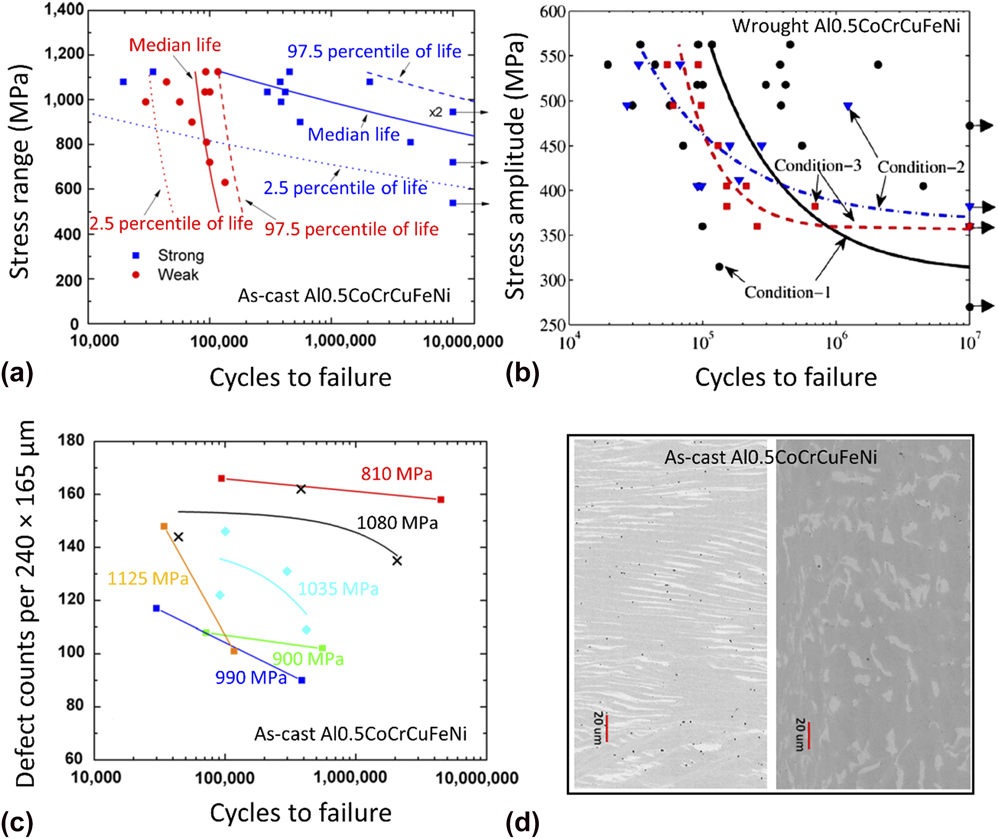
The stress range (Δσ = σmax − σmin = 0.9σmax) versus cycles to failure (i.e., S–N data) obtained at different fatigue-load levels are plotted as symbols in Fig. 4(a).Reference Hemphill, Yuan, Wang, Yeh, Tsai, Chuang and Liaw20 One of the most striking features of the measured data is that it manifests a great extent of scatter. For instance, at a high stress level approaching the yield strength (1284 MPa) of the alloy, i.e., Δσ = 1125 MPa, the failure of the samples spreads in a wide range of cycles from 35,000 to 450,000. The data scattering in the lifetime is further exaggerated as the applied stress range ramps down. In spite of a wide spread in the testing data, the general trend that the number of cycles to failure increases with the decreasing stress level, found in most of the structural materials,Reference Suresh55 still holds. The fatigue strength (or endurance limit) of the alloy, gauged as the Δσ value when the specimens reach 107 fatigue cycles without failure, reads as a lower bound of 540 MPa and an upper bound of 945 MPa in Fig. 4(a).Reference Hemphill, Yuan, Wang, Yeh, Tsai, Chuang and Liaw20 The fatigue ratio, defined as  ${{\Delta \sigma } \over {{\sigma _{{\rm{UTS}}}}}}$, where σUTS is the ultimate tensile strength of the materials, is thus calculated to be in the range of 0.402–0.703.
Fatigue S–N data of the (a) as-castReference Hemphill, Yuan, Wang, Yeh, Tsai, Chuang and Liaw20 and (b) wroughtReference Tang, Yuan, Tsai, Yeh, Lundin and Liaw21 Al0.5CoCrCuFeNi HEAs with a dual fcc structure. The curves in (a) are the predicted quantile lives with the Weibull mixture predictive modelReference Hemphill, Yuan, Wang, Yeh, Tsai, Chuang and Liaw20 while those in (b) are the predicted stress amplitude versus median fatigue life by the random endurance-limit model.Reference Tang, Yuan, Tsai, Yeh, Lundin and Liaw21 (c) Effect of defects counts on the fatigue life of the as-cast Al0.5CoCrCuFeNi HEA at various stress levels.Reference Hemphill, Yuan, Wang, Yeh, Tsai, Chuang and Liaw20 (d) Two microstructural morphologies observed by SEM in the as-cast Al0.5CoCrCuFeNi HEA. Left: a lamellar flow pattern with alternating α (dark) and β (light) phases. Right: a random orientation of α and β phases.Reference Hemphill, Yuan, Wang, Yeh, Tsai, Chuang and Liaw20

It was suspected that the large scatter in the fatigue testing data in Fig. 4(a) was attributed to defects inheriting from the raw materials, or introduced during the casting and rolling processes. To testify this hypothesis, Tang et al.Reference Tang, Yuan, Tsai, Yeh, Lundin and Liaw21 fabricated three groups of Al0.5CoCrCuFeNi HEAs and processed them under three different conditions to acquire distinct amounts of macro- or microdefects, and then comparatively investigated their fatigue properties. Condition-1 samples were made by following the exactly same procedure as by Hemphill et al.Reference Hemphill, Yuan, Wang, Yeh, Tsai, Chuang and Liaw20 The Condition-2 samples were prepared in the same fashion, but an extra machining step was added to remove shrinkage pores and macrosegregation before cold rolling.Reference Tang, Yuan, Tsai, Yeh, Lundin and Liaw21 The Condition-3 samples were formulated by utilizing the high-purity raw materials (> 99.9 wt%), while the remaining steps were identical to Condition-1. Evidently, the Condition-1 samples retain a greatest amount of defects, followed by the Condition-2 samples, and finally Condition-3 samples. The high-cycle four-point bending tests of the three groups of HEA samples were conducted at the same conditions as in Hemphill et al.,Reference Hemphill, Yuan, Wang, Yeh, Tsai, Chuang and Liaw20 and the fatigue data were presented as symbols in Fig. 4(b) as the stress amplitude versus cycles to failure (S–N data), where the stress amplitude was defined as  ${\sigma _{\rm{a}}} = {{\Delta \sigma } \over 2}$. Comparing the fatigue data from the three different conditions, it is seen that a significant degree of scatter in the fatigue life at a given σa is still very noticeable for the Condition-1 and Condition-2 samples. By contrast, the Condition-3 samples exhibit a much tighter distribution in the fatigue life. As an example, at σa = 495 MPa, the fatigue failure of the two Condition-2 samples varies from 2.7 × 10⁴ to 1.3 × 10⁶ cycles, whereas the failure of the two Condition-3 ones are in the range of 6.0 × 10⁴–9.8 × 10⁴ cycles. Considering the samples from all three conditions, the fatigue strength based on the stress amplitude, σa, is evaluated to have a lower bound of 270 MPa and an upper bound of 473 MPa. Converting these values into the stress range, Δσ, the resulting fatigue strength is from 540 to 946 MPa, which essentially agrees with the result found by Hemphill et al.Reference Hemphill, Yuan, Wang, Yeh, Tsai, Chuang and Liaw20 The fatigue ratio,
 ${{\Delta \sigma } \over {{\sigma _{{\rm{UTS}}}}}}$, is calculated to be 0.402 and 0.704.
1. Effect of defects
It is well acknowledged that fatigue cracks usually initiate from stress concentrators on the surfaces of materials. It is, therefore, inferred that the amount of defects on the tensile surface of the bent HEA samples plays a crucial role in determining the fatigue life and its variability at a given load. As a matter of fact, various kinds of defects, including microcracks, shrinkage pores, and aluminum oxide-rich particles, had been identified with SEM observations and EDS analyses in the Al0.5CoCrCuFeNi HEA samples.Reference Hemphill, Yuan, Wang, Yeh, Tsai, Chuang and Liaw20,Reference Tang, Yuan, Tsai, Yeh, Lundin and Liaw21 Shrinkage pores, segregations, inclusions, and oxides were induced during the casting or heat treatments and could result in microcracks.Reference Hemphill, Yuan, Wang, Yeh, Tsai, Chuang and Liaw20,Reference Tang, Yuan, Tsai, Yeh, Lundin and Liaw21 In Sec. III.A, the effect of defect density on the variability of fatigue life had been verified in a semiquantitative manner in the work by Tang et al. through conducting fatigue tests on HEA samples fabricated in three different conditions. Moreover, the correlation between the number of defects on a 240 × 165 μm surface area and the fatigue life was investigated at different applied loads, and an approximately linear descending trend was noticed.Reference Hemphill, Yuan, Wang, Yeh, Tsai, Chuang and Liaw20 Specifically, at a wide range of maximum stresses, σmax, the fatigue life of the HEAs decreases linearly as the number of surface defects reduces. This finding is depicted in Fig. 4(c).Reference Hemphill, Yuan, Wang, Yeh, Tsai, Chuang and Liaw20 The rationale behind the correlation is that surface defects on a sample act as stress risers, promptly causing local yielding, crack nucleation, and fatigue failure of the sample under cyclic loading. The more the defects present on the sample surface, the faster the fatigue cracks initiate and the shorter the fatigue life (cycles to failure) is. As different testing specimens may sample a varied density of defects on their surfaces, the fatigue life measured for these specimens may exhibit great variability.
2. Microstructural morphology effect
The Al0.5CoCrCuFeNi HEAs are composed of two fcc phases: the α-fcc matrix dendrite phase and the β-fcc Cu-rich interdendrite phase, i.e., the dark and light phases in Fig. 4(d), respectively.Reference Hemphill, Yuan, Wang, Yeh, Tsai, Chuang and Liaw20 Because the heat flux is unlikely uniform throughout a solidifying sample, the microstructural morphology may vary from position to position. The effect of two different morphologies, a lamellar flow pattern with alternating α and β phases as well as a random distribution of α and β phases in Fig. 4(d), on the fatigue properties of the HEAs were investigated.Reference Hemphill, Yuan, Wang, Yeh, Tsai, Chuang and Liaw20 Following the fatigue tests, there was no correlation noticed between the fatigue strength and the microstructural morphology, as well as between the variability in the fatigue life and the microstructural morphology.Reference Hemphill, Yuan, Wang, Yeh, Tsai, Chuang and Liaw20 It was, therefore, believed that the microstructural morphology affects neither the fatigue strength nor the fatigue life appreciably, which also had been confirmed by statistical modeling.Reference Hemphill, Yuan, Wang, Yeh, Tsai, Chuang and Liaw20
3. Predictive modeling
The fatigue S–N relation of HEAs can be predicted by virtue of various statistical models. One of such models is the random endurance-limit model,Reference Tang, Yuan, Tsai, Yeh, Lundin and Liaw21 in which the fatigue life, n, is thought to be dependent on the applied stress, s, and the fatigue-endurance limit, γ, through
 $$\log \left( n \right) = {\beta _0} + {\beta _1}\log \left( {s - \gamma } \right) + \varepsilon ,\;\left( {s > \gamma } \right)\quad ,$$
where β0 and β1 are material constants. ε is a random error term.
Next, let V = log(γ), and it follows a probability density function (pdf) given by
 $${f_{\rm{V}}}\left( {v;{\mu _{\rm{r}}},{\sigma _{\rm{r}}}} \right) = {{{\varphi _{\rm{V}}}} \over {{\sigma _{\rm{r}}}}}\left( {{{v - {\mu _{\rm{r}}}} \over {{\sigma _{\rm{r}}}}}} \right)\quad ,$$
where μr and σr are the location and scale parameters, respectively.
Then, with x = log(s) and W = log(n), the marginal pdf and cumulative distribution function (cdf) of W are given, respectively, as
 $${f_W}\left( {w;x,\theta } \right) = \int_{ - \infty }^x {{1 \over {\sigma {\sigma _{\rm{r}}}}}{\varphi _{W|V}}} \left( {{{w - \left[ {{\beta _0} + {\beta _1}\log \left( {\exp \left( x \right) - \exp \left( v \right)} \right)} \right]} \over \sigma }} \right){\varphi _V}\left( {{{v - {\mu _{\rm{r}}}} \over {{\sigma _{\rm{r}}}}}} \right){\rm{d}}v\quad ,$$
and
 $${F_W}\left( {w;x,\theta } \right) = \int_{ - \infty }^x {{1 \over {{\sigma _{\rm{r}}}}}{\Phi _{W|V}}} \left( {{{w - \left[ {{\beta _0} + {\beta _1}\log \left( {\exp \left( x \right) - \exp \left( v \right)} \right)} \right]} \over \sigma }} \right){\varphi _V}\left( {{{v - {\mu _{\rm{r}}}} \over {{\sigma _{\rm{r}}}}}} \right){\rm{d}}v\quad ,$$
where both φW|V and φV are assumed to be the standardized normal pdf. ΦW|V is the conditional cdf of W at a given V. θ = (β0, β1, σ, μr, σr). σ is a scale parameter.
To conveniently apply the above statistical model on the fatigue data of the Al0.5CoCrCuFeNi HEAs, the fatigue data of the samples in each testing condition were denoted by (n i, s i, δi), i = 1, 2, …, m, where m is the total number of observations in the condition, s i is the applied stress magnitude for the ith sample, n i is the number of cycles to failure or 107 run-out cycles, as indicated by the binary indicator of δi = 1 or δi = 0. The unknown parameters, θ, were estimated by the maximum likelihood method, that is, maximizing the likelihood function of the data given by
 $$L\left( \theta \right) = \prod\limits_{i = 1}^m {{{\left[ {{f_{\rm{W}}}\left( {{w_i};{x_i},\theta } \right)} \right]}^{{\delta _i}}}{{\left[ {1 - {F_{\rm{W}}}\left( {{w_i};{x_i},\theta } \right)} \right]}^{\left( {1 - {\delta _i}} \right)}}} \quad ,$$
where w i = log(n) and x i = log(s) for i = 1, 2, …, m. Numerical methods were used to compute the model parameters for the different conditions of Al0.5CoCrCuFeNi HEA samples.
After having the model parameters determined from Eq. (11), the p-quantile fatigue life, n p(s), at the stress level, s, can be calculated from
 $$\Pr \left( {n \le {n_{\rm{p}}}\left( s \right);s,\theta } \right) = p = {F_{\rm{W}}}\left( {\log \left( {{n_{\rm{p}}}\left( s \right)} \right);\log \left( s \right),\theta } \right)\quad .$$
The median fatigue life at p = 0.5 was computed to describe the average S–N behavior of the three conditions of HEA samples, and the predictions are shown in Fig. 4(b) as curves. In general, the mathematical predictions can reasonably capture the S–N relation of the HEAs in all three conditions.
When the fatigue-life data can seemly be classified into two groups [e.g., a strong group with long fatigue lives and a weak group with short fatigue lives in Fig. 4(a)], a Weibull mixture predictive model is more suitable. The pdf and cdf of the model are given, respectively, by
 $$f\left( {{{\left. {N\left( S \right)} \right|}_{\rm{p}}},{\alpha _{\rm{w}}}\left( S \right),{\beta _{\rm{w}}},{\alpha _{\rm{s}}}\left( S \right),{\beta _{\rm{s}}}} \right) = p{{{\beta _{\rm{w}}}} \over {{\alpha _{\rm{w}}}\left( S \right)}}{\left( {{{N\left( S \right)} \over {{\alpha _{\rm{w}}}\left( S \right)}}} \right)^{{\beta _{\rm{w}}} - 1}}\exp \left( { - {{\left( {{{N\left( S \right)} \over {{\alpha _{\rm{w}}}\left( S \right)}}} \right)}^{{\beta _{\rm{w}}}}}} \right) + \left( {1 - p} \right){{{\beta _{\rm{s}}}} \over {{\alpha _{\rm{s}}}\left( S \right)}}{\left( {{{N\left( S \right)} \over {{\alpha _{\rm{s}}}\left( S \right)}}} \right)^{{\beta _{\rm{s}}} - 1}}\exp \left( { - {{\left( {{{N\left( S \right)} \over {{\alpha _{\rm{s}}}\left( S \right)}}} \right)}^{{\beta _{\rm{s}}}}}} \right)\quad ,$$
and
 $$F\left( {{{\left. {N\left( S \right)} \right|}_{\rm{p}}},{\alpha _{\rm{w}}}\left( S \right),{\beta _{\rm{w}}},{\alpha _{\rm{s}}}\left( S \right),{\beta _{\rm{s}}}} \right) = p\left[ {1 - \exp \left( { - {{\left( {{{N\left( S \right)} \over {{\alpha _{\rm{w}}}\left( S \right)}}} \right)}^{{\beta _{\rm{w}}}}}} \right)} \right] + \left( {1 - p} \right)\left[ {1 - \exp \left( { - {{\left( {{{N\left( S \right)} \over {{\alpha _{\rm{s}}}\left( S \right)}}} \right)}^{{\beta _{\rm{s}}}}}} \right)} \right]\quad ,$$
where the subscripts, w and s, denote the weak and strong groups, respectively. P is the fraction of the samples that belong to the weak group. N is the cycles to failure. αw(S) and αs(S) are the Weibull scale parameters of the weak and strong groups, which scale with the stress, S, according to
 $$\log \left( {{\alpha _{\rm{w}}}\left( S \right)} \right) = {\gamma _{{\rm{w}},0}} + {\gamma _{{\rm{w}},1}}\log \left( S \right)\quad ,$$
and
 $$\log \left( {{\alpha _{\rm{s}}}\left( S \right)} \right) = {\gamma _{{\rm{s}},0}} + {\gamma _{{\rm{s}},1}}\log \left( S \right)\quad .$$
From Eqs. (13)–(16), the model contains 7 unknown parameters, that is, p, γw,0, γw,1, βw, γs,0, γs,1, and βs. Once again, these unknown model parameters were evaluated using the maximum likelihood method, with the likelihood function being
 $$L\left( {p,{\gamma _{{\rm{w}},0}},{\gamma _{{\rm{w}},1}},{\beta _{\rm{w}}},{\gamma _{{\rm{s}},0}},{\gamma _{{\rm{s}},1}},{\beta _{\rm{s}}}} \right) = \prod\limits_{i = 1}^m {f{{\left( {{N_i}} \right)}^{{\delta _i}}}{{\left[ {1 - F\left( {{N_i}} \right)} \right]}^{\left( {1 - {\delta _i}} \right)}}} \quad .$$
Once the values of the model parameters are determined, if a fatigue-life data at the ith sample, N i, belongs to the strong or weak group can be decided by considering which group has a higher likelihood value. Also, the p-quantile fatigue lives of the samples in the strong and weak groups are, respectively, calculated as
 $${N_{{\rm{p}},{\rm{w}}}}\left( S \right) = \exp \left( {{\gamma _{{\rm{w}},0}} + {\gamma _{{\rm{w}},1}}\log \left( S \right)} \right){\left( { - \log \left( {1 - p} \right)} \right)^{{1 / {{\beta _{\rm{w}}}}}}}\quad ,$$
and
 $${N_{{\rm{p}},{\rm{s}}}}\left( S \right) = \exp \left( {{\gamma _{{\rm{s}},0}} + {\gamma _{{\rm{s}},1}}\log \left( S \right)} \right){\left( { - \log \left( {1 - p} \right)} \right)^{{1 / {{\beta _{\rm{s}}}}}}}\quad .$$
With the determined model parameters of p = 0.369, γw,0 = 15.238, γw,1 = −0.555, βw = 3.773, γs,0 = 126.454, γs,1 = −16.245, and βs = 0.612, the predicted S–N curves at p = 0.025, 0.5, and 0.975 for both the strong and weak groups are plotted in Fig. 4(a).Reference Hemphill, Yuan, Wang, Yeh, Tsai, Chuang and Liaw20 The median S–N curves may be used for predicting the fatigue life or the endurance limit of the HEAs, and the 2.5 and 97.5 quantiles are useful in the construction of a 95% predictive interval and quantify the scatter in the fatigue life.
4. Comparison with other alloys
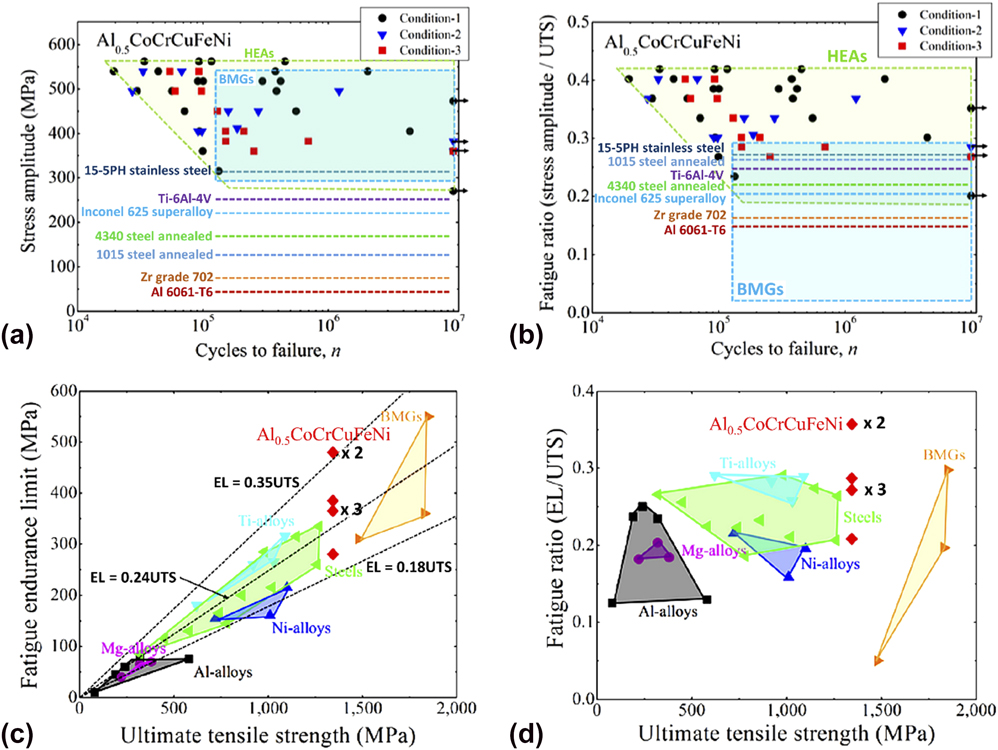
The fatigue strength of the Al0.5CoCrCuFeNi HEAs tested under three different conditionsReference Tang, Yuan, Tsai, Yeh, Lundin and Liaw21 was compared with some other commonly encountered structural alloys, including steels, aluminum alloys, nickel alloys, titanium alloys, bulk metallic glasses (BMGs), etc. The comparison is shown in Fig. 5(a) as plots of stress amplitude versus cycles to failure and compiled in Table II. For a clean presentation, the endurance limits for the crystalline alloys other than HEAs were plotted as dashed lines, and the data for BMGs are shown as a rectangle. Despite that the endurance limit of the HEAs covers a wide range from 270 to 473 MPa in the stress amplitude, σa (540–946 MPa in the stress range of Δσ), its lower bound still exceeds that of the majority of other alloys. Its upper bound is surpassed by some BMGs, mostly because these BMGs have higher strengths. To offset the strength effect, the stress amplitude was normalized by the ultimate tensile strength of the alloys, and the obtained fatigue ratio is replotted in Fig. 5(b).Reference Tang, Yuan, Tsai, Yeh, Lundin and Liaw21 As a consequence, the BMG fatigue rectangle is shifted downward relative to the HEAs, and the upper bound of the fatigue ratios of the HEAs becomes outperforming all alloys in comparison. Certainly, the lower half of the endurance limit range of the HEAs still overlaps with that of BMGs and some other alloys.
Fatigue data of the wrought Al0.5CoCrCuFeNi HEAs in comparison with conventional alloys and BMGs. (a) Stress amplitude versus cycles to failure. (b) Fatigue ratio versus cycles to failure. (c) Fatigue-endurance limit versus ultimate tensile strength. (d) Fatigue ratio versus ultimate tensile strength.Reference Tang, Yuan, Tsai, Yeh, Lundin and Liaw21

Fatigue strength and fatigue ratio of the HEAs in comparison with some conventional alloys.

As the fatigue strengths of structural alloys are usually linearly proportional to their ultimate tensile strength (σUTS), it is easy to understand that the exceptional fatigue strength of the HEAs is partly attributed to their high strength (σUTS = 1344 MPa). This assertion is justified by viewing the fatigue-endurance limit versus σUTS in Fig. 5(c) as well as the fatigue ratio versus σUTS in Fig. 5(d). Overall, in comparison with many conventional alloys, the Al0.5CoCrCuFeNi HEAs manifest favorable fatigue resistance and may have great potentials for structural applications that require prolonged fatigue lives.
B. Fatigue-crack growth rate
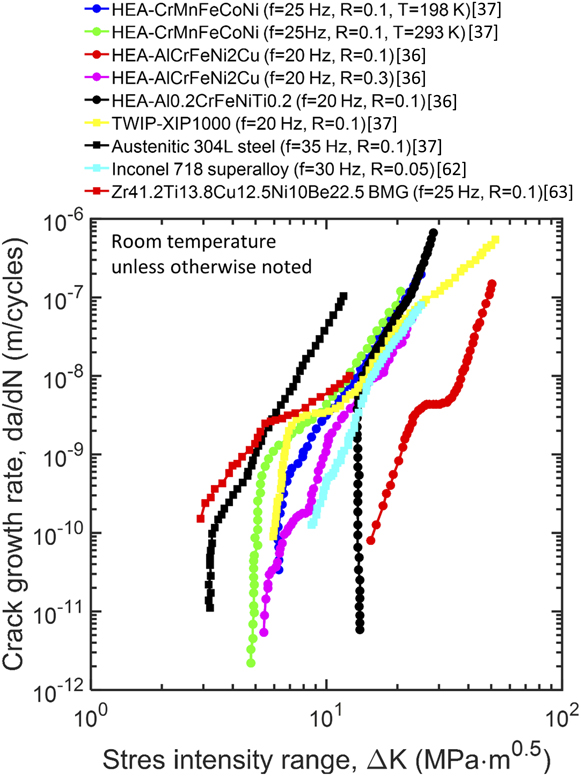
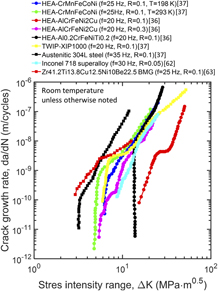
The material’s resistance to crack growth has been studied for the AlCrFeNi2Cu, Al0.2CrFeNiTi0.2, and CrMnFeCoNi HEAs.Reference Seifi, Li, Yong, Liaw and Lewandowski36,Reference Thurston, Gludovatz, Hohenwarter, Laplanche, George and Ritchie37 The first two consist of fcc + bcc phases, whereas the last possesses a single fcc structure. For the AlCrFeNi2Cu and Al0.2CrFeNiTi0.2 HEAs, three-point-bending tests were conducted to monitor the fatigue-crack growth of the as-cast, single-edge notch (SEN) samples at a cyclic frequency of 20 Hz in room-temperature air with a relative humidity of 40%, in accordance with the ASTM E647 standard.56 The samples, notches, and precracks were sized in accordance with the ASTM E399 standard,57 and the crack growth during the tests was monitored and controlled using a direct current potential drop technique.Reference Seifi, Li, Yong, Liaw and Lewandowski36 The fatigue tests on the CrMnFeCoNi HEAs were performed on disc-shaped compact tension [DC(T)] samples recrystallized at 1073 K for 1 h,Reference Thurston, Gludovatz, Hohenwarter, Laplanche, George and Ritchie37 also following the ASTM E647 standard.56 After machining the samples and notches according to the ASTM E1820 standard58 and performing suitable fatigue precracking, the cyclic loading was applied at a frequency of 25 Hz with a constant load ratio of R = 1. The crack length was monitored dynamically using both the optical-microscopy techniques and strain-gauge measurement on the back-face of the samples.Reference Thurston, Gludovatz, Hohenwarter, Laplanche, George and Ritchie37
In consideration of the factors that affect the fatigue-crack-propagation behavior, the fatigue-crack-growth rates of the AlCrFeNi2Cu and Al0.2CrFeNiTi0.2 HEAs had been surveyed at the load ratio of R = 0.1, 0.3, and 0.7,Reference Seifi, Li, Yong, Liaw and Lewandowski36 and the CrMnFeCoNi HEA had been tested at the temperatures of 293 and 198 K.Reference Thurston, Gludovatz, Hohenwarter, Laplanche, George and Ritchie37 The key results acquired from these investigations are presented as follows.
1. Temperature effect
The blue and green circles in Fig. 6 depict the crack-growth rate,  ${{{\rm{d}}a} \over {{\rm{d}}N}}$, of the CrMnFeCoNi HEA at 198 and 293 K, respectively, as a function of the applied stress-intensity-factor range, ΔK.Reference Thurston, Gludovatz, Hohenwarter, Laplanche, George and Ritchie37 It is seen that at high ΔK, i.e., >10 MPa m1/2, the crack growth rates of the alloy at the two different temperatures are nearly identical. The temperature effect on the crack-growth rate kicks in when ΔK moves toward small values. Specifically, at the same level of ΔK, the crack-growth rate at 198 K is approximately one order of magnitude smaller than that at 293 K. Treating the threshold fatigue stress-intensity-factor range, ΔK th, as the maximum value of ΔK that gives a crack-growth rate approaching 10−11 m/cycle, ΔK th values for the alloys tested at 293 and 198 K were determined to be ∼4.8 and ∼6.3 MPa m1/2.Reference Thurston, Gludovatz, Hohenwarter, Laplanche, George and Ritchie37 Clearly, the ΔK th increases by ∼30% as the testing temperature decreases from 293 to 198 K. This is a clear implication that the CrMnFeCoNi HEA is more resistant to crack propagation at cryogenic temperatures, essentially consistent with the previous findings that reduced temperatures can lead to the improved yield strength, ductility, and fracture toughness.Reference Gludovatz, Hohenwarter, Catoor, Chang, George and Ritchie13,Reference Gludovatz, Hohenwarter, Thurston, Bei, Wu, George and Ritchie59 Besides, a modest change in the Paris exponent from 3.5 at 293 K to 4.5 at 198 K was noted.Reference Thurston, Gludovatz, Hohenwarter, Laplanche, George and Ritchie37
The fatigue-crack-growth behavior of the CrMnFeCoNi, AlCrFeNi2Cu, and Al0.2CrFeNiTi HEAs in comparison with some other advanced materials.

Examination of the crack-propagation path at the sectioned mid-thickness plane by BSE and EBSD scans revealed that the transgranular fracture was the dominant crack propagation mode in the sample tested at 293 K.Reference Thurston, Gludovatz, Hohenwarter, Laplanche, George and Ritchie37 By contrast, the intergranular fracture prevailed in the sample at 198 K.Reference Thurston, Gludovatz, Hohenwarter, Laplanche, George and Ritchie37 As the intergranular fracture tends to cause a more deviated crack-propagation path than the transgranular fracture, more pronounced physical contact will occur between neighboring crack flanks in the sample tested at 198 K. Combining with the alloy’s higher strength at cryogenic temperatures, more pronounced roughness-induced crack closure would take place, and the alloy, thus, exhibited greater crack growth resistance at 198 K.
2. Effect of the load ratio, R
The effect of the load ratio on the fatigue-crack-growth behavior of the as-cast AlCrFeNi2Cu and Al0.2CrFeNiTi HEAs was studied by Seifi et al. at room temperature by setting R = 0.1, 0.3, and 0.7 and plotting  ${{{\rm{d}}a} \over {{\rm{d}}N}}$ as a function of ΔK at the three different load ratios.Reference Seifi, Li, Yong, Liaw and Lewandowski36 Overall, as the load ratio increases from 0.1 to 0.7, the entire fatigue-crack growth curve tends to shift toward the low ΔK regime, e.g., red and purple circles in Fig. 6. The Paris slope, m, for R = 0.1, 0.3, and 0.7 was calculated to be 4.9, 5.3, and 25.8.Reference Seifi, Li, Yong, Liaw and Lewandowski36 An ascending tendency is noted, and a significant amplification in the Paris slope is found at a high R value of 0.7. In many other metallic material systems,Reference Seifi, Li, Yong, Liaw and Lewandowski36,Reference Ritchie and Knott60,Reference El-Shabasy and Lewandowski61 an increased Paris slope and, thus, the crack-growth rate with increasing R usually implies an increase in static modes of brittle failure in the Paris regime. This scenario was believed to be true as well to both the AlCrFeNi2Cu and Al0.2CrFeNiTi HEAs, as a large portion of brittle fracture characteristics had been observed on the fracture surfaces of these alloys.Reference Seifi, Li, Yong, Liaw and Lewandowski36 Additionally, ramping up the load ratio, R, from 0.1 to 0.3, and finally to 0.7 leads to a reduction in ΔK th from 16 to 7 MPa m1/2, and finally to 5 MPa m1/2.Reference Seifi, Li, Yong, Liaw and Lewandowski36 The trend, as expected from the common wisdom, indicates a reduced resistance of the alloy to fatigue crack growth when higher load ratios are applied, which is presumably ascribed to diminished levels of fatigue-crack closure.
3. Comparison with other alloys
The full trajectories of fatigue-crack-growth rate of the CrMnFeCoNi,Reference Thurston, Gludovatz, Hohenwarter, Laplanche, George and Ritchie37 AlCrFeNi2Cu,Reference Seifi, Li, Yong, Liaw and Lewandowski36 and Al0.2CrFeNiTiReference Seifi, Li, Yong, Liaw and Lewandowski36 HEAs were compared with some selected advanced alloys in Fig. 6, including the austenitic 304L steel,Reference Thurston, Gludovatz, Hohenwarter, Laplanche, George and Ritchie37 a twinning-induced plasticity (TWIP) steel,Reference Thurston, Gludovatz, Hohenwarter, Laplanche, George and Ritchie37 Inconel 718 superalloy,Reference Xiao, Chen and Chaturvedi62 and Zr41.2Ti13.8Cu12.5Ni10Be22.5 BMG.Reference Gilbert, Ritchie and Johnson63 It can be seen that among these materials, the two types of Al-containing HEAs bear the highest ΔK th and moderate Paris slope, m. They are, therefore, in the possession of favorable fatigue-crack-growth resistance in comparison with the Mn-containing HEA and nearly all other materials in comparison. The fatigue resistance of the Mn-containing HEA exceeds the Inconel 718 superalloy and is comparable with that of the 304L steel, TWIP-XIP1000 steel, and Zr41.2Ti13.8Cu12.5Ni10Be22.5 BMG. In addition to these alloys, Table III compiles the fatigue threshold and Paris slope of more structural materials tested in comparable conditions. Out of the majority of these alloys, both the Mn-containing and Al-containing HEAs manifest favorable fatigue-crack-growth resistance. Particularly for the CrMnFeCoNi HEA, a remarkable combination of high strength, good ductility, excellent fracture toughness, and outstanding fatigue-crack growth resistance makes them a very promising structural material for applications under harsh environments.
Fatigue-crack-growth properties and testing conditions of the HEAs in comparison with selected conventional alloys.

a RT = room temperature.
C. Fractography
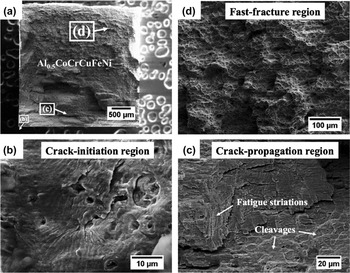
As conventional alloys, the fatigue failure of HEAs also experiences crack initiation, slow and stable crack propagation, and fast fracture. This process is illustrated in Fig. 7 by the SEM micrographs of the fracture surfaces of the Condition-3 Al0.5CoCrCuFeNi HEA.Reference Tang, Yuan, Tsai, Yeh, Lundin and Liaw21 The alloy was made from high-purity raw materials (> 99.9 wt%) and homogenized at 1000 °C for 6 h, followed by water quenching and cold rolling, and fatigued under the three-point bending test at a frequency of 10 Hz, room temperature, and R = 1. Failure occurred at a stress amplitude of 495 MPa with a fatigue life of 97,715 cycles.Reference Tang, Yuan, Tsai, Yeh, Lundin and Liaw21 Figure 7(a) first gives an overview of the fatigue-fracture surface of the sample, from which the regions (b), (c), and (d) were, respectively, identified as the crack-initiation region, stable crack-propagation region, and fast fracture region.Reference Tang, Yuan, Tsai, Yeh, Lundin and Liaw21 It is seen that the fatigue crack is initiated from the corner of the tensile-stress surface. A more detailed examination of the crack-initiation region in Fig. 7(b) reveals many pores.Reference Tang, Yuan, Tsai, Yeh, Lundin and Liaw21 It is, therefore, reasoned that these pores raise up the stress locally and initiate the cracks. Figure 7(c),Reference Tang, Yuan, Tsai, Yeh, Lundin and Liaw21 a magnified view of the stable crack-propagation region, reveals a feature of combined striations and cleavage facets, which indicates that the cracks propagate in both ductile and brittle modes. The orientation of the striations is somewhat varied, rather than having a well-defined direction relative to the crack-propagation direction. This kind of striation morphology might stem from cracks initiating from multiple pores, and their propagation is also deviated by interior pores from time to time.Reference Tang, Yuan, Tsai, Yeh, Lundin and Liaw21 The fast-fracture region, shown closely in Fig. 7(d),Reference Tang, Yuan, Tsai, Yeh, Lundin and Liaw21 consists of numerous dimples and tear ledges, which are typical ductile fracture features. The ductile fracture of the Al0.5CoCrCuFeNi HEA at the final stage of fatigue is found by SEM observations to be accommodated by a multitude of slip bands.Reference Tang, Yuan, Tsai, Yeh, Lundin and Liaw21 The Al0.5CoCrCuFeNi HEAs obtained in other conditions exhibit similar fractographic characteristics.Reference Tang, Yuan, Tsai, Yeh, Lundin and Liaw21
SEM graphs of the fracture surfaces of a Condition-3 Al0.5CoCrCuFeNi HEA, failed at 97,715 fatigue cycles at a stress amplitude of 495 MPa, room temperature, and a load ratio of R = 0.1, showing the (a) overview, (b) crack-initiation region, (c) crack-propagation region, and (d) fast-fracture region.Reference Tang, Yuan, Tsai, Yeh, Lundin and Liaw21

On the other hand, the fatigue-fracture surface of the AlCrFeNi2Cu HEA in the fast-fracture phase features only a small amount of isolated dimple-like regions whereas the majority is the faceted brittle fracture regions.Reference Seifi, Li, Yong, Liaw and Lewandowski36 And the proportion and size of the dimple-like region becomes even reduced on the fracture surface of the Al0.2CrFeNiTi HEAs.Reference Seifi, Li, Yong, Liaw and Lewandowski36 Therefore, the fatigue fracture in these two alloys is primarily dominated by the brittle failure, with the small-scale ductile failure.
D. Deformation and failure mechanisms
The TEM analyses had been applied to unveil the deformation mechanism underlying the remarkable fatigue resistance of the Al0.5CoCrCuFeNi HEA.Reference Tang, Yuan, Tsai, Yeh, Lundin and Liaw21 Although it was found that nanotwins and tangled dislocations in the alloy had been triggered in the cold-rolling process prior to fatigue tests, cyclic loading indeed induced a higher density of nanotwins and tangled dislocations particularly at the crack-initiation site. Specifically, two sets of differently oriented nanotwins,  $\left[ {2\bar{1}1} \right]$ and
 $\left[ {21\bar{1}} \right]$ ones, were created at the crack-initiation site. The increase in the amount of nanotwins takes place prior to crack initiation and induces extra work hardening, thereby offering more resistance to crack initiation. As a result, the Al0.5CoCrCuFeNi HEA yields favorable fatigue strength and fatigue ratio when compared with conventional alloys.Reference Hemphill, Yuan, Wang, Yeh, Tsai, Chuang and Liaw20,Reference Seifi, Li, Yong, Liaw and Lewandowski36
IV. FRACTURE BEHAVIOR OF HEAS
A. Fracture toughness
Fracture toughness is a measure of crack resistance or damage tolerance of materials, which plays a critical role in understanding the fracture mechanism of materials as well as designing practically used structural components.Reference Anderson38 Acquiring the damage-tolerance values of HEAs is indispensable for a complete assessment of their suitability in structural applications. As of now, fracture toughness of several single-phase HEAs, multiphase HEAs, and medium-entropy alloys (MEAs) has been measured.
1. Single-phase HEAs and MEAs
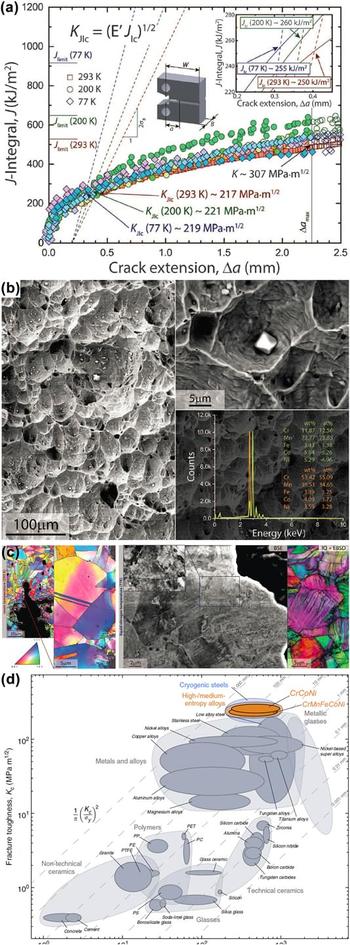
Gludovatz et al.Reference Gludovatz, Hohenwarter, Catoor, Chang, George and Ritchie13 conducted detailed fracture-toughness studies on a five-component equiatomic CoCrFeMnNi HEA, and a three-component equiatomic CoCrNi MEAReference Gludovatz, Hohenwarter, Thurston, Bei, Wu, George and Ritchie59 using fatigue-precracked compact-tension specimens, both of which possess a recrystallized, single-phase fcc microstructure. The five-component alloy, with a uniform grain size of ∼6 μm, shows a crack-initiation fracture toughness, K JIc, of 217 MPa m1/2 at room temperature (RT) and a crack-growth fracture toughness, K, of more than 300 MPa m1/2 after ∼2 mm crack propagation. As given in Fig. 8(a), the K JIc value remains almost unchanged with lowering the temperature to 198 K (low temperature, LT) and cryogenic nitrogen temperature of 77 K (LNT), despite the strength remarkably increases (the yield strength, σy, and ultimate tensile strength, σUTS, increase by ∼85% and ∼70%, respectively). These astonishing toughness-fracture values are comparable to those of austenitic stainless steels, such as 304L and 316L at RT, and best cryogenic steels (e.g., 5Ni and 9Ni) at LNT. Such high toughness is attributed to a full ductile fracture by microvoid coalescence, in which microvoids nucleate at the crack tip due to stress concentration at Cr-rich and/or Mn-rich oxides [Fig. 8(b)], then grow together, and form a macroscopic flaw to fracture. These particles are easily introduced from processing, e.g., melting, and casting for the reactive element of Mn. The initial-crack-tip opening displacements at crack initiation (CTODi) are 57 ± 19 μm at RT and 49 ± 13 μm at LNT, which contribute to the exceptional crack initiation toughness of this alloy. The other contribution is derived from the steady strain hardening (the strain-hardening exponent, n, of ∼0.4 at RT, LT, and LNT), which can effectively suppress plastic instability. The steady strain hardening permits the increase of toughness with crack extension, ultimately resulting in values over ∼300 MPa m1/2 for all testing temperatures. Such high steady strain hardening intrinsically comes from the plastic deformation by the predominated mode of the dislocation planar slip at RT, and deformation-induced nanotwinning at LNT, as illustrated in Fig. 8(c). Twinning enhances continuous strain hardening by introducing new twin boundaries when deformed at the liquid nitrogen temperature. Moreover, the samples tested at 77 K show more deflected crack paths on the fracture surface than those tested at RT, evidencing the enhanced toughness at LNT.
(a) J-integral crack–resistance curves of the fcc CrMnFeCoNi HEAs at 77 K, 200 K, and 293 K, from which the fracture toughness, K JIC, can be determined.Reference Gludovatz, Hohenwarter, Catoor, Chang, George and Ritchie13 (b) Evidence of the formation of microvoids from Cr- or Mn-rich particles in the alloy at room temperature, suggesting the ductile failure.Reference Gludovatz, Hohenwarter, Catoor, Chang, George and Ritchie13 (c) Left: the EBSD images in the vicinity of the crack tip in the deformed CrMnFeCoNi HEA at 293 K, showing the formation of annealing twins and dislocation-induced grain misorientations. Right: the BSE and EBSD images in the wake of the propagated crack in the deformed alloy at 77 K, showing pronounced cell structures resulting from dislocation activities as well as deformation-induced nanotwins.Reference Gludovatz, Hohenwarter, Catoor, Chang, George and Ritchie13 (d) Comparison of the HEAs and other materials in the Ashby map of the fracture toughness versus yield strength.Reference Gludovatz, Hohenwarter, Thurston, Bei, Wu, George and Ritchie59

The ternary CoCrNi MEA, following recrystallization, features a nonuniform microstructure with grain sizes of ∼5–50 μm. The fracture toughness, K JIc, at crack initiation is 208 MPa m1/2 and increases to ∼290 MPa m1/2 as the crack extends by ∼2 mm.Reference Gludovatz, Hohenwarter, Thurston, Bei, Wu, George and Ritchie59 The crack initiation and growth toughness increase by 31 and 48%, respectively, when decreasing the temperature to LNT. The fracture toughness of the three-component alloy is comparable to that of the five-component alloy at RT, but higher by ∼25% at LNT. The high toughness values of the ternary alloy are associated with the fully ductile fracture by microvoid coalescence, with a more pronounced stretch zone at crack initiation. Microvoids of the ternary alloy are initiated at the Cr-rich particles, whereas in the five-component HEA, the initiation of microvoids is found at Cr-rich and Mn-rich particles of a higher volume fraction. The exceptional damage-tolerance of the ternary alloy at RT also results from the continuous steady strain hardening induced by a combined deformation mode of the pronounced dislocation slip and nanotwinning. Deformation-induced nanotwinning becomes the major mode at LNT to carry the plastic strain with increasing twinning activity, providing a steady source of strain hardening. Thus, the strength, ductility, and toughness of the CoCrNi MEA are simultaneously enhanced, exceeding those of the CoCrFeMnNi HEA [Fig. 8(d)].
2. Multiphase HEAs
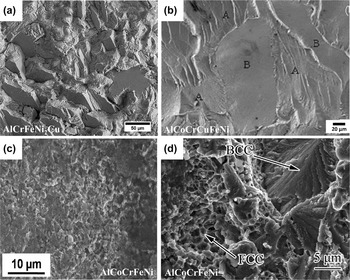
With three-point bending of SEN samples, Seifi et al.Reference Seifi, Li, Yong, Liaw and Lewandowski36 reported that the conditional fracture toughness values, K q, of two as-vacuum arc-cast Al0.2CrFeNiTi0.2 and AlCrFeNi2Cu HEAs are in the range of 32–35 and 40–45 MPa m1/2, respectively. Both the Al0.2CrFeNiTi0.2 and AlCrFeNi2Cu HEAs have a mixed microstructure consisting of bcc and fcc phases, and their toughness values are far below that of the recrystallized, single-phase fcc HEAs and MEAs.Reference Gludovatz, Hohenwarter, Catoor, Chang, George and Ritchie13,Reference Gludovatz, Hohenwarter, Thurston, Bei, Wu, George and Ritchie59 The toughness of these alloys may be enhanced by introducing fatigue precrack with a notch-root radius of ∼100 μm.Reference Seifi, Li, Yong, Liaw and Lewandowski36 Increasing the testing temperature to 473 K increases the toughness of these two HEAs as well, and the load versus displacement curves start showing a nonlinear regime, opposed to the linear relation at RT. A combination of brittle features and some isolated ductile regions are observed on all fracture surfaces of the two HEAs tested at RT and 473 K [Fig. 9(a)]. The brittle and ductile features are roughly corresponding to the microstructural characteristics, e.g., the size and volume fraction of the bcc and fcc constituents, respectively. The Al0.2CrFeNiTi0.2 alloy is relatively less tough with fewer ductile regions and larger-scale brittle features, resulting from a less volume fraction of the fcc phase, as compared to that of the AlCrFeNi2Cu alloy.
(a) SEM image of the fatigue-fractured surface of the AlCrFeNi2Cu HEA, showing the cleavage failure along with some isolated dimple features.Reference Seifi, Li, Yong, Liaw and Lewandowski36 (b) Fractograph of the AlCoCrCuFeNi HEA exhibiting cleavage facets and river-like lines.Reference Roy, Roy, Daoud, Glatzel and Ray64 (c) Fracture surface of the AlCoCrFeNi HEA sintered by the powder metallurgy at 1273 K.Reference Mohanty, Maity, Mukhopadhyay, Sarkar, Gurao, Bhowmick and Biswas65 (d) Secondary electron image of the fracture surface of the AlCoCrFeNi HEA.Reference Zhang, Han, Meng, Su and Li66

Roy et al.Reference Roy, Roy, Daoud, Glatzel and Ray64 determined the fracture toughness of the as-cast Al23Co15Cr23Cu8Fe15Ni15 HEA, by conducting three-point-bending tests on single-edge-notched bend (SENB) and chevron-notched rectangular bars (CVNRBs). The microstructure is dendritic with a large primary grain size, within which Fe–Co-rich bcc precipitates with sizes of 200–500 nm disperse in an ordered bcc Al–Ni-rich matrix, and a small volume fraction of fcc Cu-rich particles precipitate at grain boundaries. The fracture-toughness values from the SENB and CVNRB samples, K q and K Icv, are 5.8 ± 0.2 MPa m1/2 and 5.4 ± 0.2 MPa m1/2, respectively. Again, these fracture values are far lower than those of the fully recrystallized CoCrFeMnNi HEAs and CoCrNi MEAs. The K q value is slightly higher than the K Icv value due to the fact that the SENB samples are not fatigue precracked. The fracture surface exhibits four distinguishing characteristics, i.e., river-line-type features, featureless facets, regions mixed river lines and featureless facets, and secondary cracks [Fig. 9(b)]. Thus, the cracking of the material is of a cleavage type, similar to conventional crystalline materials.
The fracture toughness, K I ≈ 3.9 MPa m1/2, measured using the single-edge-V-notched beam method, is obtained for an annealed, spark-plasma-sintered (SPS) AlCoCrFeNi HEA.Reference Mohanty, Maity, Mukhopadhyay, Sarkar, Gurao, Bhowmick and Biswas65 Such a low toughness value is closely related to the full brittle fracture initiated from the nanosized σ-phase precipitates [Fig. 9(c)]. A much higher toughness of K q ≈ 25.2 MPa m1/2 for a SPS AlCoCrFeNi HEA is achieved in three-point-bending tests of the SENB specimens.Reference Zhang, Han, Meng, Su and Li66 A combination of the cleavage fracture in the bcc phase and microvoid coalescence in the fcc phase appears on the fracture surface [Fig. 9(d)]. The difference in the fracture toughness of the two sintered HEAs is associated with their microstructures, in which the tough HEA shows no appearance of the brittle nanocrystalline σ-phase.
B. Fracture under quasi-static uniaxial loading
The most studied fracture type is induced by quasi-static uniaxial loading, especially tension and compression. The fracture behaviors upon being subjected to uniaxial tension or compression stresses, depending on whether the individual HEA is ductile or brittle, is closely related to the measured properties, such as strength and ductility.
1. Quasi-static uniaxial tensile loading
The single-phase fcc CoCrFeMnNi alloy, the most studied HEA, shows dimples with Cr- and/or Mn-oxides on the fracture surface under uniaxial tension loading, which are formed by microvoid nucleation at the particles and coalescence.Reference Gludovatz, Hohenwarter, Catoor, Chang, George and Ritchie13,Reference Zaddach, Scattergood and Koch67,Reference Gali and George68 On the other hand, no particles occur inside the dimples on the fracture surface for the CoCrFeNi HEA due to the absence of the reactive element of Mn.Reference Zaddach, Scattergood and Koch67 Much less necking is found when decreasing the tested temperature down to 77 K.Reference Gludovatz, Hohenwarter, Catoor, Chang, George and Ritchie13,Reference Gali and George68 This is because the high strain-hardening shows up at low temperatures and tends to suppress necking instability. Such a ductile fracture is even unchanged in a hydrogen-charged CoCrFeMnNi HEA. Specifically, only ∼5% reduction in the tensile ductility is noted relative to the uncharged counterpart.Reference Zhao, Lee, Seok, Lee, Phaniraj, Suh, Ha, Kim, Ramamurty and Jang69 However, the intergranular fracture appears at the edges when the hydrogen concentration is high. Even so, a ductile mode of microvoid coalescence is still observed in the inner regions where the hydrogen concentration is low.Reference Luo, Li and Raabe70 When increasing the temperature to 1073 K and testing at a strain rate of 8 × 10⁻⁴ s−1, intergranular fracture prevails with cracks perpendicular to the tensile stress axis.Reference He, Zhu, Zhou, Liu, Nieh and Lu71 Furthermore, processing routines, not only temperature, significantly influence the fracture behaviors of single-phase HEAs. The additively manufactured Al0.3CoCrFeNi HEA is fractured by an intergranular mode.Reference Joseph, Stanford, Hodgson and Fabijanic72 A Bridgman-solidification-synthesized CoCrFeNiAl0.3 HEA single crystal is tension-fractured by a shear mode with a relatively smooth surface, and a much less necking, compared to that of the polycrystalline specimen.Reference Ma, Zhang, Qiao, Wang, Gao, Jiao, Yang and Zhang73 The nanocrystalline CoCrFeMnNi HEA, prepared by severe plastic deformation using high-pressure torsion, shows a ductile fracture with dimples in sizes of several hundred nanometersReference Schuh, Mendez-Martin, Völker, George, Clemens, Pippan and Hohenwarter7 [Fig. 10(a)]. The fracture mechanism transforms into an intergranular mode in a 723 K-annealed specimen due to the formation of multiphase particles at grain boundaries [Figs. 10(b) and 10(c)]. Further increasing the annealing temperature to 873 and 973 K, very dense dimple-containing particles are observed [Figs. 10(d) and 10(e)]. Coarser-sized dimples without particles are found when annealing at 1073 KReference Schuh, Mendez-Martin, Völker, George, Clemens, Pippan and Hohenwarter7 [Fig. 10(f)]. A full ductile fracture covered by dimples is also shown in a cold-rolled, refractory HfNbTaTiZr HEA with a bcc structure,Reference Senkov and Semiatin4 and some other bcc-type alloys, including the Hf25Nb25Ti25Zr25,Reference Wu, Cai, Wang, Si, Zhu, Wang and Hui74 TaHfZrTi,Reference Huang, Wu, He, Wang, Liu, An, Wu and Lu75 and Hf0.5Nb0.5Ta0.5Ti1.5Zr HEAs.Reference Sheikh, Shafeie, Hu, Ahlström, Persson, Veselý, Zýka, Klement and Guo76
Fractographs of the nanocrystalline fcc CoCrFeMnNi HEAs (a) subjected to severe plastic deformation, and continual annealing at (b) 450 °C for 1 h, (c) 450 °C for 15 h, (d) 600 °C for 1 h, (e) 700 °C for 1 h, and (f) 800 °C for 1 h.Reference Schuh, Mendez-Martin, Völker, George, Clemens, Pippan and Hohenwarter7

A ductile fracture mode also exhibits in a tension-fractured, precipitation-strengthened CoCrFeNiMo0.3 HEA, in which microvoids initiate along the grain boundary–precipitate interfaces and large intermetallic particles.Reference Liu, Lu, He, Luan, Wang, Liu, Liu, Chen and Liu77 Oxides of Cr and Mn inside dimples, again, are observed in the as-cast, multiphase Fe0.4Cr0.4NiMnxCu (0 ≤ x ≤ 1.4) HEAs consisting of fcc and bcc phases, at which microvoids are nucleated.Reference Rao, Wang, Zhu, Chen, Wang, Si, Wu and Hui78 A mixed fracture feature with regions of dimpled and faceted appearance is present in a fractured specimen for a direct-laser-fabricated Al0.6CoCrFeNi HEA, in which voids and cracks are formed at the fcc/bcc interface.Reference Joseph, Stanford, Hodgson and Fabijanic79 With the addition of Al, a homogenized AlCoCrFeNi HEA exhibits a transgranular fracture.Reference Ghassemali, Sonkusare, Biswas and Gurao80 Cracks are initiated at the triple junction of the bcc grains, and the fcc precipitates at the bcc grain boundaries block crack propagation. Thereby, the cracks are branched into new cracks, redirected, or even terminated at grain boundaries.Reference Ghassemali, Sonkusare, Biswas and Gurao80 Intergranular fracture is also reported in both as-cast and homogenized AlCoCrFeNi HEAs undergoing uniaxial tension at 973 K.Reference Tang, Senkov, Parish, Zhang, Zhang, Santodonato, Wang, Zhao, Yang and Liaw81 The intergranular cracks and/or voids form at the intersections of several grain boundaries or grain boundaries perpendicular to the principal tensile stress axis.Reference Tang, Senkov, Parish, Zhang, Zhang, Santodonato, Wang, Zhao, Yang and Liaw81 An eutectic AlCoCrFeNi2.1 HEA, consisting of B2 and A1 phases, shows fracture features mainly of trench-like appearance when tested at ambient and cryogenic temperatures.Reference Lu, Gao, Jiang, Chen, Wang, Jie, Kang, Zhang, Guo, Ruan, Zhao, Cao and Li82
2. Quasi-static uniaxial compressive loading
Most reported HEAs are brittle upon tensile loading at RT. In addition to tensile loading, fracture behaviors of HEAs are also characterized with compression tests. Two refractory HEAs, V20Nb20Mo20Ta20W20 and Nb25Mo25Ta25W25 alloys, show quasi-cleavage fracture features (i.e., flat facets, angular-faceted steps, river-pattern markings, cleavage feathers, and tongues) and separate into several pieces when compressed at 298 K.Reference Senkov, Wilks, Scott and Miracle24 At the high temperature of 1073 K, the Nb25Mo25Ta25W25 HEA fractures along a localized shear band, in which grains are heavily plastically deformed. Crack propagation of the V20Nb20Mo20Ta20W20 HEA is along grain boundaries.Reference Senkov, Wilks, Scott and Miracle24 A TaNbHfZr HEA with an as-cast microstructure shows a barreling without cracks on the surface. The annealed alloys are brittle-fractured by shearing.Reference Maiti and Steurer83 With the Nb addition, the tension-ductile CoCrFeNi HEA gradually becomes brittle, as CrCoFeNiNb0.25 and CrCoFeNiNb0.25 alloys show torn edges. The CrCoFeNiNb0.8 alloy presents the facet granular surface by crack initiation at the primary Laves phase first and propagates to the eutectic laminar structures.Reference He, Wang, Cheng, Wang, Li, Dang, Wang and Liu84 The morphology on the fracture surface in compression-tested HEAs is changed by the elemental addition. The microstructure, depending on preparation methods, influences the compression-fracture behavior as well. A selective-electron-beam-melting-fabricated AlCoCrFeNi specimen fails by the intergranular fracture upon the compression test. The as-cast specimen exhibits a cleavage fracture morphology on the fracture surface.Reference Fujieda, Shiratori, Kuwabara, Kato, Yamanaka, Koizumi and Chiba85
C. Fracture under high strain-rate loading
1. Impact loading
A series of the as-cast AlxCoCrFeNi (x = 0, 0.1, 0.75, and 1.5)Reference Xia, Gao and Zhang86 and Al0.1, Al0.3 HEAsReference Li and Zhang87 with a fully recrystallized microstructure are Charpy-impact-tested at temperatures from 298 to 77 K using V-notch specimens. The recrystallized Al0.1 and Al0.3 alloys are predominately ductile-fractured at 298 K by microvoid nucleation and coalescence. The fracture surface shows brittle fracture features in a small amount of regions initiated by a high degree of shock hardening.Reference Li and Zhang87 With the addition of Al, the area of dimple-like regions decreases, i.e., the Al0.3 samples contain more dimples than the Al0.1 ones. When lowering the temperature to 77 K, the dimple-like regions gradually reduce and the brittle-fracture regions increase, with the alloys exhibiting a high density of tear edges and low impact energies.Reference Xia, Gao and Zhang86,Reference Li and Zhang87 However, an improvement in Charpy-impact energies with decreasing temperature is observed for the as-cast Al0 and Al0.1 specimens.Reference Xia, Gao and Zhang86 This trend is associated with the sizes of dimples on fracture surfaces (Fig. 11). The 77 K-tested specimens show much smaller and deeper dimples, compared to the specimens tested at 200 and 298 K [Figs. 11(a)–11(f)]. As for the Al0.75 and Al1.5 HEAs, brittle fracture features, e.g., river-like patterns and multifaceted surfaces, are present on the fracture surface, indicating a primary cleavage fracture modeReference Xia, Gao and Zhang86 [Figs. 11(g)–11(i)]. Therefore, very low levels of impact energies (0.64–3.58 J) are obtained at 298, 200, and 77 K.Reference Xia, Gao and Zhang86
The fractographs of the fcc CoCrFeNi (a–c), fcc Al0.1CoCrFeNi (d–f), and bcc Al1.5CoCrFeNi (g–i) HEAs failed in Charpy-impact tests at 77 K (a, d, and g), 200 K (b, e, and h), and 298 K (c, f, and i).Reference Xia, Gao and Zhang86

2. Dynamic loading
Exceptional resistance to shear failure is reported for the Al0.3CoCrFeNi HEA when it undergoes dynamic compression under Split Hopkinson pressure bar (SHPB) experiments.Reference Li, Zhao, Diao, Liaw and Meyers88 Similarly, no fracture or observable cracking appears upon dynamic tests for the as-cast AlCrCuFeNi2 HEA, conducted at RT and strain rates of 955–2531 s−1 using an SHPB apparatus.Reference Ma, Jiao, Qiao, Yang, Zhang and Wang89 This trend is due to the insufficient loading time for achieving the localized stress concentration upon the tests. At higher strain rates of 3044 and 3182 s−1, the dynamic-tested specimen fails by a shear mode at an angle of ∼45°, showing torn ridges as well as dimple-like profiles. The as-cast, two-phase (A2 + B2) AlCoCrFeNiTix (x = 0, 0.2, and 0.4) HEAs are also dynamically compressed using the SHPB set-up at strain rates in the range of 960–2900 s−1.Reference Jiao, Ma, Chu, Yang, Wang, Zhang and Qiao90 Most tested Ti0 specimens are not broken. Instead, the barreling occurs. For the Ti0.2 and Ti0.4 alloys, the tested specimens are separated into many small fragments, once the applied strain-rate reaches above a critical value. Similarly, the specimen of the HfZrTiTa0.53 HEA is cracked but not completely broken after the dynamic-compression test at the strain rate of 950 s−1 using a SHPB system and cylindrical projectile.Reference Zhang, Zhang, Tang, Zhu, Ye, Li and Bai91 A fracture angle of 49.6° to the compression load axis is observed on the lateral surface. Two regions, consisting of elongated shear dimples of a uniform size and equiaxial dimples with a nonuniform size, appear on the fracture surface of the specimens tested at the strain rate of 1500 s−1. The boundaries of the dimples are melted by the significant heat generated from the dynamic compression.
V. SUMMARY OF PRESENT RESEARCH
As of now, the creep behavior of a number of HEA systems has been reported, including bulk Al0.15CoCrFeNi,Reference Youssef, Zaddach, Niu, Irving and Koch11 Al0.6CoCrFeNi,Reference Youssef, Zaddach, Niu, Irving and Koch11 Ni47.9Al10.2Co16.9Cr7.4Fe8.9Ti5.8Mo0.9Nb1.2W0.4C0.4,Reference Tsao, Yeh, Kuo, Kakehi, Murakami, Yeh and Jian30 CoCrFeMnNi,Reference Lee, Seok, Zhao, Choi, He, Lu, Suh, Ramamurty, Kawasaki, Langdon and Jang33 Al0.3CoCrFeNi,Reference Zhang, Yu, Cheng, Zhang, Diao, Shi, Chen, Chen, Feng, Bai, Jing, Ma, Liaw, Li and Liu31 as well as CoCrFeNiCu and CoCrFeNiCuAl2.5 films.Reference Ma, Peng, Wen and Zhang34,Reference Ma, Feng, Debela, Peng and Zhang35 Uniaxial stress-relaxation tests at 580–700 °C,Reference Youssef, Zaddach, Niu, Irving and Koch11 uniaxial creep tests at 750–982 °C,Reference Tsao, Yeh, Kuo, Kakehi, Murakami, Yeh and Jian30 and spherical and Berkovich nanoindentation tests at RTReference Zhang, Yu, Cheng, Zhang, Diao, Shi, Chen, Chen, Feng, Bai, Jing, Ma, Liaw, Li and Liu31,Reference Lee, Seok, Zhao, Choi, He, Lu, Suh, Ramamurty, Kawasaki, Langdon and Jang33–Reference Ma, Feng, Debela, Peng and Zhang35 were used to probe the creep response of these alloys, and the focus was placed on deriving the values of the stress exponent, n, and activation volume, V*, from which creep mechanisms may be inferred. The calculated n and V* values are compiled in Table I. In general, the values of n deduced from uniaxial stress-relaxation tests and spherical nanoindentation tests (either the convertedReference Lee, Seok, Zhao, Choi, He, Lu, Suh, Ramamurty, Kawasaki, Langdon and Jang33 or nonconvertedReference Ma, Peng, Wen and Zhang34 to uniaxial creep strain) are in a reasonable range common to crystalline metalsReference Lee, Seok, Zhao, Choi, He, Lu, Suh, Ramamurty, Kawasaki, Langdon and Jang33,Reference Dieter and Bacon39 whereas those from Berkovich nanoindentation tests are one or two orders of magnitude higher than those from the former tests.Reference Zhang, Yu, Cheng, Zhang, Diao, Shi, Chen, Chen, Feng, Bai, Jing, Ma, Liaw, Li and Liu31,Reference Lee, Seok, Zhao, Choi, He, Lu, Suh, Ramamurty, Kawasaki, Langdon and Jang33–Reference Ma, Feng, Debela, Peng and Zhang35 Even for the same CoCrFeNiCu film, n was calculated to be of 2.5–10 from spherical nanoindentationReference Lee, Seok, Zhao, Choi, He, Lu, Suh, Ramamurty, Kawasaki, Langdon and Jang33 but 28.57 from Berkovich nanoindentation.Reference Ma, Peng, Wen and Zhang34
The high-cycle fatigue properties of the as-cast and cold-rolled Al0.5CoCrCuFeNi HEAs were investigated at a load ratio of R = 0.1.Reference Hemphill, Yuan, Wang, Yeh, Tsai, Chuang and Liaw20,Reference Tang, Yuan, Tsai, Yeh, Lundin and Liaw21 From the recorded S–N curves, it read that this alloy possesses a fatigue strength (in the stress range, Δσ) of 540–946 MPa and a fatigue ratio of 0.402–0.704.Reference Hemphill, Yuan, Wang, Yeh, Tsai, Chuang and Liaw20,Reference Tang, Yuan, Tsai, Yeh, Lundin and Liaw21 These values make the fatigue resistance of the Al0.5CoCrCuFeNi HEA favorably compare with or even outperform those of many conventional alloys, such as 4340 steel, 1015 steel, Al 6061, etc.Reference Hemphill, Yuan, Wang, Yeh, Tsai, Chuang and Liaw20,Reference Tang, Yuan, Tsai, Yeh, Lundin and Liaw21 The fatigue-crack-growth behavior of the AlCrFeNi2Cu,Reference Seifi, Li, Yong, Liaw and Lewandowski36 Al0.2CrFeNiTi0.2,Reference Seifi, Li, Yong, Liaw and Lewandowski36 and CrMnFeCoNi HEAsReference Thurston, Gludovatz, Hohenwarter, Laplanche, George and Ritchie37 has been studied at different load ratios and temperatures. A reduction in temperature can result in an enhanced fatigue-crack-growth resistance in the CrMnFeCoNi HEAs. Specifically, reducing the temperature from 293 to 198 K leads to a slight increase in the Paris slope from 3.5 to 4.5, and the threshold fatigue stress-intensity-factor range, ΔK th, from 4.8 to 6.3 MPa m1/2.Reference Thurston, Gludovatz, Hohenwarter, Laplanche, George and Ritchie37 Increasing the fatigue load ratio, on the other hand, can cause an increase in the Paris slope but reduction in ΔK th.Reference Seifi, Li, Yong, Liaw and Lewandowski36 In comparison to many conventional alloys (see Table III), both the Mn-containing and Al-containing HEAs manifest favorable fatigue-crack-growth resistance.
Ultra-high fracture-toughness values are reported for a ternary CoCrNi MEA and a quinary CoCrFeMnNi HEA at RT, with K JIc values of 217 and 208 MPa m1/2, respectively.Reference Gludovatz, Hohenwarter, Catoor, Chang, George and Ritchie13,Reference Gludovatz, Hohenwarter, Thurston, Bei, Wu, George and Ritchie59 Reducing the temperature to 77 K can further enhance the toughness by ∼25% for both alloys, which is affirmed to be associated with a dimpled fracture through microvoid nucleation and coalescence.Reference Gludovatz, Hohenwarter, Catoor, Chang, George and Ritchie13,Reference Gludovatz, Hohenwarter, Thurston, Bei, Wu, George and Ritchie59 The HEAs with a mixed fcc and bcc structure have a fracture toughness of 25–45 MPa m1/2, exhibiting a fracture morphology of brittle features in the bcc area and isolated ductile islands in the fcc area.Reference Seifi, Li, Yong, Liaw and Lewandowski36,Reference Zhang, Han, Meng, Su and Li66 The CoCrFeMnNi HEA is fractured with ductile dimples nucleated at the oxides upon uniaxial-tension tests at RT, and apparent necking is noticed for the samples tested at 77 K.Reference Gludovatz, Hohenwarter, Catoor, Chang, George and Ritchie13,Reference Zaddach, Scattergood and Koch67,Reference Gali and George68 Tension fracture in HEAs with a mixed fcc and bcc phase initiates at the interface between the two phases, and/or the precipitates at the grain boundaries.Reference Joseph, Stanford, Hodgson and Fabijanic79–Reference Tang, Senkov, Parish, Zhang, Zhang, Santodonato, Wang, Zhao, Yang and Liaw81 HEAs with a bcc phase are compression-fractured by quasi-cleavage,Reference Senkov, Wilks, Scott and Miracle24,Reference Fujieda, Shiratori, Kuwabara, Kato, Yamanaka, Koizumi and Chiba85 or intergranular fracture.Reference He, Wang, Cheng, Wang, Li, Dang, Wang and Liu84,Reference Fujieda, Shiratori, Kuwabara, Kato, Yamanaka, Koizumi and Chiba85 Brittle features are also observed in the recrystallized Al0.1CoCrFeNi and Al0.3CoCrFeNi HEAs after impact tests. On the other hand, only dimples are observed in the as-cast CoCrFeNi and Al0.1CoCrFeNi specimens.Reference Xia, Gao and Zhang86,Reference Li and Zhang87 No fracture or visible cracking appears in the as-cast AlCrCuFeNi2 HEA upon dynamic tests at strain rates of 955–2531 s−1.Reference Ma, Jiao, Qiao, Yang, Zhang and Wang89 At higher strain rates of 3044 and 3182 s−1, fracture in the AlCrCuFeNi2 HEA is a characteristic of the quasi-cleavage fracture via torn ridges as well as dimple-like regions.Reference Ma, Jiao, Qiao, Yang, Zhang and Wang89
VI. FUTURE DIRECTIONS
Despite that a rough picture about the advantages and disadvantages of HEAs in structural applications can be imagined from these dedicated investigations on their creep, fatigue, and fracture behaviors, many key questions remain unanswered. Here, we list a few important topics for future efforts.
(1) Consistent creep characterizations. A number of inconsistencies exist in the current characterizations of creep in HEAs. First, the stress exponent, n, calculated for HEAs from the Berkovich nanoindentation creep tests tends to be much larger than that from the uniaxial stress relaxation and spherical nanoindentation creep tests. Even for the same alloy, the Berkovich nanoindentation gave 3–11 times larger n values than the spherical nanoindentation.Reference Ma, Peng, Wen and Zhang34,Reference Ma, Feng, Debela, Peng and Zhang35 The extremely large n values and some trends observed in the Berkovich nanoindentation creep tests essentially cannot be explained by the classical creep theory in conventional crystalline metals. Second, in many cases of both spherical and Berkovich nanoindentation tests, the creep data on which linear fits were performed to obtain the value of n is, in fact, deviated from linearity to a large degree.Reference Zhang, Yu, Cheng, Zhang, Diao, Shi, Chen, Chen, Feng, Bai, Jing, Ma, Liaw, Li and Liu31,Reference Ma, Peng, Wen and Zhang34,Reference Ma, Feng, Debela, Peng and Zhang35 The underlying cause and its impact on the reliability of the derived creep indices are unclear. Third, when using nanoindentation tests to deduce the value of n and other creep indices, some authorsReference Lee, Seok, Zhao, Choi, He, Lu, Suh, Ramamurty, Kawasaki, Langdon and Jang33 chose to convert the indentation creep strain to equivalent uniaxial one while others did not.Reference Zhang, Yu, Cheng, Zhang, Diao, Shi, Chen, Chen, Feng, Bai, Jing, Ma, Liaw, Li and Liu31,Reference Ma, Peng, Wen and Zhang34,Reference Ma, Feng, Debela, Peng and Zhang35,Reference Chen, Li, Xie, Brechtl, Chen, Li, Zhao, Yang, Qiao, Dahmen and Liaw101 Lastly, the equations used for deriving the activation volume, V*, are slightly different from work to work (e.g., uniaxial stress relaxationReference Cao, Shang, Zhao, Cheng, Wang and Wang29 versus spherical nanoindentationReference Lee, Seok, Zhao, Choi, He, Lu, Suh, Ramamurty, Kawasaki, Langdon and Jang33). All these inconsistencies need to be looked into and satisfactorily addressed in the future research to preserve the credibility and value of the published creep data.
(2) Physically sound creep mechanisms. In the previous work, the creep mechanisms in HEAs were inferred from comparing the calculated values of the stress exponent, n, and activation volume, V*, with those in the classical creep theory of conventional crystalline metals. It is worth noting that HEAs are different from conventional metals by incorporating much more elemental species into a single lattice. Complex microstructures (e.g., distorted lattices and sluggish diffusion) may impose important impacts on diffusion and dislocation glide in HEAs, making them fundamentally different from conventional alloys. Therefore, it is still unknown if it is appropriate to use the classical creep theory of conventional metals to interpret creep mechanisms in HEAs. In the future research, advanced microscopic techniques (e.g., in situ TEM) may be used to complement routine creep tests for constructing a rational creep-mechanism map for HEAs.
(3) Fatigue behavior of more HEAs in an extended range of temperatures. The present studies of the fatigue behavior of HEAs are very limited and mostly at RT. The information from these studies is far from enough to draw any solid conclusion in their merits and shortcomings in potential structural applications. Extensive characterizations of fatigue resistance in more HEA systems are greatly in need. Furthermore, as many HEAs particularly those known as refractory HEAs have great potentials for high-temperature applications, such as in gas-turbine engines, investigations of the thermal-fatigue behaviors of these alloys should be considered in the future research.
(4) Extensive characterizations of the fracture toughness of HEAs. From the existing work, some compelling fracture characteristics have been spotted in HEAs. For instance, it is found that the presence of Mn-rich oxides can degrade the toughness of Mn-containing HEAs, and many compositions [e.g., CoCrFeNi, AlxCoCrFeNi (x = 0.1–0.3), and Fe50Mn30Co10Cr10] show comparable or even better strength-ductility properties than the CoCrFeMnNi alloy at RT and cryogenic temperatures. However, the underlying physics of the already observed phenomena and many more unknowns remain mysterious in HEAs. Characterizing the fracture toughness and associated fracture characteristics of more HEA systems, therefore, is in an urgent need to gain a well-informed fracture-mechanics perspective of this special class of materials. In particular, the fracture toughness of the HEA systems with bcc and/or hcp single phases (e.g., the refractory HEAs) is barely examined.Reference Li, Liaw and Gao102 Measuring the fracture toughness of HEAs at elevated temperatures is imperative in the consideration of their potential high-temperature applications.
ACKNOWLEDGMENTS
We are grateful for the support of the National Science Foundation (DMR-1611180) and the Department of Energy (DOE) Office of Fossil Energy, NETL (DE-FE0008855, DE-FE-0024054, and DE-FE-0011194), with Dr. G. Shiflet, Dr. D. Farkas, Dr. V. Cedro, Dr. R. Dunt, Dr. S. Markovich, and Dr. J. Mullen as program managers. P.K.L. very much appreciates the support from the U.S. Army Office Project (W911NF-13-1-0438) with the program managers, Dr. M.P. Bakas, Dr. S.N. Mathaudhu, and Dr. D.M. Stepp.