“It is a real war which confronts us all—a war that must be successfully fought if life and property are to be secure in our country.”
—Attorney General Homer Cummings, September 1933“What'd you get, black boy,
When they knocked you down in the
gutter,
And they kicked your teeth out,
And they broke your skull with clubs
And they bashed your stomach in?
What'd you get when the police shot
you in the back,
And they chained you to the beds
While they wiped the blood off?
What'd you get when you cried out to
the Top Man?
When you called on the man next to
God, so you thought,
And asked him to speak out to save
you?
What'd the Top Man say, black boy?
‘Mr. Roosevelt regrets. … …’”
—Pauli Murray, “Mr. Roosevelt Regrets (Detroit Riot, 1943)”1. INTRODUCTION
On an overcast day in March 1933, Franklin Delano Roosevelt stood before a crowd of 150,000 people who sprawled in front of the Capitol to view his inauguration, in a scene Frances Perkins likened to a “revival meeting.”Footnote 1 The new president's speech included the now-famous words: “we have nothing to fear but fear itself.” As the speech reached a crescendo, FDR gave an urgent call to the nation: “I shall ask the Congress for the one remaining instrument to meet the crisis—broad executive power to wage a war against the emergency as great as the power that would be given to me if we were in fact invaded by a foreign foe.”Footnote 2 These pressing words foreshadowed a key feature of FDR's presidency and the New Deal years: the power of crisis, especially war, to facilitate state making. For all his activity on economic relief and social provision, FDR fought two wars that involved weapons, a professional armed force, and public enemies. One was World War II. The other was a “war on crime” starting in 1933, led and organized by Attorney General Homer Cummings and Federal Bureau of Investigation (FBI) Director J. Edgar Hoover. These figures mobilized the country against a series of high-profile criminals, leveraging these events to expand jurisdiction, build new institutions, and induce an issue realignment around crime policy. Their greatest asset was a twist on Charles Tilly's famous dictum: “wars make states.”Footnote 3
By building a state by means of the war on crime, these leaders constructed a criminal justice system built to make war: to villainize criminals as public enemies, to mobilize public opinion, to nationalize crime enforcement, to respond with more guns, scientific advancement, and professionalism. By the time larger discussions of crime and policing arrived, modern law enforcement had already locked in a set of institutional tools forged in the furnace of the war on crime.Footnote 4
Civil rights leaders advocated for a different approach. They promoted policies that addressed the legacies of slavery, held local police accountable for racial violence and discrimination, stopped lynchings, and gave more democratic participation to those facing the most significant threats of violence. But FDR, Cummings, and Hoover actively avoided heeding the pleas of Black leaders.Footnote 5 Instead, they viewed them as a threat to the administration's tenuous coalition, “the incompatibility of forces” made up of Northern liberals and Southern conservatives.Footnote 6 Instead of extending protection to Black Americans, the FBI increased surveillance of Black leaders and conflated civil rights with “subversive activity.” This fomented the alienation of the Black community from law enforcement, further silencing their voice in the design of modern policing in the United States.
In this article, I will argue that social liberals like Homer Cummings and hardline conservatives like J. Edgar Hoover formed a coalition according to their overlapping belief in an activist government to bring about law and order. These coalition partners agreed on the state-making power of a war on crime, and this coalition required a de-emphasis of the social causes of crime and a retreat from civil rights. Their campaign against crime resulted in unprecedented state building in the realm of law enforcement, and this selective success reinforced a neglect of racial justice and an entrenched view of Black criminality. This paved the way for future wars on crime to be applied more widely to the Black community.
A bellicist theory of criminal justice explains these patterns. In particular, the war on crime in the 1930s created a ratchet effect, whereby crises created expanded institutions that did not return to previous levels. The expanding law enforcement apparatus developed institutional logics that control how policing functions to this day, including a set of racial logics that excluded Black people as worthy of protection and cast them instead as suspicious. These events also induced an issue realignment whereby the odd coalition of social liberals and conservatives shaped crime into a policy domain characterized by a politics of consensus. The resulting institution became the system of modern law enforcement, composed of a set of methods designed for gangsters like John Dillinger—with a method of villainizing particular people and expanding capacity in a law-and-order campaign.Footnote 7 These institutions would be employed and expanded later in even greater degrees. Most notably, the war on crime in the 1960s would fuse a criminalization of civil rights with the same law enforcement script developed in the 1930s by the same coalition, effectively applying the same methods devised in the 1930s for bank robbers on Black communities.Footnote 8 This article identifies a series of events that occurred at a critical juncture and shaped criminal justice, but it also describes a pattern that has recurred consistently since the New Deal era, continuing today.Footnote 9
This article builds on the existing scholarship on race and criminal justice in the twentieth century. Marie Gottschalk and William Stuntz both briefly describe the significance of the 1930s in their magisterial works on the history of criminal justice, and they situate this time period in a larger metanarrative about policing and incarceration.Footnote 10 Kathleen Frydl has developed similar arguments with respect to one particular dimension discussed in this article: the threat of kidnapping and its power to promote state development.Footnote 11 Daniel Richman and Sarah Seo have also highlighted the significance of the FBI and its influence on local police from 1908 to 1960.Footnote 12 Beginning where this article ends, Naomi Murakawa has offered an excellent history of how liberals in the decades to follow helped build the carceral state. Elizabeth Hinton describes with incredible detail the shift toward a racialized war on crime in the 1960s on the heels of the War on Poverty.Footnote 13 Vesla Weaver powerfully demonstrates how the war on crime in the 1960s served as a reaction—a “frontlash”—against the civil rights movement.Footnote 14 In addition, I build on the work of scholars of racial activism and social movements, law enforcement historians, and other American political development scholars.Footnote 15 This article goes into further detail about the 1930s, expanding our knowledge of the era and offering theoretical insights that help explain later wars on crime. Moreover, it suggests how some of the institutions, logics, and coalitions displayed in the 1960s were facilitated by these earlier developments. I do not suggest that the movements of the 1960s happened in the 1930s. Rather, I argue that necessary but insufficient infrastructure, logics, and coalitions were built in this earlier era. Thus, I hope to identify subtle yet deeply important developments, while doing justice to the significance of the events described by scholars of later eras. This era—and the broader theory I provide on wars on crime—is necessary for fully understanding the development of race and criminal justice in the United States. This article contributes to the conversation by integrating a theoretical lens for understanding wars on crime, new historical data on the 1930s, and an exposition of the political realignment around crime policy during the FDR administration.
Relying on FBI archives, Justice Department memos, files from the archives of Homer Cummings and FDR, contemporaneous newspaper articles, and a range of quantitative data, this article articulates important political developments during this era, and it identifies a bellicist theory of criminal justice. Section 2 describes the failures of the system going into the FDR administration, defining three sets of problems: Prohibition, racialized violence, and technological/legal archaism. Section 3 offers a description of this theory by describing how wars—including those on crime—can produce a ratchet effect, build institutional logics, and create a nationalized politics of consensus. Section 4 elucidates how the war on crime in the 1930s created a ratchet effect for an expanded law enforcement system, durably modified institutional logics, and impelled an issue realignment that cast crime as a topic of consensus governing. Section 5 explains the enduring legacy of this era through application of methods to problems that extended far beyond their original purpose. This legacy was cemented through the diffusion of methods to the states and redeployment of the same script in future wars on crime.
2. BACKGROUND
2.1. History
Two related features characterized the development of American law enforcement: It was often used as a tool of social control to protect the privileged and police the vulnerable, and it was highly localized.Footnote 16 As Sally Hadden describes, in the antebellum South, slave patrols operated to surveil Black people and violently punish violators of slave codes.Footnote 17 Often brandishing whips and guns, slave patrols used surveillance and coercion to enforce slavery and violently punish those who would resist. Because of slavery and forced labor, there was little need for prisons and jails. When used, they operated in service of slaveholders.Footnote 18 When slavery ended, the criminal justice system adapted to a new form of control. Law enforcement in the South became enforcers of local Blacks Codes that served to keep Black communities in subservience.Footnote 19 Many Black people were forced to sign work contracts that afforded no social or economic mobility. Those who refused to abide by the Black Codes were often subject to arrest for vagrancy or other conjured offenses. The 13th Amendment qualified that slavery and forced labor would be prohibited “except as punishment for a crime.”Footnote 20 The Black Codes allowed for states to criminalize Black people and imprison them or force them into labor under systems of convict leasing.Footnote 21 In Baltimore, the police protected White capital after emancipation by increasing the intensity of their policing of Black communities.Footnote 22 In the era of Jim Crow, the police enforced segregation, and they often were complicit in lynchings. By enabling or perpetuating racial violence, they enforced racial inequality and oppression.Footnote 23 Lynchings and racial violence also extended to other groups As Monica Muñoz Martinez describes, Mexicans in Texas faced widespread violence and lynchings, and this violence “had a state-building function,” as it “both directed the public to act with force to sustain hierarchies of race and class and complemented the brutal methods of law enforcement in this period.”Footnote 24
But the police power to maintain social control was not unique to the South. Police forces in the North adopted subtler forms of social control that also served the most powerful and reflected the racial and class hierarchies of the cities themselves.Footnote 25 As Robert Fogelson says, the police have always “decided, or at least helped to decide, which laws to enforce, whose peace to keep, and which public to serve.”Footnote 26 This took new shape in the early twentieth century as large numbers of Black people moved to urban centers in the North and West. Fleeing the racial violence and systematic oppression of the South, Black refugees endured pilgrimages to seek new opportunities. But they found racism in their new homes, and the police often allowed or enforced the racism. Police enabled violence by failing to protect Black people from White attackers, and in some cases, police funneled vice and crime into Black neighborhoods and refused to provide any sort of meaningful protection.Footnote 27
In an early example, the Chicago police violently participated in the 1919 riot, and the images of police violence were seared into the collective memory of Chicago's Black community, as they saw “a police force unresponsive to black needs and often explicitly hostile to black people.”Footnote 28 The Chicago Police Department would only grow in strength and only increase its hostility toward Black communities. Other cities followed similar paths with their own local intricacies and timelines. In Los Angeles, the first wave of mass incarceration focused on poor white men, itinerant laborers coming to the city for work. Without other effective social controls, LA officials constructed prisons and incarcerated these laborers, and they employed them in chain gangs to "pave the streets of the city.”Footnote 29 But as concerns over poor Whites waned, Mexican immigration increased, and the composition of prisons and jails shifted after 1910 to include more of this new wave of immigrants.Footnote 30 With industrialization and World War I, policing adapted the role of social control to the changing demographics and evolving urban life.Footnote 31
Policing has not solely been a form of social control. Police have also served important roles in protecting vulnerable people at times. The history of policing is mixed, complex, and varies across localities. But Black Americans have often failed to receive the kind of police service afforded to White Americans, and they have instead been subjected to punishment and police violence at higher rates. The persistent abuse of local police has prompted demands for police accountability. Historically, Black Americans imagined an important role for the federal government: to stop the racial violence perpetrated and enabled by local police. The adoption of the 14th Amendment seemed to promise such a role, guaranteeing “equal protection of the laws.”Footnote 32 During the brief period of Reconstruction, there were glimmers of hope. Indeed, during 1871 and 1872, the federal government won 600 convictions of Klan members under the 14th Amendment and the Enforcement Act of 1870.Footnote 33 After the Colfax Massacre—during which at least sixty-two Black people were slaughtered by a White militia—the federal government prosecuted some of the perpetrators.Footnote 34 Yet, after ninety-eight indictments and only nine arrests, federal prosecutors eventually won just three convictions. These convictions, too, were overturned by the Supreme Court in U.S. v. Cruikshank, with the majority opinion declaring the duty of enforcing equal protection “was originally assumed by the states; and it still remains there.”Footnote 35 The Supreme Court and other forces undercut federal responses to racial violence. In the decades that followed, state and local governments aided and abetted thousands of lynchings of Black Americans, but the federal government consistently refused to intervene.
Federal law enforcement did take up other major roles. The government established immigration enforcement agencies, including the U.S. Border Patrol.Footnote 36 The federal government needed policing powers to stop smuggling and enforce tariffs.Footnote 37 The Secret Service was formed to stop counterfeiting.Footnote 38 The Bureau of Investigation (later called the FBI) was formed in 1908, and its early work focused largely on corruption in corporations and government.Footnote 39 It would soon enforce the White Slave Traffic Act (also known as the Mann Act) and later took charge of extraditions.Footnote 40 Prohibition was enacted in 1919, and this required new levels of federal law enforcement.Footnote 41 With each of these institutional expansions, federal policing adopted new forms of power and control. In some cases, federal policing powers seemed relatively niche, like counterfeit bills and extradition. These developments underlined the double-standard of refusing to protect Black Americans while opting to exercise other forms of federal police powers. At other times, as in the case of the Border Patrol or the White Slave Traffic Act, federal police were deployed with explicitly racial missions. In almost all federal expansions of policing authority, powers were constrained to particular cases (e.g., counterfeiting) or places (the Southern border). In the case of Prohibition, federal law enforcement extended itself in ways previously unseen; alcohol enforcement touched more people and places than any previous area of federal policing. This extension, however, proved ineffective, and it failed to garner legitimacy. In this way, federal policing moved into the 1930s in a tenuous and fragile state.
2.2. Setting
Like much of the political system entering the FDR administration, American law enforcement was seen as something in disrepair. Prohibition had failed, and the Wickersham Commission published reports in the early 1930s outlining systemic failures in law enforcement. Policing was replete with abuse and corruption. FDR prepared to take office with a law enforcement system ripe for reimagination. Prohibition lacked public support and failed miserably; poorly designed laws undermined trust in the law; police abuse and corruption undercut the fair implementation of policies; institutions buckled under the weight of new challenges posed by burgeoning technologies; racial violence continued without meaningful accountability or deterrence.Footnote 42 As Stephen Skowronek demonstrates in the context of presidential administrations, major spurts of policy changes occur when existing regimes “become vulnerable to direct repudiation as failed or irrelevant responses to the problems of the day.”Footnote 43 In 1933, it was a reconstructive moment in the political time of policing in America. Local and federal law enforcement shared a key feature: They both lacked trust and public support. An effort to reconstruct federal law enforcement would need to innovate with new approaches and secure legitimacy in the process.
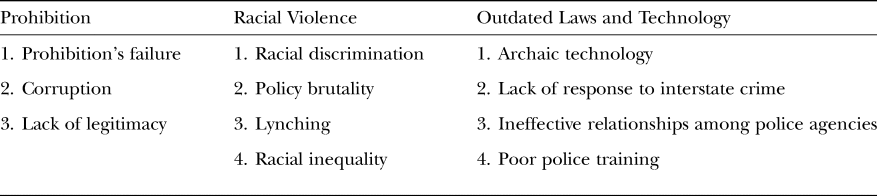
The problems with policing can be divided into three categories: Prohibition (and the broader labels of corruption and illegitimacy), racial violence and discrimination, and archaic laws and technology (Table 1).
Policing Issue Categories in the Age of FDR

At the turn of the 1930s, Prohibition lacked public support, and it had exacerbated deeper problems with law enforcement. It failed to realize its stated goal of eliminating drinking. Enforcement neglected to touch the wealthy, but “directed state policing powers almost exclusively toward a crackdown on the alcohol-laced leisure world of the poor and marginal supplies.”Footnote 44 Many politicians believed that the law undermined police legitimacy. In 1931, the federal government released a series of reports authored by the Wickersham Commission, a committee organized to provide a thorough investigation of the state of criminal justice in the United States. The commission concluded that Prohibition was a “serious impairment of the legal order to have a national law upon the books … which public opinion in many important centers will not enforce.”Footnote 45 The committee feared that the ban on alcohol bred widespread disrespect for the law. Prohibition also fostered corruption. It created financial incentives for organized crime to smuggle liquor and for police to cash in on the enterprise.Footnote 46 Illegal markets and corruption spread as “vice entrepreneurs” capitalized on the ineffective law, even as the law itself proved unenforceable.Footnote 47 This included state officials beckoned by the allure of corruption: “Corruption's stain touched politicians at all levels, from United States senators down to judges, justices of the peace, and the policemen on the beat.”Footnote 48 Prohibition exacerbated corruption within law enforcement, and it also undermined public trust and inhibited the police from securing legitimacy.
The second set of problems went even deeper: discrimination, systemic police brutality, and racial violence.Footnote 49 The police system manifested systemic discrimination and racial disparities. As historian Khalil Muhammad argues, these racially discriminatory practices were built on progressive notions of Black criminality, developed by the era's premier scientists and social scientists: “The Progressive era was indeed the founding moment for the emergence of an enduring statistical discourse of black dysfunctionality rather than the 1960s, as is commonly believed.”Footnote 50 He argues that the “hidden cost to black residents was not simply victimization by bad guys, but also brutality by bad police officers and the loss of faith in American society by the young and old, who saw the police as a representation of the government's malign neglect of black people in general.”Footnote 51 This reflects the reality of Black communities that W. E. B. Du Bois observed in 1932: “Nothing in the world is easier in the United States than to accuse a black man of crime.”Footnote 52
Police departments systematically tolerated brutality and violent coercion. This fell disproportionately on Black people, although it was not limited to them. The Wickersham Commission unleashed a scathing report titled Lawlessness in Law Enforcement, condemning the widespread nature of police abuse. The report detailed how police departments deployed the “third degree”—the “inflicting of pain, physical or mental, to extract confessions or statements.”Footnote 53 They described this practice in lucid detail: San Francisco officers mercilessly beating suspects in patrol wagons, Cleveland detectives stripping a suspect and lifting him from the floor by his genitals to induce a confession, Detroit police moving suspects from station to station to avoid being found by legal counsel. The chief of police in Buffalo declared: “If I have to violate the Constitution or my oath of office, I'll violate the Constitution.”Footnote 54 In a study of police abuse in this era, Marilynn Johnson notes that the commission failed to mention the “racial disparity in third-degree cases.”Footnote 55 Some Black leaders commended the exposing of police brutality contained in the report, but protested the persistent lack of attention to state-sanctioned violence against Black people.Footnote 56
Moreover, widespread lynchings continued into the 1930s, and the federal government had still failed to act. From 1880 to 1940, White Southern mobs killed more than 3,200 Black people.Footnote 57 These lynchings involved an interconnected web of actors and spectators who interpreted, distributed, and reified the meaning behind the actions.Footnote 58 They essentially communicated that no amount of violence or destruction done to Black bodies would be stopped. Lynching played a central role in maintaining racial domination. Often times, police either ignored or participated in the lynching process; Black Americans lacked political or legal recourse. In 1931, a news article in the New York Times pointed out that “the Negro's political impotence was pointed to as a factor in the indifference of officers toward the prosecution of mobs.”Footnote 59 But Black communities fought relentlessly against the system. As Megan Francis describes, the National Association for the Advancement of Colored People (NAACP) launched a vast, multipronged movement in the first half of the twentieth century against lynching.Footnote 60 FDR would have to navigate this movement amid a political landscape that ostensibly required Southern support for legislative success.Footnote 61
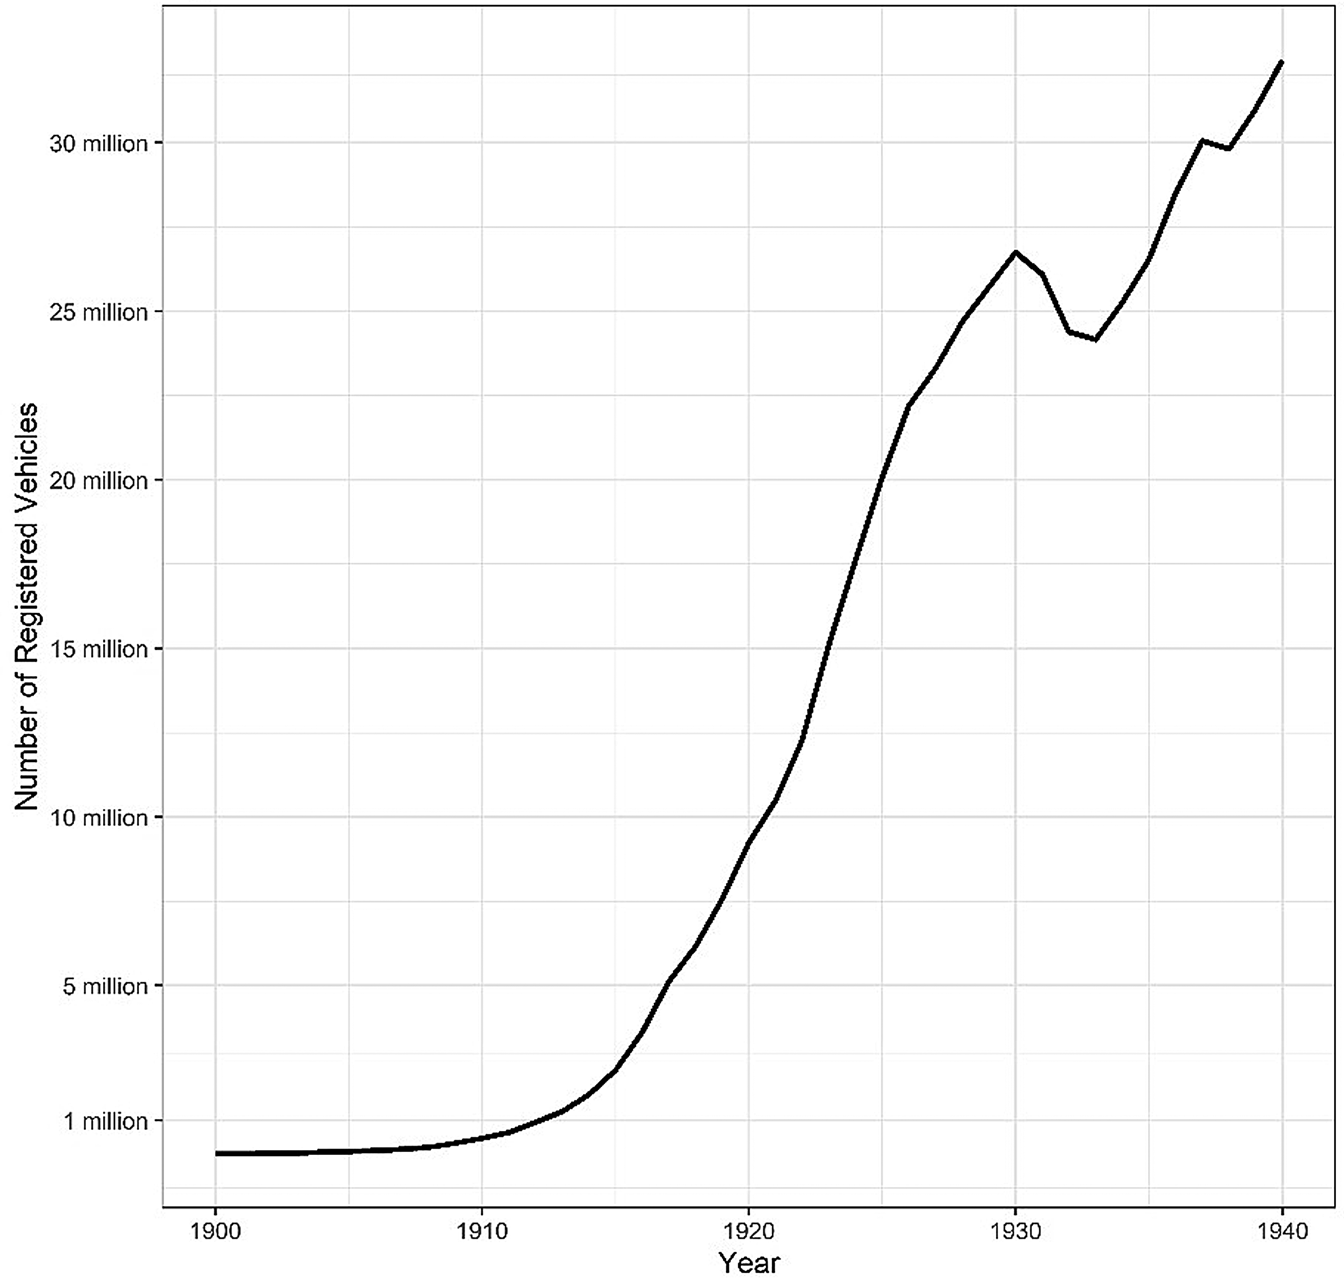
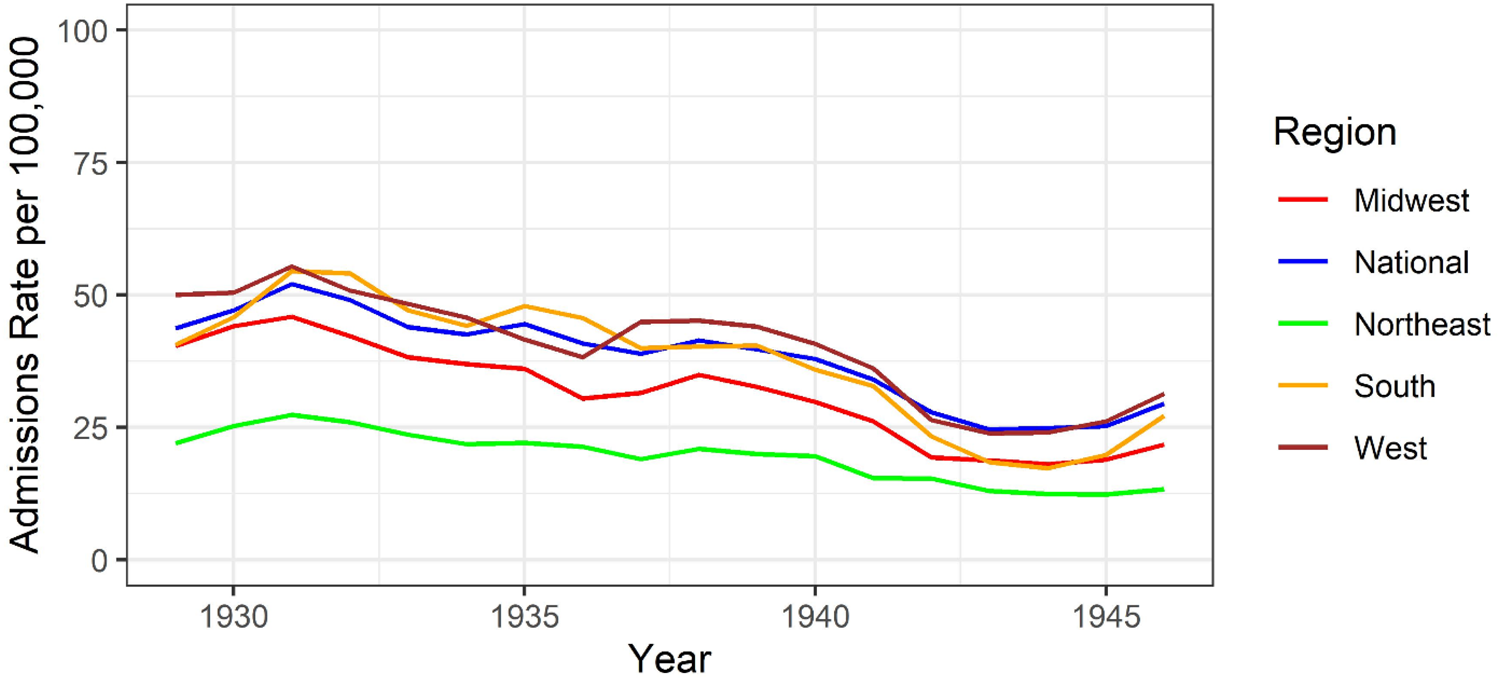
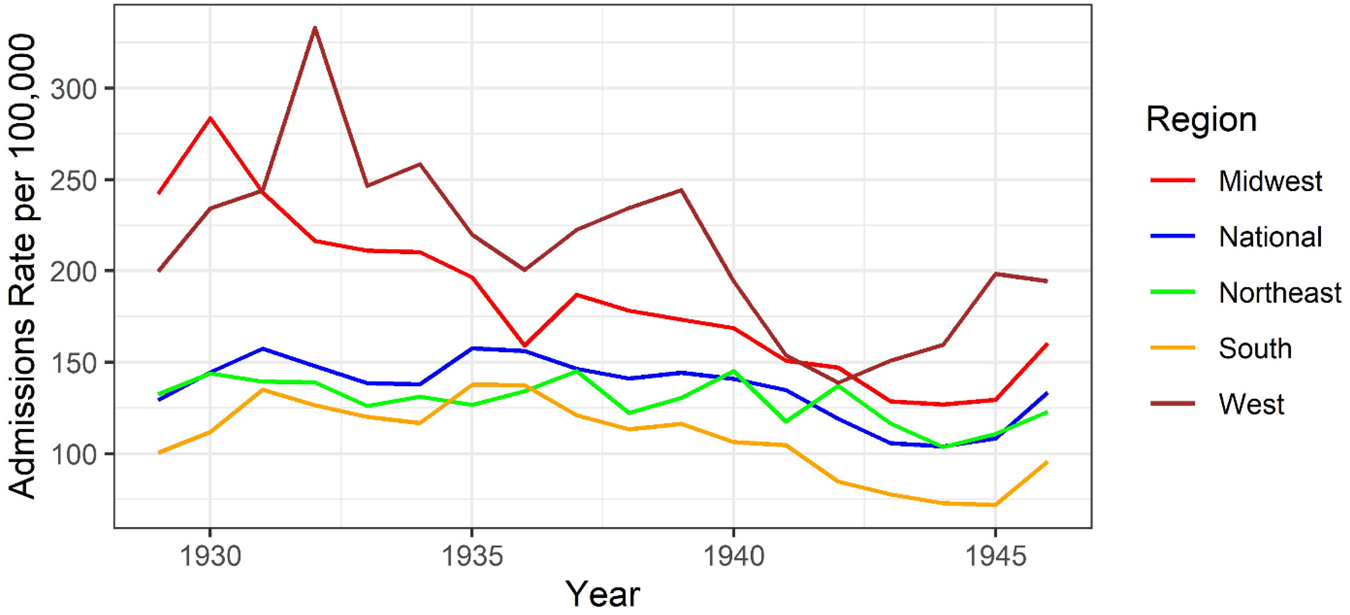
The final set of problems stemmed from outdated laws, methods, and technologies. The growth of cities and technology demanded training and equipment that police had yet to receive.Footnote 62 In particular, the number of automobiles in the United States nearly tripled in the 1920s, and police departments could not keep up with the crime associated with this change (Figure 1).Footnote 63 The spatial dimension of crime had transformed, and law enforcement had yet to fully adapt to this transformation.Footnote 64 This set the stage for a radical sprawling of American life. People would no longer be confined to living, working, worshipping, shopping, and interacting with the police in such confined physical areas. Cars facilitated the execution of crimes that crossed state borders. Federal law made no provision for a mass problem of this kind. States could not pursue criminals across state borders, and the federal government did not have jurisdiction to intervene. This opened up space for a cadre of high-profile criminals to carry out bank robberies and kidnapping with impunity along state borders.Footnote 65 This problem formed the pretext for the war on crime in the 1930s.Footnote 66
Number of Automobiles in the United States. Source: U.S. Department of Transportation, State Motor Vehicle Registrations, by Years, 1900–1995, https://www.fhwa.dot.gov/ohim/summary95/mv200.pdf. Accessed February 2020.

In the end, the situation in 1933 presented FDR, Homer Cummings, and J. Edgar Hoover with three sets of problems: the failure of Prohibition, racial violence, and outdated technology and laws. Among these, the second set of issues reached the deepest, but it was met with the least action. Law enforcement leaders would utilize the space opened up by Prohibition's demise to rebuild and reimagine the carceral state, and they would design a system of law enforcement in direct—and almost exclusive—response to bank robbers and kidnappers exploiting technological advancements and legal loopholes.Footnote 67 Law enforcement expanded jurisdiction, professionalized training, and instilled a military-like ethos into law enforcement.Footnote 68 The federal government ignored calls to address racial violence and hold local police in check, and they instead built up and legitimized their professional model of policing through the war on crime. This process reified racial logics and set the stage for future wars on crime against Black people. The following section articulates the theory behind how the war on crime in the 1930s would create these transformations.
3. THEORY
This article offers a bellicist theory of criminal justice to explain how wars on crime create law enforcement systems. Franklin Roosevelt, Lyndon Johnson, Richard Nixon, and Ronald Reagan stand together in their involvement in major wars on crime.Footnote 69 I argue that examining a war on crime like a literal war generates insights into how it creates policies, shifts political coalitions, and builds the state in ways that constrain and direct how it functions in future periods. Political scientists have long elucidated the power of wars to make states. In the most classic account, Charles Tilly argues that in the history of Western Europe, “wars made states and vice versa.”Footnote 70 War was catapulted to a central place in state formation by “the continuous, aggressive competition for trade and territory among changing states of unequal size.” Further, wars created contexts for states to “acquire and allocate the means of carrying on their major activities.”Footnote 71 Wars require extensive funding and coercive power, and they compel states to centralize authority, extend their bureaucratic reach, increase tax revenue, and otherwise build their state capacity. Lacking the jolting effect of war, some polities lack the compelling forces needed to build up a strong state.Footnote 72
This bellicist logic has been transported to numerous contexts outside of Tilly's original analysis.Footnote 73 In recent years, scholars have noted how wars have built the American state and reshaped politics.Footnote 74 David Mayhew argues,
Wars seem to be capable of generating whole new political universes. They can generate new problems and open up policy windows, thus often fostering new policies, but they can also generate new ideas, issues, programs, preferences, and ideologies and refashion old electoral coalitions—thus permanently altering the demand side of politics.Footnote 75
Marc Allen Eisner argues that World War I completely refashioned the American state, paving the way for the New Deal.Footnote 76 Robert Saldin argues that major wars in the United States “provide an explanatory framework that ties together American state building, democratic rights policy making, and the political party system.”Footnote 77 James Sparrow argues that World War II facilitated levels of state power the country had never before embraced.Footnote 78 Ranging from the Spanish-American War to World War II, these works variously demonstrate how wars have made the American state.Footnote 79
Building on the work of crime scholars who have examined wars on crime and their state-building capacity, I examine several dimensions of the bellicist logic with a more direct connection to work on state formation. There are two reasons why the metaphorical nature of wars on crime should not dissuade us from transporting theoretical frames derived from actual wars. First, the separation between the military and the police is a largely modern invention.Footnote 80 Max Weber referred to the monopoly on the use of force as the central feature of the state, and this requires a mixture of outside protection through a military and the internal force of the police.Footnote 81 Though the distinction between military and police has been in place since at least the nineteenth century, the similarities make military war a particularly powerful metaphor for the police. In Cohen's formulation, wars involve publicly legitimized uses of deadly violence between polities.Footnote 82 This definition shows how several elements—the public legitimation, the organized offensive, the deadly violence—transport from the military to the police. Indeed, recent scholars have shown a reciprocal relationship between military force and domestic policing, as both reinforce the tactics and priorities expressed within the other.Footnote 83 Second, war is a mechanism for creating the conditions that make states, and other crises create the same conditions. Wars on crime approximate the crisis of war like few other policy agendas or political environments, and it can thus generate analogous political changes.Footnote 84 Therefore, it seems like a fruitful endeavor to develop a bellicist theory of policing. I argue that wars on crime build states in three important ways, as illustrated by the war on crime in the 1930s.
First, wars on crime centralize authority and generate influence in bursts of activity, creating a rachet effect, whereby funding and power increase during the wars but never go back to prewar levels. In the state formation literature, Tilly and others have noted how the intense state building required to wage war leads a state to accrue capacities that persist above previous levels. States must increase their tax revenue and bureaucratic capacity to wage war, and this growth remains after the war ends.Footnote 85 As Kiser and Linton suggest, “The ‘sediment’ left by wars that produced the ratchet effect was composed of fairly durable institutions staffed by actors with the power to protect and maintain their positions, even after the wars that created the need for them were over.”Footnote 86 Wars on crime exhibit the same quality. While public campaigns and major legislative pushes increase policing powers in short bursts, these changes do not return after the war campaign ceases. In fact, wars on crime tend to be more sticky than international wars, because domestic wars do not require external threats to justify such large expenditures and expansive powers. The threat of crime never leaves, so the need for criminal enforcement never fades. The ratchet effect yields a larger increase in the world of wars on crime.
Second, wars on crime create institutional logics by forging systems designed to make war, and these systems are applied to other areas. Tilly suggests that states were organized around their ability to make wars, such that wars “wove the European network of national states, and preparation for war created the internal structures of the states within it.”Footnote 87 This coalesces with the insights on the power of institutional logics. Alford and Friedland define logics as “a set of practices—behaviors, institutional forms, ideologies—that have a social function and are defended by politically organized interests.”Footnote 88 These logics come from what institutions are created, how they operate, and who governs them. In general, these tend to be deeply rooted and difficult to change, but wars can change norms and patterns more quickly than peace.
The war on crime in the 1930s instilled a set of logics by changing what tools were available, how they would be used, and who would deploy them. Wars on crime make a law enforcement state that is designed to make war against public enemies—and to protect a particular class of people. This system of policing is then applied to other questions of crime, protecting the privileged and transposing villainization to other groups. The war on crime in the 1930s classified gangsters and bank robbers as public enemies, and it oriented the expanding state apparatus around squelching these foes. Moreover, significant racial logics were built and reinforced in the nascent law enforcement system. Law enforcement determined that it would not protect Black people, no matter how egregious the violence against them or how clear the opportunity to intervene. The federal government also advanced notions of Black criminality by projecting suspicion on Black civil rights groups and developing new forms of statistical racism.
Third, wars on crime nationalize crime policy and create a politics of consensus that transcends partisan divisions, similar to the effects of interstate wars. In periods of intense intragroup conflict, interstate wars generate massive incentives to unite in order to defend against outside groups.Footnote 89 Particularly during times of intense polarization, wars possess a unifying power that give them a unique ability to transcend bitter divides and overcome gridlock.Footnote 90 William Howell, Saul Jackman, and Jon Rogowski argue that wartimes create a “nationalizing politics of threat,” allowing presidents to “enact domestic and foreign policy during war that would be unattainable during peace.”Footnote 91 They outline several features of the national priorities that arise during wartime: “congressional affirmations of national interests,” “congressional expressions of national unity,” “public displays of patriotism, public attentiveness to war,” and attending to the “imminent threat to national security.”Footnote 92 All of these apply to wars on crime. Wars on crime follow the analogy of war, partly because they seek broad-based consensus from across the political spectrum. The logic of wars on crime maps closely in this regard to the coalition-building process of international wars. Usually, there is robust debate over the merits of going to war, with a band of isolationist holdouts. However, a major event sends a shockwave through public opinion and induces the holdouts to cease their opposition, lest they be deemed antipatriotic.Footnote 93 In the same way, wars on crime usually begin with robust debate and different sides represented. Then high-profile cases grip the national eye, and issue entrepreneurs leverage these events to induce the holdouts into joining the consensus.
All of these three dynamics—the ratchet effect, the instillation of institutional logics, and issue realignment around a politics of consensus—find poignant expression in the 1930s. The following section describes these developments.
4. WAR ON CRIME AND ITS CONSEQUENCES
This section describes the development of the war on crime in the 1930s, framed within a bellicist theory of criminal justice. In particular, it describes the how the war on crime in the 1930s exhibited a ratchet effect, institutional logics, and a growing politics of consensus.
4.1. Wars Make States: The Ratchet Effect
The ratchet effect suggests that major spurts of growth in state capacity during wars never return to prewar levels. Rather, the state becomes larger on a permanent basis, and the increased capacity is applied toward other ends.Footnote 94 The major problems above posed significant problems to American law enforcement. FDR, Homer Cummings, and J. Edgar Hoover leveraged the reconstructive context, and they waged a war on crime. In the process, they rebuilt the American law enforcement system, and this apparatus remained even when the particular war waned.Footnote 95
One of the most prolific periods of crime policy entrepreneurship in American history almost ended before it even started. As FDR prepared to take office, Hoover's job was in jeopardy. He had accumulated detractors and enemies, and many congressional leaders wanted him gone. In 1933, Roosevelt appointed Senator Thomas Walsh to be his attorney general. Walsh was known for his distaste for Hoover, and he was presumed to be preparing to fire the FBI director.Footnote 96 In a mysterious turn of events, Walsh died on the train ride to Washington to take his new position. Walsh's FBI file contains articles describing enemies of the late senator, in addition to notes from several individuals reporting that Walsh's death was due to foul play. However, the FBI refused to investigate, stating that the death of their boss-to-be was not a matter of federal concern. Medical examiners deemed an autopsy unnecessary.Footnote 97 In a poignant illustration of path dependence, Walsh's death likely prevented Hoover's firing. Hoover would stay in this position for almost another forty years.
Homer Cummings was a Yale-educated lawyer, a former chairman of the Democratic Party, a Roosevelt loyalist, and an archetypal progressive.Footnote 98 Due in part to Walsh's death, he successfully vied for the attorney general position and quickly saw the benefits of a partnership with Hoover.Footnote 99 In contrast to the idiosyncratic and obsessive Hoover, Cummings was cool-headed, calculated, cautious, and socially liberal.Footnote 100 This strange partnership would have lasting implications. Cummings's political acumen paved the way for Hoover and protected him from detractors, and Hoover's hyperproductivity ensured implementation of a wide array of Cummings's initiatives. Together with President Roosevelt, these public entrepreneurs formulated official responses to this reconstructive moment in political time and ultimately waged the war on crime together.
FDR and Cummings did not hide their dislike of Prohibition entering the 1932 election. In 1930, FDR believed that Prohibition “led to corruption and hypocrisy” and “brought about a disregard for law and order.”Footnote 101 Cummings agreed with this assessment of Prohibition: “It strains the bonds of affection that ought to exist between the citizen and his government.”Footnote 102 Within the first year of the new administration, the 21st Amendment was passed to repeal Prohibition and defer the matter back to the states.
Cummings welcomed the change: “The Federal Government is no longer called upon to enforce a law which, in many sections of the country at least, did not have the support of public opinion.”Footnote 103 He drew two important lessons from the failed experiment. First, he learned the importance of aligning the public consciousness with the crime enforcement efforts of the federal government. He understood that legitimacy sprang in part from the confidence of the public in justness and fairness of a law.Footnote 104 Second, Prohibition had introduced a system of national policing, and its failure gave Cummings the opportunity to consider how to redeploy such a force with more legitimacy.Footnote 105 Thus, the problem of Prohibition became an opportunity for the Roosevelt administration. It trained them in the art of what not to do when launching a national crime campaign. When they plied the trade themselves, they would identify a more popular and sensational issue to enforce, combined with a wide-reaching public relations campaign.
Originally, Cummings attempted to lay out a holistic vision to deal with crime. He believed strongly in the power of an activist government to promote scientific and social efforts to eliminate crime and ensure the flourishing of communities. He valued professionalism and science, and he thought these values could address social problems. In line with these views, he divided his vision for policing into the three components of prevention, investigation, and punishment.Footnote 106
In the realm of prevention, he believed that the root causes of crime lay in particular social environments and that robust social support could reduce crime. In a speech in November 1933, he said, “Manifestly the problem of crime is not limited to detection, arrest and punishment. It is a social question, with manifold ramifications touching environment, heredity, education, the home, the school and, indeed, almost every activity of life. Prevention is even more important than punishment.”Footnote 107 He would later propose the creation of a bureau that would focus on crime prevention to complement the existing work of the Federal Bureau of Investigation and the Bureau of Prisons. He stressed the importance of working on root causes to deal with youth crime.Footnote 108
But more so than any particular recommendation about prevention, Cummings and FDR situated the campaign against crime within the larger New Deal agenda. Roosevelt's platform rested on his promise to provide a New Deal that would address the economic depression; he and Cummings believed this to be an essential approach to dealing with the social conditions that gave rise to crime. In a 1933 radio address, Cummings said, “The efforts of the Federal Government to reduce unemployment through the National Recovery Act, the Public Works Administration, the Civilian Conservation Corps, and allied measures, have a collateral and helpful effect in the matter of crime prevention.”Footnote 109 The New Deal did make important strides in addressing economic insecurity, including providing resources to millions of Black Americans.Footnote 110 Roosevelt and Cummings believed that the war on crime was deeply connected to the rest of the New Deal. But these discussions of root causes withered over time, and crime became divorced from the broader New Deal agenda. Hoover did not share FDR's broader social vision, and Hoover set the agenda on responses to crime. FDR and Cummings partnered with Hoover to build more rigorous investigation and punishment systems. This came via the war on crime. Three major events provided ample material for Hoover and Cummings to attract needed support for this war.
First, on March 1, 1932, the infant son of the famed pilot Charles Lindbergh was kidnapped. Hysteria swept the country as police scrambled to find the child and catch the culprit. The New York Times reported: “Augmented by thousands of civilian volunteers, every law-enforcing agency of the Eastern half of the United States and Canada swung into united action yesterday in the most intensive manhunt in the history of crime of this continent.”Footnote 111 In the end, however, the child was murdered, and the initial law enforcement efforts seemed deeply hampered without a coherent agency that could operate across state lines.Footnote 112 A precedent was set whereby criminals kidnapped the loved ones of rich people, crossed a state border, and demanded a ransom. The outrage from this event motivated Congress to act swiftly to curb the problem. In June 1932, Congress passed a federal kidnapping law that made it a federal crime to kidnap a person and take them across a state border.Footnote 113 Thus, when Cummings came into office, the nationalizing momentum already existed for a campaign against crime.Footnote 114 Cummings said in 1933, “The interstate character of many forms of crime, however, is a factor of constantly increasing importance. The modern criminal has learned that there is a certain security in the Twilight Zone between State and Federal jurisdictions.”Footnote 115 Cummings saw this interstate element as a lever by which to expand federal policing capabilities and authority.
Second, gangster Frank Nash and six law enforcement officers were shot in the Kansas City train station in what became known as the Kansas City Massacre. Prior to this event, most federal officers did not carry a weapon, and it was not a federal crime to murder a federal officer. This event catapulted gangster violence to the headlines, and it provided the incoming administration with a visceral demonstration of a war that was being fought—with machine guns against violent enemies. Hoover approached the fight with a new sense of urgency. In an internal memo in the summer of 1933, he described in detail a list of weapons he was sending to each field office.Footnote 116 He was determined never to be outgunned again, and he would mostly succeed.
Third, a series of gangsters—headlined by John Dillinger—were pursued and killed by federal officers. These gangsters made their money and earned their fame through bank robberies that took advantage of jurisdictional limits. Hoover pushed the envelope of his legal authority to bring them down. “Machine Gun Kelly” was arrested in September 1933 as the federal government ramped up its efforts. John Dillinger was arrested in the same month, but he soon escaped from an Ohio prison. He would do the same several months later, famously escaping from an Indiana prison with a wooden gun. As Elliot Gorn describes in his monograph on Dillinger, “It was one bloody road trip, one wild ride, and it haunted America's imagination.… Some said that of all the famous Americans of this era only Franklin Roosevelt and Charles Lindbergh were better known.”Footnote 117 After another spate of bank robberies and shootouts, Dillinger was killed by FBI agents in Chicago on July 22, 1934. The Dillinger escapade represented a whole series of similar events. A few months earlier, Bonnie and Clyde Borrow pulled off a series of robberies, before being shot in a gunfight and car chase.Footnote 118
Cummings and Hoover waged war by appealing to the public's outrage over these incidents. They cultivated relationships with issue entrepreneurs in Congress and formally presented Justice Department agenda items to both chambers.Footnote 119 On May 18, 1934, Roosevelt signed an omnibus crime bill that he helped fashion and champion. The laws made a new set of federal offenses: harming a federal law enforcement officer, kidnapping cases not involving a ransom (and thus not covered by the previous law), interstate transportation of extortion letters, fleeing from states to avoid prosecution or serving as a witness, insurrections in federal prisons, and robbery of a member bank of the Federal Reserve.Footnote 120 Cummings became one of the most legislatively successful attorney generals in American history. His legislative achievements allowed for Hoover to conduct investigations in unprecedented ways. Cummings and FDR gave prescient indications of the laws’ implications in their respective press releases. Cummings said, “With added facilities and the elimination of certain legal handicaps, the department will be able to prosecute even more vigorously its drive upon organized crime, as well as its wider program of vigorous and impartial enforcement of the law in all of its phases.”Footnote 121 FDR expressed a similar sentiment: “Federal men are constantly facing machine-gun fire in the pursuit of gangsters.… I stand squarely behind the efforts of the Department of Justice to bring to book every law breaker, big and little.”Footnote 122
The rest of Cummings's tenure contained more of the same. He consistently cleared legal ground for Hoover to expand territory. The omnibus anticrime bill in the summer of 1934 gave federal officers a regular ability to carry weapons and arrest suspects. The bills also added a variety of offenses related to transporting kidnapping victims, extortion, assaulting federal officers, and other crimes.Footnote 123 They also passed the Anti-Racketeering Statute and the National Firearms Act. The former made it illegal to “interfere with interstate and foreign commerce by violence, threats, coercion, or intimidation”; the latter taxed certain kinds of weapons and required them to be registered. In 1936, Congress passed a law to make receipt and possession of ransom money a federal offense. In 1937, they extended the bank robbery statute to burglary and larceny.Footnote 124 When Cummings was preparing to step down at the end of 1938, Assistant Attorney General Alexander Holtzoff prepared a memo listing and summarizing all of the legislation enacted under the sponsorship of Cummings. This list includes sixty-eight laws, ranging from criminal procedure and criminal law to currency and judicial organization.Footnote 125 Of these, twenty-four pertained to crime in general. I coded these laws according to whether they principally concern the efforts of the war on crime, general matters of law enforcement, or restorative efforts.Footnote 126 Additionally, I coded nineteen available speeches given by Cummings and Hoover between 1933 and 1938 according to the same rubric. The results are displayed in Figure 2. Within this sample, 75 percent of laws and 63 percent of speeches focus on elements specifically designed for the war on crime.
Emphasis of Justice Department Laws and Speeches. Sources: Archives of Franklin Delano Roosevelt, Franklin D. Roosevelt Presidential Library; Papers of Homer Stille Cummings, Albert and Shirley Small Special Collections Library, University of Virginia; Federal Bureau of Investigation (FBI) Records, Raynor Memorial Libraries, Marquette University.

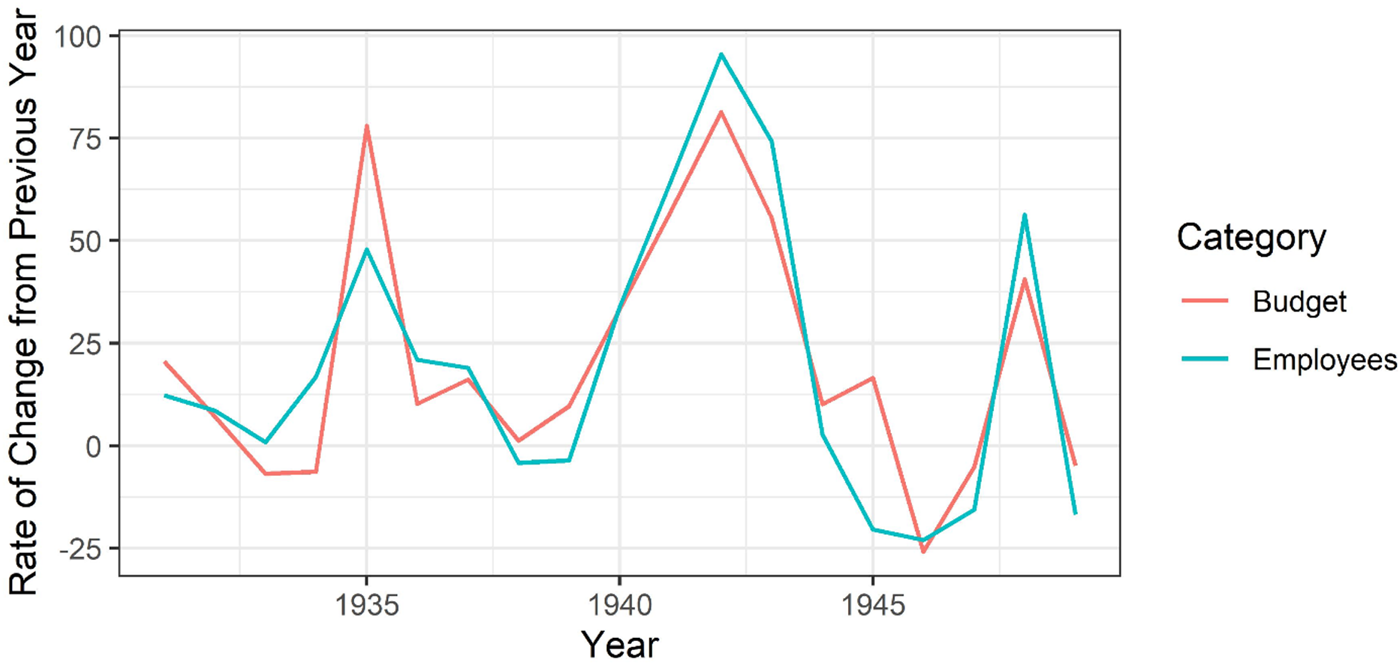
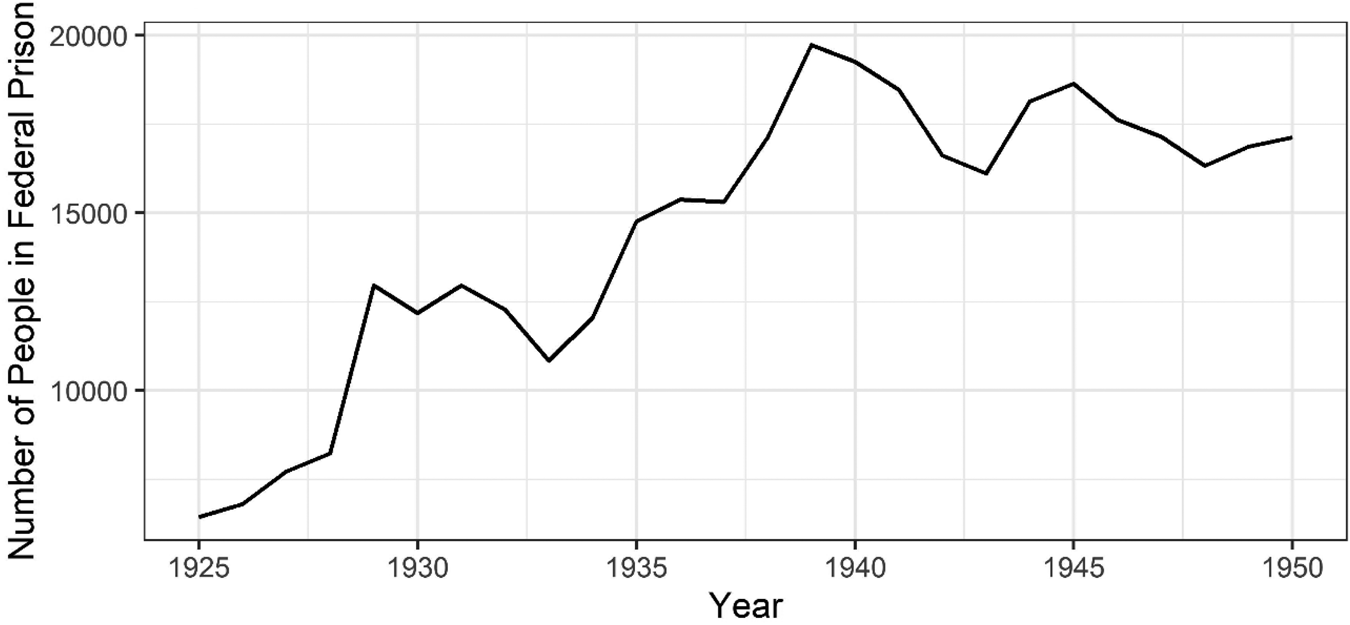
Cummings and Hoover successfully passed a vast array of laws to launch and sustain the war on crime. Their capacity and power expanded rapidly and durably (Figure 3). In the years preceding the war on crime, the FBI budget featured only modest fluctuations. The budget was $2,307,720 in 1930, and it experienced small rises and declines over the next four years. In 1933, the FBI budget was set at $2,599,619 for the following year.Footnote 127 But as the war on crime took off and reached its height, the FBI budget more than doubled over the next three years. This expansion was reflected in the number of employees. After steady growth from 656 employees in 1930 to 808 employees in 1933, the number of employees also more than doubled in the next three years, with 1,689 employees in 1936 and more than 2,000 by 1937.Footnote 128 Hoover utilized a range of statistics to justify higher spending and a larger workforce in reports to Congress. For instance, they sent and received twice as much mail as they had before; they classified twice as many fingerprints; they identified twice as many fugitives.Footnote 129 But, more importantly, the number of federal prisoners rose by over 66 percent in the 1930s, going from 12,185 in 1930 to 19,730 in 1939 (Figure 4).
Rates of Change in FBI Capacity. Sources: Congressional appropriations hearings on Justice Department budget, 1931–1950. Each budget number and number of employees was taken from the year after the budget was set, when J. Edgar Hoover recounted the budget of the previous year. Sometimes the budget changed after it was initially set, so the year after provides more reliable data. The only year for which these data were not available was 1942. In this case, budget and employee data were drawn from Athan Theoharis, ed., The FBI: A Comprehensive Reference Guide (Phoenix, AZ: Oryx Press, 1999), 4. After the data were collected, I created a new variable that took the percentage change in the budget and number of employees from the previous year, essentially taking the derivative of the budget and number of employees with respect to time.

Federal Prisoners, 1925–1950. Source: Patrick A. Langan, John V. Fundis, Lawrence A. Greenfield, and Victoria W. Schneider, “Historical Statistics on Prisoners in State and Federal Institutions, Yearend 1925–86” (report NCJ-111098, Bureau of Justice Statistics, National Institute of Justice, U.S. Department of Justice, Washington, DC, 1988).

The ratchet effect is clearly manifested. Following the war on crime, the rate of growth declined, but the department never fell back to previous levels. The war on crime built the law enforcement state, and it was a state that would endure. The growth of the FBI during the war on crime mirrors the subsequent spurt during World War II. From 1941 to 1943, the budget and workforce of the FBI nearly tripled—almost entirely due to growth in national security work, including extended investigation of “subversive activity.”Footnote 130 These trends exemplify the importance of these two wars for the FBI: the war on crime in the 1930s cemented the FBI as the premier policing agency in the United States, and World War II established the FBI as the premier intelligence agency in the nation. Wars made the American law enforcement state, and—as the next section will show—this state instilled institutional logics that seeped into the formation of modern policing.
4.2. States Make War: Institutional Logics
“An institutional logic is the way a particular social world works.”Footnote 131 In moments of opportunity, institutional entrepreneurs can modify the norms and patterns of the social world.Footnote 132 War in particular creates these opportunities: “War helps to make states, states make war, and therefore states are in part, and always must be, war machines.”Footnote 133 So also with wars on crime. To illustrate this, I employ the concept of institutional logics to the social world of the police, and I contend that the war on crime in the 1930s did much to change and craft institutional logics. Issue entrepreneurs like Hoover and Cummings crafted these logics in moments of particular importance. The central policing logic they ingrained was simple: Policing exists to make war against public enemies. At the same time, they reproduced a clear set of racial logics that Black people were unworthy of protection and instead objects of suspicion. When combined, these two logics created the conditions for a war on crime against the Black community.
4.2.1. Policing Logics
In understanding how Hoover and Cummings instilled new federal policing logics, we can look at what tools they developed for federal law enforcement to employ, how they designed institutions to use these tools, and who they hired to carry out the work. By determining the what, how, and who, they set the course for the “behaviors, institutional forms, ideologies” of policing.Footnote 134 This, in turn, had a cumulative and exponential effect. As Paul Pierson argues, “Established institutions generate powerful inducements that reinforce their own stability and further development.”Footnote 135 This era exhibited path dependence in policing. Cummings and Hoover led a vulnerable institution in 1933. But they leveraged this vulnerability to build something new, and they left behind a secure institution that would reinforce its own stability and growth.
First, Hoover and Cummings changed what tools the FBI possessed to utilize in response to crime.Footnote 136 In particular, they reinforced the centrality of professionalism, weapons, punishment, and science. Hoover resented that law enforcement could be outgunned by professional gangsters and bank robbers. He proclaimed, “Modern criminals are vicious gunmen; some of them are proficient gunmen. We must not only out-think them, but we must out-shoot them.”Footnote 137 He complained that the law enforcement officers of the country were not equipped with enough “machine guns, gas guns, bullet-proof vests, shields.”Footnote 138 During the war on crime, the FBI quickly amassed weapons for large-scale shootouts, and they designed new weapon trainings. Police historian Samuel Walker says that this focus of the FBI facilitated a process by which “professionalism in law enforcement came to be identified in terms of firearms expertise.”Footnote 139 Walker adds that the “link between guns and the police was a completely new phenomenon in the history of American law enforcement.”Footnote 140 Aside from firearms, they also responded to some repeated instances of prison escapes by forming the modern supermax prison. In 1934, the Justice Department acquired Alcatraz and turned it into a federal prison.Footnote 141 On a visit to the new site, Cummings said, “In this prison will be confined only the worst offenders—those who have demonstrated they are beyond redemption. It is an essential part of the Federal Government's new penal system.”Footnote 142 The prison would become home to some of America's most infamous gangsters, including Al Capone and Harvey Bailey. They built up a brand of prison founded on zero tolerance, maximum security, and a lack of redemptive possibility.
Furthermore, the FBI became the central agency for three other technological areas: fingerprints, laboratory work, and statistics. They established a clearinghouse for fingerprints that would be accessible for law enforcement agencies.Footnote 143 A scientific laboratory was also established in Washington that permitted “an analysis of latent evidence” and “an excellent school for the study of the use of the latest scientific equipment.”Footnote 144 And the FBI started creating the Uniform Crime Reports, based on the reporting of more than 1,600 cities.Footnote 145 During this period, the FBI defined what tools were available for them to address crime. While the FBI operated at a federal level, we will see later that local and state police adopted these tools as well.
Underlying these features, professionalism became a norm and mantra that Hoover cultivated in law enforcement. He fought to remain politically independent, to create a rigid chain of command, and to set clear policies and procedures.Footnote 146 He sought to eliminate ideas of police as sloppy, working-class, and corrupt. This reveals the complexity of Hoover's police reforms. On the one hand, he sought to eliminate the kinds of policing explicitly rooted in some forms of personal bias and public corruption that had a hold in police institutions. Instead, he placed the weight on investigative rigor and professional standards, and he created political independence that limited certain forms of corruption. Police departments would increasingly adopt similar standards of independence, rigid chains-off command, uniformed officers, and investigative tools. However, as we shall see, Hoover's brand of professionalism masked other forms of bias, and his political independence provided him leverage over politicians, which he exploited to carry out his own forms of corruption and manipulation.
Second, Cummings and Hoover shaped how federal police would deploy the tools in their disposal. A certain mutually reinforcing logic was at work. To build up the tools, they launched a war on crime. The war on crime allowed them to gain resources and legitimacy to accrue to this specific set of tools and institutional forms. With these tools under their belt, they were more equipped in the future to launch other wars on crime. The actions carried out in the war on crime became “stable, valued, and recurring modes of behavior.”Footnote 147 The tools described above were tailored to enable scientific analysis, overwhelming use of force, and aggressive investigations. Hoover and Cummings normalized these as the model response to crime. Moreover, Hoover established an institutional script for launching crime campaigns that involved a key set of steps: (1) identify a problem, (2) personify the problem with particular individuals and groups, (3) appeal to the public in sensational and visceral images, (4) advocate for laws and resources with issue entrepreneurs in the legislative branch and White House, and (5) implement the campaign with an increased supply of weapons and resources. They instantiated patterns for how policing operated through science, force, investigations, and war campaigns. States and locales would adopt these logics.Footnote 148
Third, Hoover also determined who would do the work of policing within the FBI by hiring legally trained agents who fit a specific intellectual, biographical, and personal profile.Footnote 149 Early on, he shirked the civil service system and avoided being implicated in its fall from grace after World War I.Footnote 150 Instead, he positioned himself and his organization as the new experts—highly educated, neatly dressed, professionally trained, and White.Footnote 151 Special agents with some legal training went from 16.48 percent of the total in 1924 to 67.44 percent by 1938.Footnote 152 Hoover excluded from this special class those he deemed too suspicious. He was known for his dislike for hiring Black agents.Footnote 153 When Hoover died in 1972, 98.4 percent of FBI agents were White men.Footnote 154 He possessed extraordinary discretion in shaping the personnel of the FBI, free from the oversight of a civil service commission. Through his public relations campaign, he valorized his class of employees as the heroes, while demonizing “cowardly, vicious criminals.”Footnote 155 Thus, he not only determined who would do the policing, but also who would be policed. Initially, he publicized the high-profile gangsters as the objects of policing. But he gradually expanded this frame to include wider groups of people, mostly immigrants and minoritized groups.
Here we can see some of the consequences of the institutional logics that the war on crime had developed. Cummings envisioned a multitiered system, with different sets of tools and patterns of behavior for different kinds of criminals. He wanted a more punitive system for mobsters and kidnappers and a more rehabilitative system for lower-level offenders.Footnote 156 As Cummings's tenure drew to a close, he admitted the stark imbalance in his institutional achievements. In a moment of striking honesty, he detailed his failures in crime prevention:
When I entered upon my duties as Attorney General five years ago, I determined that I would strike every blow I could in the fight against crime. In the Department of Justice we have naturally devoted our principal efforts to the traditional fields of Departmental activity—investigation, prosecution, and imprisonment. But I must confess quite frankly to you that I have been troubled by the comparatively inconsequential advances in the basic matter of crime prevention.Footnote 157
By his own admission, Cummings created a very limited set of tools, patterns, and logics. By creating certain institutional logics early on, he enabled them to be applied indiscriminately later on, particularly given that Hoover (the one who would remain) did not share his rehabilitative aspirations. The sole socially oriented law that Cummings produced came in the 1938 Federal Delinquency Act. By then, the system had already been built to a large degree, and this law did little to change the state of affairs at the core of the war on crime. As Carl Suddler argues, this Delinquency Act only brought more people into the criminal justice system by lowering the bar for engagement in the system, and it ended up criminalizing juveniles and applying more punitive systems.Footnote 158 When Cummings said in 1934 that he wanted to apply his new system to all phases, he foreshadowed how his institutional designs would expand their areas of application.
In other words, his formation of Alcatraz in 1934 cast its shadow over his Delinquency Act of 1938. He had only created logics oriented around policing a dangerous class of public enemies. Alcatraz was intended as a “super prison for the super criminals caught by the super cops.”Footnote 159 But as time progressed, this would be expanded to cover wider groups of people. In the height of the war on crime, Cummings wrote an article in 1933 entitled “Army of Lawless is Losing.”Footnote 160 In 1949, Hoover would declare that the country was “facing a potential army of 6,000,000 criminals and an ever-increasing wave of lawlessness.”Footnote 161 Law enforcement would do what it had been prepared to do through the war on crime: overwhelming use of force, scientific expertise, and aggressive investigations. Contrary to what John Hagan argues, crime policy in the era of FDR was not rehabilitative in nature.Footnote 162 Later wars on crime continued the punitive tradition of the FDR administration. Hoover helped ensure that this tradition would continue. He entered the Roosevelt administration in danger of losing his job, and he left with a level of bureaucratic autonomy that has never been matched in American history.Footnote 163 He leveraged this autonomy to make sure the state would continue to make war.
4.2.2. Racial Logics
The war on crime also reproduced distinct racial logics. Racial logics and systemic racism were not new.Footnote 164 In fact, the presence of these logics and systems of racism prompted calls for federal law enforcement to hold local police accountable. Instead, the FBI sanctioned local police to continue to carry out racial violence, and they adopted many of the racist notions and practices that local governments utilized. Further, the FBI added new practices of racism to the system and passed them back to the states. All the while, they successfully vied for legitimacy and provided a model for local police to follow.
The FDR administration instilled two key racial logics: (1) Law enforcement would not be built by or for Black people, neither protecting them nor giving them a voice in how policing works, and (2) Black people are objects of suspicion, deemed radical because of civil rights and criminal because of scientific racism.Footnote 165
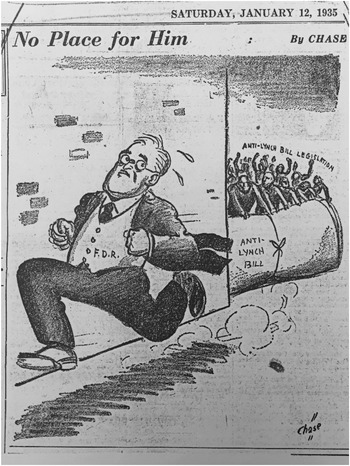
The FDR administration determined that Black people would not be protected by law enforcement and not involved in the reimagination of policing. As lynchings of Black people persisted, the Roosevelt administration refused to take a stand for fear of offending their Southern supporters (Figure 5). As Nancy Weiss summarized in her classic book on Black politics in the New Deal, “Political calculus took precedence over moral outrage, and the need to mollify Congress always won the day.”Footnote 166 In Congress, Roosevelt failed to lend his support for an antilynching bill, even though he likely could have tipped the scales in favor of such a measure.Footnote 167 Cummings intentionally avoided action against lynching, in part so that they could pursue the rest of their agenda on crime.Footnote 168 But even apart from congressional action, Cummings and Hoover had pushed the envelope in other domains to force Congress to give law enforcement the official stamp of approval. In areas of racial justice in policing, they seemed to lose their bureaucratic creativity. The clearest example came in the case of Claude Neal, a Black man who was kidnapped from the authorities by a lynch mob and taken across the Florida border to be hung and mutilated in a graphic display of racial violence.Footnote 169 Because he was kidnapped and taken across the state border, this gave the federal government the jurisdiction to investigate under the revised kidnapping law.Footnote 170 Eleanor Roosevelt wanted the federal government to act, but Franklin Roosevelt and Homer Cummings refrained from taking action.Footnote 171 Throughout this time, many Black leaders urged them to act. Black civil rights leaders found FDR difficult to reach, and NAACP President Walter White said Cummings was “evasive and unresponsive.”Footnote 172
“No Place for Him,” cartoon in the New York Amsterdam News, January 12, 1935. Source: Eleanor Roosevelt Personal Letters (100), 1933–1945, box 623, 2, Franklin D. Roosevelt Presidential Library.

Racial injustice was not limited to conventional lynchings, as illustrated by one of the most publicized instances of anti-Black racism during this era. The case of the Scottsboro Boys involved nine Black boys who were falsely accused of raping two White women.Footnote 173 They were tried without adequate counsel and sentenced to death. In 1932, Powell v. Alabama reversed the conviction of the Scottsboro Boys because the “same-day provision of counsel in a capital case violated due process of law.”Footnote 174 They were, however, reconvicted, before having the conviction overturned again by the Supreme Court in 1935 because Black residents were excluded from the pool of potential jurors.Footnote 175 This incident became a rallying cry for the treatment of Black people in the criminal justice system. These are but a few examples of the violence experienced by Black people during this time. Whether in the North or South, Black people experienced systematic violence, and the government failed to stop it and often participated in it.
In these years, federal law enforcement also entrenched a suspicion of Black civil rights and projected criminality onto Blackness through scientific racism. Nancy Weiss concluded: “Even the watchdogs of the federal establishment, Hoover and the Federal Bureau of Investigation, who later fastened intently on the struggle for racial equality as a vehicle for communist subversion, virtually ignored racial matters before 1941.”Footnote 176 But this conclusion understates how the massive spike in the surveillance of Black groups during the 1940s was precisely because of the conclusions developed in prior decades. The surveillance of Black leaders dated back to the early World War I and figures like Marcus Garvey.Footnote 177 Hoover helped lead some of these earlier efforts. He penned a report in 1919 that was published in the New York Times entitled “Radicalism and Sedition among the Negroes, as Reflected in Their Publications.”Footnote 178 Du Bois remarked sarcastically, “We black folk have for some years been trying to get the United States Department of Justice to look into several matters that touch us.”Footnote 179 Hoover would never lose this suspicion of Black communities and leaders. As William Maxwell said, “America's ghostreading national constabulary rarely took its eyes off the latest in African American writing between 1919 and 1972. And during this more-than-fifty-year period, the whole of its Hoover era, the Bureau never dismissed this writing as an impractical vogue relevant only to blacks.”Footnote 180 Not only did he read Black writings and ideas throughout his career, but he also consistently casted them as dangerous to America.
Such was true in the FDR era. During the trials of the Scottsboro Boys, a communist organization, the International Labor Defense, handled the defense, and law enforcement personnel used this as justification to conflate “Red Fascism” with protest against the unjust treatment of Black people exemplified in Scottsboro.Footnote 181 Hoover made this point himself, and it became a reference point for justifying surveillance of Black groups.Footnote 182
Hoover personally oversaw extensive surveillance of Black groups, rationalized by his suspicions of their ideological extremism and sanctioned by FDR. A 1941 FBI report on the National Negro Congress provided an attendance list of a 1934 meeting and gave this description of the organization's president: “Langdon Hughes is a negro pornographic poet, and [redacted] Communist agitator of race strife” (misspelling in original).Footnote 183 Later in the report, it says, “The National Negro Congress also took up the defense of the Scottsboro Negro, which is the pet hobby of the Communist Party.”Footnote 184 This line summarizes a progression of logic that Hoover would never shed: Communists care about racial justice like the Scottsboro Boys; civil rights groups also pay attention to these same issues; therefore, civil rights groups are extremist groups that ought to be surveilled. Later, in a congressional committee meeting, he stated that an affirmative answer to the following question would prompt surveillance: “Does the organization sponsor causes, campaigns, literature, petitions or other activities sponsored by the Party or other front organizations?”Footnote 185 In other words, if an organization sponsored causes—including civil rights—that the Communist Party also supported, then they should be surveilled. Hoover's surveillance strategy was not a totally clandestine operation. He told it to Congress, rallied presidential support, and carried it out with devastating consistency.
In 1940, Edgar Brown appeared before the House Appropriations Committee to protest Hoover's refusal to hire Black agents. Brown was a Black civil rights leader and president of United Government Employees.Footnote 186 He urged the committee to appropriate funds to hire Black investigators and special agents. The first question he received came from Millard Caldwell, a member of Congress from Florida: “Do you think there is any reason to suspect that any of the Communistic propaganda is finding fertile ground among the Negro race?”Footnote 187 Rather explicitly, Caldwell openly questioned the wisdom of hiring Black people—whom he believed had a propensity to imbibe subversive propaganda. Meanwhile, Brown's pleas went unheeded.
Brown came back in 1942 to plead for the same, with increased urgency.Footnote 188 He began by recounting recent events in Alexandria, Louisiana, where Black soldiers were stationed. A White police officer tried to arrest a Black soldier for defying segregation rules, precipitating a skirmish that left twelve Black soldiers “wounded by gun fire and sixteen others so badly beaten as to require hospitalization.”Footnote 189 Earlier in the day, the police in Alexandria had reinstated the chief of police, “who had previously been removed from office by the local civil service commission on the charge of extorting personal labor from Negro prisoners confined under his jurisdiction in the city jail.”Footnote 190 A local Black newspaper referred to the Alexandria police as “the famous Alexandria n___r killing squad.”Footnote 191 Black soldiers feared for their lives—at the hands of White police and soldiers—as they prepared to fight for a country in which their lives were considered dispensable and suspect. One family member sent a letter to the NAACP, saying, “I want him to serve his country, but is this what we are fighting for?”Footnote 192
House members protested the relevance of the incident: “We don't have anything to do with the Army or Navy in this committee.”Footnote 193 But Brown persisted, suggesting that Black people were needed in the FBI to conduct these investigations and participate in the work of the defending the vulnerable:
Mr. Hoover continues to deny employment to Negroes as “G” men. He does not have anybody in his office who can go out, who knows what the Negroes are thinking, what is going on in their world. With this committee appropriating millions of dollars for the purpose of paying the G-men, I say Mr. Hoover is doing a great disservice to this country when he does not employ Negroes who understand and know these people, and who can check this kind of thing I have just here presented to you.Footnote 194
Brown went on to critique Hoover's exemption from civil service, which essentially gave Hoover unilateral control over hiring practices. Brown urged them to take away “the same despicable single-action madness we are fighting on the seven seas and in every civilized and private land away from one who so ruthlessly exercises it to bar all Negroes from positions as G-men.”Footnote 195 In a brilliant turn, Brown suggested it was Hoover—not the Black communities he so looked down upon—who promoted subversive, undemocratic activity.Footnote 196 Brown offered a radical critique of the country's hypocrisy, and he also promoted a view of law enforcement as something designed by and for those most vulnerable to violence. The toils of civil rights activists reshaped the American state in this period, including revolutions in criminal procedure that made strides toward protecting Black Americans.Footnote 197 But they were continually shut down in pivotal actions on crime policy.
Black civil rights movements were deemed suspicious. This suspicion was intertwined with the criminalization of Blackness. The new brand of policing, featuring new science and technology and statistics, elevated and legitimated this criminalization of Blackness. With the introduction of the Uniform Crime Reports in the 1930s, they led the nation in the use of statistics to shape crime policy, and they also “breathed new life into racial crime statistics.”Footnote 198 Mainstream social scientists had already set the stage by developing theories for why inherent Black criminality explained statistics about Black crime, despite the repeated rebukes and debunking coming from Black social scientists like W. E. B. Du Bois.Footnote 199 The FBI initially divided out foreign-born Whites as a separate category. By 1941, the foreign-born category disappeared: “Blackness now stood as the singular mark of the criminal.”Footnote 200 Higher rates of crime among Black people were interpreted as symptoms of criminality and dangerousness. These views also comported with public views on race. For instance, in a 1939 Gallup poll, 71 percent of respondents said that Black people generally had a lower intelligence than White people. And, among those who answered this way, 43 percent of them said it was because they are “born less intelligent,” and another 21 percent said it was both social conditions and biological inferiority. In this same poll, only 13 percent of respondents said that Black people should be free to live wherever they want.Footnote 201 As Khalil Muhammad has argued, these views of social equality and intellectual ability were intertwined with the idea that Black people were inherently more criminal and violent.Footnote 202 These views were promoted by prominent social scientists and deployed by law enforcement agencies, including the agencies led by Cummings and Hoover.
Hoover, Cummings, and FDR were urged to address the existing racial logics and undo anti-Black racism in policing by holding local leaders accountable. Instead, they adopted existing racist notions and added to them, and they infused this evolving racism into a new system that would win public legitimacy. In their defiance of Black requests, they refused to protect Black communities and excluded them from the coalition on which their system was based. In their unflinching acceptance of “science,” they inherited progressive notions of Black criminality and reinforced them with their surveillance of civil rights groups as potential enemies of the state. In so doing, they paved the way for a state that makes war. However, the public enemies would not be limited to John Dillinger and his fellow renegades. The public enemies would often be the Black community that was unprotected and criminalized by the expanding law enforcement apparatus. And Black officers and agents—when they were eventually hired in larger numbers—would be folded into a system with institutional and racial logics that had been hardwired into the system.Footnote 203
4.3. Issue Realignment and the Politics of Consensus
Wars nationalize politics, and they create pressure for a politics of consensus, a unity that transcends conventional divides. The war on crime in the 1930s proved to be fundamental to the state-building project of the Roosevelt administration's efforts on crime. As Claire Potter argues, “The figures of the policeman and the criminal were also deeply political.… Producing a ‘moral state’ was a political process, a series of policy choices that, simultaneously enacted in popular culture, secured citizen consent for a state in formation.”Footnote 204 In a radio address in September 1933, Cummings called for a war on predatory criminals. In his final paragraph, he said, “It is a real war which confronts us all—a war that must be successfully fought if life and property are to be secure in our country.”Footnote 205 Closely following the lessons learned from Prohibition, Cummings sought to portray the horror of the crimes they were fighting, villainize these enemies of the state, and mobilize public sentiment to support his law enforcement project.
Cummings gave a series of speeches and radio addresses to appeal to the American people for increased efforts in the war on crime. In 1934, he went on a speaking tour, visiting places like Kansas City, Los Angeles, San Francisco, and Hawaii. His trip was closely monitored by local and national newspapers.Footnote 206 In these stops, he pointed to Dillinger on two fronts: to show the havoc he wreaked and to illustrate that the federal government was able and willing to neutralize people like him. In one instance, he said, “When John Dillinger was destroyed in Chicago Sunday night by federal agents, it was the end of the trail for Dillinger, but it was not the end of the trail for the [D]epartment of [J]ustice.”Footnote 207 He trumpeted both the urgency of the fight and the ready abilities of his organization to win the battle.
Hoover and FDR also aided in this public campaign. During this time period, many people were suspicious of many institutions, particularly financial institutions, in the wake of Prohibition and the Great Depression. Bank robbers, mobs, and mafias vied for legitimacy much more competitively than they do today.Footnote 208 Hoover carefully curated his public image, and he worked to make the common take-away from Dillinger's death a memorable refrain: “The real meaning of the case was that Hoover always got his man.”Footnote 209 He understood the stakes of securing legitimacy, and he maintained a careful public relations campaign to legitimize the bureau's activities.Footnote 210 FDR folded the war on crime into the New Deal: “As a component part of the large objective we include our constant struggle to safeguard ourselves against the attacks of the lawless and the criminal elements of our population.”Footnote 211 For Roosevelt and Cummings, the lawless violence of gangsters threatened the economic relief efforts of the New Deal agenda. This rhetorical move allowed these social liberals to build a common agenda on crime policy with Hoover—who repeatedly disavowed reference to the social roots of crime.Footnote 212 But Cummings took this one step further: He recognized ideological differences in responding to economic crises but demanded consensus on his approach to crime control. He said, “There can be legitimate differences of opinion concerning appropriate remedies for our economic and social ills, but there can be no room for such differences when the question is one of protecting our persons, our financial, industrial and business structure, our families and our homes from the predatory criminal and the menace of the underworld.”Footnote 213 In this way, Cummings forged a peculiar and enduring coalition between tough-on-crime conservatives like Hoover and social liberals like FDR. It was a strange coalition, but it was built on a politics of consensus, a hallmark of wartime governance. Their success would earn them major policy gains and bureaucratic autonomy.Footnote 214
The war on crime induced an issue realignment. Eric Schickler describes how the racial realignment often located in the 1960s actually started to a large degree in the 1930s and 1940s. Democrats began moving slowly toward civil rights, and Black voters shifted toward the Democratic Party. At the same time, the path was being paved for conservative Southerners to shift to the Republican Party.Footnote 215 However, in the 1930s, Roosevelt still needed to maintain his fragile coalition that included Southern Democrats. But what Schickler's account does not describe is the way Cummings and Hoover induced an issue realignment by creating a coalition durable enough to resist the general political realignment. Cummings possessed rapport within the Democratic Party as a liberal New Dealer, and he locked arms with the conservative Hoover. Additionally, they recruited issue entrepreneurs in every major coalition in Congress. The two primary champions of Justice Department policies in Congress were Democrat Edward Copeland (NY) and Republican Arthur Vandenberg (MI). They drafted legislation, persuaded colleagues, and secured wide-reaching consensus. Cummings and Hoover extended their coalition by recruiting issue entrepreneurs from other regions and political blocs. In an internal Justice Department memo to Cummings, Joseph Keenan lists the key members who helped champion some of their crime legislation in 1934. In a list of thirty-one congressmen who led efforts on the omnibus crime bill, four were Republicans, and nine were Southern Democrats.Footnote 216 The account in the Congressional Record of the debates leading up the crime bill verifies the importance of the figures listed in the internal memo. Indeed, these people—who were of all political stripes—took charge in the debate and pushed the bill forward.Footnote 217
Importantly, the debates over crime happened in the same time period that lynching was being catapulted again to the congressional stage. The Southern Democrats who led anticrime efforts consistently voted against making lynching a federal crime—even as they urged everyone to make kidnapping, bank robbing, and racketeering into federal offenses. I examined the roll call votes for two important sets of lynching bills in 1935 and 1937.Footnote 218 Based on the list created internally by the Justice Department, I examined how each of the crime policy entrepreneurs in Cummings's coalition voted on these bills. Out of thirty-three votes placed by these leaders in these two sets of votes, sixteen votes were against making lynching a federal crime.Footnote 219 Some of them were outspoken in their opposition to antilynching legislation. Hugo Black, one of the crime-bill leaders in 1934, led the opposition to the antilynching bill in the senate in 1935.Footnote 220 He rejected the idea of antilynching legislation in principle.Footnote 221 Relying on the anti-Reconstruction propaganda of Claude Bowers, he argued that the antilynching measures would “have an accentuating effect like unto the fourteenth amendment”—which he describes as dictatorial rule of the federal government over Southern Whites.Footnote 222
Curiously, no vote exists for a 1934 antilynching bill. Jenkins, Peck, and Weaver note that Costigan and Wagner tried to introduce a bill in 1934.Footnote 223 As they rightly describe, it is largely unclear why it never went to a vote. We know that Wagner and Costigan introduced a bill in April 1934 in committee, but despite their efforts, the bill never reached the floor. Existing evidence has shown that, to preserve his broader agenda, FDR generally avoided supporting antilynching legislation. However, there is also evidence that the 1934 bill did not even reach the floor in part because of the value placed on the omnibus crime bills by the FDR Justice Department.Footnote 224 Louis Howe sent Wagner and Costigan's bill to FDR, which now resides with an attached memo: “Not favored at this time—may create hostility to other crime bills.”Footnote 225 In a memo of his own, Cummings encouraged FDR “to defer any definite action” on lynching because of “collateral and pending matters, of very great importance, which might possibly be affected by any statements you might make.”Footnote 226 The Justice Department opposed the lynching bill because it threatened the omnibus crime bill, and it's not hard to see why. To debate the crime bill in conjunction with the antilynching bill would create a damning juxtaposition: to give federal authority over protecting White people from kidnappings but refusing to protect Black people from lynchings. It would undercut the ostensible logic of states’ rights, and it could have possibly compelled Southern leaders to vote against the omnibus crime bill to preserve a façade of consistency.Footnote 227 The Justice Department lobbied to keep the 1934 antilynching bill from the Congress floor. In doing so, they marked crime policy as an issue of consensus, led by a coalition that encompassed every faction in the country except for the Black community. If there was ambiguity over whether the crime bills would also protect Black people, the Claude Neal kidnapping and lynching would confirm that they would not be so used, even when the new laws should have applied.Footnote 228
There was no roll call vote on record for the omnibus crime bill in 1934 for a very different reason.Footnote 229 The Congressional Record and internal Department of Justice documents reveal why: These bills were passed by unanimous consent, thus requiring no vote. Debates over the bills stemmed from procedural differences in the bills passed by the two chambers, and these issues were settled in conference.Footnote 230 Joseph Keenan said in his memo for the attorney general: “Senator King of Utah was very gracious in withdrawing his objection to unanimous consent to these bills, although he was not entirely convinced that they should be enacted.”Footnote 231 Thus, a broad-reaching crime coalition was born. Even after the crime bills passed, civil rights leaders called for lynching to be part of Cummings's vision. But he refused to make such a pivot.Footnote 232
The significance of this coalition lies in the way Cummings fostered a collection of support from a group of people who seemingly had nothing else in common.Footnote 233 William Borah sought the Republican nomination against Roosevelt in 1936 as an ardent opponent of the New Deal, and Arthur Vandenberg was also a leading opponent of the New Deal and a potential candidate in 1940 to run against FDR.Footnote 234 Furthermore, the third most significant figure in the war on crime in the 1930s—behind Hoover and Cummings—was Thomas Dewey, a Republican who would one day run for president against the New Deal coalition. Thus, three of the most significant issue entrepreneurs on crime policy during the New Deal were some of the New Deal's greatest opponents. This was combined with leadership from some powerful Southern Democrats, including Hugo Black (AL), Hubert Stephens (MS), Jo Byrns (TN), Jere Cooper (TN), and Robert Lee Doughton (NC).Footnote 235 These congressmen held significant influence. For example, Doughton was the leader of the powerful Ways and Means Committee and a crucial leader of the Southern coalition. Cooper was a major player in passing the Social Security Act, and he was influential in excluding agricultural and domestic workers—groups disproportionately represented by Black Americans.Footnote 236 Hoover and Cummings managed to cultivate this kind of support without compromising the strength of their leadership within the Democratic Party in both the North and the South. In this way, Hoover and Cummings leveraged the war on crime to nationalize this issue and create a “long coalition” that endured for decades.
Schickler argues that modern political factions stem from early debates surrounding the future of the New Deal.”Footnote 237 I contend that modern law enforcement—and the coalition that has persistently built it—had its roots in the same early years precisely by resisting the underlying political realignment that Schickler describes. Even Black Americans in the Justice Department in positions of power went unheard. Robert Vann, a key player in Schickler's account, was a Black political entrepreneur who helped bring Black voters into the New Deal coalition. He was rewarded with a position in the Justice Department under Cummings. But the story did not end well. Frustrated with his lack of power and unable even to get Cummings to meet with him, Vann resigned and returned to the Pittsburgh Courier. To forge such a powerful and bipartisan coalition, Cummings and Hoover needed to abide by the terms of an implicit agreement—one that involved not protecting Black Americans or including them in the formation of federal policing.Footnote 238 The politics of consensus prevailed in the war on crime, but it tragically excluded the group most under threat of violence. This crime coalition would endure in the decades to come.
5. THE PATH NOT TAKEN: DIFFERENT STATE, DIFFERENT LOGICS, DIFFERENT COALITION
In these early years of modern policing, many Black leaders imagined a different world: where the federal government protected Black people from racial violence, where the police functioned to protect the vulnerable, and where this kind of policing played a supporting role for systems that enabled economic equality for Black Americans. Key White politicians saw particular events like the Lindbergh kidnapping or Dillinger's bank robberies as manifestations of flawed systems—systems that allowed for such crimes to be carried out with impunity. Hoover and Cummings organized their campaigns around these particular cases and tied them to systemic changes. Some Black civil rights organizations tried to do the same, with reference to a different set of precipitating events and a different set of systemic failures. White bureaucrats leveraged the Lindbergh kidnapping, the Kansas City Massacre, and gangsters like John Dillinger. Black leaders highlighted the lynching of Claude Neal, the Scottsboro trials, and urban violence against Black residents in 1935 and 1943. Black communities mobilized around the latter events to call for radical change. Black civil rights organizations, leaders, and communities differed in the issues they emphasized and how they sought to pursue change.Footnote 239 Debates persisted within and across organizations, and this included debate related to policing and the criminal legal system. This section highlights major events that catalyzed Black movements for justice. While a diversity of responses remained, these cases generated mass action and calls for justice, and this section highlights some of the major themes from these efforts.
After the lynching of Claude Neal, Black leaders called on the government to protect the most vulnerable from racial violence.Footnote 240 FDR had publicly denounced lynchings with words, but he repeatedly failed to act in meaningful ways to stop them. The antilynching campaign had endured for decades, and Claude Neal's lynching revealed again the unwillingness of the federal government to extend protection to Black Americans, even when they were sanctioned to do so. In a scathing Crisis article in October 1935, Walter White called Cummings's department the “U.S. Department of (White) Justice.” He detailed the systematic neglect exhibited by the department during this time:
The Department of Justice in Washington may lay claim to a 100 per cent performance in at least one branch of its activities—the evasion of cases involving burning questions of Negro rights. It side-stepped the issue of the exclusion of Negroes from southern elections on the ground that it was loaded with political dynamite.… On the lynching issue the department has set a new record for its ability to dodge from one excuse to another.… The attorney general continues his offensive against crime—except crimes involving the deprivation of life and liberty and citizenship to Negroes.Footnote 241
Walter White believed that the failure of the Justice Department exhibited far more than a failure in the matter of lynching. For him and the rest of the Black community, this issue symbolized an intrinsic problem of the criminal justice system: It was not designed to protect Black people.Footnote 242 The system needed to be reordered so that it would protect against racial violence. By refusing to innovate in the worst of cases, FDR, Cummings, and Hoover precluded the option of Black leaders helping to design the emergent law enforcement system so that it would protect Black lives.Footnote 243
In the Scottsboro trials, many activists cried out against the lack of legal rights given to Black people, and they critiqued the criminalization of Black people that enabled such miscarriages of justice and “legal lynchings.”Footnote 244 As Niedermeier argues, racial violence adapted as lynchings decreased in number and lost public approval. The criminal justice system itself was way to exact racial domination, making extrajudicial mob violence less necessary for maintenance of White supremacy.Footnote 245 Many protests pointed to the Scottsboro case and other high-profile cases as flagrant examples of systemic injustice in American policing and courts. The NAACP botched its handling of the Scottsboro cases, and it lost some of the opportunity to rally behind this as pathway to change.Footnote 246 This served to exacerbate divisions between moderate and radical civil rights organizations. In the shadow of the Scottsboro cases, the NAACP launched its campaign on the criminal justice system when Henry Shields, Arthur Ellington, and Ed Brown were tortured to produce confessions and placed on death row.Footnote 247 They eventually won in the U.S. Supreme Court and had their convictions reversed, with the Court declaring that it “would be difficult to conceive of methods more revolting to the sense of justice than those taken to procure the confessions of these petitioners.”Footnote 248
Some Black leaders leveraged this victory and the Scottsboro court victories to pursue further cases and litigation in the following years. Through it all, the Scottsboro cases remained an archetypal example of a miscarriage of justice.Footnote 249 As activists protested in these cases, they also did so with the realization that this series of events indicted the American system as a whole. Archives show that FDR worked behind the scenes in 1938 to urge the Alabama governor to work for the release of the still-captive Scottsboro Boys. But he was unwilling to take a public stand against the systemic injustice the case revealed.Footnote 250 Protests were often met with even more hostility and compounding injustice. In one such example, a peaceful Scottsboro demonstration in New York ended with another example of police violence. The New York Amsterdam reported that protestors and bystanders were “indiscriminately slugged by the police, smoke and tear gas bombs were thrown into the assemblage and the lives of scores of women and children were endangered when the officers drove their automobiles over the curb and up and down the sidewalks.”Footnote 251 Protestors responded by calling on New York City to address its own systemic injustices, brought to the surface by both the Scottsboro trials and the brutal response of the City of New York Police Department (NYPD) to protests.
These protests were not isolated incidents. They commanded the attention of Black Americans and catalyzed movements for systemic change. This stood in stark contrast to White priorities. To understand the differences, I analyzed Black and White newspapers during this era in three major cities (New York, Chicago, and Pittsburgh) to see the differences in how they covered these potentially catalyzing events—both the ones leveraged by the Justice Department and those identified by Black activists (Figure 6). The Lindbergh kidnapping and John Dillinger appeared in the White newspapers seven times more often than did the Scottsboro Boys or the Claude Neal lynching. In Black newspapers in these same cities, the Scottsboro Boys and Claude Neal lynching were covered thirteen times more than the Lindbergh kidnapping or John Dillinger.Footnote 252
News Coverage in the 1930s. Sources: This is based on a search of six newspapers from 1930 to 1939 using the ProQuest newspaper database. The White newspapers were the New York Times, Chicago Tribune, and Pittsburgh Post-Gazette. The Black newspapers were the New York Amsterdam, The Chicago Defender, and the Pittsburgh Courier. The Lindbergh/Dillinger numbers were generated based on searches for articles in both sets of newspapers containing “Lindbergh” plus “kidnap*” or “Dillinger,” narrowing it to document types that only include articles (both news articles and editorials). The Scottsboro/Claude Neal numbers were generated based on searches for articles in both sets of newspapers containing “Scottsboro” or “Claude Neal,” narrowing it to documents types that only include articles (both news articles and editorials).

While governmental authorities intentionally turned their backs in the cases of Claude Neal and the Scottsboro Boys, the final catalyzing moment provoked major responses from all parties involved. In the aftermath of the Harlem uprising in 1935, the committee appointed by the mayor called for protection from police brutality, combined with better access to jobs, education, and housing.Footnote 253 Their initial report—rejected by the Mayor La Guardia because of its radical tone—made a clear declaration:
The blame belongs to a society that tolerates inadequate and often wretched housing, inadequate and inefficient schools and other public facilities, unemployment, unduly high rents, the lack of recreation grounds, discrimination in industry and public utilities against colored people, brutality and lack of courtesy of the police. As long as these conditions remain, the public order [cannot] and will not be safe.Footnote 254
Black newspapers, civil rights organizations, and churches repeated these calls and organized campaigns around them. Instead of addressing racial inequalities after the Harlem uprising in 1935, governmental policy encouraged these inequalities to grow. Black people were excluded from many New Deal programs that provided economic opportunity and relief.Footnote 255 The Home Owners’ Loan Corporation systematically denied loans to Black neighborhoods.Footnote 256 Black people fleeing the racial violence of the South were largely confined to “densely packed, rundown, and overpriced housing.”Footnote 257 Educational segregation continued unabated.Footnote 258 Police capacity grew, and police brutality persisted without meaningful changes or accountability, despite modest efforts under Cummings's successor.Footnote 259
The time bomb of systemic racism exploded again in 1943, with racial conflicts and uprisings spreading across the country. The most lethal conflict happened in Detroit. At one point, a mob of over ten thousand White rioters swept through the city, even as the “police behaved like partisans in a race war.”Footnote 260 Seventeen Black people were killed by police, without a single White casualty at the hands of the police.Footnote 261 The Detroit police commissioner and Hoover both claimed that Detroit needed more police to quell such situations.Footnote 262 Among his recommendations to FDR, Attorney General Francis Biddle suggested enhancing measures for sending in troops more swiftly and deferring to local police. He even suggested that “careful consideration be given to limiting, and in some instances putting an end to, Negro migrations into communities which cannot absorb them.”Footnote 263 But some Black leaders urged FDR to consider vastly different solutions. Walter White and Thurgood Marshall wrote an extensive report of the causes of the Detroit Riot and how it unfolded.Footnote 264 They identified several key factors: widespread racism in the city, in part driven by KKK activity and White immigrants from the Deep South; discrimination in jobs, including strikes by White laborers refusing to work with Black employees; segregation and discrimination in the armed forces; residential segregation and lack of adequate housing for Black communities; racism in the police; and racial animosity fomented by the press.Footnote 265 They recommended a complete federal investigation of the police department, increased recreational and civic opportunities for Black youth, more Black representation and power in the educational system, racial integration of neighborhoods, education focused on race in the schools, a vigorous antiracism campaign, affordable housing, interracial labor organizing that includes working against racism, and reparations for the loss of life and property. They sent their report to the president with a special memo summarizing their findings.Footnote 266 As Carl Suddler describes, the response of Black activists after the Harlem uprising of 1943 echoed similar themes, including a demand that Mayor La Guardia “call upon the President to issue a national proclamation abolishing segregation, discrimination and Jim Crowism in the armed forces and throughout the government.”Footnote 267 For Roy Wilkins, the uprising was caused by “the boiling over of pent-up resentment in the breasts of millions of American Negroes all over this country.”Footnote 268
Civil rights activist Pauli Murray struck a similar tone in a long letter about the Detroit Riot to FDR's secretary, Marvin H. McIntyre, the message of which was to be passed along to the president himself.Footnote 269 Murray too highlighted the deep-seated racism that provoked the racial conflict. She pointed to “two diametrically opposed forces at work”: (1) “a determination on the part of Negroes not to continue acceptance of the degradation of second-class citizenship” and (2) “an equally determined feeling of a minority of whites … that the Negro must stay in an inferior social and economic position.”Footnote 270 Understanding the political situation, Murray urged FDR to reject continued partnership with the Southern bloc and form a new party that included “minority and labor groups” and “socialist groupings.”Footnote 271 She also urged him to bring together a commission focused on a thorough study of race in America, with the aim of “drawing up a legislative program.”Footnote 272 In contrast to Biddle's desire to curtail the Great Migration, Murray urged FDR to consider offering “to evacuate Negro families from lynch-mob areas.”Footnote 273 While Biddle wanted to keep Black people in the South, Murray wanted the government to treat them like refugees, like victims of trauma and oppression in need of evacuation and resources for resettlement. She also excoriated FDR for his half-hearted response with a poem that she published in The Crisis and sent to Eleanor Roosevelt prior to publication, which is printed at the beginning of this article.Footnote 274
Put together, these three categories of events catalyzed Black social movements that advocated for a different way of policing entirely. Cummings and Hoover built professionalized systems designed to launch wars on crime against public enemies, and they simultaneously neglected Black lives and reified notions of Black criminality in the process. Many Black leaders and organizations called for a federal program that would focus on holding local police accountable and ensuring that Black communities would receive protection from racial violence—chiefly at the hands of the police and the criminal justice system itself. Continuing in the tradition of Ida Wells, who had long preached the importance of telling the full truth of America's racial violence, Black leaders called for a federal program that seriously addressed the legacy of slavery, the racial violence of lynching, and the oppression of Jim Crow.Footnote 275 Many also called for the decentering of the police by emphasizing attention to the root causes of racial conflict and crime: poverty, racism, and inequality.Footnote 276 Indeed, while Hoover called for more police after the Detroit riot in 1943, Black leaders like Walter White, Thurgood Marshall, and Pauli Murray recommended campaigns and commissions that would lead antiracist efforts and tear down structures of systemic inequality; they called for the building of housing and the extension of equal educational and economic opportunity to Black communities; and they called for the police to be thoroughly investigated and for Black communities to be involved in reshaping how police operated. White leaders like FDR and Cummings intentionally refused to respond to the events that could have catalyzed such changes, or they responded with completely different solutions to the same events, as in the aftermath of 1943.
History would only repeat this pattern. These catalyzing moments—Claude Neal's lynching and the Scottsboro Boys’ fight for justice—foreshadowed future violence toward Black people, ranging from Emmett Till to the Groveland Four to Rodney King to the Central Park Five to George Floyd. The Harlem Report of 1935 and the NAACP's Detroit report of 1943 foreshadowed future reports that said virtually the same things. Kenneth Clark testified before the Kerner Commission after the 1960s uprisings: “I read the report of the 1919 riot in Chicago, and it is as if I were reading the report of the investigating committee of the Harlem riot of 1935, the report of the investigating committee of the Harlem riot of 1943, the report of the McCone Commission on the Watts riot [1965].”Footnote 277 As he read these reports, he found the “same analysis, the same recommendations, and the same inaction.”Footnote 278 Changing course became harder over time. With each passing instance, Hoover and his collaborators had their way with increasing intensity: more police, more wars on crime.Footnote 279 Despite the hard-fought victories achieved by activists—curbing the era of mass lynchings (despite a lack of legislation) and securing important Supreme Court victories—their efforts were consistently limited by Cummings and Hoover in the rebuilding of federal responses to crime and racial violence and inequality.
6. ENDURING LEGACY
The FDR administration waged a war on crime, instilled institutional and racial logics, and induced an issue realignment. In so doing, they built the modern law enforcement system. These leaders identified the space opened up by Prohibition's repeal, and they manufactured a truly modern law enforcement system that used scientific precision, professional standards, advanced training, and specialized recruitment.Footnote 280 Racial violence and inequality were virtually ignored, left largely to the economic aspects of the New Deal, which themselves often excluded Black people from receiving this support.Footnote 281 Professional systems were designed in accordance with a method of law enforcement that focused almost solely on public enemies. Law enforcement was trained in a script that identified enemies, publicized and villainized them, gained support from lawmakers, and implemented professional investigations based on the overwhelming use of force. These logics were passed onto state and local law enforcement agencies.
6.1. Diffusion to State and Local Law Enforcement
If the major developments described above—the ratchet effect, the institutional logics, and the politics of consensus—stopped at the federal level, the influence of this era would be quite constrained, given how much policing happens at the local and state level. But this influence extended far beyond the federal government into every state and local police department in the country. Cummings and Hoover instituted a way of policing that transcended institutional boundaries and that distributed a set of values, norms, and methods to law enforcement agencies. In this section, I will make two basic arguments. First, Hoover and Cummings intentionally and successfully diffused their model to the states and made the FBI the model of American policing. Second, while the South resisted federal accountability in law enforcement, they embraced and incorporated many federal methods of policing.
Hoover and Cummings successfully trained local and state law enforcement to follow their model. The FBI academy began in 1935 and recruited local law enforcement leaders for training—with the intention that they would develop training programs of their own. In an FBI magazine advertising the FBI academy, Hoover laid out their philosophy and national aims:
Our training methods are yours—we welcome their adoption in the law enforcement bodies of the Nation. There is nothing secret about the manner in which the Federal Bureau of Investigation works. Its formula is a simple one—intensive training, highly efficient and carefully investigated personnel, rigid requirements in education, conduct, intelligence, ability to concentrate, alertness, zeal, and loyalty, plus careful schooling in which we do our utmost to make every man to a degree self-sufficient. He must be a good marksman and have the courage to shoot it out with the most venomous of public enemies.Footnote 282
Because of their ability to network and build institutions, Hoover and Cummings were able to disseminate methods that became central to the American system. They measured success based on how many they trained, the leadership of those they trained, and the size of the organizations they would lead. In their training handbooks, they highlighted every possible aspect of weaponry, physical fitness, investigative prowess, and scientific sophistication, but they failed to address working with communities or addressing racialized violence.Footnote 283 The FBI promised that they would be pleased “to assist in preparing a program of training and [would] assign instructors to aid in any courses for which such services may be requested.”Footnote 284 Hoover claimed before Congress in 1938 that they had trained police officials responsible for a total personnel of 68,283 people, and he further claimed in 1949 that 26.5 percent of graduates went on to become heads of police departments.Footnote 285 By the end of FDR's administration, a resolution was presented to Hoover, honoring him for “his foresight in establishing the FBI National Police Academy,” which “has been instrumental in raising the standards of law enforcement throughout the United States.”Footnote 286 In a letter, FDR told Hoover, “You have trained the teachers who have carried the benefits of their training to more than one hundred thousand American police officers.”Footnote 287
The FBI became the ultimate model of policing. In an industry characterized by trend-setting and emulation, Hoover was the leader of the pack. Max Felker-Kantor describes how the Los Angeles Police Department (LAPD) also became a departmental trendsetter under the leadership of William Parker. Felker-Kantor notes that “the LAPD became the most emulated department in the country, and observers often referred to him as the ‘second most respected’ law enforcement officer in the nation after the FBI's Hoover.”Footnote 288 This comment provides an interesting implication—that Hoover was the most respected law enforcement officer in the nation. He leveraged this position to create a standard for policing and train law enforcement leaders around the country. He also created centralized systems—statistical and fingerprinting clearinghouses, laboratories, and specialized training—which served “to bind state and local police forces to an ever-growing set of dependencies.”Footnote 289
Aside from offering training and creating this “ever-growing set of dependencies,” the FBI also encouraged local police to launch wars on crime of their own. Cummings rallied local leaders to support the war on crime. A news article in the New York Times said, “A civic war on crime, in which general enlistment of the American people will be sought, will be formally declared and a mass offensive will be planned at a three-day conference called to open here Thursday.”Footnote 290 They wanted to create a federal program, but they were more interested in setting off a war in which state and local leaders would be leaders in the fray. In New York, Thomas Dewey took charge of a war on crime of his own, aided by federal leaders. As a former federal prosecutor, he merged the aims of the federal campaign with his efforts as a local prosecutor. Dewey's work in this war on crime propelled him to national renown, such that he became a frequent name in presidential conversations by the 1940 election, eventually running in both 1944 and 1948 as the Republican nominee. Almost all of the growth in the incarceration rate in this period in the Northeast stemmed from growth in New York.
New York was not alone. Wars on crime were created and recreated around the country. Georgia legislators and police officials launched a statewide war on crime, with the attorney general lamenting how “criminals in Georgia are being coddled too much.”Footnote 291 Texas Governor James Allred launched a statewide war on crime, and after the campaign, one observer proclaimed that the expanded state police “ranks with the best in the United States and holds a high rating with the [F]ederal [B]ureau of [I]nvestigation, the famed G-men.”Footnote 292 Missouri Governor Lloyd C. Stark promised residents that the war on crime would be a priority in the state, assuring them that the attorney general had offered the full support of the federal government.Footnote 293 Statewide efforts are evident in the growth of state police agencies and highway patrols, as over half of state police agencies were started in the 1930s.Footnote 294 Cities like Atlanta and Miami also launched wars on crime.Footnote 295 Phoenix police adapted the scientific practices of the FBI to wage a “ceaseless war on crime.”Footnote 296 Even smaller cities like St. Petersburg mimicked the campaign, with one commentator extolling the two-way radio as “the most effective weapon science has produced recently in the constant war on crime.”Footnote 297 Moreover, in early efforts against narcotics, Cummings said, “Federal Government alone cannot reach this menace, uniform legislation is vitally necessary.” He pressed states to all work together against drugs, and most states did so.Footnote 298
As many scholars of local police have demonstrated, the infrastructure of local police had been significantly built by the time Cummings and Hoover launched their war on crime and established their training school. Many departments would have continued to do so, even without the FBI's training and model. But the FBI systematized a new professional model of policing, elevated the use of force and weapons, and lent valuable training and tools. Black civil rights leaders had called on the federal government to restrain local police and protect Black communities from racial violence. Instead, they were accelerating professionalization, providing weapons, and doing little to provide accountability. At one point, leaders in the Justice Department discussed forming a national police force, but they ended up putting their efforts toward equipping local departments. Thus, they affirmed local control and customs, while also providing them with further training and resources. This mirrors other ways that local discretion was utilized to create racially disparate treatment during the New Deal.Footnote 299 Moreover, the FBI won legitimacy for the new professional model of policing, and they gave local police forces a playbook and template for winning legitimacy in their own jurisdictions. In this way, the FBI amplified local police authority without providing the accountability that Black civil rights leaders called for, and this enabled even greater local abuses of police power.
While the FBI won legitimacy rather quickly in the 1930s, it would take some time for local police forces to follow suit. In a 1939 poll, 81 percent of respondents said they thought Hoover had done an excellent or good job leading the FBI.Footnote 300 At the same time, another poll in the same year asked, “Do you think our government should or should not: Provide police and fire departments.” Only 37 percent of respondents answered that the government should provide police and fire departments, while 52 percent said they should not.Footnote 301 Simon Balto points out that “well into the 1950s, police forces in America were not especially well esteemed.”Footnote 302 By the mid-1960s, this had changed. In a poll asking about how much respect respondents had for police in their area, 71 percent said they had a great deal, and another 22 percent said they had some.Footnote 303 Thus, by the time the war on crime of the 1960s came around, police had secured a newly won legitimacy, in part because of the war on crime in 1930s and the model of policing that emerged from it.
The effects of both federal and local growth in policing can be seen in the incarceration rate over time. While many scholars rightly note that the incarceration rate remained mostly flat until the prison boom beginning in the 1970s, one previous increase remains overlooked: the large growth during the 1930s (Figure 7). The incarceration rate stayed between 100 and 110 per 100,000 people between 1930 and 1934. But in the five years before the end of the decade, the incarceration rate rose to 137 per 100,000. This rise of more than 30 percent would be the only such increase before the prison boom that began more than thirty years later, and the incarceration rate in 1939 would be the highest until the nation surpassed that mark in 1980. The war on crime in the 1930s was not a sufficient condition to sustain continual growth in the prison system, as the incarceration rates flattened for the thirty years that followed. But it was necessary to facilitate what happened starting in the 1960s to build the system of mass incarceration that we have today.
Incarceration Rates, 1925–1950. Sources: Raw incarceration rates in each state were drawn from Patrick A. Langan, John V. Fundis, Lawrence A. Greenfield, and Victoria W. Schneider, “Historical Statistics on Prisoners in State and Federal Institutions, Yearend 1925–86” (report NCJ-111098, Bureau of Justice Statistics, National Institute of Justice, U.S. Department of Justice, Washington, DC, 1988). Population data were drawn from census data in 1920, 1930, 1940, and 1950. For each state, in years between census data, the difference in the population was taken, and an even slope was created between each census. For instance, if Michigan had a population increased of 10,000 from 1920 to 1930, it was reflected in a population change of 1,000 per year across that period. Then I calculated the number of people incarcerated in each region per year per 100,000 people in that state (the conventional measure of incarceration rates).

In all of this, however, growth was not evenly distributed. The region most resistant to federal accountability was the one that most embraced federal policing methods. In Figure 8, I present a graph of graduates of the FBI academy from 1935 to 1949, by region. A plurality of the FBI academy graduates came from the South, with roughly 35 percent of the total graduates during this time frame. Police officials from cities like Birmingham and Montgomery populate the list of graduates. Even as they resisted federal involvement in preventing racial violence, Southern police departments embraced the same methods Hoover was developing. Polls from this era show consistent opposition to federal antilynching legislation among southern residents.Footnote 304 This opposition resisted the accountability that such legislation would bring to local police. In a particularly striking example, a poll asked whether respondents favored antilynching legislation, and 72 percent said yes. But when a question in the same poll asked whether they approved a bill in Congress that would “give the federal government power to fine and imprison those police officers who are negligent in protecting a prisoner from a lynch mob,” 47 percent said they disapproved. In other words, when the poll explained what an antilynching bill actually required—accountability of local police—the opposition rose by almost 20 percent.Footnote 305 In contrast, the professionalism, technology, and militarism of the federal police apparatus were easy to adapt to local wants and desires. These weapons and methods would also be used disproportionately against Black people.
FBI Academy Graduates by Region. Source: Directory of Graduates of the FBI National Academy and Officers of the FBI National Academy Associates (Washington, DC: Department of Justice, Federal Bureau of Investigation, 1989). I used this official FBI book of academy graduates to code every graduate listed, their city and state, region, and their graduation class/year. When comparing sums to Hoover's sums, not all are recorded in the FBI handbook (or Hoover exaggerated the number of graduates), but these should be representative of the overall sample. I used U.S. Census data to compare these proportions to the population proportions. The South and West are overrepresented in the FBI academy graduates, with more graduates per capita than the Northeast or Midwest. Roughly 10 percent of the data was illegible, but it is safe to assume these missing data were missing at random, given that they were based solely on the location on the page (usually along the fold of the right page) and spread across hundreds of pages (so no single letter or kind of name made up a large chunk of the missing data).

This national rise in incarceration had three primary sources: the federal government itself, New York, and the South. At the beginning of the 1930s, the South had incarceration rates below that of the West and Midwest. But by 1939, the South had the highest incarceration rates in the nation. While the government did not maintain the records of the race of those who were incarcerated, they did collect data on the race of those who were admitted to state and federal prisons. The incarceration rates lag closely behind the admission figures, so we can roughly infer the proportional changes in incarceration from the admission figures. The disparities are likely higher for incarceration rates than admission rates, since Black people spent more time in prison on average than non-Black people (Figures 9 and 10).Footnote 306 As expected, the overall admission rate rose during the war on crime, dipping on either end while cresting in 1935 and again in 1937. But the racial breakdown offers another telling story: The admission rate for Black people remained steady and high throughout this period, while the admission rate for non-Black people declined consistently. At the height of the 1930s, Black people were at least four times more likely to be imprisoned. In 1936, Black people represented roughly 49 percent of the prison admissions in the South, while only accounting for 24 percent of the population in the region. In his account of race in America, Gunnar Myrdal said, “The average Southern policeman is a promoted poor white with a legal sanction to use a weapon. His social heritage has taught him to despise the Negroes, and he has had little education which could have changed him.”Footnote 307 Allison Davis, Burleigh Gardner, and Mary Gardner spent years embedded in a southern town to study the social system of the Deep South. They concluded that the racial caste system proved to be the “the fundamental division” in the town they studied: This system dictated the unequal distribution of “all privileges and opportunities, as well as duties and obligations.”Footnote 308 The police served an important role in maintaining this hierarchy. Police officers were “firmly convinced of the Negro's inherent inferiority, of his lack of control, of his proneness to lie and steal.”Footnote 309 This caste system fused with a rejection of federal policing authority and an incorporation of federal methods.
Non-Black Prison Admission Rates, 1929–1946. Sources: No incarceration numbers exist for inmates based on race, but the admissions were reported and published with data on race. Admission data came from two separate sources. Most of the data came from Bureau of Justice Statistics, “Race of Prisoners Admitted to State and Federal Institutions” (Washington, DC: Department of Justice, 1991), and Bureau of the Census, Prisoners in State and Federal Prisons and Reformatories, 1929–1948 (Washington, DC: Government Printing Office). Census data were used in the same way as were the incarceration figures to calculate rates per 100,000 in each region. See the Appendix for a description of process for improving existing uses of these data by addressing problems of missing data.

Black Prison Admission Rates, 1929–1946. Sources: No incarceration numbers exist for inmates based on race, but the admissions were reported and published with data on race. Admission data came from two separate sources. Most of the data came from Bureau of Justice Statistics, “Race of Prisoners Admitted to State and Federal Institutions” (Washington, DC: Department of Justice, 1991), and Bureau of the Census, Prisoners in State and Federal Prisons and Reformatories, 1929–1948 (Washington, DC: Government Printing Office). Census data were used in the same way as were the incarceration figures to calculate rates per 100,000 in each region. See the Appendix for a description of process for improving existing uses of these data by addressing problems of missing data.

The racial disparities extended beyond the South to other regions. In the national data, Black people were three times more likely than non-Black people in 1929 to be admitted to prison, and this disparity rose by 50 percent by 1945. The disparities in the Northeast were even higher: in 1931, Black people were five times more likely than White people to be admitted to prison, and by 1942, Black people were nine times more likely to be admitted to prison. These two regions drove the growth in incarceration in this era, and their growing racial disparities accounted for much of the growth within these regions.Footnote 310
Thus, we are left with a significant story of race and crime in the 1930s: the United States experienced the largest period of growth in incarceration prior to the era of mass incarceration; most of the growth was centered in the South and the Northeast; and a disproportionate amount of the growth in these regions came from the imprisonment of Black people. The federal war on crime was not publicly racialized in the same way it would be later in the century. John Dillinger, Bonnie and Clyde, Frank Nash, Pretty Boy Floyd, and Alvin Carpis were the public enemies of this war on crime, and they were all White. Those admitted to federal prison in the height of the war on crime were roughly 14 percent Black. But as the crime-fighting apparatus grew, so did the disparities. By 1942, 22 percent of federal prison admissions and 32 percent of total prison admissions were Black. And the development of policing, imprisonment, racial logics, and crime politics was paving the way for even larger movements and racial disparities further down the road. The incarceration surge that peaked in 1939 served as a foreshock to the next time the incarceration rate would reach this height, in 1980—when the full force of the carceral expansion was underway.
6.2. National Redeployment
When the era of gangsters in the 1930s subsided, the war on crime in its original sense—stopping kidnappers and bank robbers who roamed with impunity—became unnecessary. But the institution shifted in response to changing circumstances and applied the warlike procedures to other problems. Problems better suited for other approaches nonetheless met the institutional constraints left by Cummings and Hoover from the 1930s.
Naomi Murakawa describes how, starting in the 1940s, liberals helped build the carceral state, with the original design of providing Black people freedom from violence. However, she argues, these efforts were subject to three main perils. Liberal law and order entrenched “notions of Black criminality,” fueled “neutral state-building” that was easily co-opted for other purposes, and set “a lens for seeing racial violence as correctable with reformed carceral machinery.”Footnote 311 In the narrative I set forth, these developments described by Murakawa all took the 1930s as their starting point; these were all the ratchet effects of these earlier developments. But there exists a tension: In the 1930s, federal law enforcement persistently avoided acting against lynchings, and Murakawa demonstrates how federal policing expanded in the 1940s and beyond by talking about freedom from racial violence like lynching. While the tension may in part remain unresolved, this article highlights the importance of sequence. Even efforts to defend civil rights led to punitive social policies, mostly because law enforcement officials had already built a system with a particular set of tools oriented around war making. One of the major ironies is that Truman's campaign against lynching employed the same basic institutional logics that excluded lynching as a matter of law enforcement concern in the 1930s. Thus, Hoover could brag in 1955 that he had successfully dealt with the problem of lynching, without departing from his institutional priorities that neglected lynching in the 1930s (and without having actually been the cause of the decline in lynchings).Footnote 312 Indeed, high-profile cases of violence neatly fit the paradigm he had developed; he carried out his professionalized model of law enforcement without addressing the underlying structural racism.
In 1955, Hoover illustrated how the war on crime could be redeployed. In the wake of an embarrassing run-in with the Mafia, Hoover tried to regain some lost popularity by rehashing a form of the FBI's “Ten Most Wanted List.” Except in this case, he demanded that every field office identify and prosecute their area's “Top Ten Hoodlums”: “Coming up with ten targets was simple for agents in New York, Chicago, Philadelphia, and other big cities. But bureaus in states where Cosa Nostra had never ventured … complied with Hoover's commands by apprehending petty criminals and juvenile delinquents.”Footnote 313 As would be the case in most future crime campaigns, law enforcement “democratized” the “public enemy” moniker by applying to the masses what was once reserved for the oligarchy of criminals typified by John Dillinger. Wars on crime became the modus operandi for all criminals by default.Footnote 314 Just like the feverish and perpetual wars described by Augustine and articulated in the literature on state formation, law enforcement consistently redeployed public campaigns fashioned to approximate war.Footnote 315
This all led to more straightforward redeployment of the entire war on crime script in the 1960s and 1970s and beyond. The war on crime in the 1960s brought together the same coalition of groups—social liberals like Lyndon Johnson and law-and-order conservatives like the still-trucking Hoover—wrought by the issue realignment of the 1930s.Footnote 316 As Elizabeth Hinton notes, “Across political and ideological lines, federal policymakers shared a set of assumptions about African Americans, poverty, and crime that in time became a causal and consensus-building force in the domestic urban policy following civil rights legislation.”Footnote 317 As Cummings and Hoover foreshadowed, “The rise of punitive federal policy over the last fifty years is a thoroughly bipartisan story.”Footnote 318 These coalitions and assumptions were largely formed in the 1930s, but they progressed and advanced in the unique context of the Great Society and civil rights movement. The war on Black poverty was ready fodder for war on crime imagery.Footnote 319 Black people became increasingly criminalized, feeding a system that converted people into criminals and villains. The FBI carried out even more systematic surveillance of Black leaders through COINTELPRO. Vesla Weaver argues that the late 1960s exhibited a pattern of “frontlash”—in which “formerly defeated groups may become dominant issue entrepreneurs in light of the development of a new issue campaign.”Footnote 320 In this case, those defeated by the advancements of civil rights redefined “ghetto revolts” and “racial disorder” as a “crime problem, which helped shift debate from social reform to punishment.”Footnote 321 These issue entrepreneurs brought together suspicion of Black people with the old script of the war on crime, applying a law enforcement system built to execute such a war.Footnote 322 In 1933, John Dillinger was public enemy number one, with Cummings proclaiming, “The gangster is not a hero but a public enemy.”Footnote 323 In 1965, the national press “presented black youth as ‘public enemy no.1’.”Footnote 324 This new era reconstituted the war on crime and took it to new levels. This pattern continued into the 1970s and 1980s and beyond.Footnote 325
7. Conclusion: Wars to Come
As the war on crime of the FDR era reached its height in 1934, other wars were gathering strength at the root, readying to sprout, cultivated in part by the same insidious forces of racism that shaped this particular law enforcement campaign. In the month after FDR signed the omnibus crime bill of 1934, German leaders met on the other side of the Atlantic to discuss America's system of racial hierarchy and apply its sinister designs in their own country.Footnote 326 Dietrich Bonhoeffer, a German theologian, watched in horror as the German church literally and figuratively cloaked the cross in the swastika. A few years earlier, Bonhoeffer had come to America and seen the “terrible miscarriage of justice” of the Scottsboro Boys and described the racial system in America as “darker than [a] thousand midnights.”Footnote 327 The festering developments in Germany foreshadowed the coming of World War II. Meanwhile, the developments in America during this war on crime created durable systems and inspired future wars on crime, disproportionately carried out against Black people.
But that was not all that remained from this decade in the wars to come. While Bonhoeffer was in America, he had spent time among the people of Abyssinian Baptist Church in Harlem. Here he witnessed the joy and sorrow of God in songs and preaching that sustained people in the fight against oppression. He was inspired to oppose the Nazi regime by the Black church in Harlem and their resistance to racist laws and customs in America. This resistance would cost Bonhoeffer his life during World War II. In America, these songs and acts of resistance rung out from the church walls of Harlem in the 1930s, joined the chorus of activists on city streets and in churches across the country, and echoed into ensuing decades as future generations in the long civil rights movement struggled against the wars on crime yet to be waged.Footnote 328
Appendix Methodological Note on Prison Admissions Data
In general, the Bureau of Justice Statistics (BJS) publication listed the prison admission for the federal government as well as each state by year. However, there were significant amounts of missing data. In particular, the state-by-state (and region-by-region) data were missing entirely from 1937 to 1941. Most likely as a result of this, previous scholars have not used state or regional data. Previous publications have reported the national statistics, most importantly in the National Research Council report.Footnote 329
But the national data reflect some missing data as well. Several states also were missing data in certain years—and, often times, states with significant numbers of prison admissions and large racial disparities. The most common states without data reported were Mississippi, Alabama, and Georgia. To address this, I complemented BJS data with information from the Bureau of the Census (1929–1948).Footnote 330 Using these two sources, I manually input data for the total admission and racial breakdown of prison admissions in each year during this time frame. The census data (the second data source, used for the years 1937 to 1941) only included state-by-state data on prison admissions by race for male admits. Since male admits accounted for about 96 percent of prison admissions during these years, I upweighted these data by 4 percent. This assumes that the disparities were similar for men and women—an assumption that seems to be reflected in other data sources. This fills in the state and regional data for the years missing in the BJS data, 1937 to 1941.
We are still left with the problem of state-by-state missing data. After combining these two data sources, approximately 4.2 percent of possible state-years are missing, mostly concentrated in Mississippi, Alabama, and Georgia. Instead of merely omitting the data, I created a model to estimate the admissions rates in these states in the missing years. To do this, I utilized the incarceration data in each state per year during this time to estimate the relationship between incarceration numbers and admissions numbers. I used the mice package in R. The package employs multivariate imputation via chained equations to impute missing data. This package constructs a linear regression model using other variables to predict the missing data. I created lagging variables for incarceration rates in each of the four years after admissions for each prison admissions total in each state in each year. The mice package then used all the data on incarceration and admission in each state and year during this period to construct the model of the relationship between prison admissions and incarceration rates in the following years. This model was then executed to impute the missing admissions data.
Then, to impute the missing breakdown by race for these 4.2 percent of cases (N = 52 out of 1,248 possible state-years), I used each year for which the state did have data as a benchmark. Thankfully, each state had at least one year during this time frame for which it did have admissions data by race. Then, after identifying the gaps in years for these states, I calculated the trends of the admissions numbers between these years in other similar states. Then, using these slopes and trends, I adjusted the benchmarked data using the trends in these other states. Thus, the data are benchmarked by data within the state and not driven by absolute numbers in other states. Only the trends in other states adjust the imputed data.
To calculate rates, I utilized census data to derive the number of admissions for Black people and non-Black people per 100,000, then to determine the figures for disparities in the admissions rates for Black people compared to the admissions rates for non-Black people.
While this method certainly cannot perfectly impute the actual admissions numbers, it does improve our understanding of the data. It does a dramatically better job of reflecting the actual data than simply omitting the missing data entirely and reporting the incomplete data as if representing the whole. Moreover, the imputed data rely on the relationship between admissions numbers and incarceration numbers—a direct relationship with a very high degree of correlation. The model utilizes all the existing data—nearly 96 percent of the possible data—to construct a model for how these two variables relate, then fills in the admissions data using the one incarceration rate as the input. Then, since we do have some racial breakdowns in each state, these benchmarks are taking seriously interstate variation in absolute differences, while utilizing trend data to adjust accordingly for changes over time. Note that the data including the imputed data demonstrate similar trends as the data before the missing data were imputed. The trends of admission rates and racial disparities are slightly amplified, but the changes are relatively small. The overall disparities are similar in both cases. This can be attributed to a relatively small percentage of missing data—and the significance of the disparities.
This process generates two important improvements on the data. First, it increases accuracy by imputing reasonable estimates of missing data, using data within each of the states that have an extremely direct correlation with prison admission. Second, it allows us to use state-by-state and region-by-region analyses. Previously, the missing data prevented such an analysis. Now, we can examine these comparative data with reasonable confidence.