Introduction
The black scented rice of Manipur, locally known as Chakhao is particularly famous for its mild nutty taste and a special aroma. It literally translates as Chak-rice and hao-delicious. Chakhao has black colour outer bran layer but once cooked, it usually turns into regal purple hue. This dark colour is due to high concentration of anthocyanin, flavonoids that perform as antioxidants which prevent oxidative stress in the body (Wongwichai et al., Reference Wongwichai, Teeyakasem, Pruksakorn, Kongtawelert and Pothacharoen2019; Kongthitilerd et al., Reference Kongthitilerd, Suantawee, Cheng, Thilavech, Marnpae and Adisakwattana2020; Palungwachira et al., Reference Palungwachira, Tancharoen, Dararat and Nararatwanchai2020). It is highly glutinous and stickier than regular white rice or brown rice due to lower amylose content (Devi and Badwaik, Reference Devi and Badwaik2022). It is free of gluten. Black rice is actually an heirloom rice with long history of cultivation and has been consumed in different Southeast Asian Countries such as China, Indonesia, Thailand, Philippines, Japan including India, mainly the Northeast region of the country. It is also known with different names such as purple rice, forbidden rice, heaven rice, imperial rice, king’s rice and prized rice (Saha et al., Reference Saha, Vijayakumar, Saha, Mahapatra, Kumar and Sundaram2022; Sharma et al., Reference Sharma, Sandal and Sayyed2024). Historically, black rice is considered as royal delicacy and is forbidden for cultivation/storage/consumption by common people, thus the name forbidden or imperial rice. There are over 200 types of black rice varieties in the world with India contributing around 30 number of accessions (Pratiwi and Purwestri, Reference Pratiwi and Purwestri2017; Biswas, Reference Biswas2018). There are many cultivars of Chakhao cultivated in Manipur. These cultivars have been developed and traditionally improved through long term artificial selection imposed by farmers for over hundreds or thousands of years.
Chakhao has an incredibly rich history and a significant role in socio-cultural practices associated with indigenous Meitei community of Manipur since time immemorial (Singh et al., Reference Singh, Yaipharembi, Huidrom, Devi, Rai and Mishra2022; Devi et al., Reference Devi, Devi, Lourembam and Singh2023). It is believed that Meitei brought and introduced it when they first settled on this land, possibly since 400 BC, with its special aroma and flavour owing to the soil condition and pristine environment of Manipur (Devi et al., Reference Devi, Shijagurumayum and Singh2021). This rice is used for ceremonial purposes and community feast as a delicacy. Chakhao has been used by the traditional medical practitioners as an efficacious medicine to cure various illnesses. It is believed that Meitei brought along Chakhao and introduced it when they first settled on this land, Manipur. Black rice, Chakhao has been cultivated over millennia, with its special aroma and flavour owing to the soil condition and pristine environment of Manipur (Sanajaoba, Reference Sanajaoba1988).
However, in recent times, there is a growing interest on Chakhao, with its gaining status for its health benefits and medicinal values in western and developed countries. The American Health Association, American Cancer Society and the 2005 Dietary Guidelines for Americans recommended an increase in the consumption of black rice to prevent heart disease and certain kinds of cancers (USA Rice Federation 2008). The U.S. Food and Drug Administration (FDA) has acknowledged black rice as a nutritious whole grain that may contribute to lowering the risk of various diseases. Its inclusion in the Segen’s Medical Dictionary (2012) as ‘A strain of rice that has currency as both a food and medicine. It owes its dark colour to the high concentration of anthocyanin, which are potent antioxidants. It is regarded as a ‘superfood’ that may lower the risk of cancer due to its high concentrations of fibre, B vitamins, niacin, vitamin E, calcium, magnesium, iron and zinc’, reflects its importance.
Chakhao is still a niche rice product from Manipur and has begun to be cultivated on a small commercial scale. With its rising popularity and potential for trade, this indigenous superfood, renowned for its unique qualities tied to its geographical origin, necessitates preservation efforts. For these reasons, Chakhao has been successfully conferred Geographical Indication (GI) tag registering it under GI No. 602 in the Geographical Indication Registry (https://search.ipindia.gov.in/GIRPublic/Application/Details/602). DUS (Distinctiveness, Uniformity and Stability) characterization of crop landraces documents their genetic diversity. This enables the effective conservation of genetic resources and the identification of lines with valuable traits, facilitating their full potential in breeding improvement programs (Singh et al., Reference Singh, Gampala, Singh and Chakraborti2015; Lezzi et al., Reference Lezzi, Stagnati, Madormo, Chabloz, Lanubile, Letey, Marocco, Bassignana and Busconi2023). And as morphological traits alone are insufficient for comprehensive diversity assessment due to environmental influences, and inability to detect latent genetic variations, molecular markers were also integrated in the study (Govindaraj et al., Reference Govindaraj, Vetriventhan and Srinivasan2015; Dar et al., Reference Dar, Mahajan and Sharma2019). A total of forty-six DUS parameters, biochemical (specifically amylose and anthocyanin content), GI attributable grain qualities and 126 molecular markers were evaluated. This would achieve a comprehensive understanding of the genetic resources specifically within the targeted 22 economically important genotypes/ landraces of black-coloured Chakhao and identify superior genotypes that could serve as valuable resources for the genetic improvement of Chakhao rice.
Methods and materials
Plant materials
The study consisted of a total 22 local black scented Chakhao landraces collected from 8 districts of Manipur (Supplementary Table S1) and maintained at ICAR RC NEHR Manipur Centre, Lamphelpat, Manipur.
Characterization of morphological traits
Morphological observations were carried out in 5 randomly selected plants for each lines. Forty-six DUS characters were recorded as per DUS descriptors of PPV & FRA, 2007 (Fig. 1). The landraces were cultivated in kharif, 2023 and 2024 in the Lamphelpat Research Farm of ICAR RC NEHR Manipur Centre, Imphal, India. The experiment was laid out in Randomized Block Design with three replications with plant population of 60 plants per plot with spacing 20 × 15 cm. The recorded DUS traits were listed in Supplementary Table S2. Stem length, no. of panicles per plant and panicle length data were cured on five randomly selected plants for each genotypes. As for days to 50% flowering (DAF), emergence of the spike from flag leaf sheath on half of the plants were calculated starting immediately after the sowing date for each genotypes were recorded.
Illustration of diverse DUS parameters among the Chakhao genotypes. (A) Auricle anthocyanin colouration. (B) Leaf: anthocyanin colouration of collar. (C) Decorticated grain colour. (D) Lemma & palea colour.

Five leaves from each of the five plants were selected to measure from base of the leaf to the tip of fully grown leaf for blade length and leaves’ widest point for blade width measurement. The thickness of stem (five plants) was measured at the basal part (generally 10 cm above from soil) of stem at the milk development stage by using a Vernier caliper and expressed in centimetres (cm). Length of panicle was measured from the base of panicle to tip of topmost panicle of the main culm. For seed weight, 1000 randomly selected seeds from the threshed sample of 5 plants of each variety were counted, weighed, and their weight expressed in grams (g). And for grain width and length, ten fully developed grains of each variety with both ends intact were chosen, the length was measured in millimetres (mm) using Grain micrometre device.
Estimation of amylose content
Amylose content was estimated as per protocol followed in Sompong et al. (Reference Sompong, Siebenhandl‐Ehn, Berghofer and Schoenlechner2011) measuring the absorbance at 620 nm using UV–Vis Spectrophotometer (Merck Spectroquant Pharo 100). They were classified as waxy (1–2%), very low (2–9%), low (10–20%), intermediate (20–25%) and high (25–33%) (IRRI, 2009).
Determination of total anthocyanin content
The total anthocyanin content (TAC) was determined by the pH-differential method (Hosseinian et al., Reference Hosseinian, Li and Beta2008) with some modifications. Twenty mg of powdered samples were soaked in 20 ml hexane for 24 hr to remove fats and oils. Three grams of the hexane treated samples were extracted by mixing with 24 mL of methanol acidified with 1.0 N HCl (85:15, v/v) and shaking on a shaker at 4℃ for 24 hr. The crude extract was filtered with Whatman No. 1 paper (Kim et al., Reference Kim, Kim, Koh, Kim, Lee and Ki2008). The supernatant was evaporated to dryness at 40°C and reconstituted in methanol (5 ml). The methanolic rice extract was diluted in 0.025 M potassium chloride buffer (pH 1) and 0.4 M sodium acetate buffer (pH 4.5) in the ratio of 0.4:3.6 (v/v) methanolic extract to buffers separately and absorbance was measured at 510 and 700 nm (Sutharut and Sudarat, Reference Sutharut and Sudarat2012) using UV–Vis Spectrophotometer (Merck Spectroquant Pharo 100). The absorbance of diluted sample (A) is calculated as:
A = (A510 nm − A700 nm) pH 1 − (A510 nm − A700 nm) pH 4.5
The content of anthocyanin was calculated according to the following formula and expressed as cyanidin-3-glucoside (Bae et al. 2017):
Total anthocyanin (mg cyanidin-3-glucoside/100 g rice powder) = (A × MW × DF × 1000)/(MA × L)
where A = absorbance of sample; MW = Molecular weight (cyanidin-3-glucoside = 449.2); MA = molar absorptivity (26 900); DF = dilution factor for sample (0.4 ml); L (path length in cm) = 1.
DNA isolation and genotyping
Genomic DNA was isolated from the leaves of 3 weeks’ seedlings after transplanted by using standard CTAB procedure (Murray and Thompson, Reference Murray and Thompson1980). Integrity of DNA samples was checked on 0.8% agarose gel and quantified with absorbance ratio A260/280 using Genova Nano Spectrophotometer (Decibel). Samples were diluted to make up a final concentration of ∼20 ng/μL with sterile molecular grade water and stored at 4°C.
The PCR reactions were standardized and the final reaction volume was 10 µL using EmeraldAmp® GT PCR Master Mix. The amplification program consisted of a denaturation step at 95ºC for 4 minutes, followed by 35 cycles of 94ºC for 45 seconds, annealing temperature of respective marker for 45 seconds, and 72ºC extension for 1 minute and a final extension step at 72ºC for 7 minutes. The PCR products were separated in 2% VWR agarose gel stained with ethidium bromide. The resolved amplified products were visualised using a gel documentation system (Gel Doc XR System, Bio-Rad).
Data analysis
The phenotypic DUS categorical data were binary coded for further multivariate analysis. The genotypic data developed using molecular markers was used for calculating summary statistics including the number of alleles per locus, major allele frequency, gene diversity, polymorphism information content (PIC) was calculated using PowerMarker version 3.25 (Liu and Muse, Reference Liu and Muse2005). To avoid possible spurious associations, the Q (population structure) model was used to account for population structure and relatedness of individuals among rice accessions. The genetic structure (Q) prediction of the population was done with the program STRUCTURE version 2.3.3 (Pritchard et al., Reference Pritchard, Stephens, Rosenbergand and Donnelly2000; Evanno et al., Reference Evanno, Regnaut and Goudet2005) with the burning length 100 000, MCMC (Monte Carlo Markov Chain) 100 000 and K value set between 1 and 10 with 10 iterations per K.
The individual Dissimilarity matrices and dendrograms of phenotypic, genotypic data and joint analysis were generated using the ‘NbClust’ package in R Software with Ward.D2 method. Optimal number of clusters were predicted using Silhouette method. Similarity or correlations coefficient, Cophenetic of the any two derived dendrograms were also assessed using the Tanglegram function implemented in the ‘Dendextend’ R package. The combined binary data was used for dissimilarity and distance estimation for exploring the principal Component analysis producing graphical representations on Euclidean plans which preserve at best the distances between units. The analysis was performed in R software.
Results
Principal component analysis and clustering based on morphological data
The phenotypic variations of 46 evaluated traits were assessed and its PCA analysis revealed that the first 10 PC accounted for 78.33% of the total variation, with their Eigen values ranging from 0.75 to 3.72 (Supplementary Table S3; Fig. 2). The 1st PC accounted for 18.10% variance and pointed out dissimilarities majorly to contributing traits related to anthocyanin colouration: on lemma and palea, on decorticated seed colour, its intensity at node, etc. The other contributing traits included stem thickness, presence and distribution of awns, flag leaf attitude, basal leaf colour and its intensity, decorticated grain shape and panicle exertion. The 2nd PC accounted for 13.71% of the variance and correlated with traits of anthocyanin colouration: at apex of lemma, stem internode, leaf, area below apex of lemma, stem node colouration and its intensity and coleoptile colouration. The 3rd component also highly correlated with the anthocyanin colouration (32% contribution) at keel of lemma, auricle, area below apex of lemma and leaf ligule colour. Other characters included of basal leaf intensity, 1000 grain weight, clum attitude, number of panicle per plant and plant height, and explained 9.64% of the total variance. The 4th PC (7.52%) and 5th PC (6.39%) captured variation in grain shape, panicle curvature of main axis, anthocyanin colouration at apex of lemma and leaf collar, 50% days to flowering, clum attitude and plant height. Variation in the germplasm underscores anthocyanin-related traits as dominant drivers of phenotypic diversity across the first three PCs, while structural and developmental traits influenced later components.
PCA plots of individuals/genotypes explained in the first two PCs (A and B), scale of contribution of each variable in the first two PCs (C and D) and hierarchical clustering pattern (E and F) based on morphological data and molecular data, respectively.

As in Figure 2A and C, the first quadrant highlighted the distribution of leaf anthocyanin (DA) in 9 genotype (Chakhao_Ch-3), lemma & palea colour (LPC) in 17 genotype (Chakhao_Sn-1). The second quadrant highlights genotype 8 that presented the anthocyanin colouration of area below apex of lemma (LACABA) and genotypes 10 and 21, the decorticated grain colour (DGC) and stem thickness (ST). The third emphasized the genotypes 15 (Chakhao_Kk-2), 16 (Chakhao_Kk-3) and 19 (Thoubal) belonging to medium hill valley region, with the traits of anthocyanin colouration of sheath, leaf and stem nodes.
Hierarchical clustering analysis was performed to discriminate the genotypes based on their morphology/phenotypic traits (Figure 2E). Thus, the clustering pattern of 22 Chakhao landraces for morphological diversity with Ward.D2 revealed four major clusters. Cluster I (red) highlights 7 genotypes (1, 3, 5, 11, 14, 17 and 18) with four of them belonging to valley medium hilly districts (Bishnupur, Kakching and Thoubal) and 3 of them to upland regional districts (Churachandpur and Senapati). These genotypes presented purple colouration at auricles, leaf collar, ligules, stem nodes and purple lemma/palea. They were also characterized with medium leaf senescence, well exerted panicle and split leaf ligule. Cluster II (green) highlights 5 genotypes viz. 6, 7, 9, 20 and 22, with only 6th genotype (Chakhao_Bn-6) from valley district and the rest from upland regional districts of Chandel and Ukhrul. These genotypes are identified with presence of anthocyanin colouration at the margin of leaf, nodes and internodes, strong purple colouration at apex of lemma, medium density of pubescence. Cluster III (blue) comprised of 3 (15, 16, and 19) genotypes collected from adjacent districts namely Kakching and Thoubal valley districts of Manipur presented by absence of anthocyanin colouration at coleoptile, leaves, stems but of purple and dark purple grain colour. The cluster IV (sky blue) consisted of 7 genotypes collected from both medium hill valley and upland ecosystem. The cluster IV genotypes were of strong anthocyanin colouration at the apex of lemma, at stem internode and deep purple coloured grain with strong culm thickness of more than 0.55 cm.
Distribution of GI attributable grain quality traits of Chakhao
The most important GI attributable grain quality traits of Chakhao are amylose %, anthocyanin content, decorticated grain colour and shape, grain aroma and 1000 seeds weight. Classification of genotypes was carried out as per IRRI, 2009 classification based on amylose %: waxy (1–2% amylose), very low (2–9%), low (10–20%), intermediate (20–25%), and high (25–33%). As in Figure 3, all the genotypes were classified as very low amylose content ranging from 3.4% to 6.97%. Anthocyanin content ranges from 140.4 (Chakhao_Ch-3) to 407.6 (Chakhao_IE-1) mg/100 g with 9 of them having more than 350 mg/100 g which is the most important unique character and specialty of black scented Chakhao rice. Grain size, i.e. 1000 seeds weight was DUS categorized into five classes with very low <15 g, low 15–20 g, medium 21–25 g, high 26–30 g and very high >30 g. Nine genotype (41%) fell under the category of medium size grain weight: 5 in high and 1 in very high category with a mean weight of 22.9 g. The shape of decorticated grain is of 7 categories with short slender, short bold, medium slender, long bold, long slender, basmati type, extra-long slender. The ratio of 22 genotype falling into the 7 category of grain shape was 7:5:7:1:2:0:0. Colour of decorticated grain was DUS classified into 9 classes as white, light brown, variegated brown, dark brown, light red, red, variegated purple, purple and dark purple. Nine of the genotype was of dark purple grain while 5 in purple colour class. Remaining six was in dark brown and light red category (Figure 3; Supplementary Table S4).
Violin plot to show the distribution of (A) amylose (%); (B) anthocyanin (mg/100 g) content; (C) category of 1000 seeds weight (very low <15 g – 1, low 15–20 g – 2, medium 21–25 g – 3, high 26–30 g – 4 and very high >30 g – 5); (D) decorticated grain: shape (short slender – 1, short bold – 2, medium slender – 3, long bold – 4, long slender – 5, basmati type – 6, extra-long slender – 7); (E) decorticated grain: colour (white – 1, light brown – 2, variegated brown – 3, dark brown – 4, light red – 5, red – 6, variegated purple – 7, purple – 8, dark purple – 9) of the 22 Chakhao landraces.

Summary statistics of molecular marker and its multivariate analyses
Among the evaluated 126 primer combinations, 99 were found to be polymorphic with a total of 308 bands/alleles (Figure 4). The polymorphic bands per primer combination ranged from 2 to 7 with an average of 2.84 (Supplementary Table S5). Indicators like number of alleles (NA), major allele frequency (MAF), availability of genotypic data (AGD), gene diversity (He), observed heterozygosity (Ho) and polymorphic information content (PIC) were used to evaluate the discriminatory power of each tested markers. The AGD score of genetic dataset used in the analysis was found to be high with an average of 0.94. NA of polymorphic markers ranges from 2 to 7 and MAF ranging from 0.33 to 0.96; 22 markers out of the 99 polymorphic markers showed a high PIC score of >0.50 and 55 with moderate score of 0.25 to 0.50. The gene diversity ranged from 0.08 to 0.76 with an average value of 0.45 indicating a high gene diversity and genetic variation among the landraces. However, average Ho was observed to be 0.22, lower than the He.
Amplification profiles of markers RM-1341 and RM-474 showing high polymorphism among the 22 genotypes.

Utilizing information from 99 polymorphic molecular markers, we performed a multivariate analysis that revealed significant insights into the underlying molecular diversity. Its PCA analysis revealed that the first ten PC accounted for 72.48% of the total variation, with their Eigen values ranging from 0.74 to 10.28 (Supplementary Table S6; Figure 2). The 1st PC accounted for 18.67% variation and pointed out dissimilarities to the primer combination of RM11998, RM1240, RM6, RM22, RM474, RM489, RM6088, RM2010, RM166, RM132, RM282, RM3132, RM289, RM118, PikmTS1-2 and RM38. The 2nd PC accounted for 9.53% of the variance and contributed by the primers RM24181, RM3766, RM13, RM19269, RM2280, Pik, RM1379, RM194, RM208, RM11, RM569, RM19254, Pi54 and RM2878. The 3rd PC explained 7; 94% of the total variance. And, the 4th and 5th PCs accounted for 6.40% and 6.00% of the total variance, respectively.
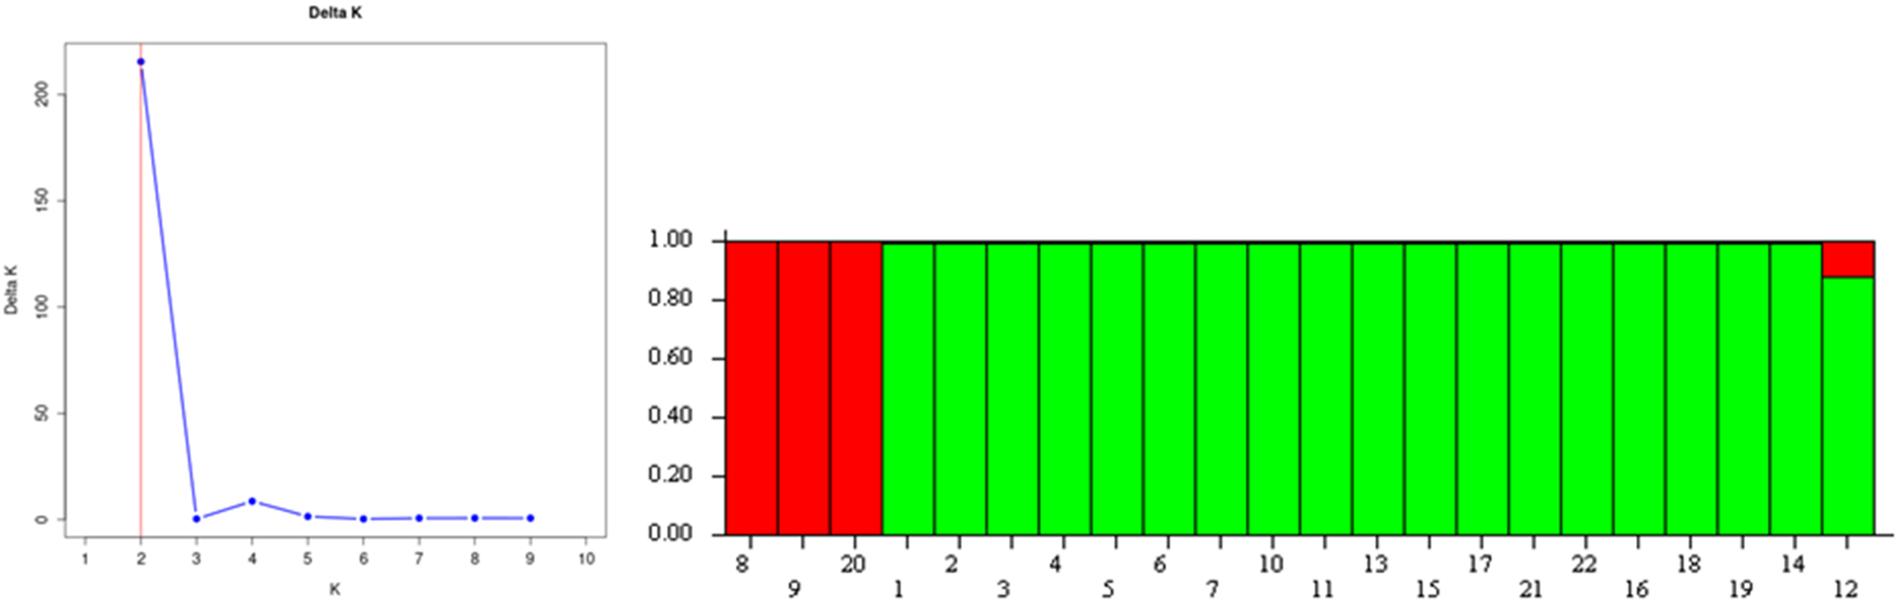
Hierarchical clustering analysis with molecular data revealed three main clusters. Cluster I (red) comprised of 3 genotypes, out of which 10 and 11 (Chakhao_Cp-1 and Chakhao_Cp-2) belong to Churachandpur district. Cluster II (green) organized the genotypes that are collected mostly from medium hill valley districts viz. Bishnupur, Imphal east, Kakching and Thoubal. The cluster III (blue) is the largest cluster comprising of 12 genotypes belonging to both upland and medium hill valley districts of Manipur. The Bayesian analysis of the population structure of revealed two subpopulations as indicated by the ad hoc statistic, delta K (Figure 5). The first subpopulation consisted of 3 (Chakhao_Ch-2, Chakhao_Ch-3 and Chakhao_Uk-1) all belonging to the upland hill ecosystem and the rest 19 landraces in the second subpopulation from both medium hill valley and upland hill regions.
Population structure of 22 black rice Chakhao landraces. Two subpopulations were resolved with no genetic admixing. Population 1 consisted of three landraces all belonging to the upland hill ecosystem and Population 2 with both medium hill and upland ecosystem. Delta K (blue dots) with red line at the clear peak indicating the optimal number of clusters.

Joint analysis of morphological and molecular data
Our analysis revealed a striking lack of similarity between the dendrograms derived from morphological and molecular data, evidenced by a Baker’s Gamma correlation coefficient of just 0.034, highlighting a notable disconnection between these two datasets (Figure 6). Joint hierarchical cluster and PCA analysis revealed three clusters with Cluster I consisting of 3 genotypes (Chakhao_Bn-2, Chakhao_Cp-1 and Chakhao_Cp-2), 9 and 10 genotypes, respectively, in Clusters II and III. 80% of genotypes in Cluster III belonged to medium hill valley ecosystem of Manipur (Figure 7).
Comparison of dendrograms from morphological and molecular markers data, with morphological data grouped into 4 clusters (magenta, olive green, teal and purple branches) and molecular data into 3 clusters (magenta, green and blue branches) with entanglement Baker’s gamma correlation coefficient of 0.034, reflecting minimal topological similarity and divergent groupings between the datasets. The black lines in connecting the dendrograms correspond to mismatched genotypes.

(A) Joint hierarchical cluster analysis of individuals/genotypes using both the datasets of morphological and molecular markers, grouping into 3 clusters (magenta, green and blue branches boxes). (B) PCA plot of the first two principal components using combined data, highlighting the genotypes (in orange) that have the greatest influence on these components.

Discussion
In our study, economically important GI tagged black coloured scented Chakhao landraces of Manipur, India were characterized extensively to identify superior genotypes for Chakhao improvement breeding program in the state. Multivariate analysis for forty-six DUS morphological/phenotypic traits was carried out to assess the genetic diversity. Among all the traits, GI attributable grain quality – decorticated grain anthocyanin colouration and lemma & palea colour were the most contributing traits to the genetic diversity in PC1, driven by their high genetic variability. Other traits influencing PC1 are presence/absence of awn, followed by intensity of anthocyanin colouration at nodes, panicle exertion, decorticated grain shape and distribution of awns in descending order. PC2 was collectively explained by anthocyanin colouration at apex of lemma, area below apex, colour of awns, length of leaf blade and coleoptile colour capturing high genetic variation of these traits. The anthocyanin-related traits were observed to be the dominant drivers of phenotypic diversity among the germplasm, while structural and developmental DUS traits influenced later components.
Chakhao, known for its distinctive dark pericarp, rich in anthocyanin and potent antioxidants, directly correlates with the concentration of these beneficial compounds exhibit significantly higher levels of total phenolic content (TPC) and antioxidant activity compared to their non-coloured counterparts (Yao et al., Reference Yao, Sang, Zhou and Ren2010; Ghasemzadeh et al., Reference Ghasemzadeh, Karbalaii, Jaafar and Rahmat2018). Irrespective of the collection ecosystem, the landraces were grouped morphologically into 4 clusters in the HCA presented by different DUS traits for each clusters translating into the presence of high phenotypic diversity in the present landraces. However, several researchers have claimed that morphological characters are less effective for assessing genetic diversity (Hartings et al., Reference Hartings, Berardo, Mazzinelli, Valoti, Verderio and Motto2008; Soriano et al., Reference Soriano, Villegas, Aranzana, Del Moral LF and Royo2016; Stavridou et al., Reference Stavridou, Lagiotis, Kalaitzidou, Grigoriadis, Bosmali and Tsaliki2021; Al-Khayri et al., Reference Al-Khayri, Mahdy, Taha, Eldomiaty, Abd-Elfattah and Abdel Latef2022). This limitation arises from the influence of environmental conditions during plant growth and development, as well as the effects of genotype-environment interactions commonly observed in quantitatively inherited traits. Additionally, closely related genotypes often exhibit homogeneity in their morphological traits (Govindaraj et al., Reference Govindaraj, Vetriventhan and Srinivasan2015; Ouaja et al., Reference Ouaja, Bahri, Aouini, Ferjaoui, Medini, Marcel and Hamza2021; Reutemann et al., Reference Reutemann, Honfi, Karunarathne, Eckers, Hojsgaard and Martínez2024).
No similarities between clusters of morphological and molecular data analysis were observed (r = 0.034). In the present study, a panel of 126 molecular markers were screened to establish the genetic diversity of the 22 Chakhao landraces, out of which 99 were found to be polymorphic. The gene diversity (He) ranged from 0.08 to 0.74 and PIC score from 0.08 to 0.72. High genetic diversity (0.673) was also previously observed within the Chakhao population of Manipur (Roy et al., Reference Roy, Banerjee, Pattanayak, Roy, Rathi, Misra, Ngachan and Bansal2014). The mean He was 0.45, which was notably higher than the observed heterozygosity (Ho) of 0.22. This contrast highlights that, despite the considerable genetic variation among the genotypes, historical factors such as genetic drift and population bottlenecks during introduction in specific ecological settings may have contributed to this outcome (Singh and Baghel, Reference Singh, Baghel, Singh and Singh2003; Bhuvaneswari et al., Reference Bhuvaneswari, Gopala Krishnan, Bollinedi, Saha, Ellur and Vinod2020). The other factors for this discrepancy includes environmental influence on morphological/quantitative traits, and often SSR markers target non-genic regions with no direct linked with the gene responsible for the traits (Öztürk et al., Reference Öztürk, Dönderalp, Bulut and Korkut2022; Cornea-Cipcigan et al., Reference Cornea-Cipcigan, Pamfil, Sisea and Margaoan2023)
Among the GI attributable grain quality traits of Chakhao, husk and grain colour (purple/dark purple) and aroma, with low amylose and high anthocyanin content are the most important traits to be considered during any breeding program. In the present collection of germplasm, decorticated grain colour contributed the highest in the genetic variability. All the coloured landraces were found to be of very low amylose type with 3.4–6.97% content, a mean value of 5.29%. Other research also observed the low amylose in two major cultivars, namely, Chakhao Poireiton and Chakhao Amubi (Chanu et al., Reference Chanu, Yenagi and Math2016). Nineteen of the landraces are short slender, short bold or medium slender grain type. The total anthocyanin content, a key trait attributed to GI, varied significantly ranging from 140.4 to 407 mg per 100 grams with a mean value of 303 mg per 100 grams. Nine of the genotypes have more than 350 mg/100 g total anthocyanin content, much higher than the blueberry 259 mg/100 g in fresh fruit (Zhao et al., Reference Zhao, Wang, Wang, Lyu, Wu and Li2023).
In a noteworthy comparison to the widely recognized superfood, blueberries, research indicates that a spoonful of black rice bran contains a greater concentration of health-promoting anthocyanin antioxidants. Additionally, black rice bran offers lower sugar content while providing more fibre and vitamin E, making it a nutritionally superior (Kushwaha, Reference Kushwaha2016; Rahim et al., Reference Rahim, Umar, Habib, Imran, Khalid, Lima and Emran2022). The majority of the genotypes with purple or deep purple decorticated grains belong to the medium hill ecosystem of valley, with Chakhao_IE-1 genotype having the highest anthocyanin content, although, no significant difference between genotypes from hilly and medium hill valley ecosystem. Among the 22 genotypes, Chakhao_Bn-4, Chakhao_Ch-2, Chakhao_Cp-1 and Chakhao_IE-1 with decorticated grain colour score of 9 (dark purple) and anthocyanin content more than 390 mg per 100 grams may be utilized for further improvement of Chakhao (Supplementary Table S4).
The current challenges faced by traditional black rice landraces, particularly in Manipur, include their susceptibility to lodging due to taller heights (>150 metre), low yield (typically less than 2.5 tons per hectare), incomplete grain filling and high sensitivity to photoperiod (Borah et al., Reference Borah, Athokpam, Semwal and Garkoti2018; Asem et al., Reference Asem, Nongthombam, Khullakpam, Heisnam, Yurembam and Asem2019; Bhuvaneswari et al., Reference Bhuvaneswari, Gopala Krishnan, Bollinedi, Saha, Ellur and Vinod2020; Hanglem et al., Reference Hanglem, Yaikhom, Singh and Sarma2025). These factors limit their cultivation primarily to social rituals rather than broader agricultural use. However, following the recent surge in demand for Chakhao black rice after receiving Geographical Indication (GI) status, local farmers have struggled to satisfy the growing consumer interest globally (Thongam and Pathak, Reference Thongam and Pathak2023; Jyrwa, Reference Jyrwa2024). In response to this demand, the Indian Council of Agricultural Research (ICAR) Research Complex for North Eastern Hill Region, Manipur Centre has developed a promising new variety known as RC Manichakhao 1. This variety was created using the landrace Chakhao_Bn-1, exemplifying the transformation of biodiversity into biowealth. This semi-dwarf black scented rice variety has a potential yield of 4.5 to 5 tons per hectare, effectively doubling the yield of traditional landraces while maintaining the same grain quality. This advancement not only addresses the yield constraints associated with existing Chakhao varieties but also aligns with the increasing market demand of black rice, thereby contributing to improved farmer livelihoods and ensuring a sustainable supply chain for consumers. Among the diverse landraces evaluated, Chakhao_Bn-4, Chakhao_Ch-2, Chakhao_Cp-1 and Chakhao_IE-1 exhibit exceptionally high anthocyanin concentrations, exceeding 390 mg per 100 g of grain. Owing to their superior nutraceutical profile, these genotypes represent valuable genetic resources with significant potential for incorporation into future Chakhao breeding and genetic enhancement programs in the state.
Conclusion
The popular Chakhao Amubi and Chakhao Poireiton represent not just distinct varieties of black-scented rice but also encompass a diverse assemblage of multiple landraces. Despite the similarity in names, the average gene diversity among the landraces was measured at 0.45, highlighting their distinct genetic uniqueness. The findings indicate a high level of genetic variation among the 22 Chakhao landraces, with specific genotypes (Chakhao_Bn-4, Chakhao_Ch-2, Chakhao_Cp-1 and Chakhao_IE-1) exhibiting exceptional anthocyanin content, which is linked to their health-promoting properties. With decorticated grain colour score of 9 (dark purple) and anthocyanin content more than 390 mg per 100 grams, these landraces may be utilized for further improvement of Chakhao. Traditional landraces face challenges such as low yields and environmental sensitivity, limiting their agricultural use primarily to cultural practices. The recent demand for Chakhao black rice has prompted efforts to develop new varieties that can meet market needs while maintaining quality. The breeding efforts for development of new improved HYV Chakhao variety are crucial for sustaining both the agricultural viability and cultural significance of Chakhao rice in Manipur.
Supplementary material
The supplementary material for this article can be found at https://doi.org/10.1017/S1479262125100270.
Acknowledgements
We would like to thank Competent Authority of our Institute, ICAR RC NEHR, Umiam, Meghalaya, India, and Early Career Research Grant Award, Science and Engineering Research Board, Department of Science and Technology, Government of India for providing fund in carrying out the research activity on Black rice, Chakhao.
Competing interests
Authors declare no conflicts of interest.