INTRODUCTION
The East China Sea (ECS) is one of the largest continental shelves worldwide and is very productive, and it is extensively fished by the surrounding nations of Korea, China and Japan. It has undergone drastic changes over the past decades including surface warming, eutrophication, and changes in the levels of Changjiang discharge waters caused by construction of the Three Gorges Dam (Yoo et al., Reference Yoo, An, Bae, Choi, Ishizaka, Kang, Kim, Lee, Lee, Li, Park, Wang, Wen, Yang, Yeh, Yeon, Yoon, Zhang, Zhang, Zhu, McKinnell and Dagg2010). In particular, the reduced Changjiang discharge has impacted both the phytoplankton community structure and productivity of the Changjiang estuary (Gong et al., Reference Gong, Chang, Chiang, Hsiung, Hung, Duan and Codispoti2006; Zhou et al., Reference Zhou, Shen and Yu2008). The effects of changes in discharge on the ECS ecosystem remain unclear (Gong et al., Reference Gong, Chang, Chiang, Hsiung, Hung, Duan and Codispoti2006; Yuan et al., Reference Yuan, Hayden and Dagg2007), and no large-scale impact on the shelf has been evident. Several studies have reported dramatic increases in phytoplankton stocks and primary production during flood periods, attributable to nutrient loads in the fresh water (Chen, Reference Chen2000; Gong et al., Reference Gong, Chang, Chiang, Hsiung, Hung, Duan and Codispoti2006, Reference Gong, Liu, Chiang, Hsiung, Chang, Chen, Hung, Chou, Chung, Chen, Shiah, Tsai, Hsieh, Shiao, Tseng, Hsu, Lee, Lee, Lin and Tsai2011). In addition, positive correlations between surface chl-a levels (derived from satellite data) and the summer Changjiang discharge have been reported in the past decade (Yamaguchi et al., Reference Yamaguchi, Kim, Son, Kim, Okamura, Kiyomoto and Ishizaka2012). Other studies on long- and short-term changes before and after filling of the dam found no change, or even an increase in phytoplankton biomass after filling (Jiao et al., Reference Jiao, Zhang, Zeng, Gardner, Mishonov, Richardson, Hong, Pan, Yan, Jo, Chen, Wang, Chen, Hong, Bai, Chen, Huang, Deng, Shi and Yang2007; Yuan et al., Reference Yuan, Hayden and Dagg2007). Recently, Gong et al. (Reference Gong, Liu, Chiang, Hsiung, Chang, Chen, Hung, Chou, Chung, Chen, Shiah, Tsai, Hsieh, Shiao, Tseng, Hsu, Lee, Lee, Lin and Tsai2011) reported that standing stocks of phytoplankton dramatically increased in the Changjiang river mouth during flood periods, but a region of the shelf break that contained a relatively high standing stock of phytoplankton appeared to be less developed during flooding than non-flooding periods, indicating that phytoplankton of the inner and outer shelf respond differently to Changjiang discharge. Most studies have focused on the impact of the discharge on the river mouth and continental shelf area of the ECS, but basic knowledge on the phytoplankton response in the outer shelf area is lacking. This is where complicated water masses including the Changjiang diluted waters (CDW), Kuroshio intrusion, and Yellow Sea Cold Water Mass, shift and interact. The CDW is defined as water of salinity <31 in the summer (Gong et al., Reference Gong, Chen and Liu1996; Tsai et al., Reference Tsai, Gong, Sanders, Wang and Chiang2010; Chung et al., Reference Chung, Huang, Gong and Lin2014). Seawater at <23°C and of salinity <33.0 is defined as Yellow Sea Mixed Water (YSMW); this is a mixture of the CDW, Chinese coastal waters, Yellow Sea Cold Bottom Waters and the Tsushima Warm Current (TWC) (Gong et al., Reference Gong, Chen and Liu1996; Wang et al., Reference Wang, Wang and Zhan2003; Kim et al., Reference Kim, Shim and Yoo2006). Therefore, ECS surface waters can be subclassified into the CDW, the TWC and the YSMW, depending on water temperature and salinity.
On the outer ECS shelf, nanophytoplankton (0.2–20 µm in diameter) often dominate in the phytoplankton carbon biomass and are important primary producers (Son et al., Reference Son, Ryu, Noh, Ju and Kim2012). Nanophytoplankton include cyanobacteria in the genera Prochlorococcus (Pro) and Synechococcus (Syn), and various representatives of eukaryote phyla (Euks) (Robineau et al., Reference Robineau, Legendre, Therriault, Fortier, Rosenberg and Demers1995). These phytoplankton serve as food for heterotrophic flagellates and ciliates within the microbial loop, and respond rapidly to changes in water temperature and underwater light level (Campbell et al., Reference Campbell, Liu, Nolla and Vaulot1997; Worden et al., Reference Worden, Nolan and Palenik2004; Chen et al., Reference Chen, Liu, Huang and Wang2014). Jiao et al. (Reference Jiao, Zhang, Zeng, Gardner, Mishonov, Richardson, Hong, Pan, Yan, Jo, Chen, Wang, Chen, Hong, Bai, Chen, Huang, Deng, Shi and Yang2007) reported that the abundance of picophytoplankton (0.2–2 µm in diameter) increased in the continental shelf after filling of the Three Gorges Dam. This was attributed to improved penetration of the water column by light. Tsai et al. (Reference Tsai, Gong, Sanders, Wang and Chiang2010) reported a rapid increase in ECS nanophytoplankton when the Changjiang plume was larger due to higher discharge, indicating different responses of various sized-phytoplankton groups to the river discharge. However, although the importance of nanophytoplankton in the planktonic food web of the northern ECS is clear (Choi et al., Reference Choi, Yang, Kim, Kang, Noh and Kim2012; Lee et al., Reference Lee, Choi, Kang, Yang, Noh and Choi2012), the effects of the Changjiang discharge on nanophytoplankton of the shelf region remain poorly understood. In addition, most studies have focused on the impact of water discharge on the horizontal phytoplankton abundance in the surface layer, although the subsurface chlorophyll maximum (SCM) layer of the outer ECS shelf is important in the summer (Kim et al., Reference Kim, Choi, Kim, Shim, Yoo and Kim2009).
The CDW area which is easily distinguished by low salinity <31 (Bai et al., Reference Bai, He, Pan, Chen, Kang, Chen and Cai2014) in the ECS of August 2010 was dramatically larger than that of August 2012, although hydrological records show that recent widespread floods in the Changjiang drainage basin occurred from June to August of 2010 and 2012 (Yang et al., Reference Yang, Xu, Milliman, Yang and Wu2015). In this study, we used flow cytometry to measure the vertical and spatial distributions of nanophytoplankton during these flood periods, and discussed the influence of the CDW. It is crucial to evaluate the effects of the CDW on the Pro, Syn and Euks of the ECS in order to understand the planktonic food web and the carbon and energy fluxes in play.
MATERIALS AND METHODS
Field surveys and physicochemical variables
We conducted a field survey in the northern ECS under the auspices of the National Fisheries Research and Development Institute (NFRDI) ECS research programme (Figure 1). We visited 20 stations on 20–22 August 2010 and 11–13 August 2012 aboard the RV ‘Tamgu No. 20’ of the NFRDI. The inner and outer shelf could be distinguished by the 50 m isobath (Figure 1). Water temperature and salinity data, and nitrate and phosphate levels, in August 2010 and August 2012, were collected from the Korea Oceanographic Data Center (available at http://kodc.nfrdi.re.kr) of the NFRDI. Vertical temperature and salinity profiles were determined using a Seabird 911 CTD (Sea-Bird Electronics, USA). Nutrient levels in August 2010 and August 2012 were determined in the laboratory by flow injection analysis (Quickchem 8000; LACHAT, USA) employing colorimetric methodology (Parsons et al., Reference Parsons, Maita and Lalli1984).
Sampling stations and bathymetry in the northern ECS. Thick grey lines indicate the Changjiang diluted waters (CDW), Tsushima Warm Current (TWC) and Jeju Warm Current (JWC), and dashed red and blue lines indicate the isohaline of salinity 31 in August 2010 and 2012, respectively.

Nanophytoplankton abundance and biomass
Phytoplankton samples (each of 4 ml) were collected from four to eight depths: 0, 10, 20, 30, 50, 75, 100 and 125 m, using a 5 litre PVC Niskin water sampler attached to a CTD rosette system. All of the samples were fixed for 15 min in 1% (v/v) paraformaldehyde (final concentration), quickly frozen in liquid nitrogen, and stored at −80°C prior to analysis. Then, the samples were thawed and mixed with calibration beads (yellow-green in colour; 0.5 µm in diameter; Polysciences Inc., USA; the fluorescence standards). Samples were analysed for 2 min in a high-rate setting of a FACSCalibur flow cytometer (Becton Dickinson, USA) equipped with an air-cooled argon ion laser (488 nm, 15 mW) within 1 month after each cruise had concluded (Marie et al., Reference Marie, Partensky, Jacquet and Vaulot1997). Nanophytoplankton groups were identified using the 90° light scatter (SSC), orange fluorescence from phycoerythrin, and red fluorescence (RF) from chlorophyll (Figure 2). In samples in which Pro appeared to be absent or unambiguous determinations were difficult (because of low fluorescence per cell), values of zero were entered. Syn microbes were subdivided into two groups based on the intensity of orange fluorescence; these were the relatively lower (Syn 1) and higher (Syn 2) fluorescent subgroups recently reported within the Changjiang estuary and the adjacent area (Lee et al., Reference Lee, Choi, Youn and Roh2014). Pico-eukaryotic cells (Peuks; average diameter 0.9 µm) and nano-eukaryotes (Neuks; average diameter 4.8 µm) were distinguished by cell diameter (Durand et al., Reference Durand, Olson and Chisholm2001; Chen et al., Reference Chen, Wang, Song, Huang, Sun and Liu2011). To compare the spatial distribution of nanophytoplankton abundance, the depth-averaged abundance was calculated by averaging the abundances determined at a given station, because water depth varied considerably among stations. The mean RF per picophytoplankton cell indicated the amount of chlorophyll pigment present (Moore et al., Reference Moore, Goericke and Chisholm1995; Blanchot et al., Reference Blanchot, André, Navarette, Neveux and Radenac2001). Cellular RF varies by nanophytoplankton cell size and physical responses to environmental variables (Chen et al., Reference Chen, Wang, Song, Huang, Sun and Liu2011). Each cellular RF level normalized to the cell volume was calculated to compare the physiological response of nanophytoplankton groups between years because the cellular pigment contents varied in different cell size even in same group. Raw flow cytometric data were processed using FlowJo software (Tree Star, http://www.flowjo.com).
Flow cytometric analysis of a seawater sample collected in (A) August 2010 and (B) August 2012 in the northern East China Sea. See Table 1 for abbreviations. 0.5 µm indicate the calibration beads (0.5 µm in diameter).

Nanophytoplankton abundances were converted into biomass values using the conversion factors of 0.28 pgC µm−3 for Pro and Syn and 0.22 pgC µm−3 for Peuks and Neuks (Garrison et al., Reference Garrison, Gowing, Hughes, Campbell, Caron, Dennett, Shalapyonok, Olson, Landry, Brown, Liu, Azam, Steward, Ducklow and Smith2000). For the nanophytoplankton groups, cell size variability was determined using the bead-normalized SSC as a relative measure of cell diameter (Shalapyonok et al., Reference Shalapyonok, Olson and Shalapyonok2001). The SSC levels were normalized to those of 0.5, 1.0, 2.0 and 6.0 µm diameter yellow-green beads (Polysciences Inc.) on our FACSCalibur flow cytometer (r 2 = 0.99). We used the average diameter of each nanophytoplankton group to estimate the biovolumes obtained on each cruise (Pan et al., Reference Pan, Zhang and Zhang2007).
For chl-a analyses, samples (0.5–1 l) were filtered through 47 mm diameter Whatman GF/F filters. Then, the chl-a was extracted into 90% (v/v) acetone and quantified using a fluorometric acidification method employing a 10-AU instrument (Turner Designs, USA) calibrated with pure chl-a (Parsons et al., Reference Parsons, Maita and Lalli1984).
Data analysis
We statistically analysed the relationships between environmental factors and nanophytoplankton group abundance in our study area. To explore if the CDW affected the horizontal distribution of nanophytoplankton in the various ECS water masses, we derived datasets for the surface and depth of 10 m, which differed from data from depths below 20 m (one-way ANOVA, P < 0.0001; the Tukey HSD test, P < 0.05). Spearman's rank correlation, a non-parametric measure, was used to this end, because most of our data were not normally distributed (as revealed using SPSS version 15.0 software). The Wilcoxon–Mann–Whitney non-parametric test was used to compare differences in environmental variables and nanophytoplankton abundances between the two periods. The environmental and nanophytoplankton data used in correlation analyses were normalized by calculating differences between the observed and average values, and dividing these figures by the standard deviations. To compare the horizontal distributions of nanophytoplankton abundance, we employed depth-averaged abundances determined at each station.
RESULTS
Variability in the environmental characteristics of the northern ECS between the two study periods
During both study periods, the dominant ECS surface waters were the CDW and the TWC, based on water temperature and salinity data (Figure 3). The CDW area of August 2010 was dramatically larger than that of August 2012 (Figure 4). Therefore, we distinguished between the CDW expansion of August 2010 and the CDW reduction of August 2012, and compared the environmental and biological features of the two periods (Table 1). In the CDW expansion, the surface salinity was <31 at most stations (except station 315–12), indicating that a large CDW entered the northern ECS during the flooding period. The CDW extended to 127°E in the upper 20 m of water, and the surface nitrate level was high (mean ± standard deviation, 4.74 ± 2.48 µM) in the CDW expansion (t-test, P < 0.001). During the CDW reduction, the surface salinity was higher than that during the CDW expansion (t-test, P < 0.001) and the CDW was evident in the north-western part of our study area. The surface temperature during the CDW expansion was higher than that during the CDW reduction (t-test, P < 0.001). The surface nitrate level during the CDW reduction was much lower than that during the CDW expansion, as was the surface phosphate concentration (1.89 ± 0.33 nM) (t-test, P < 0.001). On both cruises, we noted that the water column was strongly stratified (Figure 6).
Temperature and salinity diagram for surface waters during two cruises. Water masses were defined by Gong et al. (Reference Gong, Chen and Liu1996); the Changjiang Diluted Waters (CDW) and the Tsushima Warm Current (TWC).

Comparison of variability in the spatial distributions of (A) surface water temperature (°C), (B) surface salinity, and (C) surface nitrate concentration (μM) between August 2010 and August 2012 in the northern ECS. The white solid line indicates that the salinity was 31.

Comparisons of (A) the average environmental factors in surface layer and (B) average biological factors in surface layer (depth-average) in different water masses distinguished by the isohaline of salinity 31 (see Figure 1) in the northern ECS during two cruises.

CDW, Changjiang diluted waters; TWC, Tsushima Warm Current; St., number of stations; N, total number of samples taken for vertical samples; Temp, temperature; Sal, salinity; NO3, nitrate; P, phosphate; Pro, Prochlorococcus; Syn1, Synechococcus 1; Syn2, Synechococcus 2; Peuks, pico-eukaryotes; Neuks, nano-eukaryotes; ND, not detected.
The asterisks indicate the significant differences of abiotic and biotic variables in the surface layer between two periods (t-test).
*P < 0.05; **P < 0.01; ***P < 0.001.
a Unit: nM.
Nanophytoplankton distribution in the northern ECS between the two study periods
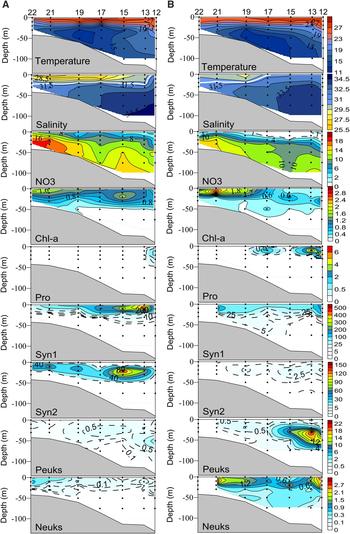
In the northern ECS, the nanophytoplankton abundance during the CDW expansion were significantly higher than those during the CDW reduction (t-test, P < 0.01). However, the various nanophytoplankton groups differed in terms of their horizontal and vertical abundance between the two periods (Table 1 and Figure 5). Syn 1 predominated in summer during both the CDW expansion and reduction (average dominance percentage of near 100% and 97% of nanophytoplankton abundance in the surface layer, respectively). However, the average abundance was ~two times higher during the CDW expansion (mean 2.0 × 10⁵ cells ml−1) than during the CDW reduction (mean 9.9 × 10⁴ cells ml−1). In vertical terms, Syn 1 was highly abundant in the surface layer, and decreased sharply in numbers with increasing depth, during both periods (Figure 6). The Syn 2 abundance was relatively higher during the CDW reduction in the surface layer, but the depth-average abundance was lower during the CDW reduction in both water masses (t-test, P < 0.001). This was because Syn 2 organisms were slightly more abundant at a depth of 10–20 m during the CDW expansion. The Pro abundance did not vary greatly between the two periods, but Pro distribution extended to the north-west of the ECS during the CDW reduction (Figure 5). Pro were distributed homogeneously in the upper 40 m of the water column during both the CDW expansion and reduction, but they were not detected only in the surface layer (Figure 6). The Euks abundances (including both Peuks and Neuks) were dramatically higher during the CDW reduction than the CDW expansion (t-test, P < 0.001), being 4-fold higher at the surface and 7-fold higher at a depth of 20 m (Table 1).
Comparison of variability in the spatial distributions of depth-averaged nanophytoplankton group abundances (×103 cells ml−1) between August 2010 and August 2012 in the northern ECS. See Table 1 for abbreviations.

Comparison of variability in the vertical distributions of seawater temperature (°C), salinity, nitrate concentration (μM), chl-a concentration (μg l−1), and abundances (×103 cells ml−1) of nanophytoplankton groups at stations in 315 line along 32.5°N in the northern ECS between (A) August 2010 and (B) August 2012. The white solid line indicates the salinity was 31. See Table 1 for abbreviations.

In contrast, the nanophytoplankton carbon biomass during the CDW reduction was lower (mean of 16.22 µg ml−1) than that during the CDW expansion (mean of 19.68 µg ml−1) in the surface layer (Figure 7). However, the depth-average carbon biomass was even higher during the CDW reduction (mean of 12.98 µg ml−1) than that during the CDW expansion (mean of 8.47 µg ml−1), because of the contributions made by Peuks and Neuks to the biomass of the subsurface layer (Figure 9). Chl-a concentrations mirrored the variation in nanophytoplankton carbon biomass during both the CDW expansion and reduction (Figure 8), probably because the nanophytoplankton were the principal contributor to the phytoplankton biomass in the ECS shelf area, contributing about 65% of the total chl-a level during the CDW reduction (unpublished data). The vertical distribution of chl-a showed a distinct SCM layer during the CDW reduction.
Comparison of variability in the contributions of (A) mean abundance and (B) carbon biomass of the different nanophytoplankton groups in the surface layer (Sur) and water column (Avg, depth-averaged) between August 2010 and August 2012 in the northern ECS. A, Mean abundance; B, carbon biomass. See Table 1 for abbreviations.

Comparison of variability in the depth distributions of chl-a concentration in the northern ECS between (A) August 2010 and (B) August 2012.

Vertical distributions of the abundance (cells ml−1), cellular red fluorescence (RF, arbitrary unit), and carbon biomass (C, μgC ml−1) for the Pro, Syn 1, Syn 2, Peuks, and Neuks in the northern ECS during two cruises. Horizontal error bar indicates the standard error. See Table 1 for abbreviations.

RF levels (reflecting cellular pigment contents) and the SSC data (reflecting cell size) varied dramatically in the various nanophytoplankton groups between the CDW expansion and reduction (Table 2 and Figure 9). Neither the RF nor size of Syn 1 or Syn 2 organisms varied greatly between the CDW expansion and reduction. However, the Euks cell size was much lower during the CDW reduction (t-test, P < 0.001). The cellular RFs of all groups except the Euks increased with depth (Figure 9). We calculated RFs normalized to cell volume because nanophytoplankton cell sizes varied between the two periods and the cellular pigment contents are higher in the larger cells in general. The normalized RFs of most nanophytoplankton groups were somewhat higher during the CDW expansion (t-test, P < 0.01), which was not true of the Euks (Figure 10).
Box plot of red fluorescence (RF) per cell volume (RF μm−3) in each nanophytoplankton groups during two cruises. See Table 1 for abbreviations.

Interannual variation of cell-size (diameter, μm) of the different ultraphytoplankton groups (mean ± SD) in summer.

See Table 1 for abbreviations.
Relationships between nanophytoplankton abundance and environmental factors
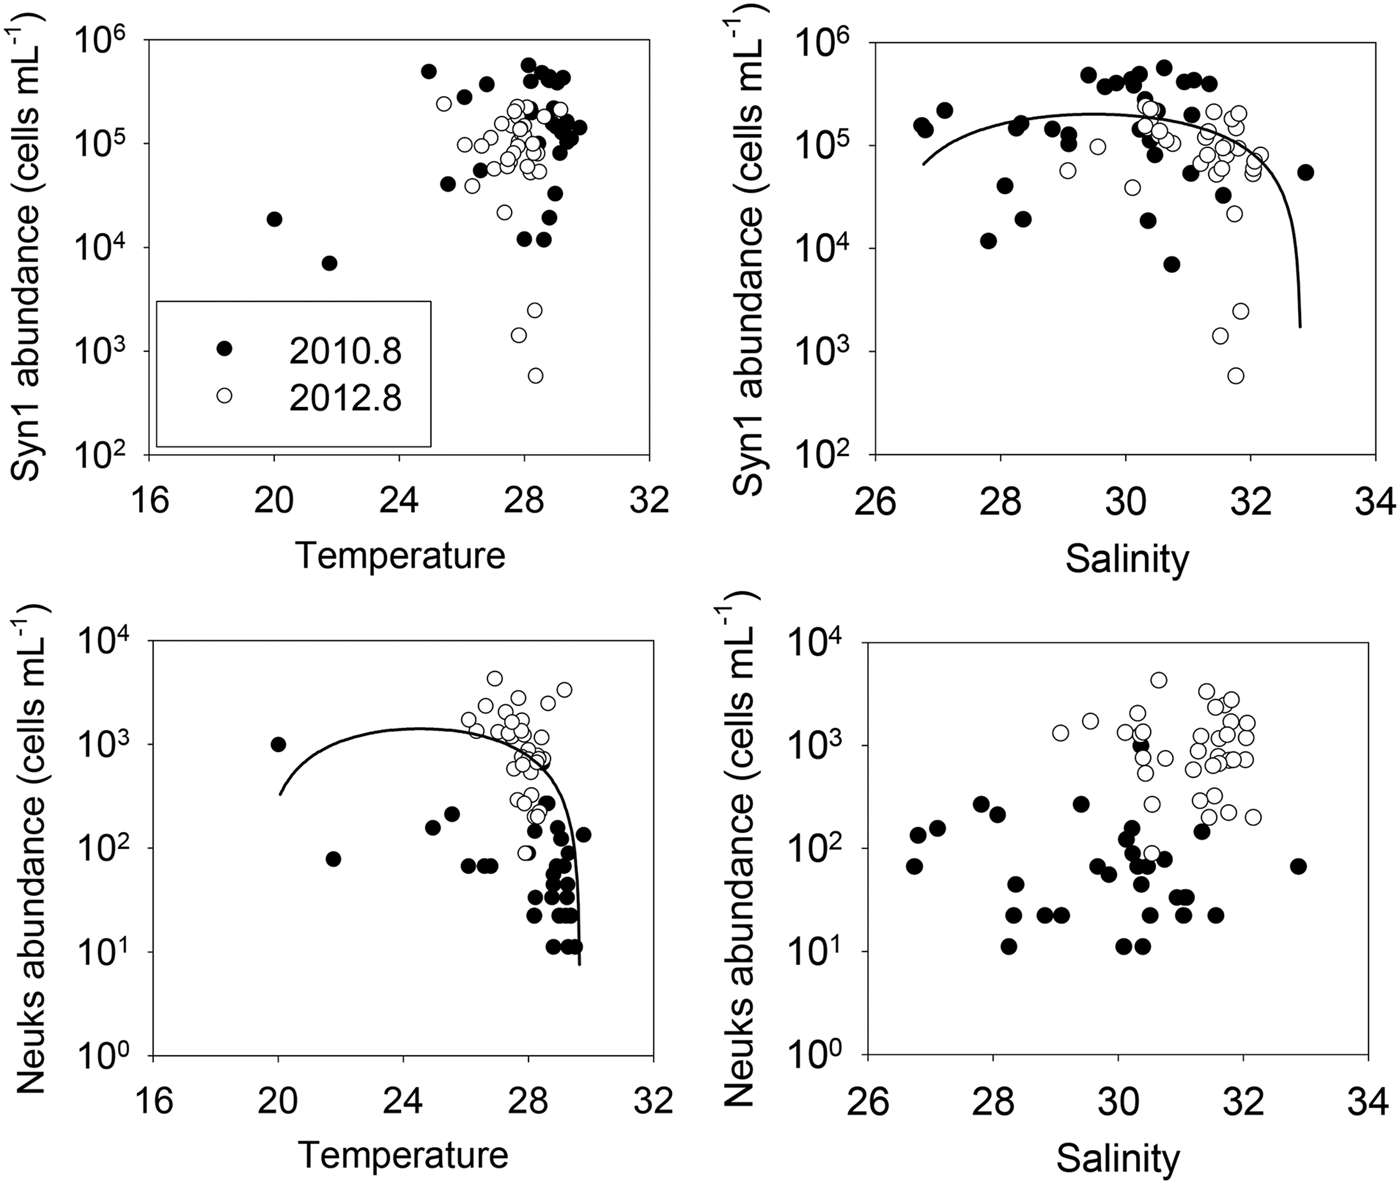
The vertical distribution of nanophytoplankton abundance changed dramatically with depth; the nanophytoplankton level in the upper 10 m of the water column was much greater than that at 20 m (ANOVA, P < 0.001). Therefore, we focused on surface and 10 m depth data when we explored environmental factors affecting the horizontal distribution of nanophytoplankton caused by the rise and fall of the CDW in the northern ECS. In our study area, salinity greatly affected nanophytoplankton distribution (Table 3 and Figure 11). The Syn 1 and chl-a levels correlated negatively with salinity (both P values < 0.05), indicative of high abundance of Syn 1 (and thus high phytoplankton biomass) in the CDW. However, the levels of Syn 2 organisms, Pro, and Euks correlated positively with salinity (all P levels < 0.05). The abundance of Syn 2 and Euks correlated negatively with temperature, but the abundance of other groups did not, indicating that group responses to water temperature differed. The Peuk abundance did not clearly correlate with either water temperature or salinity. The abundance of Syn2 and Euks groups were negatively correlated with nitrate and phosphate concentrations (P < 0.01), indicating these groups were not affected by low nutrient concentrations. However, the Syn 1 abundance (r = 0.271, P < 0.05) and chl-a concentration (r = 0.487, P < 0.01) were positively correlated with the phosphate level.
The relationships between environmental factors such as the sea surface temperature and salinity and nanophytoplankton group abundance (Syn 1 and Neuks) in the surface and 10 m depth. Solid lines represent polynomial regression lines for salinity and Syn1 (r = 0.35, P < 0.01) and temperature and Neuks (r = 0.39, P < 0.05). See Table 1 for abbreviations.
Spearman's rank correlation coefficients between environmental and biological variables in upper 10 m depth in the northern ECS during two cruises (only significant r values (*P < 0.05, **P < 0.01) are displayed).

See Table 1 for abbreviations and units.
DISCUSSION
In the northern ECS, the CDW area differed between our two study periods (August 2010 and August 2012), although both the precipitation and freshwater discharge levels in both summers were the highest recorded over the past decade (Yang et al., Reference Yang, Xu, Milliman, Yang and Wu2015). The CDW expansion affected the surface layer of the northern ECS during the summer of 2010, whereas the CDW distribution was limited to the western part of our study area in August 2012 (Figure 4), most likely because extension of the CDW to the outer ECS shelf was influenced more by the prevailing south-westerly wind than the Changjiang river discharge (Bai et al., Reference Bai, He, Pan, Chen, Kang, Chen and Cai2014). The surface temperature and salinity data showed that the CDW dominated the surface layers of almost all of the stations in August 2010 (Figure 3).
The CDW affected nanophytoplankton distribution in the surface layer of the northern ECS. During the CDW expansion, the nanophytoplankton abundance in the surface layer was twice that during the CDW reduction, indicating that the standing stocks of ECS phytoplankton increase when the CDW area is large. Tsai et al. (Reference Tsai, Gong, Sanders, Wang and Chiang2010) also reported pronounced increases in both pico- and nano-phytoplankton levels in response to changes in Changjiang plume extension through the ECS. We found that the responses of the various nanophytoplankton groups varied with the extent of CDW influence. During the CDW reduction, the average surface abundance of Syn 1 (the predominant nanophytoplankton) was ~50% of that during the CDW expansion. However, in the surface layer, other phytoplankton groups were more abundant during the CDW reduction than the CDW expansion. Although nanophytoplankton other than Syn 1 increased in number during the CDW reduction, the nanophytoplankton abundance decreased because Syn 1 was the major nanophytoplankton component of the northern ECS, and tended to positively respond to the Changjiang discharge. The Synechococcus growth rate is generally (positively) correlated with temperature in both temperate oceans (Agawin et al., Reference Agawin, Duarte and Agustí1998; Tsai et al., Reference Tsai, Gong, Sanders and Chiang2013) and the ECS (Choi et al., Reference Choi, Noh and Shim2013). However, we found that Syn 1 abundance did not significantly correlate with the summer temperature in the northern ECS, indicating that other environmental variables limit the summer distribution of the organisms, as previously reported (Lee et al., Reference Lee, Choi, Youn and Roh2014). During our study periods, Syn 1 abundance was negatively correlated with salinity and fell sharply when the salinity exceeded 31 in the northern ECS. This indicates that high-salinity water may limit the distribution of Syn 1 (Figure 11). In addition, the Syn 1 abundance and chl-a concentration were positively correlated with the summer ECS surface nutrient concentration, suggesting that Syn 1 group is principally coastal in nature, being distributed mainly in the low-salinity high-phosphate CDW of the northern ECS. Therefore, a major discharge of Changjiang floodwater may increase surface nanophytoplankton abundance, particularly those of Syn 1, in the northern ECS.
In our study area, a summer SCM is evident because the water column becomes stratified when the light intensity is high and the daytime hours are long (Kim et al., Reference Kim, Choi, Kim, Shim, Yoo and Kim2009); this is a common seasonal feature of temperate oceans. However, we observed no SCM during the CDW expansion. In this period, the total chl-a concentration was high in the surface layer and decreased sharply with depth (Figure 8). On the other hand, a distinct SCM was evident during the CDW reduction. This rise and fall of the SCM during our study period rendered the nanophytoplankton biomass and abundance inconsistent in terms of depth. The average abundance of nanophytoplankton in the surface layer and at the depths studied were higher during the CDW expansion, attributable to high abundance of Syn 1 during this period, which greatly increased the relative abundance of nanophytoplankton. The average carbon biomass of nanophytoplankton in the surface layer was also higher during the CDW expansion. However, the depth-averaged carbon biomass was rather high during the CDW reduction because of the abundance of, and the large contribution to carbon content made by, eukaryote groups in the SCM layer. These groups are rather large and were prominent among the nanophytoplankton. The average water column chl-a concentration was also higher during the CDW reduction probably because nanophytoplankton, a particularly large eukaryote group, were the principal source of phytoplankton biomass in the outer ECS shelf at this time. It has been previously shown that surface chl-a concentrations do not adequately reflect the levels of standing phytoplankton stocks in the water column of the northern ECS (because of the presence of an SCM layer) (Kim et al., Reference Kim, Choi, Kim, Shim, Yoo and Kim2009). These results imply that the SCM plays an important role in controlling the phytoplankton standing stock in the water column of the northern ECS during summer; this might also be regulated by the CDW.
Euks dominated the SCM nanophytoplankton biomass during the CDW reduction; Syn 1 was the predominant nanophytoplankton group (particularly in the surface layer) during the CDW expansion. The responses of these organisms to environmental changes differed in nature (Table 3). Syn 1 was confined to waters of high salinity (the correlation coefficient was strongly negative), but Euks did not appear to experience salinity stress in the northern ECS (Figure 11). Syn 1 abundance was maximal at temperatures >28°C, while Euks abundance dramatically decreased as the water temperature rose (the correlation coefficient was strongly negative). The growth of Euks is not limited by low water temperatures in the ECS or the Yellow Sea (Jiao et al., Reference Jiao, Yang, Hong, Ma, Harada, Koshikawa and Watanabe2005; Noh et al., Reference Noh, Yoo, Lee, Kim and Lee2005; Le et al., Reference Le, Ning, Liu, Hao and Shi2010). However, the upper limit of water temperature in terms of Euks distribution remains unknown in our study area. We found that Euks distribution could be limited by high water temperature. This may allow the effects of ongoing ocean warming caused by climate change on the structure of the ECS nanophytoplankton community to be predicted. In addition, the underwater light level may significantly affect the distributions of Syn 1 and Euks. The normalized RFs of most nanophytoplankton groups were somewhat higher during the CDW expansion (t-test, P < 0.01), while the RFs of Euks were similar during the two periods, indicating a different response of nanophytoplankton groups to low-level light in the study area (Figure 10). It is difficult to compare Euks data between the two periods because the predominant phyla could differ. However, the vertical RF distributions during either period showed that the RFs of Syn increased with depth, but that of Euks did not, indicating that Syn groups are more light-adapted in the northern ECS (Figure 9). The chl-a fluorescence of nanophytoplankton is sensitive to temperature, salinity, and nutrient concentrations; light directly influences pigment content (Chen et al., Reference Chen, Wang, Song, Huang, Sun and Liu2011). Chl-a fluorescence in phytoplankton cells increased with depth, attributable to the light regime of the water column. However, light sensitivity varies among nanophytoplankton (Blanchot et al., Reference Blanchot, André, Navarette, Neveux and Radenac2001). The dominant group at any water depth may be the group maximally adapted to the light level at that depth (Stambler, Reference Stambler2014). Unfortunately, the light condition was not determined in this study, but the turbidity of a river plume may substantially reduce the penetration of photosynthetically active radiation (Lu et al., Reference Lu, Gan, Dai and Cheung2010). The satellite data showed that water transparency was high when the Changjiang discharge was low (Jiao et al., Reference Jiao, Zhang, Zeng, Gardner, Mishonov, Richardson, Hong, Pan, Yan, Jo, Chen, Wang, Chen, Hong, Bai, Chen, Huang, Deng, Shi and Yang2007). We found that the Syn 1 adapted well to poor light, compared with the Euks. Therefore, the distribution of nanophytoplankton groups might be limited by the change of underwater light regimes.
In conclusion, the extension level and the environmental characteristics of the CDW influenced nanophytoplankton abundance, biomass, and community structure, in the northern ECS in summer. In the surface layer of the northern ECS, Syn 1 was more abundant during the CDW expansion; other groups showed higher abundance during the CDW reduction. The SCM layer was strongly developed during the CDW reduction, and was dominated by Euks. Although both the abundance and carbon biomass of nanophytoplankton, and the chl-a concentration, of the surface layer, were lower during the CDW reduction, the depth-averaged carbon biomass of nanophytoplankton and the chl-a concentration were somewhat higher during the CDW reduction because the Euks made a major contribution to the phytoplankton biomass of the SCM layer. The nanophytoplankton groups appeared to be limited by water temperature and salinity in the northern ECS; the responses to these factors varied by group. The sea surface salinity and temperature are affected not only by expansion and reduction of the CDW but also by the succession process of the CDW; thus, our data may allow us to understand the effects of the CDW on nanophytoplankton distribution in our study area (Bai et al., Reference Bai, He, Pan, Chen, Kang, Chen and Cai2014; Yang et al., Reference Yang, Xu, Milliman, Yang and Wu2015). Furthermore, the SCM layer may play an important role in the phytoplankton ecology and the microbial food web of the northern ECS. Thus, the association between SCM development and the CDW warrants further investigation.
FINANCIAL SUPPORT
This work was supported by the National Fisheries Research and Development Institute (Countermeasure and research about impact of climate change on fisheries), the Korea Research Foundation (The effects of climate change and the input of Yellow Sea Warm Current on the distribution of warm water plankton in the Yellow Sea; grant number 2010-0010162). Partial support was provided by grants from the K-AOOS Program (KOPRI; grant number PM16040) funded by the Ministry of Oceans and Fisheries, Korea.