



1. Introduction
dilatation/contraction is an intrinsic property of granular materials when subjected to shear deformation and an important determinant of the behaviour of granular flows (Reynolds Reference Reynolds1885; Wood Reference Wood1990; Houssais & Jerolmack Reference Houssais and Jerolmack2017). dilatation/contraction strongly affects the onset of avalanches (Gravish & Goldman Reference Gravish and Goldman2014), the initiation of submarine landslides (Rondon, Pouliquen & Aussillous Reference Rondon, Pouliquen and Aussillous2011) and the liquefaction in debris flows (Kaitna, Dietrich & Hsu Reference Kaitna, Dietrich and Hsu2014). In submerged granular media, dilatation/contraction would induce a corresponding decrease/increase in the interstitial fluid pressure and relative motion between the pore fluid and grains, which has a feedback on the granular skeleton and hence on the behaviour of granular flows (Meruane, Tamburrino & Roche Reference Meruane, Tamburrino and Roche2010; Bouchut et al. Reference Bouchut, Fernández-Nieto, Mangeney and Narbona-Reina2016).
It is crucial to account for dilatancy effects in numerical models for granular flows (Bouchut et al. Reference Bouchut, Fernández-Nieto, Mangeney and Narbona-Reina2016). Although the dilatation/contraction of granular materials has attracted intense interest in the past decades (Wood Reference Wood1990; Pailha, Nicolas & Pouliquen Reference Pailha, Nicolas and Pouliquen2008; Dsouza & Nott Reference Dsouza and Nott2020), a quantitative description of the underlying dynamics and a generally accepted theoretical formulation of the dilatancy effects are still unavailable. Specifically, in continuum models for granular flows, most of the existing formulations of dilatation/contraction are empirical (Pailha & Pouliquen Reference Pailha and Pouliquen2009; Iverson & George Reference Iverson and George2014; Delannay et al. Reference Delannay, Valance, Mangeney, Roche and Richard2017). For example, based on the critical state theory for quasi-static dry granular media in simple shear tests, Pailha & Pouliquen (Reference Pailha and Pouliquen2009) attributed the change in the volume of granular flows only to the quasi-static shear dilatation/contraction, and formulated it as the product of shear rate and the tangent of dilatation angle in the continuity equation of granular flows. However, in the continuum theory, the volumetric change of granular flows is equal to the divergence of flow velocity and is a combined result of various forces and processes such as advection, inter-grain collision and quasi-static dilatation/contraction. The critical state theory of soil mechanics empirically accounts for only the part of the volumetric change in granular flows that arises from the quasi-static dilatation/contraction. Therefore, it is incomprehensive to attribute the total volumetric change of granular flows only to the quasi-static dilatation/contraction and formulate it in the continuity equation based on the critical state theory, as done by Pailha & Pouliquen (Reference Pailha and Pouliquen2009). Similarly, the incomprehensiveness also exists in the formulation of Iverson & George (Reference Iverson and George2014), even though they added one more contribution of the effective inter-grain contact normal stress to the volumetric change. Unlike the above models that involve the dilatation/contraction in the continuity equation, Guo et al. (Reference Guo, Peng, Wu and Wang2016) and Baumgarten & Kamrin (Reference Baumgarten and Kamrin2019) considered the dilatancy effects in the momentum equation by integrating them into the plastic constitutive laws of granular materials. This type of models is consistent with the continuum theory and relates the dilatation/contraction directly to inter-grain stresses.
Understanding the dynamics of dilatation/contraction, i.e. what leads to this resultant behaviour of granular materials, helps to develop a theoretical formulation of the dilatancy effects. The widely-used critical state theory proposed by Roux and Radjai (Reference Roux and Radjai1998) for quasi-static granular materials is an efficient empirical relation for the behaviour but cannot explain the reasons. For quasi-static granular media, Guo et al. (Reference Guo, Peng, Wu and Wang2016) and Baumgarten & Kamrin (Reference Baumgarten and Kamrin2019) assumed that the dilatation/contraction arose from the variation of inter-grain plastic stresses and formulated it by introducing a plastic shear deformation related to dilatancy in the constitutive laws of granular materials. On the other hand, for rapid granular flows, the inter-grain collision force is taken to be the reason of dilatancy for which the kinetic theory (Jenkins & Savage Reference Jenkins and Savage1983; Gonzalez-Ondina, Fraccarollo & Liu Reference Gonzalez-Ondina, Fraccarollo and Liu2018) and rheological laws (Jop, Forterre & Pouliquen Reference Jop, Forterre and Pouliquen2006) have been developed. However, these shear-rate-dependent theories for rapid flows cannot account for the contraction of granular materials and neither can they describe the dilatation of quasi-static granular assemblies in which grains move rather slowly. A combination of the proposed dynamics for quasi-static granular media and rapid particulate flows may be applied to granular materials moving at a wide range of shear rates.
In this paper, a theoretical description of dilatation/contraction is presented for continuum modelling of granular flows based on the spatially-filtered and Favre-averaged continuity and momentum equations. It is proposed that the dilatation/contraction effects in sheared granular flows consist of a frictional portion, which results from the rearrangement of enduring-contact force chains among the particles, and a collisional portion, which arises from an inter-grain collision force. These portions are respectively accounted for by the frictional and the collisional solid pressure in the continuum model. A new formulation of the frictional solid pressure, which considers the rearrangement of contact force chains under shear deformation, is proposed while the collisional solid pressure is estimated by well-established rheological laws. The proposed formulation is analytically validated both in describing the shear-weakening behaviour of dry granular samples in a torsional shear rheometer and in predicting the incipient failure of dry and immersed granular slopes. The frictional and the collisional dilatation/contraction effects are integrated into the two-fluid smoothed particle hydrodynamics (SPH) model for granular flows developed by Shi et al. (Reference Shi, Si, Dong and Yu2019). The model is then used to further verify the proposed theoretical formulation of dilatation/contraction by simulating submerged granular column collapse, a benchmark in which the dilatation/contraction plays a critical role from the initiation of the collapse to the final deposition. The dramatic influences of initial packing fraction on the collapsing column profile and the evolution of interstitial fluid pressure arising from dilatation/contraction of granular materials are all well reproduced.
The rest of the paper is structured as follows. A continuum description of the granular flows is briefly given in § 2. The proposed formulation of dilatation/contraction is introduced in § 3. Analytical validations are presented in § 4 and numerical verifications in simulations of underwater granular column collapse are conducted in § 5. Finally, conclusions are given in § 6.
2. A continuum description of granular flows
The spatially filtered and Favre-averaged continuity and momentum equations in Shi et al. (Reference Shi, Si, Dong and Yu2019) are adopted here for a continuum description of granular flows. They are
 \begin{gather}\frac{{\partial ({\phi _s}{\rho _s})}}{{\partial t}} + \boldsymbol{\nabla }\boldsymbol{\cdot }({\phi _s}{\rho _s}{\boldsymbol{u}_s}) = 0,\end{gather}
 \begin{gather}\frac{{\partial ({\phi _s}{\rho _s}{\boldsymbol{u}_s})}}{{\partial t}} + \boldsymbol{\nabla }\boldsymbol{\cdot }{\bf (}{\phi _s}{\rho _s}{\boldsymbol{u}_s}{\boldsymbol{u}_s}) = \boldsymbol{\nabla }\boldsymbol{\cdot }({\phi _s}{\boldsymbol{\sigma }_s}) + {\phi _s}{\rho _s}\boldsymbol{g} + \boldsymbol{\nabla }\boldsymbol{\cdot }({\phi _s}\boldsymbol{\sigma }_s^t) - {\phi _s}\boldsymbol{\nabla }{p_f} + \boldsymbol{F},\end{gather}
in which the subscript s represents the solid phase and f indicates the interstitial fluid in granular media; t is the time;  ${\phi _s}$ is the solid volume fraction;
 ${\rho _s}$ is the particle material density;
 ${\boldsymbol{u}_s}$ is the velocity;
 ${\boldsymbol{\sigma }_s}$ is the inter-grain stress tensor of the solid phase excluding the pressurization of the grains owing to the interstitial fluid pressure;
 $\boldsymbol{g}$ is gravitational acceleration;
 $\boldsymbol{\sigma }_s^t$ is a stress tensor of the solid phase arising from interstitial fluid turbulence;
 ${p_f}$ is the interstitial fluid pressure; and
 $\boldsymbol{F}$ denotes the inter-phase forces other than the buoyancy. Here
 $\boldsymbol{F}$ generally consists of the drag force, lift force and virtual-mass force but can be simplified as the drag force when the dense granular flows are studied in which the drag force is predominant (Baumgarten & Kamrin Reference Baumgarten and Kamrin2019). In subaerial granular media, the solid stress
 $\boldsymbol{\sigma }_s^t$, the interstitial air pressure
 ${p_f}$ and the drag force
 $\boldsymbol{F}$ by air on the particles are neglected. In immersed granular materials,
 ${p_f}$ is resolved,
 $\boldsymbol{\sigma }_s^t$ is determined by introducing a turbulence model and
 $\boldsymbol{F}$ is estimated by the formula proposed by Gidaspow (Reference Gidaspow1994), as shown in § 5.1.
Here  ${\boldsymbol{\sigma }_s}$ consists of stresses resulting from inter-grain collisions and enduring contacts. It is expressed as
 \begin{equation}{\boldsymbol{\sigma }_s} = 2{\rho _s}{\nu _s}{\boldsymbol{S}_s} - {p_s}\boldsymbol{I},\end{equation}
where
 \begin{equation}{\boldsymbol{S}_s} = \tfrac{1}{2}[\boldsymbol{\nabla }{\boldsymbol{u}_s} + {(\boldsymbol{\nabla }{\boldsymbol{u}_s})^\textrm{T}}] - \tfrac{1}{3}(\boldsymbol{\nabla }\boldsymbol{\cdot }{\boldsymbol{u}_s})\boldsymbol{I};\end{equation}
 $\boldsymbol{I}$ is the identity matrix; and
 ${\nu _s}$ and
 ${p_s}$ are respectively the solid viscosity and pressure arising from inter-grain collisions and enduring contacts.
A frictional constitutive law that is widely used in granular flows and intense sediment transport (Maurin, Chauchat & Frey Reference Maurin, Chauchat and Frey2016; Heyman et al. Reference Heyman, Delannay, Tabuteau and Valance2017) is adopted to determine the viscosity  ${\nu _s}$ of the granular materials. Here
 ${\nu _s}$ is related to the inter-grain pressure
 ${p_s}$ as
 \begin{equation}{\nu _s} = \frac{{\mu {p_s}}}{{2{\rho _s}||{{\boldsymbol{S}_s}} ||}},\end{equation}
where  $\mu $ is the friction coefficient and is estimated by the rheological law in § 3.3; and the second invariant
 $||{{\boldsymbol{S}_s}} ||= \sqrt {{\boldsymbol{S}_s}:{\boldsymbol{S}_s}/2} $. The inter-grain solid pressure
 ${p_s}$ consists of two components (Johnson & Jackson Reference Johnson and Jackson1987):
 \begin{equation}{p_s} = p_s^e + p_s^c,\end{equation}
where  $p_s^e$ is caused by enduring contacts among the granular particles and
 $p_s^c$ arsies from the collisions between the grains. The frictional component
 $p_s^e$ accounts for the solid-like behaviour of dense, gently flowing granular materials (Johnson, Nott & Jackson Reference Johnson, Nott and Jackson1990). It generally increases with the volume fraction of the granular assembly
 ${\phi _s}$ and vanishes when
 ${\phi _s}$ is below the random loosely packed fraction
 ${\phi _ \ast }$. In almost all of the existing formulae for
 $p_s^e$, the pressure only varies with
 ${\phi _s}$ and is independent of shear rate (van Wachem et al. Reference van Wachem, Schouten, van den Bleek, Krishna and Sinclair2001). A new formulation of
 $p_s^e$, which takes the dilatation/contraction effects and the influence of shear rate into account, is proposed in § 3.2. The shear-rate-dependent collisional component
 $p_s^c$ is a dominant contribution to
 ${p_s}$ in rapid granular flows and is responsible for the increase in the volume of rapidly flowing granular materials (Forterre & Pouliquen Reference Forterre and Pouliquen2008). The formulation of
 $p_s^c$ will be detailed in § 3.3.
3. Shear dilatation/contraction
3.1. A new dilatation/contraction framework
To describe the dilatation/contraction process of both quasi-static and rapid flowing granular materials, a new dilatation/contraction framework is proposed. It suggests that the dilatancy effects in sheared granular flows consist of a frictional portion, which results from the rearrangement of enduring-contact force chains among the particles, and a collisional portion, which arises from inter-grain collisions. These portions correspond to the two components of solid pressure. The collisional dilatancy effect has been well studied (Forterre & Pouliquen Reference Forterre and Pouliquen2008), while a formulation of the frictional dilatation/contraction remains unavailable and is the focus of this paper.
Figure 1 presents a schematic representation of the frictional dilatation/contraction. It is postulated that the frictional dilatation and contraction of granular materials arise respectively from the sharp increase and decrease of the frictional solid pressure  $p_s^e$ as a result of the rearrangement of contact force chains among the particles. As shown in figure 1(a), when the initially densely packed granular medium is sheared to a strain of
 $\gamma $, there is an intensification of the microscopic contact force chains leading to an increase in the macroscopic solid pressure
 $p_s^e$. The increased inter-grain pressure pushes the particles up, which leads to an expansion of the granular medium and an increase in the porosity. In immersed granular media, the enlargement of the void volume between grains results in a decrease of the pore pressure. Conversely, in figure 1(b), the contact force chains in the loosely packed granular assembly break down, which results in the decrease of frictional solid pressure, contraction of the particle assembly and a decrease in the porosity. In immersed granular media, the shrinkage of the inter-grain void volume leads to an increase in the pore pressure. A formulation of the changes in
 $p_s^e$ arising from the rearrangement of contact force chains is proposed in § 3.2.
Schematic illustrations of the frictional (a) dilatation and (b) contraction. The red solid lines linking the grains roughly represent the enduring-contact force chains among granular particles, and the red upward arrows below the symbol  $p_s^e$ represent the macroscopic frictional solid pressure. The thickness of the red lines roughly indicates the magnitude of contact forces and the length of the red arrows denotes that of
 $p_s^e$.

3.2. Frictional dilatation/contraction
To quantify the frictional dilatation/contraction effect in granular flows, here, a formulation of the changes in  $p_s^e$ arising from the rearrangement of contact force chains is proposed. We consider a granular assembly with a packing fraction of
 ${\phi _s}$ sheared at a finite rate. According to the introduced framework in figure 1, the change in the packing fraction arising from frictional dilatation/contraction against an increment of shear strain
 $\partial \gamma $ results from the variation of
 $p_s^e$, expressed as
 \begin{equation}\frac{{\partial {\phi _s}}}{{\partial \gamma }} ={-} \left|{\frac{{\partial {\phi_s}}}{{\partial p_s^e}}} \right|\frac{{\partial p_s^e}}{{\partial \gamma }}.\end{equation}
The negative sign in (3.1) indicates that an increase or decrease of  $p_s^e$ respectively leads to a decrease or increase in
 ${\phi _s}$, as illustrated in figure 1. A similar expression was adopted by Lu, Brodsky & Kavehpour (Reference Lu, Brodsky and Kavehpour2007) to describe the shear-weakening behaviour of granular materials. Through multiplying (3.1) by
 $- |{\partial p_s^e/\partial {\phi_s}} |$, the changes in
 $p_s^e$, when
 $p_s^e \gt 0$ and
 ${\phi _s} \gt 0$, can be estimated by
 \begin{equation}\frac{{\partial p_s^e}}{{\partial \gamma }} ={-} \left|{\frac{{{\phi_s}}}{{p_s^e}}\frac{{\partial p_s^e}}{{\partial {\phi_s}}}} \right|\frac{{p_s^e}}{{{\phi _s}}}\frac{{\partial {\phi _s}}}{{\partial \gamma }}.\end{equation}
As in Rowe (Reference Rowe1962), a dilatancy angle  $\psi $ is defined as:
 \begin{equation}\textrm{tan}\,\psi = \frac{1}{V}\frac{{\partial V}}{{\partial \gamma }} ={-} \frac{1}{{{\phi _s}}}\frac{{\partial {\phi _s}}}{{\partial \gamma }},\end{equation}
where V is the volume of the granular assembly and  $\partial V$ is the volumetric change arising from frictional dilatation/contraction. Equation (3.3) implies that the mass of the granular assembly remains constant during frictional dilatation/contraction. By defining
 $\Re \equiv |{({\phi_s}/p_s^e)\partial p_s^e/\partial {\phi_s}} |$ and combining (3.2) and (3.3), we have
 \begin{equation}\frac{{\partial p_s^e}}{{\partial \gamma }} = \Re p_s^e\,\textrm{tan}\,\psi .\end{equation}
Note that (3.4) is applicable for any time instant. As the rearrangement of contact force chains takes place at the particle scale, the corresponding changes in the pressure occur in a very short duration of  $O({d_s}/\sqrt {p_s^e/{\rho _s}} )$ (see Forterre & Pouliquen Reference Forterre and Pouliquen2008, where
 ${d_s}$ is the particle diameter), during which there is an exceedingly small shear strain increment of
 ${\gamma _ \ast }$ in the granular assembly. In this strain change, we replace the
 $p_s^e$ in the definition of
 $\Re $ by
 $p_{s0}^e$ as a first approximation and obtain
 \begin{equation}\Re \approx \left|{\frac{{{\phi_s}}}{{p_{s0}^e}}\frac{{\partial p_{s0}^e}}{{\partial {\phi_s}}}} \right|,\end{equation}
in which  $p_{s0}^e$ is the frictional solid pressure excluding the frictional dilatation/contraction effect and is a function of
 ${\phi _s}$. Hence, both
 $\Re $ and
 $\textrm{tan}\,\psi $ are macroscopic properties of the granular assembly varying with the volume fraction
 ${\phi _s}$ on a timescale of
 $O(1/2||{{\boldsymbol{S}_s}} ||)$. In granular media, whose behaviour is dominated by inter-grain frictional contacts, the ratio of the timescale for the microscopic contact-force chain rearrangement to that for changes in macroscopic properties, i.e.
 $O(2{d_s}||{{\boldsymbol{S}_s}} ||/\sqrt {p_s^e/{\rho _s}} )$, has a value of
 $O({10^{ - 6}}) \sim O({10^{ - 1}})$ (Lu et al. Reference Lu, Brodsky and Kavehpour2007; Chialvo, Sun & Sundaresan Reference Chialvo, Sun and Sundaresan2012). Therefore, it is reasonable to regard the microscopic rearrangement of contact-force chains and adjustment of the solid pressure as a transient process in a continuum description of granular flows and, during this period, the macroscopic properties of the granular assembly
 $\Re $ and
 $\textrm{tan}\,\psi $ stay unchanged. We can then rearrange (3.4) to
 $\partial p_s^e/p_s^e = (\Re \,\textrm{tan}\,\psi )\partial \gamma$ and integrate it over
 $[0,{\gamma _ \ast }]$, which gives
 \begin{equation}p_s^e = p_{s0}^e\,{\textrm{e}^{\Re {\gamma _ \ast }\,\textrm{tan}\,\psi }}.\end{equation}
In general, the frictional solid pressure excluding the dilatation/contraction effect  $p_{s0}^e$ is a function of the solid volume fraction and can be computed using a few existing formulae (Johnson & Jackson Reference Johnson and Jackson1987; van Wachem et al. Reference van Wachem, Schouten, van den Bleek, Krishna and Sinclair2001; Hsu, Jenkins & Liu Reference Hsu, Jenkins and Liu2004). Without loss of generality,
 $p_{s0}^e$ can be determined by
 \begin{equation}p_{s0}^e = \left\{ {\begin{array}{@{}ll} {G{{({\phi_s} - {\phi_ \ast })}^\chi }}&{{\phi_s} \gt {\phi_ \ast }}\\ 0&{{\phi_s} \le {\phi_ \ast }} \end{array}} \right.,\end{equation}
where  ${\phi _ \ast }$ is the random loosely packed volume fraction; G is a compressibility coefficient of the grains, which is related to the Young's modulus and the Poisson's ratio of the solid material; and
 $\chi $ is a parameter to characterize the arrangement of contact force chains, which generally varies from 1.50 to 5.50 (Hsu et al. Reference Hsu, Jenkins and Liu2004; Lee & Huang Reference Lee and Huang2018). Rewriting (3.6) in terms of the packing fraction
 $0 \lt {\phi _s} - {\phi _ \ast } \lt 1$ as
 \begin{equation}p_s^e = p_{s0}^e{({\phi _s} - {\phi _ \ast })^{(\Re {\gamma _ \ast }\,\textrm{tan}\,\psi )/\ln ({\phi _s} - {\phi _ \ast })}},\end{equation}
and combining (3.7) and (3.8), we obtain
 \begin{equation}p_s^e = G{({\phi _s} - {\phi _ \ast })^{\chi + \varDelta \chi }} = G{({\phi _s} - {\phi _ \ast })^{\chi + (\Re {\gamma _ \ast }\,\textrm{tan}\,\psi )/\textrm{ln}({\phi _s} - {\phi _ \ast })}},\end{equation}
for  ${\phi _s} \gt {\phi _ \ast }$. Equation (3.9) indicates that the change of
 $p_s^e$ results from the adjustment of the parameter
 $\chi $ for the arrangement of contact force chains, consistent with the proposed framework in figure 1.
By applying (3.7) to obtain  $\partial p_{s0}^e/\partial {\phi _s}$ and
 $p_{s0}^e$ in (3.5) for the case of
 ${\phi _s} \gt {\phi _ \ast }$, we have
 \begin{equation}\Re \approx \frac{{\chi {\phi _s}}}{{{\phi _s} - {\phi _ \ast }}}.\end{equation}
With regards to the dilatancy angle, the critical state theory in Roux & Radjai (Reference Roux and Radjai1998) is employed, i.e.
 \begin{equation}\textrm{tan}\,\psi = K({\phi _s} - {\phi _c}),\end{equation}
in which K is a material parameter of granular assembly varying in the range of 1.0–25.0 and can be determined through simple shear tests (Pailha & Pouliquen Reference Pailha and Pouliquen2009; Bonnet, Richard & Philippe Reference Bonnet, Richard and Philippe2010; Gravish & Goldman Reference Gravish and Goldman2014); and  ${\phi _c}$ is the critical volume fraction of dilatancy, at which there is no frictional dilatation/contraction effect. Here
 ${\phi _c}$ may vary with the imposed force and the shear rate (Bouchut et al. Reference Bouchut, Fernández-Nieto, Mangeney and Narbona-Reina2016) and, in this paper, is related to the flow dimensionless number
 ${I_m}$ following Iverson & George (Reference Iverson and George2014), written as
 \begin{equation}{\phi _c} = \frac{{{\phi _{c0}}}}{{1 + \sqrt {{I_m}} }},\end{equation}
where the dimensionless number  ${I_m}$ is a combination of the inertia number and the viscous number of granular flows, defined by (3.18); and
 ${\phi _{c0}}$ is the critical volume fraction of dilatancy for static granular materials when
 ${I_m} = 0$.
The shear strain  ${\gamma _ \ast }$ increases with the temporal duration of the microscopic rearrangement of inter-grain contact force chains, the scale of which is
 ${d_s}/\sqrt {p_{s0}^e/{\rho _s}} $ (for simplification, here we use
 $p_{s0}^e$ rather than
 $p_s^e$), and with the rate of the macroscopic mean deformation of the granular assembly,
 $2||{{\boldsymbol{S}_s}} ||$. A non-dimensional shear rate
 ${I_d}$ can thus be defined as
 \begin{equation}{I_d} \equiv \frac{{2{d_s}||{{\boldsymbol{S}_s}} ||}}{{\sqrt {p_{s0}^e/{\rho _s}} }},\end{equation}
and  ${\gamma _ \ast }$ increases with
 ${I_d}$. It is noted that
 ${I_d}$ is used to quantify the shear strain of granular media in the process of frictional dilatation/contraction and is different from the inertia number
 ${I_i} \equiv 2{d_s}||{{\boldsymbol{S}_s}} ||/\sqrt {{p_s}/{\rho _s}}$. A preliminary analysis on the magnitude of
 ${\gamma _ \ast }$ in appendix A suggests that
 ${\gamma _ \ast }$ has a small order of
 $O({10^{ - 2}})$–
 $O({10^{ - 1}})$ and
 \begin{equation}{\gamma _ \ast } = {c_1}I_d^{{c_2}},\end{equation}
where  ${c_1}$ and
 ${c_2}$ are coefficients. The analysis gives
 ${c_1} = 0\sim O(10)$ and
 ${c_2} = 0\sim 1$.
Combining (3.6), (3.10) and (3.11), we have the frictional solid pressure including the frictional dilatation/contraction effect expressed as
 \begin{equation}p_s^e = p_{s0}^e\,\textrm{exp}\left[ {K\frac{{\chi {\phi_s}}}{{{\phi_s} - {\phi_ \ast }}}({\phi_s} - {\phi_c}){\gamma_ \ast }} \right].\end{equation}
In (3.15), the frictional solid pressure is related to the shear strain  ${\gamma _ \ast }$. Further, combining (3.15) and (3.14), we can relate the frictional solid pressure to the shear rate of granular flows as
 \begin{equation}p_s^e = p_{s0}^e\,\textrm{exp}\left[ {{c_1}K\frac{{\chi {\phi_s}}}{{{\phi_s} - {\phi_ \ast }}}({\phi_s} - {\phi_c})I_d^{{c_2}}} \right].\end{equation}
Equation (3.16) is valid when  ${\phi _s} \gt {\phi _ \ast }$ and
 $p_s^e = p_{s0}^e = 0$ when
 ${\phi _s} \le {\phi _ \ast }$.
3.3. Collisional dilatancy
The rheological law proposed in Trulsson, Andreotti & Claudin (Reference Trulsson, Andreotti and Claudin2012) was adopted for the collisional dilatancy effect. The shear-rate-dependent collisional solid pressure  $p_s^c$ is determined by
 \begin{equation}p_s^c = 2{\left( {\frac{{{c_3}{\phi_s}}}{{{\phi_0} - {\phi_s}}}} \right)^2}({\rho _f}{\nu _f} + 2{c_4}{\rho _s}d_s^2||{{\boldsymbol{S}_s}} ||)||{{\boldsymbol{S}_s}} ||,\end{equation}
in which  ${\phi _0}$ is the jamming volume fraction, the maximum packing fraction of sheared granular materials in a steady state;
 ${\rho _f}$ is the density of interstitial fluid and
 ${\nu _f}$ is its kinematic viscosity;
 ${d_s}$ is the diameter of granular particles; and
 ${c_3}$ and
 ${c_4}$ are coefficients. In general,
 ${c_3} = 0.75\sim 3.00$ and
 ${c_4} = 0\sim 1.00$ (Chauchat Reference Chauchat2018; Lee & Huang Reference Lee and Huang2018). The effect of interstitial fluid viscosity is included in (3.17) but can be neglected when considering subaerial granular flows.
The rheological law relates the friction coefficient  $\mu $ in (2.5) to a dimensionless number
 ${I_m}$ of granular flows, which is a combination of the inertia number
 ${I_i}$ and the viscous number
 ${I_\nu } \equiv 2||{{\boldsymbol{S}_s}} ||{\rho _f}{\nu _f}/{p_s}$. It is defined as
 \begin{equation}{I_m} \equiv {I_\nu } + {c_4}I_i^2 = \frac{{2||{{\boldsymbol{S}_s}} ||({\rho _f}{\nu _f} + 2{c_4}{\rho _s}d_s^2||{{\boldsymbol{S}_s}} ||)}}{{{p_s}}},\end{equation}
in which  ${c_4}$ is the same coefficient as that in (3.17). A small value of
 ${I_m}$ indicates that the granular flow moves at a low speed and is in the quasi-static regime, while a large value of
 ${I_m}$ corresponds to a rapid granular flow in the inertia regime (Forterre & Pouliquen Reference Forterre and Pouliquen2008). According to Trulsson et al. (Reference Trulsson, Andreotti and Claudin2012), the friction coefficient depends on
 ${I_m}$ as
 \begin{equation}\mu = {\mu _1} + \frac{{{\mu _2} - {\mu _1}}}{{1 + \sqrt {{I_0}/{I_m}} }},\end{equation}
where  ${\mu _1} = \textrm{tan}\,\varphi $ is the friction coefficient when
 ${I_m} = 0$ and the granular assembly is static;
 $\varphi $ is the internal friction angle of the grains;
 ${\mu _2} = \textrm{tan}\,\varphi \sim 1.0$ is the friction coefficient when
 ${I_m}$ is infinite and the granular assembly flows fairly rapidly; and
 ${I_0}$ is a model parameter and is set to be a value close to the characteristic
 ${I_m}$ of the flow (Boyer, Guazzelli & Pouliquen Reference Boyer, Guazzelli and Pouliquen2011).
4. Analytical verifications of the dilatation/contraction formulation
4.1. Shear-weakening behaviour of granular samples
The experimental data of sheared granular samples within a torsional shear cell in Lu et al. (Reference Lu, Brodsky and Kavehpour2007) were used to verify the proposed theoretical formulation of dilatation/contraction. In the experiment, a granular sample composed of sifted beach sand, which had a mean diameter of  ${d_s} = 438\;\mathrm{\mu m}$, a density of
 ${\rho _s} = 2.65\textrm{ g c}{\textrm{m}^{\textrm{ - 3}}}$ and an internal frictional angle of
 $\varphi = 37.5^\circ $, was sheared in a top-rotating torsional shear rheometer. The rheometer was a highly sensitive feedback-controlled instrument with the normal force, top-plate height and angular velocity monitored simultaneously, which hence can directly provide the values of inter-grain pressure, packing fraction and shear rate in the granular sample for the validation of the theory. The granular sample was initially loaded up to a height of 6 mm with a packing fraction of
 ${\phi _s} = 0.61$ when static. It was then sheared by rotating the top plate at a finite angular velocity with the column height staying fixed and the volume fraction of the medium remaining constant. The normal stress on the top plate was recorded. The shear angular velocity
 $\omega $ varied from 0.001 to 100 rad s−1 in different experimental cases and the shear rate of the granular sample was correspondingly between 0.001 and 2800 s−1. The results showed that the normal stress on the top plate varied little when the angular shearing velocity
 $\omega $ was lower than 0.01 rad s−1 but became negatively correlated with
 $\omega $ when
 $\omega $ was increased up to 25 rad s−1. This observation demonstrated a shear-weakening rheology with a dip of the normal stress. As
 $\omega $ increased further, the normal stress increased almost quadratically with the shear rate when the grains were in the inertia regime.
At the steady state when the sample is sheared at a rate of  $\dot{\gamma }$, the normal stress on the top plate
 $\sigma $ is balanced by the inter-grain pressure
 ${p_s}$ as
 \begin{equation}\sigma = {p_s} = p_s^e + p_s^c.\end{equation}
Excluding the effect of interstitial fluid viscosity in (3.17) for subaerial granular samples and combining (3.12), (3.16), (3.17) and (4.1), the normal stress varies with the shear rate  $\dot{\gamma } = 2||{{\boldsymbol{S}_s}} ||$ as
 \begin{equation}\sigma = p_{s0}^e\,\textrm{exp}\left[ {{c_1}K\frac{{\chi {\phi_s}}}{{{\phi_s} - {\phi_ \ast }}}({\phi_s} - {\phi_c})I_d^{{c_2}}} \right] + {c_4}{\left( {\frac{{{c_3}{\phi_s}}}{{{\phi_0} - {\phi_s}}}} \right)^2}{\rho _s}d_s^2{\dot{\gamma }^2}.\end{equation}
The frictional solid pressure without the dilatation/contraction effect  $p_{s0}^e$, determined by (3.7), balances the initially imposed normal stress
 ${\sigma _0}$ to the static granular sample at the start of each experimental case, i.e.
 \begin{equation}{\sigma _0} = p_{s0}^e = G{({\phi _s} - {\phi _ \ast })^\chi }.\end{equation}
Dividing both sides of (4.2) by  ${\sigma _0}$, we have the dimensionless normal stress varying with shear rate as
 \begin{equation}\frac{\sigma }{{{\sigma _0}}} = \exp \left[ {{c_1}K\frac{{\chi {\phi_s}}}{{{\phi_s} - {\phi_ \ast }}}({\phi_s} - {\phi_c})I_d^{{c_2}}} \right] + {c_4}{\left( {\frac{{{c_3}{\phi_s}}}{{{\phi_0} - {\phi_s}}}} \right)^2}\frac{{{\rho _s}d_s^2{{\dot{\gamma }}^2}}}{{{\sigma _0}}},\end{equation}
in which the non-dimensional shear rate  ${I_d} = {d_s}\dot{\gamma }/\sqrt {{\sigma _0}/{\rho _s}} $. Figure 2 shows the comparisons between the results of (4.4) and the measured data. In the experiment,
 ${\sigma _0} = 1.25 \times {10^4}\;\textrm{Pa}$,
 ${\phi _ \ast } = 0.590$ and a random close-packing fraction
 ${\phi ^ \ast } = 0.640$. A jamming volume fraction
 ${\phi _0} = 0.630$ is set which is in a reasonable range of
 ${\phi _s}\sim {\phi ^ \ast }$. The compressibility coefficient of the natural sand G is
 ${10^9}\;\textrm{Pa}$ and, according to (4.3), the coefficient
 $\chi = \textrm{ln}({\sigma _0}/G)/\textrm{ln}({\phi _s} - {\phi _ \ast })$ is 2.89. A critical volume fraction of dilatancy
 ${\phi _{{c_0}}} = 0.630$ is estimated in the experiment. The parameter K was not measured and we take
 ${c_1}K$ as a single coefficient. Here,
 ${c_1}K = 1.50$ and
 ${c_2} = 0.42$ are set by fitting the computed results with the data in both quasi-static and transitional regimes, while
 ${c_3} = 1.80$ and
 ${c_4} = 0.0005$ are determined according to the fitness in the inertia regime. The values of the parameters are summarized in table 1.
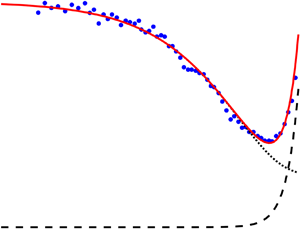
Variation of normal stress on the rheometer top-plate with non-dimensional shear rate in the volume-constant experiments of Lu et al. (Reference Lu, Brodsky and Kavehpour2007). The non-dimensional frictional solid pressure  $p_s^e/{\sigma _0}$ and collisional pressure
 $p_s^c/{\sigma _0}$ are computed by the first and the second terms on the right-hand side of (4.4), respectively.

Parameters in the model. The third column shows whether a parameter is a material parameter, whose value is determined depending on the physical properties of solid grains and according to related experimental observations. In §§ 4.1 and 5, the material parameter K was not measured and we take  ${c_1}K$ as a single adjustable parameter. In § 4.2, when concerning the critical incipient state of granular slopes, the frictional solid pressure is related to the shear strain
 ${\gamma _ \ast }$ and
 ${\gamma _ \ast } = {c_1}I_d^{{c_2}}$ is taken as an adjustable parameter. In specific analytical cases, if its value is not set, the parameter is not involved in the solutions.

As shown in figure 2, the predicted variation of the normal stress against shear rate agrees well with the measured data, which demonstrates that the proposed formulation of frictional solid pressure is capable of describing the shear-weakening behaviour of the granular sample. When the sample is in the quasi-static and the transitional regimes, the frictional solid pressure  $p_s^e$ predominates and the decrease in
 $p_s^e$, owing to the frictional contraction, is the reason for the dip in the normal stress. When the sample is in the inertia regime, the collisional inter-grain pressure
 $p_s^c$ increases quadratically with the shear rate and becomes dominant in the balance with the normal stress on the top-plate. Equation (4.4), which is a direct result of the proposed dilatation/contraction theory, can map the variation of the normal stress imposed to the sheared sample smoothly between the quasi-static and the inertia regimes.
4.2. Incipient failure of granular slopes
In this section, the proposed theoretical formulation is assessed through predicting the incipient failure of dry and immersed granular slopes.
Gravish & Goldman (Reference Gravish and Goldman2014) experimentally studied the effects of initial packing fraction on the failure of dry granular slopes. An initially horizontal layer of grains with  ${d_s} = 256\;\mathrm{\mu m}$,
 ${\rho _s} = 2.5\,\textrm{g}\;\textrm{c}{\textrm{m}^{ - 3}}$ and volume fraction
 ${\phi _s}$ ranging between 0.58 and 0.63 was prepared on a fluidized bed. The bed was then rotated to a 45° angle at a constant rate. The granular motion in the bed was recorded by cameras and the instant when incipient motion of grains on the surface occurred was detected. The angle of the slope at the instant
 ${\theta _0}$, referred to as the incipient angle, was then obtained according to the rotation rate of the bed. In different experimental cases, the initial packing fraction was varied and different failure behaviours of the granular slopes were observed. It was found that the bed with a packing fraction smaller than the critical value
 ${\phi _{{c_0}}} = 0.595 \pm 0.003$ experienced a rapid failure and a compaction, while the bed with a fraction larger than the critical value underwent a slow failure and a dilatation. Specifically, the bed with initial
 ${\phi _s} = 0.58$ had an incipient angle of
 ${\theta _0} = 7.7 \pm {1.4^ \circ }$, whereas the
 ${\theta _0}$ of the bed with
 ${\phi _s} = 0.63$ was
 $32.1 \pm 1.5^\circ $. Overall, the incipient angle of the slopes increased significantly with the initial packing fraction.
For comparison, the classical saw model of dilatancy (Rowe Reference Rowe1962; Pailha & Pouliquen Reference Pailha and Pouliquen2009) was applied to estimate the incipient angle of granular slopes. In the theory, forces are in equilibrium both along and normal to the slope and the dilatation/contraction affects the slope failure by leading to a change in the angle of shearing. At the critical incipient state, the grains on the bed surface are controlled by
 \begin{gather}{\phi _s}{p_s}\,\textrm{tan}\,\delta = {\phi _s}{\rho _s}gh\,\textrm{sin}\,{\theta _0},\end{gather}
 \begin{gather}{\phi _s}{p_s} = {\phi _s}{\rho _s}gh\,\textrm{cos}\,{\theta _0}\end{gather}
and
 \begin{equation}\textrm{tan}\,\delta = \textrm{tan}(\varphi + \psi ),\end{equation}
where  $\delta $ is the angle of shearing;
 $\varphi $ is the internal friction angle of the grains and
 $\textrm{tan}\,\varphi $ is the friction coefficient when there is no dilatancy effect; and h is a characteristic depth of the grains to move. Recall that
 $\psi $ is the dilatancy angle. Equations (4.5) and (4.6) are respectively for the balance of forces in the directions along and normal to the slope. Combining (4.5)–(4.7) as well as (3.11), we have
 \begin{equation}{\theta _0} = \varphi + \psi = \varphi + \textrm{arctan}[K({\phi _s} - {\phi _c})].\end{equation}
Here,  ${\phi _c} = {\phi _{{c_0}}}$ holds during the incipient failure of the slopes.
We then applied the proposed formulation to predict the incipient angle of granular slopes. It should be noted that the collisional solid pressure  $p_s^c$ vanishes at the incipient failure stage and thus
 ${p_s} = p_s^e$. When the granular bed is static, in the direction normal to the slope, the inter-particle pressure without the frictional dilatation/contraction effect
 $p_{s0}^e$ balances the gravity as
 \begin{equation}{\phi _s}{p_s} = {\phi _s}{\rho _s}gh\,\cos \,{\theta _0},\end{equation}
where
 \begin{equation}{p_s} = p_{s0}^e = G{({\phi _s} - {\phi _ \ast })^\chi }.\end{equation}
Hence,  $p_{s0}^e = G{({\phi _s} - {\phi _ \ast })^\chi } = {\rho _s}gh\,\textrm{cos}\,{\theta _0}$. As the granular slope approaches to the critical incipient state, before the incipient motion is detected, the grains on the slope surface undergo a small shear strain
 ${\gamma _ \ast }$ during the failure. Owing to the rearrangement of contact force chains along with the strain, the solid pressure changes from
 ${p_s} = p_{s0}^e$ to
 ${p_s} = p_{s0}^e\,{\textrm{e}^{\Re {\gamma _ \ast }\,\textrm{tan}\,\psi }}$ in the frictional dilatation/contraction and the forces in the direction normal to the slope cease to be in equilibrium. In the densely packed granular slope, the solid pressure increases and the resultant force in the normal direction becomes upward, which leads to a dilatation of the assembly. Conversely, in the loosely packed granular bed, the solid pressure decreases and the resultant force directs downward, which induces a contraction in the bed. In the direction along the slope, the equilibrium condition is still valid. Hence,
 \begin{equation}{\phi _s}{p_s}\,\textrm{tan}\,\varphi = {\phi _s}{\rho _s}gh\,\textrm{sin}\,{\theta _0},\end{equation}
where
 \begin{equation}{p_s} = p_{s0}^e\,{\textrm{e}^{\Re {\gamma _ \ast }\,\textrm{tan}\,\psi }} = {\rho _s}gh\,\textrm{cos}\,{\theta _0}\,{\textrm{e}^{\Re {\gamma _ \ast }\,\textrm{tan}\,\psi }}.\end{equation}
The effect of the dilatation/contraction on the friction coefficient during the incipient period is neglected. Combining (4.11) and (4.12) gives
 \begin{equation}\textrm{tan}\,{\theta _0} = {\textrm{e}^{\Re {\gamma _ \ast }\,\textrm{tan}\,\psi }}\,\textrm{tan}\,\varphi ,\end{equation}
which can be written explicitly as
 \begin{equation}{\theta _0} = \varphi + \arctan \left[ {\frac{{{\textrm{e}^{\Re {\gamma_ \ast }\,\textrm{tan}\,\psi }} - 1}}{{1/\textrm{tan}\,\varphi + {\textrm{e}^{\Re {\gamma_ \ast }\,\textrm{tan}\,\psi }}\,\textrm{tan}\,\varphi }}} \right].\end{equation}
Substituting  $\chi {\phi _s}/({\phi _s} - {\phi _ \ast })$ for
 $\Re $ and
 $K({\phi _s} - {\phi _c})$ for
 $\textrm{tan}\,\psi $ as in § 3, we finally obtain
 \begin{equation}{\theta _0} = \varphi + \arctan \left[ {\frac{{{\textrm{e}^{c{\phi_s}({\phi_s} - {\phi_c})/({\phi_s} - {\phi_ \ast })}} - 1}}{{1/\textrm{tan}\,\varphi + {\textrm{e}^{c{\phi_s}({\phi_s} - {\phi_c})/({\phi_s} - {\phi_ \ast })}}\,\textrm{tan}\,\varphi }}} \right],\end{equation}
where  $c = \chi {\gamma _ \ast }K$. It is noted that in this case we do not apply (3.14) to replace
 ${\gamma _ \ast }$ with
 ${c_1}I_d^{{c_2}}$ but keep
 ${\gamma _ \ast }$ in the equation as a parameter because the shear rate of the slope during the incipient motion is not measurable. Moreover, it is more reasonable to relate the incipient dynamics of granular slopes at the critical state to the shear strain than to the shear rate. In Gravish & Goldman (Reference Gravish and Goldman2014), the measured critical volume fraction of dilatancy
 ${\phi _c}$ was 0.595, the material parameter for dilatancy K was 22.4 and the internal friction angle of grains in the air
 $\varphi $ was
 $17.0^\circ $. A random loosely packed volume fraction of
 ${\phi _ \ast } = 0.570$ was determined according to the experimental setup. Here
 $\chi \textrm{ = 3}\textrm{.50}$ was set, which was the median value of its range (see § 3.2 and table 1). A shear strain of
 ${\gamma _ \ast } = 0.026$, consistent with the analysis in appendix A, was obtained by fitting the results to the experimental data.
Figure 3 compares the computed incipient angles of the granular slope using (4.8) and (4.15) with the measured data. The results given by the present formulation agreed with the data much better than those by the classical saw model, especially when the initial packing fraction of the granular slope was larger than the critical value of dilatancy and the bed dilates.
Variation of the incipient angle of dry granular slope with the initial packing fraction in the experiment of Gravish & Goldman (Reference Gravish and Goldman2014). The measured critical volume fraction  ${\phi _c} = 0.595$ with the grey bar indicating the measurement uncertainty.

Bonnet et al. (Reference Bonnet, Richard and Philippe2010) conducted a similar experiment to study the failure of immersed granular slopes in static water  $({\rho _f} = 1.0\;\textrm{g}\;\textrm{c}{\textrm{m}^{ - 3}})$. The grains had a diameter of
 ${d_s} = 600\;\mathrm{\mu m}$ and a density of
 ${\rho _s} = 2.65\;\textrm{g}\;\textrm{c}{\textrm{m}^{ - 3}}$. The initial packing fraction of the granular particles in the bed
 ${\phi _s}$ varied from 0.52 to 0.59 and the corresponding measured incipient angle of the slopes varied significantly with a notably high ratio of 2.5 between the maximal and the minimal values. It should be noted that the shear strain and the deformation of the free granular slope during the incipient stage are expected to be exceedingly small and, accordingly, the variation of pore pressure is not appreciable and neglected here. Therefore, the buoyancy of the grains was accounted for by substituting
 ${\rho _s} - {\rho _f}$ for
 ${\rho _s}$ in (4.5)–(4.6) and (4.9)–(4.12). Consequently, both (4.8) of the saw model and (4.15) of the present frictional dilatation/contraction theory can also be applied to determine the incipient angle of immersed granular slopes.
Figure 4 shows the comparisons between the computed results and the measured data. According to the experimental results of Bonnet et al. (Reference Bonnet, Richard and Philippe2010), the parameter  $K = 20.8$, the critical volume fraction of dilatancy
 ${\phi _c} = 0.545$ and the internal friction angle of gains in the water
 $\varphi = 38.6^\circ $. A random loosely packed volume fraction of
 ${\phi _ \ast } = 0.510$ was roughly determined, as the minimal value of the packing fraction prepared in the experiment was between 0.51 and 0.52. Same as that in the dry slope case, a value of
 $\chi = 3.50$ was also set. According to the verification against the measured data, a shear strain of
 ${\gamma _ \ast } = 0.019$ was adopted, which had the same order as that in the dry slope case. Values of the parameters are summarized in table 1. Figure 4 shows that the computed incipient angle by the present formulation agreed generally well with the measured data and the fitness was better than that between the results of the classical saw model and the data. The present formulation performs well in the dilatation situation and only slightly overestimates the incipient angle when the bed experiences a contraction. For the cases of
 ${\phi _s} - {\phi _c} \le - 0.02$, where the incipient angle seems to vary little with the packing fraction, both the present theory and the classical saw model have an underestimation, which may arise from the lack of effect from the fluid viscosity on slope failures. In immersed granular media, solid particles have an additional cohesion owing to the viscosity of interstitial fluid, noted as
 $c^{\prime}$. At the critical state, there is a balance along the slope among the additional particle cohesion, the inter-particle shear stress and the gravity as
 ${\phi _s}(c^{\prime} + {p_s}\,\textrm{tan}\,\varphi ) = {\phi _s}({\rho _s} - {\rho _f})gh\,\textrm{sin}\,{\theta _0}$. In the cases of
 ${\phi _s} - {\phi _c} \le - 0.02$, owing to frictional contraction, the inter-particle pressure and shear stress decrease significantly and could have a smaller value than
 $c^{\prime}$. As a result, the additional particle cohesion predominates in resisting the incipient motion of the slope, which yields
 ${\theta _0} = \arcsin [c^{\prime}/({\rho _s} - {\rho _f})gh]$. Assuming a same value of
 $c^{\prime}$ for the cases with different packing fractions, we can find that the slope incipient angle varies little with the packing fraction. For an accurate quantification of the phenomenon, more measured data are required in further investigations.
Variation of the incipient angle of immersed granular slopes in water with the initial packing fraction in the experiment of Bonnet et al. (Reference Bonnet, Richard and Philippe2010). The measured critical volume fraction is  ${\phi _c} = 0.545$ and the grey bar represents the uncertainty in the measurement.

5. Numerical validations by simulations of submerged granular column collapse
The proposed dilatation/contraction formulation is integrated into the two-fluid model of Shi et al. (Reference Shi, Si, Dong and Yu2019), which is validated in laminar bed-load transport by Poiseuille flow (see appendix B), and, in this section, is applied to simulate submerged granular column collapse. The submerged granular mass collapse is a benchmark for studying the dilatation/contraction of granular materials, in which the frictional dilatation/contraction plays a critical role in the whole process from the initiation of the crash to the final deposition (Houssais & Jerolmack Reference Houssais and Jerolmack2017; Baumgarten & Kamrin Reference Baumgarten and Kamrin2019). The experiments showed that the initially loosely packed columns exhibited a fast initiation of motion and compacted in the collapse with an increase in the pore fluid pressure, while the densely packed columns collapsed rather slowly and dilated with a decrease in the pore fluid pressure (Rondon et al. Reference Rondon, Pouliquen and Aussillous2011; Wang et al. Reference Wang, Wang, Peng and Meng2017). A two-phase model fully resolving the primary variables of the solid and the liquid phases helps to capture the dynamics in the dilatation/contraction of the saturated granular materials.
5.1. Two-phase continuum model based on the smoothed particle hydrodynamics method
The present dilatation/contraction theory is integrated into the model of Shi et al. (Reference Shi, Si, Dong and Yu2019), which is a two-phase continuum model based on the weakly compressible smoothed particle hydrodynamics (WCSPH) method. The controlling equations, i.e. conservation equations of mass and momentum of the two phases, are obtained by first averaging the physical variables of each phase in a control volume following Drew (Reference Drew1983) for a continuum description of both phases, and then spatially filtering through Favre averaging for the turbulence. The equations are then written into Lagrangian form for numerical implementation using the SPH method. Here, for brevity, we only give a minimum description of the model. Detailed derivation of the equations and numerical implementations of the model can be found in Shi, Yu & Dalrymple (Reference Shi, Yu and Dalrymple2017) and Shi et al. (Reference Shi, Si, Dong and Yu2019).
The governing equations of the solid phase are
 \begin{gather}\frac{{\textrm{d}{\phi _s}}}{{\textrm{d}t}} ={-} {\phi _s}\boldsymbol{\nabla }\boldsymbol{\cdot }{\boldsymbol{u}_f} - \boldsymbol{\nabla }\boldsymbol{\cdot }[{\phi _s}({\boldsymbol{u}_s} - {\boldsymbol{u}_f})],\end{gather}
 \begin{gather}\begin{array}{ccccc} \dfrac{{\textrm{d}{\boldsymbol{u}_s}}}{{\textrm{d}t}} & ={-} [({\boldsymbol{u}_s} - {\boldsymbol{u}_f})\boldsymbol{\cdot }\boldsymbol{\nabla }]{\boldsymbol{u}_s} + \dfrac{1}{{{\phi _s}{\rho _s}}}\boldsymbol{\nabla }\boldsymbol{\cdot }({\phi _s}{\boldsymbol{\sigma }_s}) + \boldsymbol{g} + \dfrac{1}{{{\phi _s}{\rho _s}}}\boldsymbol{\nabla }\boldsymbol{\cdot }({\phi _s}\boldsymbol{\sigma }_s^t)\\ & \quad - \dfrac{1}{{{\rho _s}}}\boldsymbol{\nabla }{p_f} + \dfrac{\boldsymbol{F}}{{{\phi _s}{\rho _s}}}, \end{array}\end{gather}
and those of the interstitial fluid phase are
 \begin{gather}\frac{{\textrm{d}({\phi _f}{\rho _f})}}{{\textrm{d}t}} ={-} ({\phi _f}{\rho _f})\boldsymbol{\nabla }\boldsymbol{\cdot }{\boldsymbol{u}_f},\end{gather}
 \begin{gather}\frac{{\textrm{d}{\boldsymbol{u}_f}}}{{\textrm{d}t}} = \frac{1}{{{\phi _f}{\rho _f}}}\boldsymbol{\nabla }\boldsymbol{\cdot }({\phi _f}{\boldsymbol{\tau }_f}) + \boldsymbol{g} + \frac{1}{{{\phi _f}{\rho _f}}}\boldsymbol{\nabla }\boldsymbol{\cdot }{\bf (}{\phi _f}\boldsymbol{\tau }_f^t{\bf )} - \frac{1}{{{\rho _f}}}\boldsymbol{\nabla }{p_f} - \frac{\boldsymbol{F}}{{{\phi _f}{\rho _f}}}.\end{gather}
In the equations,  ${\rho _f}$,
 ${\boldsymbol{u}_f}$ and
 ${\phi _f}$ are respectively the density, velocity and volumetric fraction of the fluid phase; and
 ${\boldsymbol{\tau}_f}$ and
 $\boldsymbol{\tau }_f^t$ are the kinetic and the turbulent shear stresses of the fluid phase, respectively. The other notations have the same meaning as in § 2. For any physical variable X,
 $\textrm{d}X/\textrm{d}t = \partial X/\partial t + ({\boldsymbol{u}_f}\boldsymbol{\cdot }\boldsymbol{\nabla })X$. This indicates that the velocity of a SPH particle is set to be the same as the fluid velocity it carries. When concerning saturated granular flows, we have
 ${\phi _s} + {\phi _f} = 1$.
The constitutive law integrating the present dilatation/contraction formulation is used to determine the inter-grain stress of the solid phase as
 \begin{align}{\boldsymbol{\sigma }_s} & = 2{\rho _s}{\nu _s}{\boldsymbol{S}_s} - {p_s}\boldsymbol{I} = 2{\rho _s}{\nu _s}{\boldsymbol{S}_s}\nonumber\\ & \quad - \left\{ {p_{s0}^e\,\textrm{exp}\left[ {{c_1}K\dfrac{{\chi {\phi_s}}}{{{\phi_s} - {\phi_ \ast }}}({\phi_s} - {\phi_c})I_d^{{c_2}}} \right] + 2{{\left( {\dfrac{{{c_3}{\phi_s}}}{{{\phi_0} - {\phi_s}}}} \right)}^2}({{\rho_f}{\nu_f} + 2{c_4}{\rho_s}d_s^2||{{\boldsymbol{S}_s}} ||} )||{{\boldsymbol{S}_s}} ||} \right\}\boldsymbol{I}, \end{align}
 \begin{align}{\nu _s} &= \frac{{\mu {p_s}}}{{2{\rho _s}||{{\boldsymbol{S}_s}} ||}},\end{align}
and
 \begin{equation}\mu = {\mu _1} + \frac{{{\mu _2} - {\mu _1}}}{{1 + \sqrt {{I_0}/{I_m}} }}.\end{equation}
The combined dimensionless number for immersed granular flows,  ${I_m}$, is calculated by (3.18), which is recalled here as
 \begin{equation}{I_m} = \frac{{2||{{\boldsymbol{S}_s}} ||({\rho _f}{\nu _f} + 2{c_4}{\rho _s}d_s^2||{{\boldsymbol{S}_s}} ||)}}{{{p_s}}}.\end{equation}
Here  ${\boldsymbol{S}_s}$ is defined as in (2.4) and
 $||{{\boldsymbol{S}_s}} ||= \sqrt {{\boldsymbol{S}_s}:{\boldsymbol{S}_s}/2}$. The notations have the same meaning as in §§ 2 and 3. The frictional solid pressure without the dilatation/contraction effect
 $p_{s0}^e$ can be determined by (3.7), which is a general form of the existing formulae for
 $p_{s0}^e$. However, for comparison with the model of Shi et al. (Reference Shi, Si, Dong and Yu2019) excluding the frictional dilatation/contraction effect, the formula of
 $p_{s0}^e$ adopted in Shi et al. (Reference Shi, Si, Dong and Yu2019) is also used in this section. It is shown as
 \begin{equation}p_{s0}^e = \left\{ {\begin{array}{@{}ll} {G{{({\phi_s} - {\phi_ \ast })}^\chi }\left[ {1 + \sin \left( {\dfrac{{{\phi_s} - {\phi_ \ast }}}{{{\phi^ \ast } - {\phi_ \ast }}}\pi - \dfrac{\pi }{2}} \right)} \right]}&{{\phi_s} \gt {\phi_ \ast }}\\ 0&{{\phi_s} \le {\phi_ \ast }} \end{array}} \right.,\end{equation}
where  ${\phi ^ \ast }$ is the random close-packing volume fraction of the granular assembly. The difference between (5.9) and (3.7) is simply the inclusion of the volume fraction
 ${\phi _s}$ for the compressibility of grains. This inclusion only leads to a minor difference in the values of
 $\chi $ and has no notable effect on the results.
The stress of the solid phase induced by interstitial fluid turbulence  $\boldsymbol{\sigma }_s^t$ is usually neglected in subaerial granular flows. In submerged cases, it is expressed as
 \begin{equation}\boldsymbol{\sigma }_s^t = 2{\rho _s}\nu _s^t{\boldsymbol{S}_s} - p_s^t\boldsymbol{I},\end{equation}
in which  $\nu _s^t$ and
 $p_s^t$ are respectively the turbulent viscosity and pressure of the solid phase, which indicate the effects of interstitial fluid turbulence on grains. In dense granular flows,
 $p_s^t$ is generally much smaller than
 ${p_s}$ and can therefore be neglected (Bouchut et al. Reference Bouchut, Fernández-Nieto, Mangeney and Narbona-Reina2016; Baumgarten & Kamrin Reference Baumgarten and Kamrin2019). The turbulent viscosity
 $\nu _s^t$ is estimated by the Smagorinsky turbulence model in (5.13).
The kinetic and the turbulent shear stresses of the fluid phase are formulated as
 \begin{equation}{\boldsymbol{\tau }_f} = 2{\rho _f}{\nu _f}{\boldsymbol{S}_f},\end{equation}
and
 \begin{equation}\boldsymbol{\tau }_f^t = 2{\rho _f}\nu _f^t{\boldsymbol{S}_f},\end{equation}
where  ${\nu _f}$ is the fluid kinematic viscosity and
 $\nu _f^t$ is the turbulent viscosity of the fluid phase. Here
 $\nu _f^t$, together with the turbulent solid viscosity
 $\nu _s^t$, is estimated by the Smagorinsky model proposed in Dalrymple & Rogers (Reference Dalrymple and Rogers2006) but integrated with a modification for the turbulence damping by solid particles. It is shown as
 \begin{equation}\nu _k^t = 2{({C_{S,k}}\mathrm{\Delta })^2}||{{S_k}} ||{\left( {1 - \frac{{{\phi_s}}}{{{\phi^ \ast }}}} \right)^n},\end{equation}
in which the subscript  $k = f,\,s$;
 $\mathrm{\Delta }$ is the size of the SPH particles;
 ${C_{S,k}}$ is the Smagorinsky coefficient and, in this paper, we set
 ${C_{S,f}} = {C_{S,s}} = 0.1$; and the index n is for the effects of turbulence damping by solid particles and
 $n = 5$ is adopted according to Chen et al. (Reference Chen, Li, Niu, Chen and Yu2011) and Shi et al. (Reference Shi, Si, Dong and Yu2019).
In submerged dense granular flows, the inter-phase force  $\boldsymbol{F}$ can be simplified to include only the drag force that is predominant. The formula proposed by Gidaspow (Reference Gidaspow1994) is adopted to estimate the drag force as
 \begin{equation}\boldsymbol{F} = {\phi _s}\beta ({\boldsymbol{u}_f} - {\boldsymbol{u}_s}),\end{equation}
where
 \begin{equation}\beta = \left\{ {\begin{array}{@{}ll} {\dfrac{3}{4}{C_D}\dfrac{{{\rho_f}|{{\boldsymbol{u}_f} - {\boldsymbol{u}_s}} |}}{{{d_s}}}\phi_f^{ - 1.65}}&{{\phi_s} \le 0.2}\\ {150\dfrac{{{\phi_s}{\rho_f}{\nu_f}}}{{{\phi_f}d_s^2}} + 1.75\dfrac{{{\rho_f}|{{\boldsymbol{u}_f} - {\boldsymbol{u}_s}} |}}{{{d_s}}}}&{{\phi_s} \gt 0.2} \end{array}} \right.\end{equation}
and
 \begin{equation}{C_D} = \left\{ {\begin{array}{@{}ll} {\dfrac{{24}}{{R{e_s}}}(1.0 + 0.15Re_s^{0.687})}&{R{e_s} \lt 1000}\\ {0.44}&{R{e_s} \ge 1000} \end{array}} \right..\end{equation}
Here  ${C_D}$ is the drag coefficient and
 $R{e_s}$ is the particle Reynolds number, defined by
 $R{e_s} \equiv {\phi _f}|{\boldsymbol{u}_f} - {\boldsymbol{u}_s}|{d_s}/{\nu _f}$. The term
 $|{\boldsymbol{u}_f} - {\boldsymbol{u}_s}|$ is the norm of the relative velocity between the two phases.
In the WCSPH method, the fluid is assumed to be weakly compressible and thus  ${\rho _f}$ is not a constant. Hence, one more equation is required to complete the model. The equation of state proposed by Shi et al. (Reference Shi, Yu and Dalrymple2017) is used to relate the fluid pressure
 ${p_f}$ in the solid–liquid mixture to the variable fluid density, shown as
 \begin{equation}{p_f} = \frac{{{\rho _{f0}}c_0^2}}{\xi }\frac{{{\phi _f}{\rho _f} + {\phi _s}{\rho _{f0}}}}{{{\phi _f}{\rho _f}}}\left[ {{{\left( {\frac{{{\phi_f}{\rho_f} + {\phi_s}{\rho_{f0}}}}{{{\rho_{f0}}}}} \right)}^\xi } - 1} \right],\end{equation}
where  ${\rho _{f0}}$ is the reference density of the fluid when
 ${p_f} = 0$;
 $\xi $ is a material parameter; and
 ${c_0}$ is the speed of sound in the fluid at the reference density. Usually, for numerical stability, a value of ten times the maximum flow velocity in the problem is adopted. In the present simulations of submerged granular column collapse,
 $\xi = 7$ and
 ${c_0} = 25\;\textrm{m}\;{\textrm{s}^{ - 1}}$ are set for the viscous liquid used in the experiments.
5.2. Model parameter characterizing the frictional dilatation/contraction
Rondon et al. (Reference Rondon, Pouliquen and Aussillous2011) conducted a well-known experiment of submerged granular column collapse in a viscous fluid using an experimental set-up as illustrated in figure 5. The experimental flume had a length of 70 cm, a width of 15 cm and a height of 15 cm, and was filled with liquid having a density of  ${\rho _f} = 1.0\;\textrm{g}\;\textrm{c}{\textrm{m}^{ - 3}}$ and a kinematic viscosity of
 ${\nu _f} = 1.2 \times {10^{ - 5}}\;{\textrm{m}^2}\;{\textrm{s}^{ - \textrm{1}}}$ to a depth of
 $H = 15\;\textrm{cm}$. Initially, the granular column was confined by a removable gate at the left end of the flume. The column was composed of glass beads of density
 ${\rho _s} = 2.5\;\textrm{g}\;\textrm{c}{\textrm{m}^{ - 3}}$, mean diameter
 ${d_s} = 225\;\mathrm{\mu m}$ and internal friction angle
 $\varphi = 20.0^\circ $. The horizontal and the vertical directions were respectively defined as x and z. The columns were well prepared to a finite packing fraction, being in either loosely packed or densely packed states. In the cases studied in this paper, the columns had a fixed width of 6 cm in the x direction and the initial depth of the columns h varied. In the loosely packed case,
 $h = 4.8\;\textrm{cm}$ and the initial mean volume fraction of the column was
 ${\bar{\phi }_s} = 0.55$. In the densely packed case,
 $h = 4.2\;\textrm{cm}$ and
 ${\bar{\phi }_s} = 0.60$. A slight variation of the volume fraction over the depth, owing to gravity, existed in the columns but only the depth-averaged value was measured. A critical volume fraction of dilatancy
 ${\phi _{{c_0}}} = 0.58$ was observed in the measured data, around which there was a transition in the behaviours between the loosely and the densely packed columns (Rondon et al. Reference Rondon, Pouliquen and Aussillous2011). Once the gate was suddenly removed (in less than 0.1 s), the column collapsed.
Schematic representation of the experimental set-up of Rondon et al. (Reference Rondon, Pouliquen and Aussillous2011), also showing the profiles of the initial solid volume fraction in the loosely and densely packed columns, the linear profile of inter-grain pressure  ${p_s} = p_s^e = p_{s0}^e$ in the initially static columns, and the hydrostatic profile of fluid pressure
 ${p_f}$.

To simulate a problem such as submerged granular column collapse, especially its time evolution process, it is essential to determine the initial conditions of all necessary variables as closely as possible. As the initial inter-grain pressure in the static columns  ${p_s} = p_s^e = p_{s0}^e$ is to resist the immersed weight of grains, initial values of
 $p_{s0}^e$ must satisfy the static condition and have an almost linear distribution over the depth. Once the collapse starts, the frictional inter-grain pressure may increase or decrease owing to the rearrangement of contact force chains, which leads to the frictional dilatation or contraction of the granular assembly and distinct collapsing behaviours. However, in previous work on this problem (Lee & Huang Reference Lee and Huang2018; Si, Shi & Yu Reference Si, Shi and Yu2018), the static condition for initial inter-grain pressure was not met and the model parameters in the formulae of
 $p_{s0}^e$ were determined through only matching the computed and measured collapsing behaviours of the columns. The change in frictional inter-grain pressure arising from the rearrangement of contact force chains that leads to the dilatation/contraction of the granular assembly was not considered in previous models. As a result, in their models, the initial values of inter-grain pressure in the stationary loosely packed column were smaller while those in the stationary densely packed column were much greater than the static immersed weight of the grains. Indeed, the initial inter-grain pressure to balance the immersed weight of the static loosely packed and densely packed columns is close as the original heights of the two columns are similar with
 $h = 4.8\;\textrm{cm}$ in the loosely packed case and
 $h = 4.2\;\textrm{cm}$ in the densely packed case. The reason for the similar initial inter-grain pressure in the two columns with essentially different porosities is the difference in the arrangement of contact-force chains among the solid grains. Therefore, the parameter
 $\chi $ in the formula of
 $p_{s0}^e$ that characterizes the effect of the arrangement of contact-force chains on the frictional solid pressure has different values in the two cases. Once the column collapses,
 $\chi $ adjusts according to the proposed
 $\varDelta \chi $ in (3.9), which leads to a change in the frictional solid pressure and the frictional dilatation/contraction of granular columns.
The parameters  ${\phi _ \ast } = 0.540$ and
 ${\phi ^ \ast } = 0.625$ are chosen so that all the values of the prepared packing fraction in the experiment are in the range of
 ${\phi _ \ast }\sim {\phi ^ \ast }$. The compressibility coefficient G for glass beads is
 ${10^9}\;\textrm{Pa}$. To achieve a linear profile of initial inter-grain pressure in the static columns, i.e.
 ${ {{p_s}(z)} |_{t = 0}} = p_{s0}^e(z) = ({\rho _s} - {\rho _f})g(h - z)$, the initial volume fraction is set to slightly vary vertically but have the same mean value with the experimental setup. The value of
 $\chi $ is determined carefully so that the initial
 ${\phi _s}$ varies in a narrow range. For the loosely packed case,
 $\chi $ is set to be
 $\chi = 2.64$ and the initial volume fraction increases from
 ${\phi _s} = 0.546$ on the surface to
 ${\phi _s} = 0.552$ at the bottom with a vertical average value of
 ${\bar{\phi }_s} = 0.550$. For the densely packed case,
 $\chi = 5.50$ is set and the initial
 ${\phi _s}$ increases from
 ${\phi _s} = 0.579$ downwards to
 ${\phi _s} = 0.607$ with an average value of
 ${\bar{\phi }_s} = 0.599$. The profiles of the initial volume fraction and the initial solid pressure are shown in figure 5.
The coefficients in (5.5) for the frictional solid pressure are set to be  ${c_1}K = 2.5$ and
 ${c_2} = 0.10$ according to the model calibrations. The parameter K of the used granular material was not measured in the experiment. In the simulations,
 ${c_1}K$ is taken as a single parameter. The other coefficients in the model are determined following a sensitivity study given in appendix C with
 ${c_3} = 2.50$,
 ${c_4} = 0.10$ and
 ${\phi _0} = 0.610$ for the collisional solid pressure in (5.5); and
 ${\mu _2} = 0.8$ and
 $\sqrt {{I_0}} = 0.005$ for the friction coefficient in (5.7). Values of all the material and the adjustable parameters are summarized in table 1.
The proposed model was numerically implemented on the basis of the open-source weakly compressible SPH-package GPUSPH (Hérault, Bilotta & Dalrymple Reference Hérault, Bilotta and Dalrymple2010). The computational domain was represented by 111 192 SPH particles, which had an initial size of  $\mathrm{\Delta } = 0.002\;\textrm{m}$. The fixed time step of the simulations was
 $\varDelta t = {10^{ - 5}}\;\textrm{s}$. The parallel computations were conducted on a Nvidia Tesla K40c CUDA-enabled graphics processing units card, which had 2880 processor cores and a compute capability of 3.5. It took approximately 4.2 h of computational time to simulate 4 s of the column collapse.
5.3. Column profiles and pore-pressure feedback
Figures 6 and 7 show the comparisons between the computed column profiles and the measured data in the loosely packed and the densely packed cases, respectively. Results computed by the present model, which includes both the frictional and the collisional dilatation/contraction effects, and by the model of Shi et al. (Reference Shi, Si, Dong and Yu2019), which does not account for the frictional dilatation/contraction effect, are presented together for comparison. The coefficients in the two models were the same. In both cases, there was a general agreement between the column profiles computed by the present model with the experimental data, especially a good agreement in the final depositions. For the loosely packed case, once the gate was removed, the whole upper part of the column crashed down immediately. The flow front moved rapidly and then stopped in 4 s at  $x = 22.1\;\textrm{cm}$, which resulted in a long runout distance. The final deposition of the column was triangular. For the densely packed case, only grains at the right edge of the column fell freely after the gate was removed, while most of the column remained static. The collapse went inward with time and the flow front moved forward smoothly. The flow front stopped at
 $x = 12.0\;\textrm{cm}$ and the collapse process was complete in 33 s with a trapezium-shaped final deposition. The present model clearly captured the distinct behaviours of the initially loosely and densely packed columns, while the model of Shi et al. (Reference Shi, Si, Dong and Yu2019), without accounting for the frictional dilatation/contraction effect, failed. The model of Shi et al. (Reference Shi, Si, Dong and Yu2019) produced similar results for the two cases, in which the collapse of the loosely packed column was much slower, while that of the densely packed column was slightly quicker than the corresponding results from the present model. The comparisons between the results of the two models demonstrate the importance of the frictional dilatation/contraction effect and the predicative capability of the present model integrating the proposed dilatation/contraction formulation.
Comparisons between the computed and the measured column profiles in the loosely packed case. The black dotted lines represent the initial profile of the column. The present model considers the frictional dilatation/contraction effect while the model of Shi et al. (Reference Shi, Si, Dong and Yu2019) does not. The magenta short-dotted curves are the column profiles computed by the model of Baumgarten & Kamrin (Reference Baumgarten and Kamrin2019), abbreviated as ‘B & K (2019)’ in the figure for brevity, which also takes the dilatation/contraction into account.

Comparisons between the computed and the measured column profiles in the densely packed case. The black dotted lines represent the initial profile of the column. The present model considers the frictional dilatation/contraction effect while the model of Shi et al. (Reference Shi, Si, Dong and Yu2019) does not. The magenta short-dotted curves are the column profiles computed by the model of Baumgarten & Kamrin (Reference Baumgarten and Kamrin2019), abbreviated as ‘B & K (2019)’ in the figure for brevity, which also takes the dilatation/contraction into account.

Another notable phenomenon resulting from the dilatation/contraction of submerged granular collapse is the change of pore pressure in the column. Rondon et al. (Reference Rondon, Pouliquen and Aussillous2011) reported that the pore pressure at the bottom of the granular column increased and decreased quickly in the loosely and the densely packed cases, respectively, once the collapse began. In the present two-phase model, the pore-pressure feedback in dilatation/contraction is implicitly taken into account by coupling the controlling equations of the two phases through the drag force and the constant total volumetric fraction. In the collapse of immersed granular columns, the rearrangement of contact-force chains induces a variation of inter-grain frictional stress, which further leads to an expansion/contraction of the solid phase and hence a relative motion between the solid and the liquid phases. In the case of dilatation, the expansion of the solid phase results in an increase in the column porosity and the liquid phase is pulled by the inter-phase drag force to expand, both of which induce a decrease in the pore pressure. Conversely, in the case of contraction, the pore pressure increases, owing to a decrease in the column porosity and a squeeze on the liquid phase by the drag force. Figure 8 shows the computed excess fluid pressure in the experimental domain at the early stage of the collapse. Figures 8(a) and 8(c) show that the pore pressure in the granular column computed by the present model increases in the loosely packed case but decreases in the densely packed case, which is consistent with the experimental observations. In figures 8(b) and 8(d), values of the excess pore pressure computed by the model without the frictional dilatation/contraction effect are negative in both the loosely and the densely packed cases, which differs markedly from the measurements. Hence, it is verified in figure 8 that the pore-pressure feedback can be reasonably captured by the present two-phase model integrating the proposed frictional dilatation/contraction formulation.
Computed excess fluid pressure by the present model (with the frictional dilatation/contraction) and the model of Shi et al. (Reference Shi, Si, Dong and Yu2019) (without the frictional dilatation/contraction). The black solid curves in the liquid represent the computed column profiles.

The computed variations of excess pore pressure and solid volume fraction at Point A (shown in figure 5) by the present model are given in figure 9. In the loosely packed case, the pore pressure increases rapidly once the column collapses and the maximum value of the computed excess pore pressure is approximately 210 Pa, which is slightly larger than the available measured data. In the densely-packed case, the pore pressure initially decreases significantly and then the excess pore pressure relaxes to zero. In both cases, the computed relaxation time by the present model is shorter than that observerd from the experimental results, especially in the loosely packed case. It should be noted that the fluctuations in the pressure are caused by the WCSPH numerical method itself. Figure 9 also shows that the solid volume fraction at Point A in the loosely packed case increases slightly and the fraction in the densely packed case decreases, which correspond respectively to the contraction and the dilatation of the columns.
Variations of excess pore pressure and solid volume fraction at Point A. The position of Point A is shown in figure 5. The magenta dotted curves are for the results computed by the model of Baumgarten & Kamrin (Reference Baumgarten and Kamrin2019), abbreviated as ‘B & K (2019)’ in the figures for brevity.

For further investigations on the performance of the proposed dilatation/contraction formulation, figures 6, 7 and 9 also compare the computed results by the present model with those by the model of Baumgarten & Kamrin (Reference Baumgarten and Kamrin2019). In their plastic constitutive law of granular materials, Baumgarten & Kamrin (Reference Baumgarten and Kamrin2019) integrated the dilatancy effect by adding a term of solid volumetric change to the plastic strain rate, which had a more complicated form than the present formulation. Figures 6 and 7 show that in the early stage of collapse, the computed column height by the present model agrees better with the measured data while the computed front position by Baumgarten & Kamrin (Reference Baumgarten and Kamrin2019) fits the data better. In both figures, the final deposition of the columns computed by the present model compares much better with the experimental observations. Figure 9, together with figure 14(a) of Baumgarten & Kamrin (Reference Baumgarten and Kamrin2019), shows that their model performs better in describing the variation of pore pressure even though there was a violent fluctuation in their results.
5.4. Discussion
The only difference between the two-phase model in this paper and that of Shi et al. (Reference Shi, Si, Dong and Yu2019) is the integration of the frictional dilatation/contraction effect on the inter-grain pressure. As stated in § 5.2, when simulating the column collapse, Shi et al. (Reference Shi, Si, Dong and Yu2019), like other previous work on granular flow models (such as Lee & Huang Reference Lee and Huang2018), neglected the initial condition for inter-grain pressure and calibrated the model parameters in the formula of  $p_{s0}^e$ according to the collapsing behaviours. When the parameters are set to make sure the initial values of
 $p_{s0}^e$ satisfy the static condition to balance the immersed weight of grains, as done in this paper, the model of Shi et al. (Reference Shi, Si, Dong and Yu2019) without the frictional dilatation/contraction effect fails to reproduce the distinct collapsing behaviours of initially loosely and densely packed columns while the present model succeeds. Therefore, integrating the proposed formulation of the frictional dilatation/contraction effect helps us to capture the column collapse from the initially static state to the final deposition.
It should be noted that there is still room for improvement in the present two-phase model. Figures 6 and 7 show that in the early stage of the collapse, the present model predicts a faster motion of the flow front than the experimental observations. According to the sensitivity study in appendix C, the reason for this faster collapse is probably the underestimation of the collisional solid pressure  $p_s^c$ and the corresponding inter-grain shear resistance. Moreover, the faster collapse at the early stage results in a rapid dissipation of excess pore pressure at the bottom of the column and hence a smaller pore-pressure relaxation time than that observed. Further improvement in the formulation of the collisional solid stresses is required.
The well-posedness of the present two-phase model is required to be further investigated, even though the simulations in this paper are stable. It has been pointed out by Barker et al. (Reference Barker, Schaeffer, Bohorquez and Gray2015, Reference Barker, Schaeffer, Shearer and Gray2017) that the μ(I) rheological model is ill-posed when the inertial number  ${I_i}$ is too high or too low and including compressibility, rate dependence and viscous dissipation could help to stabilize the computation. In the present model, the effect of interstitial fluid viscosity on granular rheology has been integrated and the liquid adopted in the presented experiments of immersed granular column collapse had a high viscosity. It is most likely that the viscous dissipation induced by interstitial liquid makes the present simulations stable.
6. Conclusions
Shear dilatation/contraction plays a significant role in geological granular flows from the initial destabilization to final deposition. Neither the critical state theories in soil mechanics nor the shear-rate-dependent rheological laws are generally applicable to fully describe the dilatancy effects in granular flows at a wide range of shear rates. This paper presents a theoretical description of dilatation/contraction for continuum modelling of granular flows. It is based on the understanding that the dilatancy effects in sheared granular materials consist of a frictional portion, which results from the rearrangement of enduring-contact force chains, and a collisional portion, owing to inter-grain collisions. The frictional dilatation/contraction can be taken into account by the changes in the frictional solid pressure for enduring contacts between grains, while the collisional dilatancy is considered by the shear-rate-dependent collisional solid pressure in rheological laws for granular flows. A new analytical formulation of the frictional solid pressure, which considers the rearrangement of contact force chains under shear deformation, is proposed for the first time in this paper.
The proposed dilatation/contraction formulation accurately captures the shear-weakening behaviour of granular samples in a torsional shear rheometer, and the incipient failure of dry and immersed granular slopes as indicated by the close agreement between its predictions and the measurements. In the former test case, the proposed formulation successfully reproduces the variation of the normal stress on the rheometer top plate with shear rate, i.e. a transition in the state of the normal stress between being constant, dipping and increasing quadratically as the shear rate increases. It maps the variation of the normal stress smoothly between the quasi-static and the inertia regimes. As for the latter test case concerning granular slope failure, the present formulation gives a good prediction of the incipient angle, i.e. the angle of the slope where grains on the surface start to move, of both dry and immersed granular slopes including its dramatic increases with the initial packing fraction owing to the frictional dilatation/contraction. In the latter case, the proposed formulation performs much better than the classical saw model of dilatation/contraction, especially when the granular bed dilates.
Following these analytical validations, the proposed dilatation/contraction formulation is then integrated into a two-fluid continuum model for submerged granular flows, which is applied to simulate the full collapse process of underwater granular columns. Both collapsing column profiles and the excess fluid pressure simulated by the proposed model generally agree well with the measured data. Distinct collapsing behaviours of initially loosely and densely packed columns, with regards to the profile and interstitial fluid pressure owing to the frictional dilatation/contraction, are well reproduced. The model without the frictional dilatation/contraction effect clearly fails to capture the significant influence of the initial packing fraction on the collapse. Integrating the proposed frictional dilatation/contraction formulation helps us capture the column collapse from the initially static state to the final deposition.
Funding
This work was supported by the Science and Technology Development Fund, Macau SAR (File no. SKL-IOTSC-2021-2023), a UK EPSRC grant (EP/R02491X/1), Open Research Fund Program of State Key Laboratory of Hydroscience and Engineering (sklhse-2019-B-01), and a Start-up Research Grant of University of Macau (File no. SRG2020-00023-IOTSC).
Declaration of interests
The authors report no conflict of interest.
Appendix A
A preliminary analysis on the magnitude of the shear strain  ${\gamma _ \ast }$ is presented here.
Combining (3.5), (3.10) and (3.11), the non-dimensional change of frictional solid pressure arising from the rearrangement of contact force chains under shear strain  ${\gamma _ \ast }$ can be expressed as
 \begin{equation}\frac{{\varDelta p_s^e}}{{p_{s0}^e}} = \exp \left[ {K\chi \frac{{{\phi_s}({\phi_s} - {\phi_c})}}{{{\phi_s} - {\phi_ \ast }}}{\gamma_ \ast }} \right] - 1,\end{equation}
when  ${\phi _s} \gt {\phi _ \ast }$. Generally, the material parameter for dilatancy K has a value in the range of 1.0–25.0 and an order of
 $O(10)$ (see Pailha & Pouliquen Reference Pailha and Pouliquen2009; Bonnet et al. Reference Bonnet, Richard and Philippe2010; Gravish & Goldman Reference Gravish and Goldman2014). The magnitude of
 $\chi $ is between 1.50 and 5.50 (see Hsu et al. Reference Hsu, Jenkins and Liu2004; Lee & Huang Reference Lee and Huang2018). The random loosely packed volume fraction of granular materials
 ${\phi _ \ast } = 0.50\sim 0.59$ and the random closely packed fraction
 ${\phi ^ \ast } = 0.61\sim 0.64$ (van Wachem et al. Reference van Wachem, Schouten, van den Bleek, Krishna and Sinclair2001). The critical volume fraction of dilatancy
 ${\phi _c}$ has a value in the range of
 ${\phi _ \ast }\sim {\phi ^ \ast }$. It is reasonable to expect that the non-dimensional increase of solid pressure in frictional dilatation has an order of
 $O(1)$ and is limited by
 $\mathrm{\Delta }p_s^e/p_{s0}^e \lt 10$. Therefore, according to (A1),
 ${\gamma _ \ast }$ should be of the order of
 $O({10^{ - 2}})\sim O({10^{ - 1}})$.
Specifically, given  $K = 13$,
 $\chi = 3.5$,
 ${\phi _ \ast } = 0.55$ and
 ${\phi _c} = 0.58$, the variations of
 $\varDelta p_s^e/p_{s0}^e$ with the shear strain
 ${\gamma _ \ast }$ in the cases of
 ${\phi _s} = 0.56$ for frictional contraction and
 ${\phi _s} = 0.60$ for frictional dilatation are shown in figure 10. It illustrates that a small shear strain may lead to significant effects of frictional dilatation/contraction, which is consistent with the assumption in § 3 that the changes in the frictional solid pressure arising from rearrangement of contact force chains occur in a very short duration and the process can be regarded as transient in a continuum description.
Variations of changes in frictional solid pressure  $p_s^e$ versus the shear strain
 ${\gamma _ \ast }$. The dark grey area indicates the case of dilatation and the light grey area is the case of contraction.

The shear strain  ${\gamma _ \ast }$ increases with the dimensionless shear rate
 ${I_d}$, which is defined as
 ${I_d} \equiv 2{d_s}||{{\boldsymbol{S}_s}} ||/\sqrt {p_{s0}^e/{\rho _s}} $ in (3.13) and can also represent a shear strain being the product of the temporal period of microscopic rearrangement of contact force chains and the rate of macroscopic deformation. However,
 ${\gamma _ \ast }$ and
 ${I_d}$ are not the same. As shown by Lu et al. (Reference Lu, Brodsky and Kavehpour2007) and Chialvo et al. (Reference Chialvo, Sun and Sundaresan2012), in granular media, where the inter-grain frictional contacts predominates,
 ${I_d}$ has a value of
 $O({10^{ - 6}}) \sim O({10^{ - 1}})$. The orders of
 ${\gamma _ \ast }$ and
 ${I_d}$ are distinct, and generally
 ${\gamma _ \ast }$ has a larger order.
To relate the frictional solid pressure to the shear rate of granular flows, a simple power relation, i.e. (3.14), is proposed for  ${\gamma _ \ast }$, which is rewritten here as
 \begin{equation}{\gamma _ \ast } = {c_1}{({I_d})^{{c_2}}}.\end{equation}
As the order of  ${\gamma _ \ast }$ is generally larger than that of
 ${I_d}$ and
 ${I_d} \lt 1$,
 ${c_2}$ should be in the range of
 $0 \lt {c_2} \lt 1$. The coefficient
 ${c_1}$ needs to be determined based on the order of
 ${({I_d})^{{c_2}}}$ and should be in the range of
 $0\sim O(10)$.
Appendix B
A validation of the two-phase SPH model in bed-load transport by laminar Poiseuille flow against the analytical solution of Ouriemi, Aussillous & Guazzelli (Reference Ouriemi, Aussillous and Guazzelli2009) is conducted.
In bed-load transport by laminar shear flow, the solid particles stay in continuous or intermittent contact with neighbouring grains in the bed (Aussillous et al. Reference Aussillous, Chauchat, Pailha, Médale and Guazzelli2013) and the frictional inter-grain stresses predominate in the motion of the particles. Ouriemi et al. (Reference Ouriemi, Aussillous and Guazzelli2009) applied a continuum model to describe the bed-load transport in the laminar viscous regime and obtained an analytical solution of the flow field for an undisturbed Poiseuille flow. It was found that the two-phase flow could be separated into four regions vertically with respect to the profiles of the flow velocity. Region I corresponded to the pure fluid above the bed ( ${h_p} \le z \le H$ with
 ${h_p}$ being the bed height and H the full height of the two-phase flow), in which the profile of fluid velocity approached that of the Poiseuille flow. Region IV was the immobile bed layer (
 $0 \le z \le {h_c}$ with
 ${h_c}$ the height of the static layer), where the velocities of both solid and fluid phases were zero. Regions II and III were mobile bed layers in which the slip between the two phases was small and neglected in the analytical solution. Region III
 $({h_c} \le z \le {h_p} - {d_s})$ had a parabolic distribution of flow velocity and a negligible variation of porosity along the vertical direction. Region II (
 ${h_p} - {d_s} \le z \le {h_p}$) was a transition layer between region I and region III.
The present two-phase SPH model was applied to simulate the flow velocity profiles in the experiments of laminar bed-load transport conducted by Ouriemi et al. (Reference Ouriemi, Aussillous and Guazzelli2009). The fluid had a density of  ${\rho _f} = 1.038\;\textrm{g}\;\textrm{c}{\textrm{m}^{ - 3}}$ and a viscosity of
 ${\nu _f} = 3.56 \times {10^{ - 5}}\;{\textrm{m}^2}\;{\textrm{s}^{ - 1}}$. Two kinds of solid particles were used, i.e. glass grains with
 ${\rho _s} = 2.490\;\textrm{g}\;\textrm{c}{\textrm{m}^{ - 3}}$ and
 ${d_s} = 132\;\mathrm{\mu m}$, and light polymethyl methacrylate (PMMA) grains with
 ${\rho _s} = 1.177\;\textrm{g}\;\textrm{c}{\textrm{m}^{ - 3}}$ and
 ${d_s} = 193\;\mathrm{\mu m}$. The full height of the two-phase flow was
 $H = 30\;\textrm{mm}$ and the bed height was
 ${h_p} = 15\;\textrm{mm}$. For simplicity of numerical implementations, rather than keeping a constant flow rate, as done in the experiments, we imposed a pressure on the flow with a fixed gradient of
 $- (\partial {p_f}/\partial x)/{\rho _f} = 0.05\;\textrm{m}\;{\textrm{s}^{ - 2}}$ and solved the steady velocity profile under the pressure. Accordingly, a periodic boundary condition was applied in the longitudinal direction. The imposed pressure gradient led to a Shields number of about
 $\theta = 0.21$ for the case with glass particles and
 $\theta = 1.45$ for the case with light PMMA particles. As the flow was in the viscous laminar regime, the stresses of the two phases arising from fluid turbulence, i.e.
 $\boldsymbol{\sigma }_s^t$ in (5.10) and
 $\boldsymbol{\tau }_f^t$ in (5.12), vanished and hence the Smagorinsky coefficients in (5.13) were set to be zero. According to the experimental configurations in Ouriemi et al. (Reference Ouriemi, Aussillous and Guazzelli2009), a random closely packed volume fraction of
 ${\phi ^ \ast } = 0.610$ and a random loosely packed volume fraction of
 ${\phi _ \ast } = 0.550$ were set for both cases. The compressibility coefficient of glass grains is
 $G = {10^9}\;\textrm{Pa}$ while that for PMMA particles is
 $G = {10^8}\;\textrm{Pa}$. Values of the coefficient
 $\chi $ were carefully determined so that the initial inter-grain pressure in the bed had a vertically linear profile, which satisfied the static condition, and the porosity of the bed had a minor variation from the mean amount. In the simulations,
 $\chi = 4.85$ was set for the glass grains and
 $\chi = 4.87$ for the light PMMA particles. Initially, the mean porosities of the bed in both cases were 0.415. The other model parameters had the same values in both cases. The frictional dilatation/contraction effect on inter-grain stresses was excluded in this problem as there was no experimental evidence for it, and it was also not considered in the analytical solution. Hence, in (5.5),
 ${c_1}K = 0$ and
 ${c_2} = 1.0$ were set. The friction coefficients
 ${\mu _1} = 0.43$ and
 ${\mu _2} = 0.82$ as well as
 $\sqrt {{I_0}} = 0.01$ were adopted as suggested in Ouriemi et al. (Reference Ouriemi, Aussillous and Guazzelli2009). A jamming fraction of
 ${\phi _0} = 0.610$ was selected in the range of
 ${\phi _ \ast } \sim {\phi ^ \ast }$. The coefficients
 ${c_3} = 1.00$ and
 ${c_4} = 0.10$ were determined following a sensitivity study of the velocity profiles. It was shown in the sensitivity study that altering the values of
 ${\phi _0}$,
 ${c_3}$ or
 ${c_4}$ led to a negligible change in the velocity profiles, especially in the case of glass beads. This conclusion is consistent with the fact that the frictional inter-grain stresses predominate in the bed-load transport by laminar shearing flows while the collisional solid stresses play a minor role. In the simulations, the entire two-phase flow was represented by a set of SPH particles having an initial size of
 ${\varDelta _p} = 1\;\textrm{mm}$.
The computed steady profiles of fluid and solid velocities in the Poiseuille flow were compared with the analytical results in figure 11. Following Ouriemi et al. (Reference Ouriemi, Aussillous and Guazzelli2009), we scaled the length by the full height of the flow, i.e.  $\bar{z} = z/H$,
 ${\bar{h}_p} = {h_p}/H$ and
 ${\bar{h}_c} = {h_c}/H$, and the velocity by
 $({\rho _s} - {\rho _f})g{H^2}/{\rho _f}{\nu _f}$, i.e.
 $\bar{u} = u{\rho _f}{\nu _f}/({\rho _s} - {\rho _f})g{H^2}$. The numerical velocity profiles were in generally good agreement with the analytical results in the two cases with distinct Shields numbers. The present two-phase SPH model, specifically the integrated frictional constitutive law, performed reasonably in describing the contact-dominated bed-load transport by laminar shearing flows. The major difference between the numerical and the analytical results lay in the thickness of the mobile bed layer, which was partly contributed by the numerical diffusion near the bed surface of a SPH method. In the case of glass particles with a small Shields number, the analytical thickness of mobile bed layer
 ${\bar{h}_p} - {\bar{h}_c}$ was approximately one particle diameter, while the numerical value from the present model was more than two times the grain size. In the flow, only one layer of particles on the bed surface moves and the assumption of a continuum description of the solid phase in the present model does not hold for this condition, which was the reason for the error in the numerical results. In the case of PMMA particles with a large Shields number, the present two-phase model performed much better. The analytical thickness of the mobile bed layer
 ${\bar{h}_p} - {\bar{h}_c}$ was more than seven times the particle diameter and the computed value by the present model was very close to the analytical solution. The velocity profiles in regions I, III, and IV were well reproduced (region II was too thin to be visible in the figures). It is shown in more cases with different Shields numbers that, when the thickness of mobile bed is greater than four particle layers, for which the assumption of a continuum modelling of the solid phase holds, the present two-phase SPH model is applicable to bed-load transport by laminar shearing flows.
Comparisons of the numerical velocity profiles for the fluid (blue +) and the solid (green ×) phases by the present two-phase SPH model with the analytical solutions (magenta —) of Ouriemi et al. (Reference Ouriemi, Aussillous and Guazzelli2009). The dimensionless analytical results of the bed height  ${\bar{h}_p} = {h_p}/H$ and the static bed layer height
 ${\bar{h}_c} = {h_c}/H$ are outlined in the figures by dashed lines. Here (a,b) are for the case of glass particles in which the Shields number is approximately
 $\theta = 0.21$, while (c,d) are for the case of light PMMA grains where
 $\theta = 1.45$.

Appendix C
The sensitivities of the computed column profiles by the present model, in the loosely packed case of collapse, to adjustable model parameters and the formulation of inter-phase drag force were studied. Figures 6 and 7 show that in the early stage of motion, the present model predicted a faster collapse than the experimental observations, especially for the loosely packed case.
Table 2 shows the sensitivities of the computed front position and column height at t = 0.66 s in the early stage and t = 3.96 s in the final period of the collapse with respect to adjustable parameters, i.e. the non-material parameters in table 1. For material parameters, the same values as those in § 5 were set. It should be noted that the adjustable parameter  $\chi $ in the formula of
 $p_{s0}^e$ is not included in table 2.
 $\chi $ is determined based on the initial condition for inter-grain pressure in static granular columns and should be fixed for each specific experimental configuration. It shows that the computed column profile is most sensitive to
 ${c_1}$ and
 ${c_2}$ for the frictional dilatation/contraction effect. It is also highly sensitive to
 ${c_3}$ for the collisional solid pressure and less, but still clearly, to
 ${\mu _2}$ and
 ${I_0}$ for friction coefficient. Here
 ${c_4}$ has a negligible effect on the results, which implies that, in the concerned immersed granular columns, the viscous effect of interstitial fluid predominates in inter-grain collisions. With respect to
 ${c_1}$ and
 ${c_2}$, the sensitivities of the column profile at t = 0.66 s are similar to those of the final deposition at t = 3.96 s. However, the sensitivities of the profile at t = 0.66 s to
 ${c_3}$,
 ${\mu _2}$ and
 ${I_0}$ markedly differ from those of the final deposition. Specifically, with respect to the three parameters, the sensitivities of the column heights at t = 0.66 s and t = 3.96 s are comparable while the front position at t = 3.96 s is more sensitive than that at t = 0.66 s. This difference in the sensitivities of the column profiles at t = 0.66 s and t = 3.96 s to the parameters, especially to
 ${c_3}$, makes it very difficult to achieve a good agreement between numerical and experimental results in both the early stage and the final period of the collapse. In § 5, the present model is calibrated primarily against the final deposition and the error in column profiles at the early stage of collapse is left unaddressed. An underestimation of the collisional solid pressure and the corresponding inter-grain shear resistance is likely the reason for the computed faster collapse in the early stage.
Sensitivities of the computed front position and column height in the loosely packed case by the present model with respect to adjustable parameters.

The sensitivity of the computed column profile to the formulation of inter-phase drag force was briefly examined to determine whether the reason for the computed quicker collapse in the early stage is an underestimation of the drag force. In the present model, the well-verified drag force model A of Gidaspow (Reference Gidaspow1994) was used, expressed as (5.14)–(5.16). Here, we denote the coefficient  $\beta $ in (5.14) as
 ${\beta _A}$. Taking the pressure drop of two-phase flows only in the liquid phase, Gidaspow (Reference Gidaspow1994) also proposed a model B for the drag force, in which the coefficient
 $\beta $ was denoted as
 ${\beta _B}$ and
 ${\beta _B} = {\beta _A}/{\phi _f}$. As in immersed granular flows the volumetric fraction of the liquid phase
 ${\phi _f}$ always complies with
 $0 \lt {\phi _f} \le 1$,
 ${\beta _B}$ cannot be smaller than
 ${\beta _A}$ and hence model B gives a larger inter-phase drag force than model A. The computed profiles in the loosely packed case by the present model with
 ${\beta _A}$ and the model with
 ${\beta _B}$ are compared in figure 12. At t = 0.22 s, specifically during 0–0.44 s before the thin-layer surge front appears, results of the two models were almost the same. At t = 0.66 s when the surge front of the column spreads, the collapse computed by the model with
 ${\beta _B}$ was slightly quicker than that by the present model. The difference between the column profiles increased with time and was notable at t = 3.96 s, especially in the front position of the column. The result of a larger drag force leading to a farther front position is consistent with the conclusions of Shi et al. (Reference Shi, Si, Dong and Yu2019) and Si et al. (Reference Si, Shi and Yu2018) and can be interpreted in terms of the fact that, in the surge front of the initially loosely packed column, the drag force acts as a driving force and pulls the solid grain forward. It is clearly illustrated that increasing the liquid–solid drag force in the present model cannot slow down the collapse in the early stage, but results in an even quicker propagation of the surge front.
Sensitivities of computed column profiles in the loosely packed case to the formulation of inter-phase drag force. Here  ${\beta _A}$ represents the present model using the model A of drag force in Gidaspow (Reference Gidaspow1994), which is expressed as (5.14)–(5.16). Additionally,
 ${\beta _B}$ represents the two-phase model integrating the model B of Gidaspow (Reference Gidaspow1994), in which
 ${\beta _B} = {{{\beta _A}} / {{\phi _f}}}$.



