







Introduction
As semiconductor technology advances and high-frequency transistors continue to shrink, ensuring precise measurements has become increasingly critical. Reducing device geometries to enhance high-frequency performance also diminishes key electrical parameters – such as capacitance and transit time – making the need for more accurate calibration methods ever more pressing. Any uncorrected or only partially corrected parasitic elements must remain negligible compared to the device’s own parameters for reliable characterization. Although widely adopted, established calibration approaches like SOLT (Short-Open-Load-Thru) and even TRL (Thru-Reflect-Line) are no longer fully adequate to calibrate parasitic effects and inadvertent couplings introduced by RF probes. This mismatch between evolving transistor technologies and conventional measurement methodologies hinders the precise determination of intrinsic parameters, notably the maximum oscillation frequency ( $f_{\max}$), and thus limits accurate assessment of key performance metrics. Characterizing figures of merit (FOMs) in miniaturized transistors becomes particularly problematic especially when
 $f_{\max}$ exceeds a few hundred gigahertz.
An earlier version of this work, focusing on the impact of probe-level leakage on the extraction of  $f_{\max}$ using 16-, 10-, and 8-term on-wafer calibrations up to 330 GHz, was presented at EuMW 2025 and published in its Proceedings [Reference Bouzar, Varghese, Arnould, Zimmer and Fregonese1]. Compared with this preliminary conference paper, the present work provides an extended and systematic comparison of TRL, 8-term, 10-term, and 16-term calibration schemes. In addition to the previously reported impact on transistor FOMs, this paper includes a detailed analysis of passive open/short structures, intrinsic junction capacitances, real and imaginary
 $Y$-parameters, and the frequency-dependent relevance of each group of error terms. The link with the leakage-term analysis reported in [Reference Bouzar2] is also clarified.
As shown in [Reference Fregonese, De Matos, Deng, Céli, Derrier and Zimmer3], both experimental findings and electromagnetic (EM) simulations reveal that, for advanced SiGe heterojunction bipolar transistor (HBT) technologies, the measured  $f_{\max}$ can depend significantly on the specific probe setup. Furthermore, the works in [Reference Nyssens, Ma, Rack, Lederer and Raskin4–Reference Heinemann, Rucker, Barth, Barwolf, Drews, Fischer, Fox, Fursenko, Grabolla, Herzel, Katzer, Korn, Kruger, Kulse, Lenke, Lisker, Marschmeyer, Scheit, Schmidt, Schmidt, Schubert, Trusch, Wipf and Wolansky7] report major difficulties when extracting the Mason gain beyond 40–70 GHz for advanced transistors, making the determination of
 $f_{\max}$ particularly challenging. A primary reason for these issues is that standard calibration techniques fail to properly account for probe-level leakage.
A recent multi-laboratory investigation [Reference Cheron, Miller, Crespo, Williams, Jones, Elliott, Jargon, Gilbert, Jamroz, Shell, Bosworth, Gebara, Jungwirth, Aaen, Long, Orloff, Booth and Feldman8] has systematically examined the influence of probe geometry on measurement accuracy, with particular emphasis on crosstalk. By comparing HBT responses obtained with a conventional 8-term calibration to those corrected for crosstalk using two different probe pairs, the authors show that applying an additional crosstalk-correction step based on a leakage-aware formulation [Reference Williams, Schmuckle, Doerner, Phung, Arz and Heinrich9] can significantly improve the accuracy of transistor characterization. However, this INP HBT study is limited to the 140–220 GHz frequency range and does not explicitly address possible discontinuities at the junction of different frequency bands. In contrast, the approach adopted in this work relies on a single-step calibration applied over the entire 1–325 GHz band, which allows us to directly assess the continuity of the extracted transistor characteristics at the band edges. Recent works by Kanitkar et al. have also addressed on-wafer parasitic effects and 16-term calibration for down-scaled INP HBTs [Reference Kanitkar, Doerner, Johansen, Heinrich and Flisgen10, Reference Kanitkar, Doerner, Johansen, Heinrich and Flisgen11]. In particular, these studies emphasize the influence of residual coupling on Mason’s gain and also consider stepwise removal of leakage-related scattering coefficients. The present work complements these contributions by applying a stepwise reduced-model analysis to SiGe HBT measurements up to 330 GHz, using a direct comparison of TRL, 8-term, 10-term, and 16-term corrections on the same dataset.
In [Reference Fregonese and Zimmer12], applying a 16-term error correction to the same dataset – previously processed using the TRL method – yielded results more consistent with the expected physical behavior of a SiGe HBT, while eliminating discontinuities across frequency bands. However, although the standard 16-term error model proposed in [Reference Fregonese and Zimmer12] has been shown to be effective, the corresponding signal-flow graph topology remains relatively complex to analyze, making it important to gain a deeper understanding of the influence of each coupling term.
In this article, we propose a step-by-step simplification of the 16-term error model. The first simplification removes the six cross-leakage terms while retaining the direct leakage terms at the probe, yielding a 10-term model. The final model under comparison is an 8-term reduced model, which contains the same classes of error terms as the conventional TRL formulation. In contrast to [Reference Liu, Wu, Li and Ridler13], which proposes a 10-term model, and [Reference Wu, Liu, Liang, Zou, Wang, Luan, Li and Ridler14], which outlines a two-step calibration procedure for leaky systems, the methodology here is derived directly from an on-wafer 16-term error calibration and is applied to advanced SiGe bipolar transistors up to 330 GHz. Based on the calibrated  $S$-parameters, we further extract the intrinsic junction capacitances
 $C_{BC}$ and
 $C_{BE}$ using several calibration schemes (on-wafer TRL, 8-term, 10-term, and 16-term), combined with an open/short de-embedding procedure. For the 16-term calibration in particular, we perform a detailed analysis of the corresponding
 $Y$-parameters over frequency and bias, in order to assess the impact of explicitly accounting for all error terms on the intrinsic transistor behavior.
“Theory” section presents the theoretical formulation of the full and reduced error models. “Measurement setup and procedure” section describes the measurement setup and calibration procedure. “Measurement and result analysis” section analyzes the passive structures, transistor  $Y$-parameters, and FOMs up to 330 GHz. Conclusions are given in “Conclusion” section.
Theory
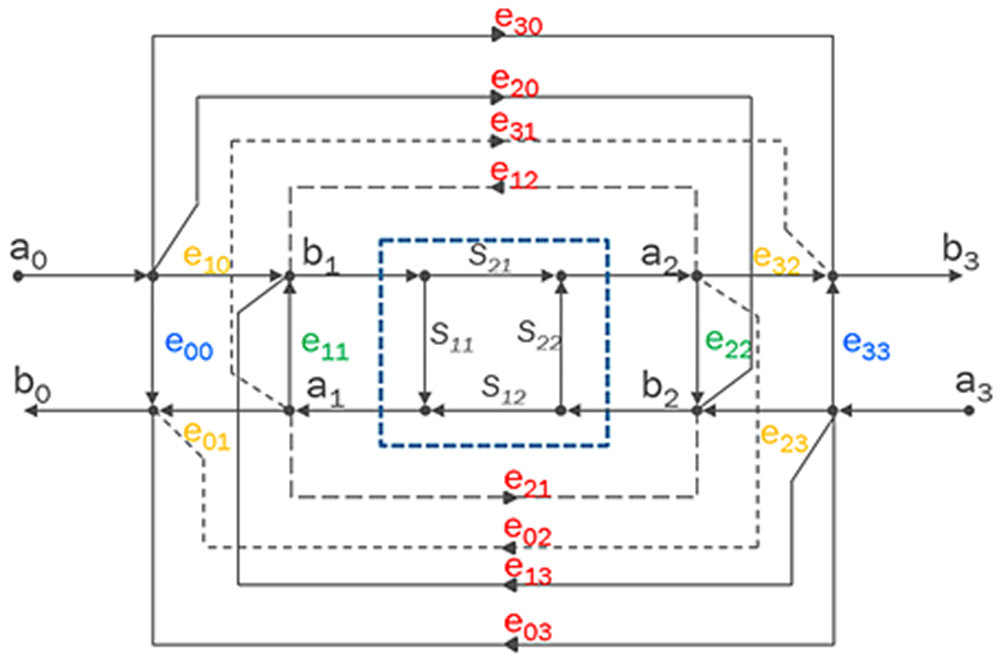
A 16-term error model has been developed in [Reference Silvonen, Dahlberg and Kiuru15, Reference Wang, Fu, Wu, Huo, Liu, Luan, Lei, Liang and Li16] (see Fig. 1). In this model, eight of the errors ( $e_{00}, e_{01}, e_{10}, e_{11}, e_{22}, e_{23}, e_{32}, e_{33}$) are identical to those in the traditional 8-term model used in the TRL. The additional eight terms, however, capture crosstalk between reference planes close to probes (
 $e_{21}$ and
 $e_{12}$), between receivers in the vector network analyzer (VNA) (
 $e_{30}$ and
 $e_{03}$), and between the reference plane close to the microwave probe on one side of the device under test (DUT) and the VNA receiver on the opposite side (
 $e_{02}, e_{20}, e_{31}, e_{13}$).
Flowgraph of full 16-term error model for four-port adapter.

Figure 1 Long description
A 16-term error model for a 4-port adapter. It features four ports labeled a subscript 0, a subscript 1, a subscript 2, a subscript 3 on the left and b subscript 0, b subscript 1, b subscript 2, b subscript 3 on the right. In the center, there are terms S subscript 11, S subscript 12, S subscript 21 and S subscript 22 arranged in a square. Surrounding these are various error terms connected by dashed lines. The error terms e subscript 00, e subscript 01, e subscript 10, e subscript 11, e subscript 22, e subscript 23, e subscript 32 and e subscript 33 are positioned near the ports. Additional error terms e subscript 21, e subscript 12, e subscript 30, e subscript 03, e subscript 02, e subscript 20, e subscript 31 and e subscript 13 are shown connecting different parts of the diagram, indicating crosstalk and other interactions. The connections are represented by lines that link these error terms to the central S terms and the ports, illustrating the complex interactions in the model.
Following the conventional terminology introduced for the 16-term on-wafer error model by Butler et al. [Reference Butler, Rytting, Iskander, Pollard and Bossche17], these terms can be categorized into four groups: port match, directivity, tracking/frequency response, and leakage (see Table 1). In this terminology,  $e_{00}$ and
 $e_{33}$ are called directivity terms because they represent residual signals measured by the reflection receivers due to imperfect separation between incident and reflected waves. The terms
 $e_{11}$ and
 $e_{22}$ describe port-match errors at the internal reference planes, while
 $e_{01}$,
 $e_{10}$,
 $e_{23}$, and
 $e_{32}$ represent the main tracking paths of the measurement system.
Measurement system error types for the 16-term error model

Table 1 Long description
Two columns list error types and their associated error terms in a 16 term model. Error types are port match, directivity, tracking and frequency response, and leakage. Port match includes error terms e eleven one and e twenty two. Directivity includes e zero zero and e thirty three. Tracking and frequency response includes e zero one, e ten, e twenty three, and e thirty two. Leakage includes e thirty, e zero three, e zero two, e twenty, e thirty one, e thirteen, e twenty one, and e twelve.
Hence, the error network is treated as a four-port system, where ports 0 and 3 are connected to an ideal VNA. This four-port network can be characterized by its scattering parameters, which model the non-idealities of the measurement system. Choosing the  $a_i$ waves as the independent variables and the
 $b_i$ waves as the dependent variables leads to the following matrix representation of the 16-term error model:
 \begin{equation*}
\begin{bmatrix}
b_0 \\
b_1 \\
b_2 \\
b_3
\end{bmatrix}
=
\begin{bmatrix}
e_{00} & e_{01} & e_{02} & e_{03} \\
e_{10} & e_{11} & e_{12} & e_{13} \\
e_{20} & e_{21} & e_{22} & e_{23} \\
e_{30} & e_{31} & e_{32} & e_{33}
\end{bmatrix}
\begin{bmatrix}
a_0 \\
a_1 \\
a_2 \\
a_3
\end{bmatrix}.
\end{equation*}
Solving for the error terms directly from the above  $\mathbf{E}$-parameter formulation is rather tedious, since the resulting system of equations is nonlinear with respect to the error terms, even when several coefficients are known to be zero or unity. In this work, we follow the procedure proposed by Butler et al. [Reference Butler, Rytting, Iskander, Pollard and Bossche17], in which the
 $\mathbf{E}$-parameters are converted into cascade
 $\mathbf{T}$-parameters. This transformation yields a set of linear homogeneous equations that are considerably easier to solve. Since this procedure is well established in the literature, it is not described here. Instead, the discussion is presented in terms of the
 $\mathbf{E}$-parameters, as they provide a more intuitive physical interpretation of the individual error mechanisms.
Removal of leakage error terms
To make S-parameter measurements practical without introducing unnecessary calibration complexity, the complete 16-term error model is often simplified. Several reduction strategies have been proposed to identify a consistent minimum set of error terms that captures the dominant systematic errors while neglecting insignificant contributions. Such simplifications should be guided by the physical origin of the error mechanisms.
For example, the isolation terms  $e_{30}$ and
 $e_{03}$ represent leakage within the VNA from the excitation path of one port into the measurement receiver associated with the opposite port. This leakage originates from the nonideal isolation of the internal directional couplers, the finite isolation of RF switches, local-oscillator leakage, mixer leakage, and other internal RF coupling mechanisms. In modern VNAs, these leakage signals are typically well below the measurement noise floor and can therefore usually be neglected. Consequently, the corresponding error coefficients
 $e_{30}$ and
 $e_{03}$ are commonly omitted from the calibration model.
Similarly, for on-wafer measurements, the diagonal leakage terms  $e_{20}$,
 $e_{02}$,
 $e_{31}$, and
 $e_{13}$ are generally neglected. These coefficients are commonly interpreted as representing direct EM coupling from the incident wave on one side of the DUT to the receiver associated with the opposite side, while bypassing the test set, cables, probes, and the DUT itself. Such direct coupling is generally expected to be negligible in a properly designed on-wafer measurement system.
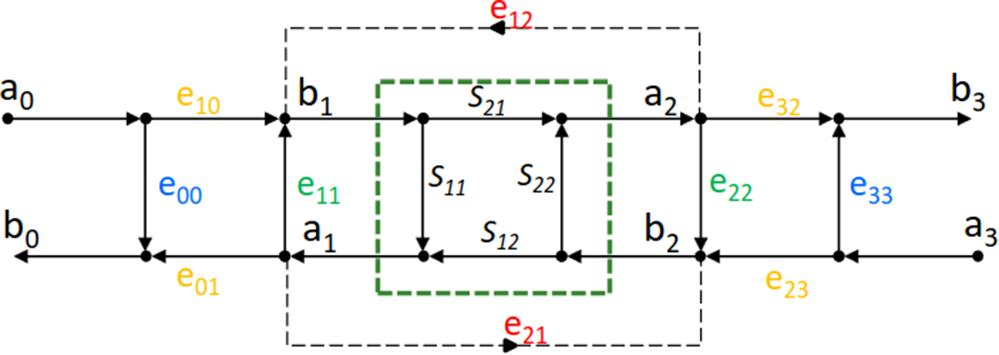
Under these assumptions, the complete 16-term error model, shown in Fig. 1, reduces to the simpler 10-term error model shown in Fig. 2. If the remaining leakage terms  $e_{12}$ and
 $e_{21}$, which account for crosstalk between the probes, are also neglected, the model further simplifies to the conventional 8-term error model.
Flowgraph of 10-term error model for four-port adapter.

Figure 2 Long description
This signal-flow diagram represents a 10-term error model for a 4-port adapter, used for VNA calibration and de-embedding. The diagram includes wave variables labeled a subscript 0, a subscript 1, a subscript 2, a subscript 3 at the top and b subscript 0, b subscript 1, b subscript 2, b subscript 3 at the bottom, indicating incident and reflected waves at each port. In the center, a dashed green box contains the S-parameter block with terms S subscript 11, S subscript 12, S subscript 21 and S subscript 22, representing scattering parameters between ports. Error coefficients are labeled along various paths: e subscript 10 connects a subscript 0 to b subscript 1, e subscript 32 connects a subscript 3 to b subscript 2, e subscript 21 connects a subscript 2 to b subscript 1 and e subscript 01 connects a subscript 0 to b subscript 1. Additional error terms include e subscript 11, e subscript 22, e subscript 33, e subscript 00, e subscript 12 and e subscript 21, each indicating specific error paths between wave variables. The diagram illustrates how these error coefficients interact with the wave variables and S-parameters to model measurement errors in the adapter system, providing a comprehensive view of signal flow and error interactions across the ports.
The corrected scattering matrix of the DUT is always computed using the complete 16-term calibration equations. Reduced models are obtained solely by setting selected coefficients of the extracted error matrix to zero; no alternative calibration equations are employed.
The 10-term and 8-term models considered in this work should therefore be regarded as reduced numerical models derived from the extracted 16-term calibration. They do not imply that the omitted leakage paths are physically absent or that the corresponding error mechanisms are independent. Rather, selected coefficients of the extracted 16-term error matrix are intentionally set to zero, while all remaining coefficients are kept unchanged.
This procedure constitutes a numerical sensitivity analysis that quantifies the influence of individual leakage-related error terms on the calibrated S-parameters under identical raw measurement data, calibration standards, and reference-plane conditions. It therefore provides insight into the significance of the different leakage terms and the extent to which reduced error models can accurately reproduce the complete 16-term calibration.
Accordingly, the 10-term reduced model retains only the direct probe-to-probe crosstalk terms,  $e_{21}$ and
 $e_{12}$, among the leakage coefficients:
 \begin{equation}
\begin{bmatrix}
b_0 \\
b_1 \\
b_2 \\
b_3
\end{bmatrix}
=
{
\begin{bmatrix}
e_{00} & e_{01} & 0 & 0 \\
e_{10} & e_{11} & e_{12} & 0 \\
0 & e_{21} & e_{22} & e_{23} \\
0 & 0 & e_{32} & e_{33}
\end{bmatrix}
}
\begin{bmatrix}
a_0 \\
a_1 \\
a_2 \\
a_3
\end{bmatrix}.
\end{equation}
The 8-term reduced model is obtained by setting all leakage-related coefficients to zero:
 \begin{equation}
\begin{bmatrix}
b_0 \\
b_1 \\
b_2 \\
b_3
\end{bmatrix}
=
{
\begin{bmatrix}
e_{00} & e_{01} & 0 & 0 \\
e_{10} & e_{11} & 0 & 0 \\
0 & 0 & e_{22} & e_{23} \\
0 & 0 & e_{32} & e_{33}
\end{bmatrix}
}
\begin{bmatrix}
a_0 \\
a_1 \\
a_2 \\
a_3
\end{bmatrix}.
\end{equation}
The terms common to the conventional TRL calibration and to the full 16-term calibration, namely  $e_{00}$,
 $e_{11}$,
 $e_{22}$,
 $e_{33}$,
 $e_{01}$,
 $e_{23}$,
 $e_{10}$, and
 $e_{32}$, describe the same physical error mechanisms and should therefore provide consistent results when the reference planes are aligned.
Measurement setup and procedure
Measurements were performed using an Agilent E8361A VNA up to 110 GHz, with extenders (N5260-60003) for frequencies above 67 GHz and an intermediate frequency bandwidth of 10 Hz. Beyond 140 GHz, a Rohde & Schwarz ZVA 24 (B16-B4-K6-K8) and corresponding extenders supported the WR5 (140–220 GHz)/WR3 (220–325 GHz) bands. To maintain transistor linearity, power was set near  $-$32 dBm below 67 GHz and below
 $-$30 dBm at higher frequencies via mechanical attenuators. Different probes were used based on frequency range: FormFactor Infinity XT 110 (50
 $\unicode{x03BC}$m pitch) up to around 110 GHz, FormFactor Infinity (100
 $\unicode{x03BC}$m pitch) for 140–220 GHz, and GGB Picoprobes (50
 $\unicode{x03BC}$m pitch) in the WR3 band.
Two calibration methods – TRL and on-wafer 16-term – were applied to the same raw data. Test structures were fabricated in STMicroelectronics’ 55 nm BiCMOS process with eight metal layers, using the top layer (M8) for microstrip lines and the lowest layer (M1) as the ground plane. The on-wafer TRL setup employed three line lengths (558.9  $\unicode{x03BC}$m, 297
 $\unicode{x03BC}$m, and 183
 $\unicode{x03BC}$m) to cover ranges up to 90 GHz, 270 GHz, and 330 GHz, respectively, alongside a 64.5
 $\unicode{x03BC}$m thru standard (see Fig. 3(a)). Several line lengths are required because the phase difference between the thru and line standards must remain in a well-conditioned range and must avoid values too close to 0
 $^\circ$ or 180
 $^\circ$ over the considered frequency band. The three lengths were therefore selected to provide appropriate phase shifts over their respective frequency intervals while maintaining overlap between adjacent bands. A short reflector served for TRL calibration, and impedance was corrected via a load structure. The TRL algorithm then shifted the reference planes back on both sides of the thru by using the calculated propagation constant.
Description of the layout of the structures: (a) thru and (b) short-load.

Figure 3 Long description
A structure labeled ′Thru′ with a length of 64.5 micrometers. It includes a reference plane and indicates the position of the wave port for electromagnetic simulation. The structure is surrounded by a blue background with horizontal lines. The image B shows a structure labeled ′load-short′ with a component marked ′Polysilicon/load′. It includes layers labeled M1 and M8-Cu, with an additional label for Al. The structure is similarly surrounded by a blue background with horizontal lines. Both images depict microstrip line configurations with specific components and labels for calibration and simulation purposes.
The six on-wafer standards used to determine the 16 error terms of the 16-term model are the thru, open, short, load, load-short (see Fig. 3(b)), and short-load. The procedure to define the reference standards of the 16-term method is identical to the one developed in [Reference Fregonese and Zimmer12]. For accurate comparison, the reference plane of the 16-term calibration method is aligned with the TRL calibration.
Measurement and result analysis
Measurement of passive elements
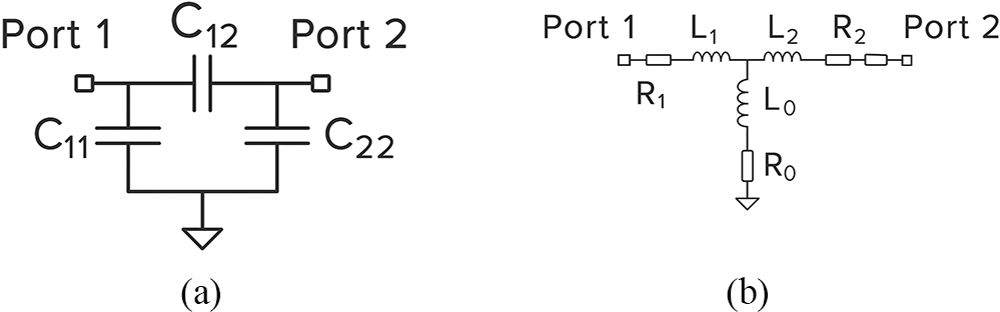
The raw measured S-parameters of the DUT are then corrected using the respective error term matrices (8-term, 10-term, 16-term, and TRL) to analyze the contribution of each error term to the measurement accuracy of the DUT. On the wafer, transistor-open and transistor-short test structures are available and are of particular interest for transistor characterization (de-embedding). Figure 4 presents the asymmetric equivalent circuits used for the transistor-open and transistor-short de-embedding structures. These structures reproduce the access environment of the measured HBT; the base and collector access regions are not geometrically equivalent because of different routing, via density, metal layout, and current-handling constraints. Therefore, the port-1 and port-2 parasitic elements are kept distinct in the extraction procedure. For the transistor-open structure, assuming a  $\pi$-model, the extracted capacitances are:
 \begin{equation}
C_{11}= \frac{\operatorname{Im}\!\left\{Y_{11}+Y_{12}\right\}}{2\pi\,f}
\end{equation}
 \begin{equation}
C_{12}= -\,\frac{\operatorname{Im}\!\left\{Y_{12}\right\}}{2\pi\,f}
\end{equation}
Asymmetric equivalent circuits used for the de-embedding structures: (a)  $\pi$-model of the transistor-open structure and (b)
 $T$-model of the transistor-short structure.

Concerning  $C_{11}$ (see Fig. 5(a)), the 8-term reduced model, 10-term reduced model, and TRL calibration exhibit a very similar unexpected increasing trend that is not correlated with the physical behavior of the open structure. The 16-term model provides a smoother frequency dependence and agrees well with the EM simulation after shifting the simulation reference plane to match the measurement reference plane, as indicated in Fig. 3(a). The maximum deviation between the EM data and the 16-term result is about 0.6 fF at 330 GHz.
(a)  $C_{11}$ and (b)
 $C_{12}$ capacitance of the transistor-open structure versus frequency; comparison of the different calibration methods.

Figure 5 Long description
A line graph comparing five series for C eleven in fF versus freq in gigahertz. The x-axis is labeled, freq in gigahertz, with ticks at 0, 50, 100, 150, 200, 250 and 300. The y-axis is labeled, C eleven in fF, with ticks at 4.5, 5.0, 5.5, 6.0, 6.5, 7.0, 7.5, 8.0 and 8.5. The legend lists: 8 term reduced model, 10 term reduced model, 16 term reduced model, TRL calibration and EM sim. The plotted traces start near about 5.0 fF at 0 gigahertz. Around 100 gigahertz, several traces are near about 5.5 to 6.0 fF. Around 200 gigahertz, several traces are near about 6.0 to 7.0 fF. Near 300 gigahertz, the highest trace is near about 8.0 fF, while lower traces are near about 6.0 to 7.0 fF. The image B showing a line graph comparing five series for C twelve in fF versus freq in gigahertz. The x-axis is labeled, freq in gigahertz, with ticks at 0, 50, 100, 150, 200, 250 and 300. The y-axis is labeled, C twelve in fF, with ticks at 0.5, 1.0, 1.5, 2.0, 2.5, 3.0 and 3.5. The legend lists: 8 term reduced model, 10 term reduced model, 16 term reduced model, TRL calibration and EM sim. The traces begin near about 1.5 to 2.0 fF at 0 gigahertz. One trace forms a pronounced dip between about 100 and 200 gigahertz, reaching near about 0.5 fF around the middle of that range, then rising again toward about 1.0 to 1.5 fF by 300 gigahertz. Another trace increases steadily with frequency, reaching near about 2.5 to 3.0 fF by 300 gigahertz, while other traces remain between about 1.0 and 2.0 fF over much of the range.
Regarding  $C_{12}$ in Fig. 5(b), the 8-term reduced model and TRL calibration exhibit nearly identical behavior, deviating significantly from the expected trend given by the EM simulation. This deviation results from a combination of probe-to-probe coupling below 50 GHz and also probe-to-substrate coupling above 50 GHz. A slight improvement is observed below 50 GHz when using the 10-term reduced model, which can be attributed to the correction of probe-to-probe coupling. However, above 50 GHz, the two additional leakage terms do not help to correct the probe-to-substrate coupling, so the 10-term reduced model performs similarly to the 8-term reduced model. As previously shown in [Reference Fregonese and Zimmer12], only the 16-term error model is capable of fully correcting the system.
A similar analysis can be performed on the transistor-short structure. In this case, a T model is used (see Fig. 4(a)):
 \begin{equation}
R_{0}= \operatorname{Re}\!\left\{Z_{12}\right\}
\end{equation}
 \begin{equation}
R_{1}= \operatorname{Re}\!\left\{Z_{11}-Z_{12}\right\}
\end{equation}
 \begin{equation}
L_{0}= \frac{\operatorname{Im}\!\left\{Z_{12}\right\}}{2\pi\,f}
\end{equation}
 \begin{equation}
L_{1}= \frac{\operatorname{Im}\!\left\{Z_{11}-Z_{12}\right\}}{2\pi\,f}
\end{equation}
These models provide inductors ( $L_{1}$ and
 $L_{0}$ as shown in Fig. 6) and series resistors (
 $R_{1}$ and
 $R_{0}$ as shown in Fig. 7). The magnitudes of these parameters are extremely small, typically on the order of picohenry, and hundreds of milliohms for
 $R_{0}$. Again, as expected, the 8-term model and TRL produce very similar results in Figs 6 and 7. The 10-term reduced model yields slightly improved results for
 $L_{1}$ and
 $L_{0}$ below 50 GHz, where direct probe-to-probe coupling is one of the dominant residual effects. More precisely, retaining
 $e_{12}$ and
 $e_{21}$ partially corrects the reverse transmission
 $S_{12}$. Although
 $Z_{12}$ is obtained from the complete S-parameter matrix and therefore depends on all four S-parameters, it is particularly sensitive to
 $S_{12}$. Therefore, this correction has a significant impact on the extracted quantity
 $L_{0}=\operatorname{Im}\!\left\{Z_{12}\right\}/(2\pi\,f)$. However, above 50 GHz, the results are less accurate than those obtained with the 8-term reduced model. This discrepancy is explained by the fact that the 10-term model used here is a diagnostic reduction of the optimized 16-term matrix, rather than an independently optimized 10-term calibration. In this frequency range, the retained terms
 $e_{12}$ and
 $e_{21}$ alone do not describe all dominant leakage mechanisms, especially probe-to-substrate and VNA-related leakage; the reduced model can therefore lead to residual over-correction. The largest deviation occurs between 50 GHz and 220 GHz. Above 300 GHz, the results become less dependent on the error model used, which is attributed to the significantly downscaled probe geometry that induces lower leakage. This is evident for
 $L_{1}$,
 $L_{0}$,
 $R_{0}$, and
 $R_{1}$. Finally, for the transistor-short structure, only the 16-term model provides consistent results across the entire frequency band.
(a)  $L_{0}$ and (b)
 $L_{1}$ inductance of the transistor-short versus frequency; comparison of the different calibration methods.

Figure 6 Long description
Two multi-line graphs compare inductance models versus frequency in gigahertz. The left graph shows L subscript 0 inductance with the horizontal axis labeled as frequency in gigahertz ranging from 0 to 300 and the vertical axis labeled as L subscript 0 in henry ranging from 0 to 2.5. The right graph shows L subscript 1 inductance with the horizontal axis labeled as frequency in gigahertz ranging from 0 to 300 and the vertical axis labeled as L subscript 1 in henry ranging from 0 to 14. The left graph includes several lines: the 10-term reduced model is represented by a solid line, showing a gradual increase from approximately 0.5 henry at 0 gigahertz to around 2 henry at 300 gigahertz. The 8-term reduced model, marked with circles, fluctuates between 0.5 and 1.5 henry. TRL calibration, shown with squares, remains relatively stable around 1 henry. The 16-term model, depicted with triangles, shows a steady increase, peaking at 2.5 henry. The right graph displays: the 10-term reduced model as a solid line, starting at 12 henry and decreasing to 10 henry at 300 gigahertz. The 8-term reduced model with circles, showing a dip to 8 henry around 150 gigahertz before rising again. TRL calibration with squares, maintaining around 10 henry. The 16-term model with triangles, peaking at 13 henry. The graphs illustrate that the 16-term model provides consistent results across the frequency range, while the reduced models show variations. The main takeaway is the effectiveness of the 16-term model in maintaining stable inductance values across different frequencies.
(a)  $R_{0}$ and (b)
 $R_{1}$ resistance of the transistor-short versus frequency; comparison of the different calibration methods.

Figure 7 Long description
The line graph A has the horizontal axis labeled, freq in gigahertz, with tick labels at 0, 50, 100, 150, 200, 250 and 300. The vertical axis is labeled, R zero in ohm, with tick labels at minus 0.5, 0, 0.5, 1.0 and 1.5. A legend lists four series: 10 term reduced model, 8 term reduced model, 16 term model and TRL calibration. Four curves are plotted. The 10 term reduced model curve stays near about 0.5 from low frequency to about 150 gigahertz, then rises toward about 0.9 by about 300 gigahertz. The 8 term reduced model curve stays near about 0.5 up to about 150 gigahertz, then rises more gradually to about 0.7 by about 300 gigahertz. The 16 term model curve stays near about 0.5 up to about 150 gigahertz, then rises to about 0.8 by about 300 gigahertz. The TRL calibration curve is below 0 at low frequency, reaches a minimum near about minus 0.4 around roughly 50 gigahertz, then increases, crossing 0 near about 120 to 150 gigahertz and reaches about 0.5 to 0.6 by about 300 gigahertz. The line graph B has the horizontal axis labeled, freq in gigahertz, with tick labels at 0, 50, 100, 150, 200, 250 and 300. The vertical axis is labeled, R one in ohm, with tick labels at 0, 1, 2, 3, 4, 5 and 6. A legend lists four series: 10 term reduced model, 8 term reduced model, 16 term model and TRL calibration. Four curves are plotted. The 10 term reduced model curve starts near about 2.5 at low frequency, increases to around 3.0 by about 100 gigahertz, then rises to around 4.0 by about 300 gigahertz. The 8 term reduced model curve starts near about 2.5, increases to around 3.0 by about 100 gigahertz, then rises to around 3.6 to 3.8 by about 300 gigahertz. The 16 term model curve starts near about 2.5, increases to around 3.0 by about 100 gigahertz, then rises to around 3.8 to 4.0 by about 300 gigahertz. The TRL calibration curve starts near about 2.5, increases to around 3.0 by about 100 gigahertz, then drops to around 2.0 to 2.5 between about 150 and 220 gigahertz and then rises again toward about 3.0 by about 300 gigahertz.
Characterization of SiGe HBT up to 330 GHz
To accurately remove back-end-of-line (BEOL)-related parasitics for transistors located beneath the BEOL stack, an appropriate de-embedding procedure is required. For both the on-wafer TRL and 8–10–16-term calibrated data, we use the transistor-short/transistor-open de-embedding technique described in [Reference Fregonese and Zimmer12]. Indeed, the inductive parasitics of the access lines – are identified as the dominant parasitic contribution in our case – are removed first, followed by the capacitive parasitic effects. The reference plane is finally shifted to the interface between metal 1 (M1) and the contact, thereby excluding the contribution of the M1 fingers from the transistor measurements.
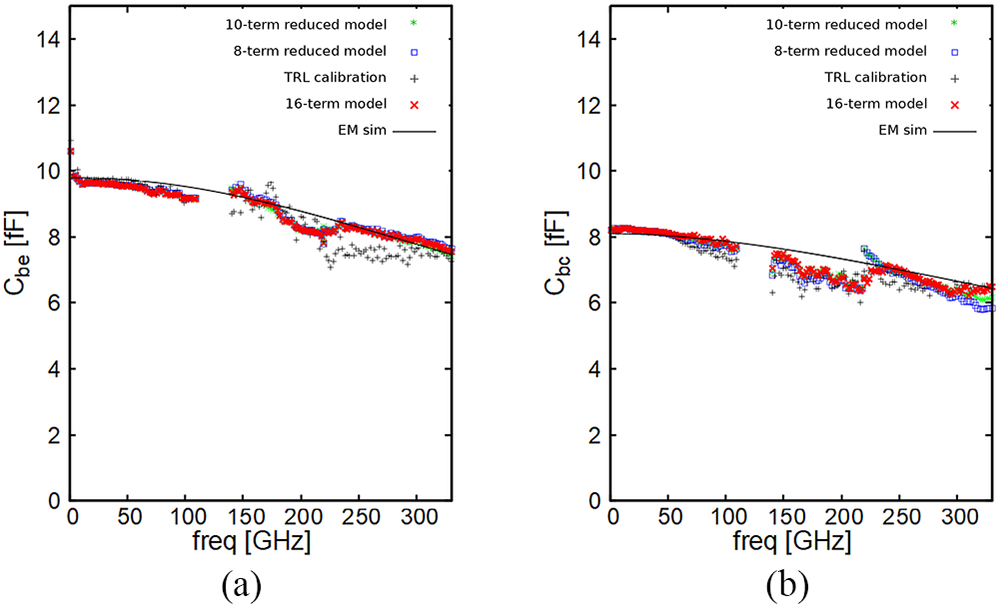
Figure 8 presents the extracted junction capacitances (see eqs 9 and 10) as a function of frequency for different calibration approaches at  $V_{BE}=0\,{V}$ and
 $V_{CB}=0\,{V}$: (a)
 $C_{BE}$ and (b)
 $C_{BC}$.
 \begin{equation}
C_{BC} = -\,\frac{\operatorname{Im}\!\left\{Y_{12}\right\}}{2\pi\,f}
\end{equation}
 \begin{equation}
C_{BE} = \frac{\operatorname{Im}\!\left\{Y_{11}+Y_{12}\right\}}{2\pi\,f}
\end{equation}
The extracted junction capacitances (a)  $C_{BE}$ and (b)
 $C_{BC}$ versus frequency for the different calibration at
 $V_{BE}=0$ V and
 $V_{CB}=0$ V.

Overall, all calibrations show a similar frequency-dependent decrease of the extracted capacitances. Up to about  $60\,{GHz}$, all calibration methods exhibit very similar behavior for both
 $C_{BE}$ and
 $C_{BC}$. In the
 $70$–
 $110\,{GHz}$ range, the TRL extraction of
 $C_{BC}$ starts to very slightly drift relative to the other calibrations. From
 $140$ to
 $330\,{GHz}$, the TRL results slightly deviate from the compact-model prediction, whereas the 16-term calibration remains closer to the compact-model response over the full frequency span, providing the most consistent agreement across the entire band.
Figure 9 shows the real parts of the  $Y$-parameters of the transistor at
 $V_{BE}=0.9$ V and
 $V_{CB}=0$ V for the different calibration schemes, together with the compact model simulation. For
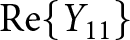 $\operatorname{Re}\!\left\{Y_{11}\right\}$ and
 $\operatorname{Re}\!\left\{Y_{22}\right\}$, all calibrations exhibit the expected increase with frequency, associated with input and output conductances, but the 10-term and 8-term solutions as well as the TRL results show a noticeable discontinuity for
 $\operatorname{Re}\!\left\{Y_{22}\right\}$ at 220 GHz. In contrast, the 16-term calibration follows the compact model simulation without noticeable discontinuity.
Real parts of the  $Y$-parameters versus frequency of the transistor at
 $V_{BE}=0.9$ V and
 $V_{CB}=0$ V.

Figure 9 Long description
The top left graph has the horizontal axis label, freq, with unit, gigahertz, ranging from 0 to 300. The vertical axis label is Re of Y subscript 11, with unit, millisiemens, ranging from 0 to 50. A legend lists, 10 term reduced model, 8 term reduced model, 16 term reduced model, TRL calibrated and Compact model. Multiple curves rise from near 0 at 0 gigahertz to around the low 30s millisiemens by 300 gigahertz. The top right graph has the horizontal axis label, freq, with unit, gigahertz, ranging from 0 to 300. The vertical axis label is Re of Y subscript 12, with unit, millisiemens, ranging from negative 4 to 0. A legend lists, 10 term reduced model, 8 term reduced model, 16 term reduced model, TRL calibrated and Compact model. Multiple curves start near 0 at 0 gigahertz and decrease to around negative 3 millisiemens by 300 gigahertz. The bottom left graph has the horizontal axis label, freq, with unit, gigahertz, ranging from 0 to 300. The vertical axis label is Re of Y subscript 21, with unit, millisiemens, ranging from 0 to 120. A legend lists, 10 term reduced model, 8 term reduced model, 16 term reduced model, TRL calibrated and Compact model. Multiple curves start near about 110 to 120 millisiemens at 0 gigahertz and decrease toward near 0 by 300 gigahertz. The bottom right graph has the horizontal axis label, freq, with unit, gigahertz, ranging from 0 to 300. The vertical axis label is Re of Y subscript 22, with unit, millisiemens, ranging from 0 to 14. A legend lists, 10 term reduced model, 8 term reduced model, 16 term reduced model, TRL calibrated and Compact model. Multiple curves rise from near 0 at 0 gigahertz to around 6 to 8 millisiemens by 300 gigahertz.
For the forward term  $\operatorname{Re}\!\left\{Y_{21}\right\}$, which is directly related to the transistor transconductance, the TRL, 8-term, and 10-term calibrations, all follow the model simulation with very similar trends. In contrast, the reverse term
 $\operatorname{Re}\!\left\{Y_{12}\right\}$ is much more sensitive to leakage and coupling: above about 140 GHz, only the 16-term calibration manages to remain close to the model simulation, while the 8-term, 10-term, and TRL results progressively deviate. Especially, a large discontinuity appears at 220 GHz. Finally, the terms most affected by the calibration model are the real parts of
 $\operatorname{Re}\!\left\{Y_{12}\right\}$ and
 $\operatorname{Re}\!\left\{Y_{22}\right\}$, which are the weakest terms and thus require higher measurement precision.
Similarly, Figure 10 shows the imaginary parts of the  $Y$-parameters of the transistor at
 $V_{BE}=0.9$ V and
 $V_{CB}=0$ V for the different calibration schemes, together with the compact model simulation. For
 $\operatorname{Im}\!\left\{Y_{11}\right\}$, the 16-term results closely follow the simulated curve over the entire frequency range, whereas the 8-term, 10-term, and TRL calibrations exhibit slightly noisier trends. The TRL result starts to deviate above 300 GHz.
Imaginary parts of the  $Y$-parameters versus frequency of the transistor at
 $V_{BE}=0.9$ V and
 $V_{CB}=0$ V.

Figure 10 Long description
Four line graphs depict the imaginary parts of Y-parameters versus frequency in gigahertz. Top left graph: The x-axis is labeled ′freq′ in gigahertz, ranging from 0 to 300. The y-axis is labeled ′Im(Y11)′ in millisiemens, ranging from 0 to 30. Multiple curves are plotted, including 8-term, 10-term, 16-term reduced models, TRL calibration and compact model. The curves show a general upward trend with slight variations among models. Top right graph: The x-axis is labeled ′freq′ in gigahertz, ranging from 0 to 300. The y-axis is labeled ′Im(Y12)′ in millisiemens, ranging from -10 to 10. The curves include the same models and calibration schemes, showing a downward trend with deviations among models. Bottom left graph: The x-axis is labeled ′freq′ in gigahertz, ranging from 0 to 300. The y-axis is labeled ′Im(Y21)′ in millisiemens, ranging from -10 to 10. The curves show a downward trend, similar to the top right graph, with variations among models. Bottom right graph: The x-axis is labeled ′freq′ in gigahertz, ranging from 0 to 300. The y-axis is labeled ′Im(Y22)′ in millisiemens, ranging from 0 to 30. The curves show an upward trend, similar to the top left graph, with differences among models. Legends indicate the models and calibration schemes used, with distinct colors for each curve.
Again, the reverse term  $\operatorname{Im}\!\left\{Y_{12}\right\}$ is particularly sensitive to leakage and residual coupling. Here, the dispersive trends observed with the 8-term and TRL approaches deviate progressively from the model simulation above 70 GHz, while the 10-term and 16-term calibrations are closer to the simulation. For all the calibration methods, a discontinuity is observed on the imaginary part of
 $\operatorname{Im}\!\left\{Y_{12}\right\}$ and not on its real part; hence, this is attributed to a probe positioning error and not to its contact quality.
For  $\operatorname{Im}\!\left\{Y_{21}\right\}$, which reflects the dynamic behavior of the transconductance, all methods follow the same general trend, but the TRL calibration shows a noticeable spread at 60 GHz. Again, the 16-term calibration provides the smoothest and most consistent curve with respect to the EM reference.
Concerning  $\operatorname{Im}\!\left\{Y_{22}\right\}$, the 8-, 10-, and 16-term data are superimposed but show a discontinuity at 220 GHz. The TRL shows reduced discontinuity at 220 GHz. As mentioned above, one attributes this discontinuity to a probe positioning error on port 2 on one of the DUT used for the 16T calibration. Overall, the calibrations reproduce both the curvature and the magnitude of the simulated response up to 220 GHz.
Overall, these comparisons confirm that fully accounting for all error terms is essential to obtain a physically consistent description of the  $Y$-parameters up to 330 GHz. One can observe that the discontinuities are reduced between frequency bands but also that the data smoothness is also improved compared with conventional TRL.
The final step involves examining the gain-bandwidth products used to extract two well-established FOMs: the transit frequency  $f_{T}$ and the maximum oscillation frequency
 $f_{\max}$. The quantities shown in Fig. 11 are not
 $f_{T}$ and
 $f_{\max}$ themselves, which are scalar extrapolated values, but rather
 $f\,|H_{21}|$ and
 $f\sqrt{U}$, respectively. The extraction of
 $f_{\max}$ is particularly sensitive to residual calibration errors and leakage-induced errors in weak reverse parameters such as
 $S_{12}$ or
 $Y_{12}$. In comparison,
 $f_{T}$, which is mainly related to the current gain, is generally less affected. Using conventional TRL or the 8-term reduced model yields similar trends across the frequency range: a sudden drop occurs around 50 GHz, followed by a discontinuity between the frequency bands and an unexpected increase from 140 to 220 GHz in the
 $f\sqrt{U}$ product. This behavior does not align with compact-model or TCAD simulations of HBTs and indicates that probe couplings likely influence the measurements. A similar but weaker pattern is observed in the
 $f\,|H_{21}|$ product.
Gain-bandwidth products used for the extraction of (a)  $f_{T}$, represented by
 $f\,|H_{21}|$, and (b)
 $f_{\max}$, represented by
 $f\sqrt{U}$, versus frequency for the transistor at
 $V_{BE}=0.9$ V and
 $V_{CB}=0$ V.

Figure 11 Long description
Two scatter plots labeled (a) and (b). Both plots share the same horizontal axis labeled freq in gigahertz, extending from 0 to 300 gigahertz in increments of 50 gigahertz. In plot (a), the vertical axis represents gain-bandwidth product values in gigahertz, ranging approximately from 300 to 370 gigahertz. Five data series are plotted using distinct markers: 20-term reduced model, 10-term reduced model, TRL calibration, 18-term model and compact model. Data points are most densely distributed between 0 and 100 gigahertz on the horizontal axis. The data points across all series show a general upward trend as frequency increases from 0 to approximately 100 gigahertz, after which the points become more scattered and sparse. The TRL calibration series serves as a reference and the reduced model series show close agreement with it across most of the frequency range. The compact model shows some separation from the other series, particularly at mid to high frequencies. In plot (b), the vertical axis represents gain-bandwidth product values in gigahertz, ranging approximately from 300 to 440 gigahertz. The same five data series are plotted using the same marker types as in plot (a): 20-term reduced model, 10-term reduced model, TRL calibration, 18-term model and compact model. Data points are again most dense between 0 and 100 gigahertz. Unlike plot (a), the data in plot (b) shows a general downward trend as frequency increases beyond approximately 50 gigahertz, with values declining from around 420 to 440 gigahertz at low frequencies down toward approximately 320 gigahertz at higher frequencies. The reduced model series maintain closer agreement with TRL calibration across the full range, while the compact model shows the largest deviation, particularly at lower and mid-range frequencies. Outlier points are visible in both plots, scattered away from the main clusters at higher frequency values above 200 gigahertz.
Moving to the 10-term reduced model improves the extraction trends compared with the 8-term approach, except in the WR5 band (140–220 GHz), where substantial probe-to-substrate coupling remains important. In the WR3 band (220–325 GHz), all error models produce nearly identical results.
By incorporating the 16-term calibration along with transistor-short and transistor-open de-embedding, the extracted data align closely with predictions from the compact model, and continuity across frequency bands is restored – demonstrating that probe-related influences have been successfully mitigated.
Conclusion
By systematically reducing the 16-term model to 10-term and 8-term versions, we demonstrate that the complete set of error terms is, in general, crucial for accurately characterizing both passive structures and highly miniaturized active devices. The optimal number of error terms results from a subtle trade-off involving VNA–extender performance ( $e_{30}=e_{03}\neq 0$), probe geometry and design, as well as the characteristics of the DUT. Furthermore, it can be observed that the improvement of the 16-term model compared to the 8- or 10-term models is significantly more pronounced for the transistor in open or short configurations than for the transistor itself. This difference is likely due to the de-embedding step applied to the transistor, which tends to correct the port 1–port 2 capacitance and return to ground impedance.
Our analysis shows that, up to 110 GHz, the main limitation originates from a moderate leakage at the probe tips combined with an extremely low  $S_{12}$ magnitude of the DUT. In the 140–220 GHz range, leakage within the VNA and the probes becomes the dominant constraint, even though the DUT exhibits a significantly higher
 $S_{12}$. In contrast, in the highest frequency band, leakage is negligible thanks to the use of a more compact GGB Picoprobe and adequate VNA performance, so that accurate results can be obtained with only eight error terms.
Based on the calibrated  $Y$-parameters, we have also extracted the intrinsic junction capacitances
 $C_{BC}$ and
 $C_{BE}$ using different calibration schemes. The results clearly indicate that the 16-term calibration provides the smoothest and most physically consistent values of
 $C_{BC}$ and
 $C_{BE}$, while simplified models (8 or 10 terms or pure TRL) exhibit slight frequency-dependent variations when leakage and access parasitics are fully accounted for.
Although the 16-term calibration is more complex to implement, it remains essential for high-accuracy applications such as the extraction of  $f_{\max}$,
 $f_{T}$, and the intrinsic capacitances
 $C_{BC}$ and
 $C_{BE}$ of advanced transistors. As an alternative approach, similar performance levels may be achieved by combining conventional TRL calibration with highly miniaturized probe structures, which helps minimize leakage at the signal source. Additionally, multiline TRL would improve consistency across frequency bands and reduce measurement noise compared with the segmented TRL technique described in this paper.
Acknowledgements
We would like to thank Nicolas Derrier from STMicroelectronics for fruitful discussions, wafer supply, and the NANOCOM platform from the RF-NET network. The RF-NET network is supported by PEPR (https://pepr-futurenetworks.fr/projet/fpng/).
Funding statement
This work was supported by the French National Research Agency ANR PRECISE (ANR-22-CE24-0027) and the European SHIFT project supported by the Chips Joint Undertaking and its members, including the top-up funding by France 2030 and BPIFRANCE for the financial support (id: 101096256) and STMicroelectronics for the silicon wafers.
Competing interests
The authors declare none.








 Open access

