





Nomenclature
Acronyms and abbreviations
- AD
-
actuator disc
- CFD
-
computational fluid dynamics
- CROR
-
counter-rotating open rotor
- DLR
-
German Aerospace Center (Deutsches Zentrum für Luft- und Raumfahrt)
- EOF
-
end-of-field
- FL
-
flight level
- FPR
-
fan pressure ratio
- ISA
-
International Standard Atmosphere
- MCR
-
mid-cruise
- MTO
-
maximum take-off
- OAD
-
overall aircraft design
- OGV
-
outlet guide vane
- SL-S
-
sea level static
- TLARS
-
top-level aircraft requirements
- TOC
-
top-of-climb
- TRL
-
technology readiness level
Latin symbols
- A ref
-
reference area used for force and coefficient normalisation
- c p
-
power coefficient = P/
 $ \rho$
n3D5 (-)
- c p
-
pressure coefficient = (p-p ∞ )/(0.5
$ \rho$
∞
u
2
∞
) - c T
-
thrust coefficient = T/
$ \rho$
n
2
D
4
- c D
-
drag coefficient based on freestream dynamic pressure
- c D *
-
modified drag coefficient based on induced velocity
- D inst
-
total installation drag
- D inst′
-
non-dimensional installation drag based on static pressure
- F x
-
axial force acting on a component or control volume
- I x
-
axial momentum flux through a control surface
- J
-
advance ratio = vflight/nD
- n x
-
axial component of outward surface normal vector
- P mech
-
mechanical shaft power supplied to the rotor
- p
-
static pressure
- T
-
thrust produced by rotor or open fan
- u
-
velocity magnitude
- u jet
-
jet or slipstream velocity
- v i
-
induced velocity at the propulsor disk
- x
-
axial direction


Greek symbols
-
$\alpha $
-
angle or generic coefficient (context-dependent)
-
$ \beta$
-
blade or vane pitch angle
-
$ \varphi$
-
flow coefficient = v ax /u mean
-
$ \Delta{h}$
-
specific enthalpy difference
-
$ \gamma$
-
ratio of specific heats
-
$ \eta$
-
efficiency
-
$ \pi_{\rm t}$
-
total
-
$ \rho$
-
fluid density
-
$ \tau$
-
temperature ratio
-
$ \tau_{\rm W}$
-
wall shear stress
-
$ \phi_{\rm X}$
-
axial pressure force contribution
-
$ \Omega$
-
control surface or control volume boundary


Subscripts
- ∞
-
freestream conditions far upstream the propulsor
- core,inlet
-
core engine inlet plane
- core,outlet
-
core engine outlet or nozzle exit plane
- inst
-
installation related quantity including spinner and nacelle contributions
- is
-
isentropic
- ov
-
overall
- p
-
pressure based (as in
$ \phi_{x,p}$
) - prop
-
propulsive
- trans
-
transfer
- nacelle
-
(downstream) nacelle surface contribution
- plug
-
core exhaust plug contribution
- rotor
-
rotor blade row
- spinner
-
upstream spinner surface
- x
-
axial direction

Superscripts
- *
-
modified or induced-velocity-based quantity
- ′
-
normalised or non-dimensional quantity
- 0
-
stagnation condition
- 2s–01
-
isentropic reference state change
- AD
-
quantity from actuator disc theory
- inst
-
installed condition
1.0 Introduction
1.1 Background and motivation
The introduction of stationary guide vanes for swirl recovery downstream of a high-speed propeller was first reported in Refs. [Reference Miller1, Reference Dittmar and Lasagna2]. The objective there was to translate the swirling flow in the propeller slipstream into thrust and hence increase the system’s propulsive efficiency. The vanes were reported to recover about 5–10% of lost propulsive efficiency due to the otherwise dissipated swirl kinetic energy, very much dependent on the design strategy and operational parameters of both the rotor and the vanes, though. More recent efforts further investigating this concept can be found in Stokkermans et al. [Reference Stokkermans3, Reference Stokkermans, van Arnhem and Veldhuis4]. Although addressing substantially lower advance ratios or flight Mach numbers, a lot of experimental data with detailed flow features and performance indicators are provided along with numerical simulations, providing a deep insight into the flow physics of such configurations. One other advantage of open propulsion systems is that they substantially reduce nacelle drag, which for a tube-and-wing configuration at cruise Mach numbers around 0.8 and beyond may comprise up to 5–10% of the total drag of the aircraft. Further increasing the engine’s bypass ratio (BPR) may exceed this value when no countermeasures such as short intakes are introduced. Borradille [Reference Borradaile5] estimated an overall engine installation contribution of around 14% of the drag for a high BPR civil twin-engine airliner. Due to its relatively large direct impact on fuel consumption, a large number of publications can be found in literature dealing with different aspects of designing nacelles for turbofan engines operating in the high transonic flow regime. Robinson et al. [Reference Robinson, MacManus and Sheaf6] provide a comprehensive overview of nacelle drag estimation and respective methods, together with breaking down the overall drag into pre-entry, nacelle surface and post-exit drag. Due to its geometrical complexity, a lot of attention was drawn to designing the nacelle aft-body, including the bypass and core duct and plug [Reference Ramirez-Rubio and MacManus7, Reference Goulos, Stankowski, MacManus, Woodrow and Sheaf8] and their respective impact on the bypass channel performance, loss development and thrust generation [Reference Otter, Goulos, MacManus and Slaby9]. A stringent thrust and drag bookkeeping is paramount and, beyond the aforementioned works, a historical and comprehensive overview is given by Stauffer [Reference Stauffer and Takahashi10]. In an open rotor context, very few to no studies have addressed the design of the nacelle in all its details and its interaction with the propulsor. Only Zanego et al. [Reference Zanenga11] introduce a nacelle design methodology for a contra-rotating open rotor (CROR). The work was performed in the context of many European initiatives in the early 2000s as e.g. in the DREAMFootnote 1 project and similar US-American activities [Reference Van Zante12]. Although different engine and integration architectures were investigated, most studies dealt with a pusher configuration with the two propulsor rotors being positioned on the aft body of the nacelle. The inlet to the core was located in the front body, upstream of both rotors. In those efforts, the cruise flight speed was reduced mainly for performance reasons, and the targeted flight Mach number was 0.73. This is almost 10% lower compared with flight Mach numbers of current short- and medium-range aircraft of around 0.8. Following the CROR activities, the open fan architecture was introduced to overcome some of the main drawbacks of two rotors and an engine installation in the rear end of the aircraft. The overall layout and bookkeeping of the propulsor of this open fan architecture is introduced by Tantot et al. [Reference Tantot, Giannakakis, Yesilcimen and Binder13]. It foresees a transonic rotor with a rotating spinner, followed by a splitter dividing the rotor hub flow into the core engine and placing a guide vane on the splitter. The entire nacelle afterbody is subjected to the (energised) flow from the rotor, which is aligned axially by the guide vane. This complexity makes the design of the blades and the nacelle, including the entry to the core engine, very challenging. Considering that high subsonic flight Mach numbers of 0.8 are targeted, strong interactions between the nacelle and the blades are expected, having considerable performance implications and imposing further design challenges. Those challenges have not been addressed yet for a realistic geometry and will be discussed in this paper.
Operating conditions and engine ratings used for open fan component design

Table 1. Long description
A table comparing operating conditions and engine ratings for open fan component design. The table has 7 rows and 6 columns. Column headers are: Parameter, Unit, Max. take-off (MTO), End of field (EOF), Second segment during climb (2ndSeg), Top of climb (TOC), Maximum cruise (MCR). Row labels and values are: Flight level [100 ft], 0, 0, 4, 370, 370; Altitude [m], 0, 11, 122, 11,278, 11,278; Mach-number [-], 0.0, 0.226, 0.224, 0.76, 0.78; Delta temp. ISA [K], 15, 15, 15, 10, 0; Engine rating [-], MTO, MTO, MTO, MCL, MCR; Thrust [kN], 134.1, 74.6, 82.1, 22.6, 17.4; Thrust [klbf], 30.1, 16.8, 18.5, 5.1, 3.9; Mass flow wcore,corr [kg/s], 37,6, 38,6, 40,7, 41,00, 37,6.
Baseline aircraft DLR F25 (a) cycle model of the open fan (b) and rendering of the open fan as studied in this paper.

1.2 Aircraft and engine architecture under consideration
In order to investigate the impac of disruptive aircraft technologies together with different propulsion and system architectures for the next generation of aircraft, the German Aerospace Center (DLR) has been developing a common research platform for the next generation of single-aisle aircraft in the short-to-medium range segment with 2,035 technology assumptions. The corresponding top-level aircraft requirements (TLARs) and the overall aircraft concept are summarised in Table 1 as taken from Wöhler et al. [Reference Wöhler, Häßy and Kriewall14, Reference Wehrel, Häßy, Schnell and Wöhler15]. Figure 1(a) illustrates this research aircraft equipped with turbofan engines designed using 2,035 technology assumptions and serving as a baseline for comparison. In addition to the configuration introduced in Ref. [Reference Wöhler, Häßy and Kriewall14], an open-fan-powered variant was derived with modified aircraft characteristics, engine installation and an updated thermodynamic cycle, as shown in Fig. 1(b). A similar concept is introduced and discussed in Ref. [Reference Taylor16]. The cycle is elaborated in Ref. [Reference Wehrel, Häßy, Schnell and Wöhler15] and features a two-spool single-core engine with similar technology assumptions as the turbofan baseline. Apart from the cycle itself, Wehrel et al. [Reference Wehrel, Häßy, Schnell and Wöhler15] present a mass estimation of the open fan as well as a way to process computational fluid dynamics (CFD)-based fan maps. Since the nacelle in the open fan concept is considered a part of the engine (as opposed to a classical turbofan bookkeeping, where the nacelle is typically accounted for during the overall aircraft design (OAD) process), fast iterations between the component design as described in this paper and the cycle performance are enabled in a very efficient way as also being addressed in Ref. [Reference Wehrel, Häßy, Schnell and Wöhler15]. Both TLARs and cycle parameters are used as design targets for the design of the propulsor, including blades, vanes, spinner, nacelle with core engine inlet, as well as the core section downstream of the nacelle afterbody. A rendering of one of the resulting designs discussed in this paper is illustrated in Fig. 1(c), with the blades and nacelle resulting from a dedicated component design effort and the core engine from cycle considerations yielding realistic (yet still preliminary) proportions of the core engine in terms of areas, radii and lengths of the components.
1.3 Layout and scope of the paper
Considering the aforementioned context and focusing on the topics that have not yet been addressed in open literature, the research questions that shall be answered in this paper are the following:
-
1) Research Question (RQ) 1 – Efficiency vs drag-design trade-off: What is the quantitative trade-off between blade-only efficiency gains and increased nacelle drag in open fan design?
-
2) RQ2 – Blade-nacelle interaction: What are the main drivers for the aforementioned trade-offs, or, more specifically, how do nacelle-induced static pressure fields influence blade performance, and to what extent can these effects be exploited to increase overall open fan efficiency?
-
3) RQ3 – Core engine integration: How do the core inlet and splitter affect flow quality, pre-entry drag and overall engine performance?
-
4) RQ4 – Link between component and engine cycle: How can CFD-based open fan maps be generated efficiently and utilised to consistently evaluate installed performance and design trade-offs across the flight envelope?
To answer those questions, the overall aircraft and engine cycle as described in the previous section is used to provide the main propulsor specification; it is also used as a technology evaluator, and the main results and conclusions highlighted in this paper in terms of performance maps, drag sensitivities and core inlet data are also fed back to the cycle to enable a consistent technology assessment over all levels. In the first methodical Section 2, the main metrics and different efficiencies of the isolated and the integrated propulsor are introduced in Section 2.1. The generation of CFD-based open fan maps for a given design is a challenge of its own, and since the performance will mostly be discussed over the entire mission range, this map generation process will be discussed in Section 2.2. We then introduce the general design strategy for both blades and nacelle in Section 2.3, taking advantage of CFD-based optimisation. The application of this design strategy results in two dedicated designs: one for optimised blade performance (named max. efficiency) and one for minimum nacelle drag (named min. drag). The performance of those two designs is described in Section 3.1. The subsequent Section 3.2 aims at better understanding the observed design trends by providing some theoretical considerations, also taking advantage of the sensitivities from the optimisation studies. We then look into specifics and flow features of the inlet to the core engine in Section 3.3. Sections 3.4.1–3.4.5 summarise a number of nacelle-drag-related sensitivity studies due to the Reynolds effect. The impact of swirl and the presence of the core plug will also be discussed. After analysing the impact of the advance ratio, we finally quantify the impact of the presence of the blades in general by comparing blade-on and blade-off performance of the downstream nacelle. In the final Section 3.6, a combined design that quantifies the trade-off between a blade-only and combined blade-nacelle optimised design will be introduced and discussed, along with the designs that were discussed in the previous sections.
2.0 Methodology
2.1 Control volume and performance metrics
Breaking down the net force into its individual contributions from the different parts of the open fan is done by means of control volume analysis around the entire engine as provided in Fig. 2. The dashed lines therein denote surfaces over which the thrust forces from the blades and vanes F
x, the momentum fluxes I
x in and out of the control volume and the drag contributions from spinner, nacelle and core plug
 ${\phi _x}$
are integrated. In the following, we will consider a force in the negative axial direction as a thrust (as indicated by the blade forces), and one in the positive axial direction, a drag. According to Ref. [Reference Otter, Goulos, MacManus and Slaby9] and [Reference Drela17], the resulting integral forces on all solid surfaces can be written as
 \begin{equation}{F_x},{\rm{\;}}{\phi _x} = \int\!\!\!\int \left( {p - {p_\infty }} \right){n_x}d\unicode{x1D6FA} - {\rm{\;}}\int\!\!\!\int {\tau _w}{n_x}d\unicode{x1D6FA} {\rm{\;}}\end{equation}
and the momentum fluxes in and out of the control volume in the region of the core engine as
 \begin{equation}{I_x} = \int\!\!\!\int \left( {p - {p_\infty }} \right){n_x}d\unicode{x1D6FA} + {\rm{\;}}\int\!\!\!\int u\left( {\varrho u} \right){n_x}d\unicode{x1D6FA} .{\rm{\;}}\end{equation}
Open fan control surfaces and force contributions.

Note that only for a closed control volume with
 $\unicode{x1D6FA} = \int\!\!\!\int {p_0}d\unicode{x1D6FA} = 0$
the ambient pressure term may be subtracted from the local static pressure. The surface around the entire engine can be written as follows:
 \begin{equation}\unicode{x1D6FA} = \int\!\!\!\int {n_x}d\unicode{x1D6FA} = \int\!\!\!\int {({n_x}\unicode{x1D6FA} )_{{\rm{spinner}}}} + {\rm{\;}}\int\!\!\!\int {({n_x}\unicode{x1D6FA} )_{{\rm{core}},{\rm{inlet}}}} + {\rm{\;}}\int\!\!\!\int {({n_x}\unicode{x1D6FA} )_{{\rm{nacelle}}}} + \int\!\!\!\int ({n_x}{\unicode{x1D6FA} _{{\rm{core}},{\rm{\;outlet}}}}){\rm{\;}} = 0\end{equation}
Taking into account the signs of the area normals
 ${n_x}$
which, as integrals, are positive for the spinner and core inlet and negative for the downstream nacelle and the core outlet, it becomes apparent that the normal projected surfaces of the spinner plus the downstream nacelle are inherently linked:
 \begin{equation}{\unicode{x1D6FA} _{{\rm{spinner}}}} + \;{\unicode{x1D6FA} _{{\rm{core}},{\rm{inlet}}}} = \;{\unicode{x1D6FA} _{{\rm{nacelle}}}} + \;{\unicode{x1D6FA} _{{\rm{core}},{\rm{\;outlet}}}} \to \;{\unicode{x1D6FA} _{{\rm{spinner}}}} - {\unicode{x1D6FA} _{{\rm{nacelle}}}} = \;{\unicode{x1D6FA} _{{\rm{core}},{\rm{\;outlet}}}} - {\unicode{x1D6FA} _{{\rm{core}},{\rm{inlet}}}}\end{equation}
When looking at individual drag contributions, e.g. from the nacelle, the consideration of the ambient pressure term and the respective projected areas may then result in a positive thrust force due to the dominance of the pressure term in relation to the viscous force along the nacelle surface. This may be very counterintuitive, since the net force over the nacelle – with very few exceptions, as we will see later – is always negative and hence, as a drag, reduces the thrust provided by the blades.
 \begin{align}{\phi _{x,p}} &= \underbrace {\left( {{p_\infty } - {p_{{\rm{spinner}}}}} \right){\unicode{x1D6FA} _{{\rm{spinner}}}}}_{drg} - \underbrace {\left( {{p_\infty } - {p_{{\rm{nacelle}}}}} \right){\unicode{x1D6FA} _{{\rm{nacelle}}}}}_{thrust}\nonumber\\ &= {p_\infty }\left( {{\unicode{x1D6FA} _{{\rm{core}},{\rm{\;outlet}}}} - d{\unicode{x1D6FA} _{{\rm{core}},{\rm{inlet}}}}} \right) - {\rm{\;}}{p_{{\rm{spinner}}}}{\unicode{x1D6FA} _{{\rm{spinner}}}} + {\rm{\;}}{p_{{\rm{nacelle}}}}{\unicode{x1D6FA} _{{\rm{nacelle}}}}\end{align}
In our case, the projected core outlet area is around 25% bigger than the core inlet area. To make the forces non-dimensional, different ways of normalising, depending on the context and the intention of the analysis, can be used. We first of all define the total installation drag as follows:
 \begin{equation}{D_{{\rm{inst}}}} = {\phi _{x,{\rm{spinner\;}}}} + {\phi _{x,{\rm{nacelle\;}}}} + {\phi _{x,{\rm{plug\;}}}}\end{equation}
It may be useful to relate it to a reference ambient force independent of the flight speed:
 \begin{equation}D_{{\rm{inst}}}^{\rm{'}} = {\rm{\;}}{D_{{\rm{inst}}}}{\rm{\;}}/{\rm{\;\;}}\left( {{p_{s,\infty }}{A_{{\rm{ref}}}}} \right)\end{equation}
The drag coefficient is typically defined as
 \begin{equation}{c_{\rm{D}}} = {D_{{\rm{inst}}}}/\left( {0.5{\rm{\;}} \cdot {\rm{\;}}{\rho _\infty }u_\infty ^2{A_{{\rm{ref}}}}} \right)\end{equation}
Note that for all given coefficients, we will preserve the signs of the forces; hence, a positive drag coefficient actually reflects thrust generation. Also, we are using a reference area of unity A ref = 1 m2 rather than one based on the actual dimensions of the nacelle; hence, given values of drag coefficient may appear higher than expected. Since the downstream nacelle is powered and the flow over it sees a strong acceleration from the rotor, the introduction of an alternative drag coefficient based on the induced velocity in the following form:
 \begin{equation}{\rm{\;}}c_D^{\rm{*}} = {D_{{\rm{inst}}}}/\left( {0.5{\rm{\;}} \cdot {\rm{\;}}{\rho _\infty }v_i^2{A_{{\rm{ref}}}}} \right)\end{equation}
can be useful. The induced velocity v i is calculated based on simple actuator disc theory and depends on the thrust and the flight velocity u ∞ only.
Based on the forces and a given input power from the rotor P
mech, different efficiencies are defined with the purpose of better understanding and separating the aerodynamic performance of the blades from conceptual parameters as discussed in Ref. [Reference Schnell and Mennicken18]. Another key element of this is to distinguish between installed performance as reflected by
 $\;\eta _{ov}^{{\rm{inst}}}$
and uninstalled performance expressed by
 ${\eta _{ov}}$
. All definitions are given in Table 2, along with a description of its purpose and meaning.
Open fan efficiency definitions

Table 2. Long description
Table with multiple columns and rows detailing open fan efficiency definitions. The table includes columns for the name of the efficiency, its definition, domain and composition, and a description. The names listed include Overall efficiency, Rotor Open fan Overall efficiency, Effective or installed overall efficiency, Installation efficiency, Propulsive efficiency, Transfer efficiency, and Isentropic efficiency. Each row provides specific details about the efficiency type, such as the forces involved, the components considered, and the purpose of the efficiency measure. The descriptions explain how each efficiency is calculated and what it represents in the context of open fan performance.
2.2 Map generation
Generating CFD-based open fan maps is a multi-dimensional problem since, apart from the operational parameter flight speed and rotor RPM defining the advance ratio J, both rotor and vanes are subject to pitch variations over the flight envelope. Another challenge is that common propeller maps, e.g. as provided in Ref. [Reference Giannakakis, Goulos, Laskaridis, Pilidis and Kalfas19], are not Mach-similar per se, meaning that at a given advance ratio and hence similar velocity triangles, the resulting (relative) Mach number levels can be different, leading to different power coefficients and efficiency levels. In general, different ways of generating maps (or individual pitch characteristics at constant rotor pitch setting
 $ \beta$
) are possible, as illustrated in Fig. 3. The first option (1) varies both flight speed and rotor rotational speed whilst retaining J; this leads to similar velocity triangles and hence the same rotor incidence. The power coefficient (Fig. 3, left) increases, and efficiency levels (Fig. 3, right) increase with increasing Mach number due to higher propulsive efficiencies; only towards very high Mach numbers, efficiencies drop again rapidly because of compromised transfer efficiency at high (near transonic) Mach levels. In the second option (2), the advance ratio is varied by changing the rotor RPM at constant flight speed. This leads to a variation of rotor incidence along the iso-pitch line and a respective increase of c
p with lower J due to increased positive rotor incidence. In the last option (3), the advance ratio is altered by varying the flight Mach number at constant RPM. The general trend is the same as in (2), but the pitch characteristics may be different in terms of slope because changes in flight velocity translate to incidence in a different way than RPM variations. In the present study, the pitch characteristics were generated automatically by CFD according to method (2) in the following way:
-
1) Constant ambient conditions were chosen for the entire map to facilitate the process. Different maps at sea level and altitude conditions were generated to separate Reynolds effects, and an efficiency correction based on Re-Index was applied in the engine performance assessment.
-
2) The reduced core mass flow w core was kept constant over the entire map, although it obviously depends on flight Mach and engine power settings. The assumption was made for practical reasons and in order to avoid implementing a complex mass flow schedule in the map generation process. This schedule would be possible to establish, but would require a number of iterations between the cycle and the component analysis. The core mass flow variations for the different mission points are listed in Table 1. Studies were made with different levels of (constant) core mass flow rates within the shown variations, and the impact was observed to be small on the overall performance characteristics of the open fan.
-
3) A discrete number of iso-pitch lines was specified between mission points top of climb (TOC) and end of field (EOF). Respective flight speeds were taken from the TLAR. The flight speed of each iso-pitch line with
$ \beta$
= const. resulted from a linear interpolation between corresponding TOC and EOF values. -
4) From the fan design, the operational parameter revolutions per minute (RPM) of the rotor and pitch settings of the rotor and the vane, meeting both TOC and EOF thrusts, are known. For the rotor pitches in the given range and prescribed values in between, the corresponding vane pitch setting was interpolated linearly between TOC and EOF values.
-
5) Each iso-pitch line at the given flight speed was then generated by varying the rotor RPM in given bounds of targeted minimum and maximum advance ratio relative to the specified baseline value.

Open fan map generation: schematic of velocity triangles and different approaches (1)–(3) to calculate rotor iso-pitch-lines with
 $ \beta$
= const. (left) and resulting efficiencies from CFD (right).

In the context of this study, typically around 12 iso-pitch lines were each resolved with 10-12 individual advance ratios and were generated in around 1 h on a high-performance computing (HPC) environment. A seamless integration of those maps into the engine cycle allowed for quick assessment of the entire engine performance. Note that those maps delivered to the cycle always contain all the aforementioned performance data, such as drag breakdowns and installation efficiencies as well.
2.3 Open fan and nacelle design strategy
The detailed design of all open fan components took advantage of the same CFD-based optimisation methodology as described by Rovira et al. [Reference Rovira Sala, Dygutsch, Frey, Schnell and Martinez Luque20]. Three rotor and vane aerofoil sections were parameterised with six parameters each (leading and trailing edge angles, profile stagger, some spline control points and chord), with several thickness constraints introduced to ensure feasible and manufacturable profiles. In addition to those profile-related parameters, the annulus lines were formulated based on a B-spline representation with a total of 10 variable control points in the direct vicinity of the blades for dedicated curvature control. The radial location of the splitter was also a free parameter, since having a direct effect on both core inlet momentum and downstream nacelle drag; the core inlet area was fixed to accommodate the given mass flow at moderate inlet Mach numbers of about 0.5–0.55. The aft section downstream of the nacelle highlight was fixed, and no core plug was present in the setup used during the optimisation (this was only introduced thereafter). As reported in Ref. [Reference Rovira Sala, Dygutsch, Frey, Schnell and Martinez Luque21], a rather coarse mesh using wall functions and a corresponding y + >50 for the blades was used during the single-point optimisations, allowing for rapid and robust design cycles. The grid resolution was considered adequate for the chosen flow conditions, as it was verified with finer grids in a mesh dependence study at different flight regimes [Reference Rovira Sala, Dygutsch, Frey, Schnell and Martinez Luque21], benchmarked with results obtained from other solvers by Greco et al. [Reference Greco, Corral, Zhao, Schnell, Rovira Sala, Martinez Luque and Gea-Aguilera22] and extensively validated in a CROR context against experimental data [Reference Schnell, Yin, Funke and Siller23, Reference Schnell, Yin, Voss and Nicke24]. The other solid surfaces were more finely resolved with y + <2 along the spinner and the nacelle. This increase in fidelity was motivated by a lack of experience for those regions because most of the aforementioned validation efforts focussed on the isolated blade performance. The mix of fidelities is not considered an issue per se and was not uncommon in the earlier days of CFD. Its impact on the resulting drag in our study is considered of second order because of the small overall contribution of the viscous forces and the locally confined region where the blade hub boundary is interacting with the nacelle surface. A formalised mesh dependence study for a similar configuration is presented in Ref. [Reference Rovira Sala, Schnell, Frey and Corral25]. Here, the block-structured mesh composed of 3.1 m cells, with the domains extending about five times the blade height in all directions into the far field. A Menter-SST turbulence model was used in a fully turbulent fashion, and a vertical mixing plane was introduced to couple the single-passage domains of the rotor and outlet guide vane (OGV) in a Reynolds-averaged Navier-Stokes (RANS)-based approach. Regarding the spatial discretisation, all of the results below were obtained through a finite volume scheme based on the Roe flux, monotonic upstream-centred scheme for conservation laws (MUSCL) second-order extrapolation, and a van-Albada type limiter. For more details on the numerical setup, see Ref. [Reference Rovira Sala, Dygutsch, Frey, Schnell and Martinez Luque21]. Contrary to Ref. [Reference Rovira Sala, Dygutsch, Frey, Schnell and Martinez Luque21], the optimisation here was rather basic, and not all design leverages such as lean and sweep and more control points on the blade suction side for better curvature control were exploited; hence, levels of overall efficiency might not be as high as one could expect for a fully performance-optimised blade. From a method perspective, the in-house optimiser AutoOpti and its application in a fan and propeller design context is well established and documented. It is based on a genetic algorithm with extensive meta-model support to accelerate the optimisation progress; here, individual Kriging models were used for all objective functions and constraints. The process chain is fully automated and composed of annulus and blade generation, meshing, performance evaluation at multiple operating points and final structural assessment with respective postprocessing. For more details, see Jaron [Reference Jaron, Moreau, Guérin, Enghardt, Lengyel, Otten and Nicke26, Reference Lengyel-Kampmann, Voß, Nicke, Rüd and Schaber27], where similar setups were used, and a lot more details are provided.
In addition to the geometric parameters, operational parameters such as the rotor RPM and pitch settings of the rotor and the OGV were also released during the optimisation. Apart from the process, the optimisation strategy in terms of formulating objectives and constraints is a key factor to achieve a desired outcome. Here, the objectives were not formulated to optimise for a single and fixed power coefficient and hence thrust setting, but we rather introduced two competing objective functions: maximising the overall efficiency of the rotor at mid cruise conditions as objective o
1:= max(
 ${\eta _{ov,rotor}}$
)! and maximising the thrust contribution from the guide vane as objective o
2:= max(
 ${F_{x,OGV}}$
)!. Note that maximising thrust was chosen over swirl recovery as an objective because, in the end, it is the axial force in the thrust direction
 ${F_{x,OGV}}$
, which, according to the definition of the overall efficiency given in Table 2, leads to the intended increase of the overall open fan efficiency. Even when all the swirl from the rotor is fully recovered, viscous losses may easily render the OGV inefficient; it may even become counterproductive when viscous losses become excessive, and the resulting net force of the OGV is actually producing drag. The formulation of those two objective functions leads to Pareto-optimal designs over a wide c
p range. To assess the nacelle impact, two different optimisation series were run: the first one without imposing any constraints on the total drag and optimising for rotor overall efficiency (o
1) and OGV maximum thrust (o
2). A subsequent second optimisation was then run limiting the total drag below the actual achievable value
 ${\phi _{x,{\rm{spinner}}\;}} + {\phi _{x,{\rm{nacelle}}\;}} \lt {\phi _{x,{\rm{min}}}}$
; constraints which are not met yet are considered objectives when outside the given bounds, hence the total nacelle drag was technically minimised to its lowest possible level by the temporary objective function o
3:= min(
 ${\phi _{x,{\rm{spinner}}\;}} + {\phi _{x,{\rm{nacelle}}\;}}$
)!. After the lower limit of the minimum nacelle drag
 ${\phi _{x,{\rm{min}}\;}}$
was identified and fixed, it was kept as a constraint, and the optimisation continued using the two actual objective functions o
1 and o
2. The main outcome of those optimisations was the two Pareto fronts shown in Fig. 4 with and without constraining the nacelle drag. The described optimisation strategy is visible in the right plot of Fig. 4, showing the constrained and unconstrained nacelle drag, which sets the two optimisation series apart. In the left plot, each Pareto front shows the almost linear dependency between rotor efficiency and OGV thrust already discussed in Ref. [Reference Rovira Sala, Dygutsch, Frey, Schnell and Martinez Luque21]. It essentially reflects that with increasing power coefficient, the rotor (propeller) efficiency drops due to the increased swirl losses, which, on the other hand, decreases the swirl recovery potential of the guide vane. The two Pareto fronts yield an almost constant efficiency offset of ca. 5%. From each optimisation series, one individual was chosen delivering the same overall thrust as targeted in the TLARs. Those two individuals are referred to as ‘min. drag’ and ‘max. drag’, and their performance will be discussed in the following section.
Optimisation strategies for minimum drag and maximum efficiency designs: power coefficient over total drag (left) and OGV force over rotor efficiency (right) – dashed lines show linear regression over each data set.

3.0 Results and discussion
3.1 Efficiency- vs drag-optimised design
Tables 3 and 4 summarises the main performance-related and operational parameters of both designs that will be discussed in this section. Both designs deliver the same thrust at the design point (DP). Note that this point is an artificially introduced operating point with slightly higher thrust demands compared with the mid-cruise (MCR) point. This was done to guarantee high efficiency levels and sufficient stability margins for the mission points actually targeted.
Resulting performance parameters at design point (DP)

Table 3. Long description
A table comparing performance parameters at design point for max efficiency and min drag. The table has 2 rows and 9 columns. Column headers are: Name, Definition, Domain & composition, Description. Row 1: Name, Overall efficiency, Installation efficiency, Propulsive efficiency, Transfer efficiency, Isentropic efficiency. Row 2: Definition, η_ov = Tu∞/Pmech, η_inst = (T+φx)/Fx = ηinst_ov/η_ov, η_prop = Tu∞/(ρ/2(u∞^2+u∞^2)), η_trans = η_ov/η_prop, η_is = Δh02s-01/Δh02-01 = (πτ^(γ-1)/γ-1)/(τ-1). Row 3: Domain & composition, Rotor T = F_x,rotor Open fan T = F_x,rotor + F_x,OGV, Rotor or Open fan with T = F_x + φ_x, Open fan with T = F_x,rotor + F_x,OGV φ_x = φ_x,spinner + φ_x,nacelle, Rotor or open fan, Rotor or open fan. Row 4: Description, Overall (pseudo) or blade-only efficiency η_ov: Forces on blades from Equation (1) integrated along control volume Fig. 2 (mainly thrust). Effective or installed overall efficiency ηinst_ov = η_ov*ηinst: Forces on blades, nacelle & spinner from Equation (1) integrated along control volume Fig. 2 (thrust and drag). Installation efficiency: Reflects reduction of open fan thrust produced by blades due to nacelle drag. Thrust power over jet kinetic energy: Evaluated analytically or from propeller theory, calculation procedure see Ref. [19]. Efficiency of the transfer of shaft power to jet kinetic energy. Quality of thermodynamic process or blade aerodynamics respectively (see Ref. [18]). Evaluated from circumferentially averaged and spanwise integrated flow quantities near blade row leading and trailing edge. Directly related to transfer efficiency.
Resulting performance parameters at design point (DP)

Table 4. Long description
A table comparing performance parameters at design point for different rotor diameters and blade counts. The table has 10 rows and 16 columns. Column headers are Max. efficiency and Min. drag. Row labels are Rotor diameter, Number of blades rotor/stator, RPM (1/min), FN (kN), ηov (%), ct (–), cp (–), J (–), utip,corr (m/s), and Ma_rel. Row 1: Max. efficiency, 4 m; Min. drag, 4 m. Row 2: Max. efficiency, 12/10; Min. drag, 12/10. Row 3: Max. efficiency, 1,005; Min. drag, 1,042. Row 4: Max. efficiency, 20.74; Min. drag, 20.74. Row 5: Max. efficiency, 79.49; Min. drag, 74.02. Row 6: Max. efficiency, 0.8; Min. drag, 0.75. Row 7: Max. efficiency, 3.59; Min. drag, 3.47. Row 8: Max. efficiency, 3.55; Min. drag, 3.43. Row 9: Max. efficiency, 237; Min. drag, 245. Row 10: Max. efficiency, 1.060; Min. drag, 1.077.
Iso-pitch characteristics for both designs: power coefficient (left) and overall efficiency (right).

Annulus lines for minimum drag and maximum efficiency design including control points used during optimisation.

The resulting iso-pitch characteristics at International Standards-sea level static (ISA-SLS) conditions are shown in Fig. 5, directly comparing both designs. Note again the different c p levels caused by the different RPM at iso-thrust, together with the high efficiency levels of the ‘max. eff.’ variant, yielding a difference of up to 5% in overall efficiency over the entire mission range. Figure 6 shows the corresponding annulus lines of both designs, including the fixed and variable control points used to define the annulus. The geometrical differences leveraging the observed efficiency delta seem marginal, but they introduce a significant amount of concave curvature in the region of the trailing edge of both blade rows for the ‘max. eff.’ variant. In general, the minimum nacelle drag variant features less pronounced curvature and an overall ‘smoother’ annulus (meaning less pronounced maxima and minima) as well as a reduced radius of the core splitter. The latter enables less form drag from the spinner and a reduced inlet momentum or core pre-entry drag, respectively, but as discussed later, is limited since lowering the rotor exit introduces diffusion in a region of low momentum flow in the boundary layer and hub region of the rotor. This will be further challenged when hub gaps are introduced, which are necessary to accommodate the pitch control mechanism and are not considered here. The impact of the concave curvature introduces an increase in static pressure near the trailing edge and is visualised in Fig. 7, where the circumferentially averaged pressure fields from both designs were subtracted, and the resulting difference in pressure coefficient Δc p is plotted. The maximum difference in c p is about 0.25, and a region of elevated static pressure extends radially up to about 30% relative span. The observed delta translates to a 10–12% maximum pressure increase, as can be seen in Fig. 8, showing the spanwise pressure distribution extracted near the trailing edge of both blade rows. The tendency to introduce concave curvature near the trailing edge in order to increase static pressure as much as possible is clearly visible in both blade rows. The efficiency delta given in the maps is overall efficiency, not yet taking into account any drag contribution from the nacelle. Note again that this efficiency can be broken down into propulsive and transfer efficiency. The latter is directly linked to isentropic efficiency and, at given fan pressure ratio (FPR), reflects the aerodynamic quality of the blades. Figure 9 (left) shows both isentropic efficiency of the rotor and the total pressure loss coefficient of the guide vane. Whereas the vane losses are almost at identical levels for both designs, there is a slight shift of about 0.5% in isentropic efficiency in favour of the ‘max. eff.’ design. This is directly linked to the lower RPM and reduced inflow Mach numbers in the regions with elevated static pressure. As a general conclusion, one can say that the similar levels of loss and efficiency between both designs suggest a comparable design maturity between both configurations. The relatively high loss levels in the guide vanes furthermore underline that the vane design is particularly challenging due to its operation at near-transonic conditions. These losses limit the effectiveness of the entire open fan concept towards lower values of rotor design c p, where turning requirements and hence the potential for swirl recovery is low, and the viscous losses easily may consume the entire potential for increasing propulsive efficiency. The previous observations suggest that the contribution of changes in isentropic efficiency to the increase in overall efficiency, as shown again in Fig. 9 (right), over the entire c p range is considered minor, and the main driver for the increased efficiency of the ‘max. eff.’ design is the propulsive efficiency.
Difference in local pressure coefficient
 ${\rm{\Delta }}{c_p}$
between both designs.

Spanwise static pressure near rotor trailing edge (left) and OGV trailing edge (right). Respective axial positions are marked in Fig. 7 as black dashed lines.

OGV loss coefficient over rotor isentropic efficiency (left) and open fan overall efficiency over rotor power coefficient (right) – dashed lines show linear regression over each data set.

Overall installed efficiency over overall efficiency from CFD-based optimisations with resulting sensitivities as dashed lines with
 ${\rm{\Delta }}\eta _{ov}^{inst}/\;{\rm{\Delta }}{\eta _{ov}} \approx - 1:4$
Insets show iso-Mach lines for two example individuals (a) and (b): one yielding very high overall efficiency and being located in the lower part of the dashed blue line; the other one located at the beginning of the black dashed line (left). Sensitivity from theoretical considerations using actuator disc theory (solid lines) and installed efficiency sensitivity from CFD (dashed lines, right) – Note that for
 ${\eta _{{\rm{trans}}}} = 1\,\rightarrow\, {\eta _{{\rm{ov}}}} = {\eta _{{\rm{prop}}}}$
.

Propulsive efficiency for given designs using actuator disc theory (left) and resulting installation efficiency using linear sensitivities from Fig. 10.

3.2 Trade-offs between overall and installed efficiency
In this section, the increase in propulsive efficiency of the ‘max. eff’ design shall be discussed further. The basis for these considerations is, on the one hand, an additional CFD-based optimisation, and on the other hand, the use of a simple actuator disc model. The trade factors between overall efficiency and overall installed efficiency were first of all derived in greater detail by performing another less constrained optimisation with two objective functions: one was the maximisation of the overall open fan efficiency (without any nacelle forces considered), and the other one was the maximisation of overall installed efficiency. This optimisation, covered a large c
p
range, resulting in the Pareto-front plotted in Fig. 10 (left) and basically shows two different, quasi-linear regimes: one suggests a constant exchange rate between the two efficiencies of about
 ${\rm{\Delta }}\eta _{ov}^{inst}/\;{\rm{\Delta }}{\eta _{ov}} \approx - 1:4$
; the other, marked as a blue dashed line, shows a more rapid drop in installed efficiency with only minor increases in uninstalled efficiency. The main reason for the latter is shock-induced losses on the nacelle surface as visualised by the inset (a) of Fig. 10, showing iso-lines of Mach number in the nacelle aft body. The corresponding individual (a) is located in the lower part of the almost vertical branch of the linear Pareto front visualised by the blue dashed line. It exhibits a strong shock with pre-shock Mach numbers >1.25 and is one example of a typical design along the discussed branch of the Pareto front. Those shocks were induced by the strong changes in curvature, which were necessary after the regions of elevated static pressure. Note that this region is typically unwanted, very much dependent on constraints put on the nacelle geometry and will not be considered any further. Design (b) is located in the region of the almost horizontal part of the Pareto front indicated by the black dashed line. It yields a shock-free flow around the nacelle aft body with peak Mach numbers only slightly above unity. To better understand the typically targeted linear region of interest (black dashed line), a simple 0D non-viscous actuator disc representation of the open fan can be introduced (see e.g. Ref. [Reference Schnell, Yin, Voss and Nicke24] for an incompressible formulation). In this model, the thrust in the propulsor plane is achieved by a pressure jump over the blade row(s) at a given disc velocity. Starting from the minimum drag design and its AD representation, we can now introduce an additional force F
dp
in the disc plane stemming from the static pressure increase induced by the hub curvature downstream from the trailing edge. This force
 ${F_{dp}} = \smallint \Delta \,pdA\;$
is shown and quantified in Fig. 8 as the shaded area between both designs and makes up about 5% of the given thrust. Note that the control surface indicated by the dashed line in Fig. 7 is slightly downstream from the trailing edge, and the pressure field decays rapidly. This force is added to the propulsor’s originally generated thrust at constant power and hence leads to a corresponding increase in efficiency (or the power can be reduced by the same amount at iso-thrust, with the same impact on efficiency). The linear dependence between the additional force generated by the increased static pressure field and propulsive efficiency is shown in Fig. 10 by the solid grey line. The approximate position of the ‘max. eff’ design is also included, yielding an approximately 5% better propulsive efficiency relative to the AD baseline for a force contribution of F
dp
/F
N
∼5% as discussed before. In addition to the AD-based propulsive efficiency, we can take advantage of the exchange rate between installed and isolated efficiency from the optimisation and introduce the overall installed efficiency by the dashed lines. Note that this efficiency decreases linearly between the ‘min. drag’ and the ‘max eff’ design. In this regime, an exchange rate of
 ${\rm{\Delta }}\eta _{ov}^{inst}/\;{\rm{\Delta }}{\eta _{ov}} \approx - 1:4$
can be observed, which means essentially that a 1% increase in installed efficiency ‘costs’ 4% in blade-only efficiency. In other words, one can afford sacrifying a certain amount of blade-only propulsive efficiency for enhanced installed efficiency, which in the end is the most relevant performance descriptor of the open fan engine at design conditions. Another way of interpreting the given exchange rate is that about 80% of the nacelle drag force can be translated into a corresponding reactive force in the opposite direction (=thrust) via the blade surfaces, almost independent of the power setting. Although this reactive force on the blades is a direct consequence of the form drag of the nacelle, a good design should aim for low exchange rates. Considering off-design performance, e.g. at acoustic certification points, high levels of uninstalled efficiency associated with high flow quality are also favourable, and for the final design one might choose a compromise design not at peak installed efficiency. In addition to the given sensitivities, the baseline propulsive efficiency based on AD considerations is given in Fig. 11; note that its level is determined by the thrust loading of the propulsor. Finally, in Fig. 11 (right), the evolution of the installation efficiency is plotted over the varying range of the additional, hub-induced pressure force acting on the disc.
Core inlet total pressure ratio
 ${p_{{\rm{core}},{\rm{inlet}}}}/{p_\infty }$
with contours of entropy in a core pre-entry plane in the inlayed figure at near cruise conditions (left) and core inlet momentum according to Equation (2) (right) for both designs. Note that the range of the iso-pitch lines is in correspondance with Fig. 5 and is in the range
 $ \beta$
=[+35°…−2.5°].

Contour of entropy in an axial plane just upstream from the core entry.

3.3 Core section performance
The location of the splitter dividing the core and the outer bypass stream plays a very important role since it determines pre-entry drag of the core inlet and affects the design, including the number of stages of the compressor for a given overall pressure ratio (OPR). In Fig. 12 (left), the core inlet stagnation pressure in relation to the freestream value is plotted over the entire propeller map. It reflects very high total pressure losses in the hub region of the rotor, leading to pressure ratios below one at still positive power input with total temperature ratios exceeding one over the entire mission range. The pressure losses are driven by the shear stresses in the hub boundary layer, which even increase when diffusing the flow before entering the core section. It is further enhanced by the thick wakes due to aerodynamically non-optimal profiling of the hub section of the rotor. Both phenomena are visualised qualitatively by contours of constant entropy in a plane just before the core entry, shown in Fig. 13. Optimising the hub profile was not explicitly enforced during the optimisation, and its weak performance is presumably promoted by thick profiles that are necessary for structural reasons to accommodate static and dynamic loads with engine order multiples (1P-loads). In a more realistic scenario, hub gaps necessary for the pitch variability might further deteriorate the core entry flow quality with even higher losses. The severe impact these high total pressure losses have on the core performance is discussed in Ref. [Reference Wehrel, Häßy, Schnell and Wöhler15]. The core inlet momentum, as calculated using Equation (2) in a plane inside the core channel just downstream from the splitter nose, is shown in the right plot of Fig. 12. It shows slightly higher negative values (=increased drag) of the maximum efficiency design. This is mainly driven by the increase in concave curvature near the rotor trailing edge to increase the static pressure as discussed before, which introduces additional diffusion in the core region. The difference between both designs is most pronounced at high flight speeds and tends to level for lower advance ratios below 3. As a general conclusion, one can state that the concurrent design of the core section of the open fan comprising the rotor hub, annulus lines and the splitter location may severely compromise performance and has a direct impact on the core engine design. For more accurate performance assessments of the open fan concept at higher technology readiness level (TRL), this will require consideration of more realistic geometries (e.g. hub gaps included) and off-design conditions, ensuring operability of this particular section at all flight conditions. Additional constraints or objective functions aiming explicitly for an improvement of the flow quality in this region are needed in further detailed design iterations.
Baseline open fan map for minimum drag design including mission points from cycle analysis (left) and overall efficiency lines for two Reynolds numbers (right): solid lines: altitude conditions at ISA-FL350 and dashed lines at ISA sea level-static (SL) conditions. Note that the range of the iso-pitch lines is in correspondence with and is in the range
 $ \beta$
= [+35°…−2.5°].

3.4 Sensitivity studies
3.4.1 Reynolds number effect
Every individual mission point inherently has a different altitude and hence varying ambient conditions. Also, the operating points have very different locations in the performance map as shown in Fig. 14 (left). The mission points are iterated during the engine cycle analysis using the minimum drag design and corresponding CFD-based maps as discussed in this paper (more details can be found in Ref. [Reference Wehrel, Häßy, Schnell and Wöhler15]). To avoid providing multiple maps to the cycle at every relevant ambient condition, a Reynolds number correction of the efficiency is carried out at cycle level during the multi-point synthesis. To calibrate this procedure, two open fan maps were generated over the entire advance ratio range, one at static sea level conditions and one at a given flight altitude during cruise. The resulting overall efficiency is shown in Fig. 14 (right), yielding a difference in peak efficiency of approximately 1.5%. Although there is some uncertainty since the CFD setup was not adjusted in terms of y+ values, it is in line with what one would expect from a change in chord-based Reynolds number by a factor of 2.5–3. Note that the power input does not depend on the Reynolds number, hence, the c p characteristics were almost identical, and thrust varies then with the efficiency. The corresponding nacelle drag polars are discussed in the two plots of Fig. 15: the left plot shows the downstream nacelle drag relative to the average of each iso-pitch line. The impact of Reynolds number causes a shift between the solid and dashed lines, with the results at a lower Reynolds number having increased drag values in line with observed rotor efficiencies. The variation along each iso-pitch line is rather small and below 5% in relation to the average values. The right plot is included to show that the ratio between the spinner and downstream nacelle drag, which both are exposed to very different flow phenomena, is almost not affected by any Reynolds effects.
Relative nacelle drag for different pitch lines (left), and ratio between aft nacelle and spinner drag (right) for two different Reynolds numbers. Note that the range of the iso-pitch lines is in correspondence with Fig. 5 and is in the range
 $ \beta$
= [+35°…−2.5°].

3.4.2 OGV swirl impact
It is expected that the drag of the downstream nacelle body depends on the velocity or Mach number levels in the slipstream of the propulsor, as well as on the orientation of the flow relative to the axial direction. To quantify the latter, a rotor iso-pitch line was run for a high advance ratio operating point (near MCR) with different pitch settings of the guide vane. One reason for this sensitivity study is that it was found that the overall performance optimum is not necessarily where the guide vanes outflow is perfectly aligned with the axis, but residual swirl remains. This is driven by an overall compromise between vanes losses and swirl recovery. The resulting characteristic is shown in Fig. 16 by the drag coefficient from Equation (8). Note that the change in drag coefficient is predominantly caused by the force changes induced on the downstream nacelle, and the spinner performance is nearly unaffected. The different vane pitch settings show a small upstream impact on the rotor, and the corresponding power coefficient varied in a range between c
p = 3.7 (
 $ \beta$
ogv = −5) and 3.78 (
 $ \beta$
ogv = 10). The resulting drag coefficient, however, is constantly rising, yielding a drag reduction towards higher positive vane settings, which is mainly driven by three effects: the first one is the (slightly) increasing power coefficient caused by a change in effective advance ratio (this sensitivity will be discussed later). The second one is the significantly increased pressure losses of the guide vane due to its operation off the design incidence, which is reflected by the drop in overall efficiency. The third driver for the drag increase is the residual swirl downstream from the vane and the resulting increase in effective wetted area. When discussing nacelle drag, one should keep in mind that the viscous forces contribute only 5–10% to the total force and the entire drag is driven by form drag and respective pressure forces (see Fig. 16, right). It can be concluded that the main factor impacting the nacelle drag is not the swirling flow, but the increase in loss by largely separated areas at non-ideal pitch settings towards positive incidence on the vanes. Figure 17 aims at supporting these conclusions by showing the corresponding flow structures in the vicinity of the OGV: whereas the results highlight largely separated areas on the OGV at high positive incidence, they show rather detached flow conditions at design and negative incidence, with streamlines much more aligned with the axial direction in both scenarios.
Modified drag coefficient and overall efficiency for different OGV pitch settings at constant rotor c
p
for a high advance ratio case (near cruise point MCR, left) and normalised forces on the nacelle with and without viscous forces taken into account (non-viscous results from Euler CFD computations, right). Note that the range of the iso-pitch lines is in correspondence with Fig. 5 and is in the range
 $ \beta$
= [+35°…−2.5°].

Streaklines on nacelle contour and static surface pressure at different pitch settings of the guide vane, along with iso-surfaces of negative axial velocity showing separated flow on the vane.

3.4.3 Core plug impact
During the blade and annulus design optimisation, no core plug is present in the setup, and the nacelle contour downstream of the highlight point is kept constant solely for the sake of simplicity in the CFD setup. It is not expected that this would have had impacted the resulting design; however, when discussing absolute levels of thrust and drag the nacelle aft-body contributes significantly and typically induces a large positive force (meaning thrust) due to the concave streamline curvature necessary to guide the flow on the curved nacelle endwall towards the axial direction as shown in Fig. 18. This effect (sometimes referred to as boattail drag) is observed also in turbofan engines and was extensively discussed in previous studies e.g. see Otter et al. [Reference Otter, Goulos, MacManus and Slaby9] or Ramirez et al. [Reference Ramirez-Rubio and MacManus7]; similar flow features are observed here, with the concave streamline curvature and its upstream impact favouring values of positive pressure coefficients up to 0.12 on the nacelle surface downstream of its highlight point. When no core plug is present, the nacelle static pressure is driven only by the local nacelle contour and shows negative c p-values in the entire aft body. This is quantified by the drag polars shown in Fig. 18 (left): the presence of the core plug can reduce the overall nacelle drag, here including contributions from both the spinner and downstream nacelle, by almost a factor of up to 2.5.
Core nozzle impact on total nacelle drag coefficient (core inlet and outlet momentum excluded, left) and resulting iso-lines of pressure coefficient (right).

Total drag coefficient calculated with and without viscous forces (left) and induced velocity dependence on advance ratio (right).

3.4.4 Impact of advance ratio
Next, the impact of the rotor advance ratio on total nacelle drag shall be discussed. Several effects determine this impact, such as the increase of flight velocity for each iso-pitch line as well as the additional increase of power input and hence increase in total pressure along the pitch line by variation of rotor RPM. The latter is directly linked to an increase of the induced velocity in the propeller plane as shown in Fig. 19. It is expected that the increased stagnation pressure towards lower advance ratios along a rotor iso-pitch line elevates static pressure on the nacelle body and, due to the large positive contribution of the nacelle aft-body, also reduces the form drag of the entire nacelle. Note again that here the viscous forces have only a small contribution to the total force and the nacelle drag is dominated by form drag resulting from the pressure forces; this relation is very sensitive to the level of form drag, which in our case is strongly affected by the core inlet and outlet areas and their respective radial position. For different designs, form drag might be less dominant. In Figs. 20 and 21, the individual force contributions are visualised for two advance ratios, with Fig. 20 showing contours of pressure coefficient cp and Fig. 21 showing contours of wall shear stresses with corresponding labels. An increase in advance ratio from J = 2.5 to J = 4.3 and corresponding reduction of induced velocity from 200 m/s to 160 m/s (see Fig. 19) significantly reduces the positive drag contribution from the nacelle aft body, where values of the pressure coefficient drop from ∼0.1 to ∼0.05 in the nacelle aft body close to the core outlet. On the other hand, the viscous forces which, in the figure, are visualised by the wall shear stresses in the axial direction, are reduced in the nacelle by around 20% due to the lower induced velocities acting on the nacelle surface.
Pressure coefficient c
p
for the
 $ \beta$
= 5° – pitch line: comparison of high advance ratio point J = 4.32 (left) and low advance ratio point at J = 2.51 (right) at constant flight speed. (a) High advance ratio J (b) low advance ratio J.

Wall shear stresses for the
 $ \beta$
= 5° – pitch line: comparison of high advance ratio point J = 4.32 (left) and low advance ratio point at J = 2.51 (right) at constant flight speed. (a) High advance ratio J (b) low advance ratio J.

Normalised nacelle force (left) and total installation drag (right) over flight Mach number for blades-on and blades-off cases.

Contours and iso-lines of pressure coefficient c p in a slice along the axis of rotation for (a) blades-off and (b) blades-on simulations at Ma = 0.8 (left). Pressure coefficient along the spinner and nacelle surface (right).

Figure 23. Long description
The image contains three panels. Panel A and Panel B show contours and iso-lines of pressure coefficient in a slice along the axis of rotation for blades-off and blades-on simulations at Mach 0.8. Panel C is a line graph depicting the pressure coefficient along the spinner and nacelle surface. Panel A shows the pressure coefficient contours for the blades-off simulation, with the color scale ranging from -0.3 to 0.3. The contours indicate regions of high and low pressure around the spinner and nacelle. Panel B shows the pressure coefficient contours for the blades-on simulation, with similar color scaling and contour lines indicating the impact of the blades on the pressure distribution. Panel C is a line graph with the x-axis labeled as axial coordinate in meters and the y-axis labeled as pressure coefficient. The graph includes two lines: one for blades-off (green) and one for blades-on (black). The graph shows variations in pressure coefficient along the axial coordinate, with notable differences between the blades-off and blades-on conditions. The graph also includes annotations indicating specific regions of interest along the axial coordinate.
3.4.5 Blades on vs. blades off
In conventional bookkeeping, the nacelle and blade performance are often separated and, hence, a blade-off performance of the nacelle is considered. Although we stress in this paper the inherent link between blade and nacelle design, it might be useful to consider the unpowered nacelle and compare results with the rotor being present and introducing the aforementioned effects in terms of induced velocity and potentially elevated stagnation pressure. Figure 22 shows this comparison over the relevant flight Mach number range. The blades-on calculation was carried out with constant baseline pitch settings for all Mach numbers and at a constant advance ratio of J = 3.5. The total drag shown in Fig. 22 (right) is reduced for the blades-on scenario over almost the entire Mach range. However, the resulting force integrated along the nacelle aft body, as shown in the left plot of the figure, shows a different characteristic: the nacelle force values for the blades-on simulation are substantially dropping when nearing the highest Mach number, and only slightly elevated compared with blades-off simulations towards lower flight Mach numbers below Ma = 0.6. This behaviour is not intuitive and, hence, for one flight condition (Ma = 0.8), more detailed results are shown in Fig. 23 visualizing the pressure coefficient along the nacelle surface in the different flow regimes; note that the drag itself results from the projection of the static pressure onto the respective area. Since the overall drag is driven by form drag, we will concentrate on the pressure fields in the following, and the impact on viscous drag will not be considered. Five main different regions can be defined: (1) upstream of the rotor and spinner (2) within the rotor blade passage (3) upstream of the OGV on the upper nacelle (4) within the OGV passage and (5) downstream of the vane and over the nacelle body; those regions are marked in Fig. 23 (right). When comparing respective c p values of the blades-on and blades-off calculations at the highest Mach number, region (1) yields slightly elevated static pressures for the blades-on case, presumable caused by the upstream potential effect of the blades. This translates to a drag increase. Region (2), although difficult to assess because the blades-on calculation only shows one circumferential slice through the blade passage, seems to have an overall elevated static pressure for the blades-off scenario. This leads to a respective drag reduction of the blades-on case. Just upstream of the OGV (3), the blades-off case shows a lower static pressure again than the blades-on case, which is caused again by the blades potential effect. Inside the OGV passage (4), the static pressure and hence c p is increased again for the blades-off case mainly due to the static pressure field induced by the concave geometry in this region and the missing interaction with the blade passage. Downstream the OGV (5), the blades-on case shows a general amplification of both negative and positive pressure peaks, which tends to average out in the end; it is driven, however, by the flow acceleration of the blades necessary to generate thrust. The left plot in Fig. 23 visualises all aforementioned phenomena by showing iso lines of static pressure along the same slice (axis of rotation). One of the main conclusions from this study is that it is not one predominant effect that drives the drag reduction of the blades-off calculation, but a combination of different static pressure fields on the nacelle and the blade passage interacting with each other.
Spinner (left) and total drag coefficient (right) over advance ratio for both designs.

3.5 Discussion of nacelle drag metrics
Because of the work input of the rotor and an associated increase in stagnation pressure and induced velocities, classical non-dimensional parameters used to describe an unpowered nacelle based on stagnation quantities or the dynamic head of the freestream may not always be an adequate metric. In the following, we are breaking down again the total drag of the nacelle into contributions from the spinner and the downstream nacelle and discuss different ways of normalisation. Figure 24 shows in the left plot the drag coefficient for the spinner only and in the right one the total drag. For the total drag, all iso-pitch lines almost collapse into a single curve for the minimum drag design and show a typical increase towards low advance ratios. The high-power input of the rotor may lead to a net thrust contribution from the nacelle and spinner towards very low advance ratios. It is interesting that for the maximum efficiency design, the drag behaviour is not showing any expected behaviour due to the much stronger (non-linear) interaction between the rotor and its hubline. Considering the spinner only as in the left plot of Fig. 24, its drag coefficient shows a strong dependence on both the average advance ratio due to the variation in flight Mach number as well as along the iso-pitch line reflecting the thrust variations on the rotor. The effect of the rotor is clearly visible because the blade section is part of the spinner control surface. Figure 25 shows the corresponding drag coefficient of the nacelle, where, in terms of trends, a similar conclusion can be drawn as for the spinner and the given normalisation leads to strong variations along all the individual pitch lines, and both designs behave very differently. Introducing a modified drag coefficient based on the induced velocity according to Equation (9) and as shown in Fig. 25 (right), the variation along the individual pitch lines remains, but both designs are much better comparable, and the characteristic of each pitch line is very similar with only a slight offset. This should be considered when introducing and discussing any drag-related performance metrics.


Open fan maps with contours of overall efficiency. (a) Min. drag design (b) Max. efficiency design (c) Combined design.

Open fan maps with contours of installation efficiency. (a) Min. drag design (b) Max. efficiency design (c) Combined design.

Open fan maps with contours of overall installed efficiency. (a) Min. drag design (b) Max. efficiency design (c) Combined design.

3.6 Design choice considerations and summary
Finally, the map-based performance of three final design choices is discussed. The first two designs correspond to the maximum efficiency and the minimum drag designs introduced and discussed in the previous sections. Based on the analysed trends, it is apparent that a compromise between both design objectives is needed and neither is expected to deliver optimal performance in terms of overall installed efficiency. Consequently, a third design is derived by simply combining the ‘max. eff.’ blades with the ‘min. drag’ annulus lines and respective core splitter design. Note that simply combining the designs resulted in a thrust loss of about 3% due to the missing pressure force from the nacelle and hence increased overall installed efficiency. Maps of all three designs are shown in Figs. 26–28. In terms of overall or blade-only efficiency, the combined design achieves peak efficiencies in between the ‘min. drag’ and the ‘max. eff’. However, its performance remains noticeably below the values of the maximum efficiency design, and close to the ‘min drag’ design. This means that the blade performance suffers from the missing pressure force over the blade rows induced by the annulus. In terms of installation efficiency, the ‘min. drag’ design has the overall highest values, but the combined design is very close, yielding similar installation drag characteristics as the ‘min. drag’ design. As the most relevant metric, finally the overall installed efficiency is shown in Fig. 28 again for all three designs. Clearly, the off-design characteristics in terms of the size and location of the efficiency islands differ noticeably. This is an indication that the strong static pressure fields induced by the annulus behave differently at lower flight speeds than cruise because of compressibility. It is important to keep in mind the different baseline RPM for each design, resulting in a different location of the actual cruise point in each map. However, the final design should not only be optimised to ideally have its maximum overall installed efficiency at cruise condition (which is not the case here for either design), but also off-design characteristics, aero and flutter stability as well as structural viability under 1P-loads induced by angle-of-attack conditions.
Finally, the following table shall help consolidate the results by summarising the trends observed across all parametric variations discussed in the preceding sections, with the aim to add clarity and allow for easier comparison.
3.7 Aircraft integration considerations
The integration of the open fan engine into the aircraft obviously is another key element and affects both the aircraft performance as well as the behaviour of the component itself. In addition to the studies made in this paper, the different propulsor and nacelle designs were taken advantage of within installation studies of a wing-mounted open fan based on the DLR-F25 aircraft. Translating the propulsor blade row performance to an actuator disc model enabled parametric studies regarding the placement of the engine relative to the wing, along with an assessment of the resulting lift and drag characteristics of the entire aircraft, including the propulsion system. One result of this study is that positioning the engine below and ahead of the wing leads to a local reduction of the effective angle-of-attack and thus to a reduction in wing lift. A range of engine positions was investigated based on the position of the rotor in relation to the wing’s leading edge. An example from those studies is shown in Fig. 29. The effect on the propulsor is being evaluated in ongoing studies, and it is expected that dedicated design adaptations of the component might be necessary to compensate for the detrimental effects of engine installation on overall performance of the open fan.
First results from open fan aircraft integration studies.

4.0 Conclusions and outlook
In the paper, we investigated the performance potential of an open fan with emphasis on the interdependence between the blade and nacelle design. It was shown that very high levels of blade-only efficiency could be achieved, taking advantage of the static pressure field of the nacelle, part of which is translated to thrust via the blades. The design potential lies in minimising the nacelle drag together with the blades, leading to a performance-optimal open fan for which the most relevant efficiency-related metric is the overall installed efficiency. Optimising this exchange rate, which essentially means to what extent a part of the nacelle flow field can be translated into thrust via the turbomachinery blades, is the key element during detailed design. Based on the results discussed in the paper and keeping in mind the research questions that were formulated, the following conclusions can be drawn:
-
• In an open fan context, neither optimising for highest blade efficiency nor minimising the spinner and nacelle drag will lead to an installed efficiency-optimal configuration. Although very high component efficiency levels can be reached by taking advantage of hub line curvature, the increased nacelle drag consumes large portions of this artificial gain when considering the nacelle drag (RQ1 – Efficiency vs drag-design trade-off).
-
• Blade-only overall efficiency and installed overall efficiency, within certain boundaries, can be traded against each other with an exchange rate of approximately −4:1, meaning that 4% in blade efficiency gain costs about 1% in terms of installed efficiency. This is supported by theory, although it needs to be stressed that the blade-only efficiency metric stems from non-consistent bookkeeping and unclosed control surface analysis. It is still useful considering that component responsibilities are not always along physically meaningful boundaries. It might also be useful during conceptual design iterations of the propulsor to correct the blade sections’ performance (RQ1 – Efficiency vs drag-design trade-off).
-
• Thrust generation of the rotor and respective changes in induced velocity or stagnation pressure vary the downstream nacelle drag, but not dramatically. Elevated stagnation pressure ratio levels tend to increase the positive forces on the nacelle aft body, reducing the overall drag, but decrease the viscous forces. The latter only makes up a small portion of the entire drag, which is dominated by form drag (RQ2 – Blade-Nacelle interaction).
-
• Conventional metrics used in drag analysis might not be useful in an open fan context because the downstream nacelle is subjected to energised fluid from the rotor, very much dependent on induced velocities and elevated stagnation pressure levels (RQ2 – Blade-nacelle interaction).
-
• The core inlet and splitter design is identified as a key element in open fan design requiring more attention in future design efforts. High loss levels in the region of the rotor hub with strong secondary flows will have a severe impact on core operability and downstream components. Reducing pre-entry drag to the core or inlet momentum, respectively, is challenging due to the very high Mach number levels in combination with the necessary curvature distribution and diffusion required by the rotor. Hub gaps from the pitch control mechanism will further complicate the aerodynamics in this region (RQ3 – Core engine integration).
-
• Different map generation strategies and the respective impact on the performance metrics were discussed, along with assumptions being made regarding core mass flows and pitch control schedules over the entire flight regime. Breaking down the open fan performance into installed and uninstalled efficiency enabled a direct assessment at cycle level by feeding those results directly into the performance tools; the results of those cycle assessments based on the given maps will be documented in upcoming publications (RQ4 – Link between component and engine cycle).
Acknowledgements
The Short-Medium Range Aircraft Architecture and Technology Integration Project (SMR ACAP, project number: 101101955) is supported by the Clean Aviation Joint Undertaking and its members.
Disclaimer
Co-funded by the European Union. Views and opinions expressed are, however, those of the author(s) only and do not necessarily reflect those of the European Union or Clean Aviation Joint Undertaking. Neither the European Union nor the granting authority can be held responsible for them.
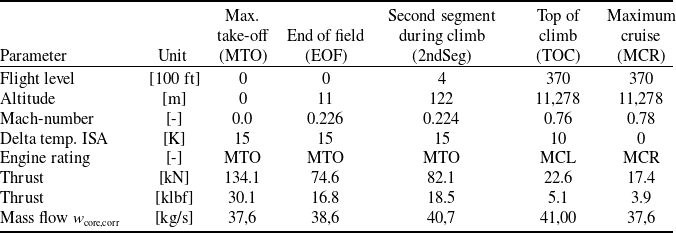


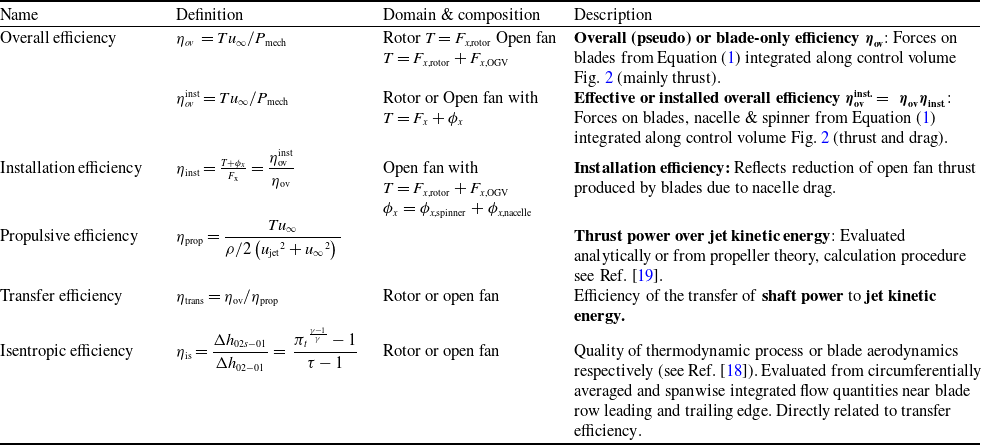

 β
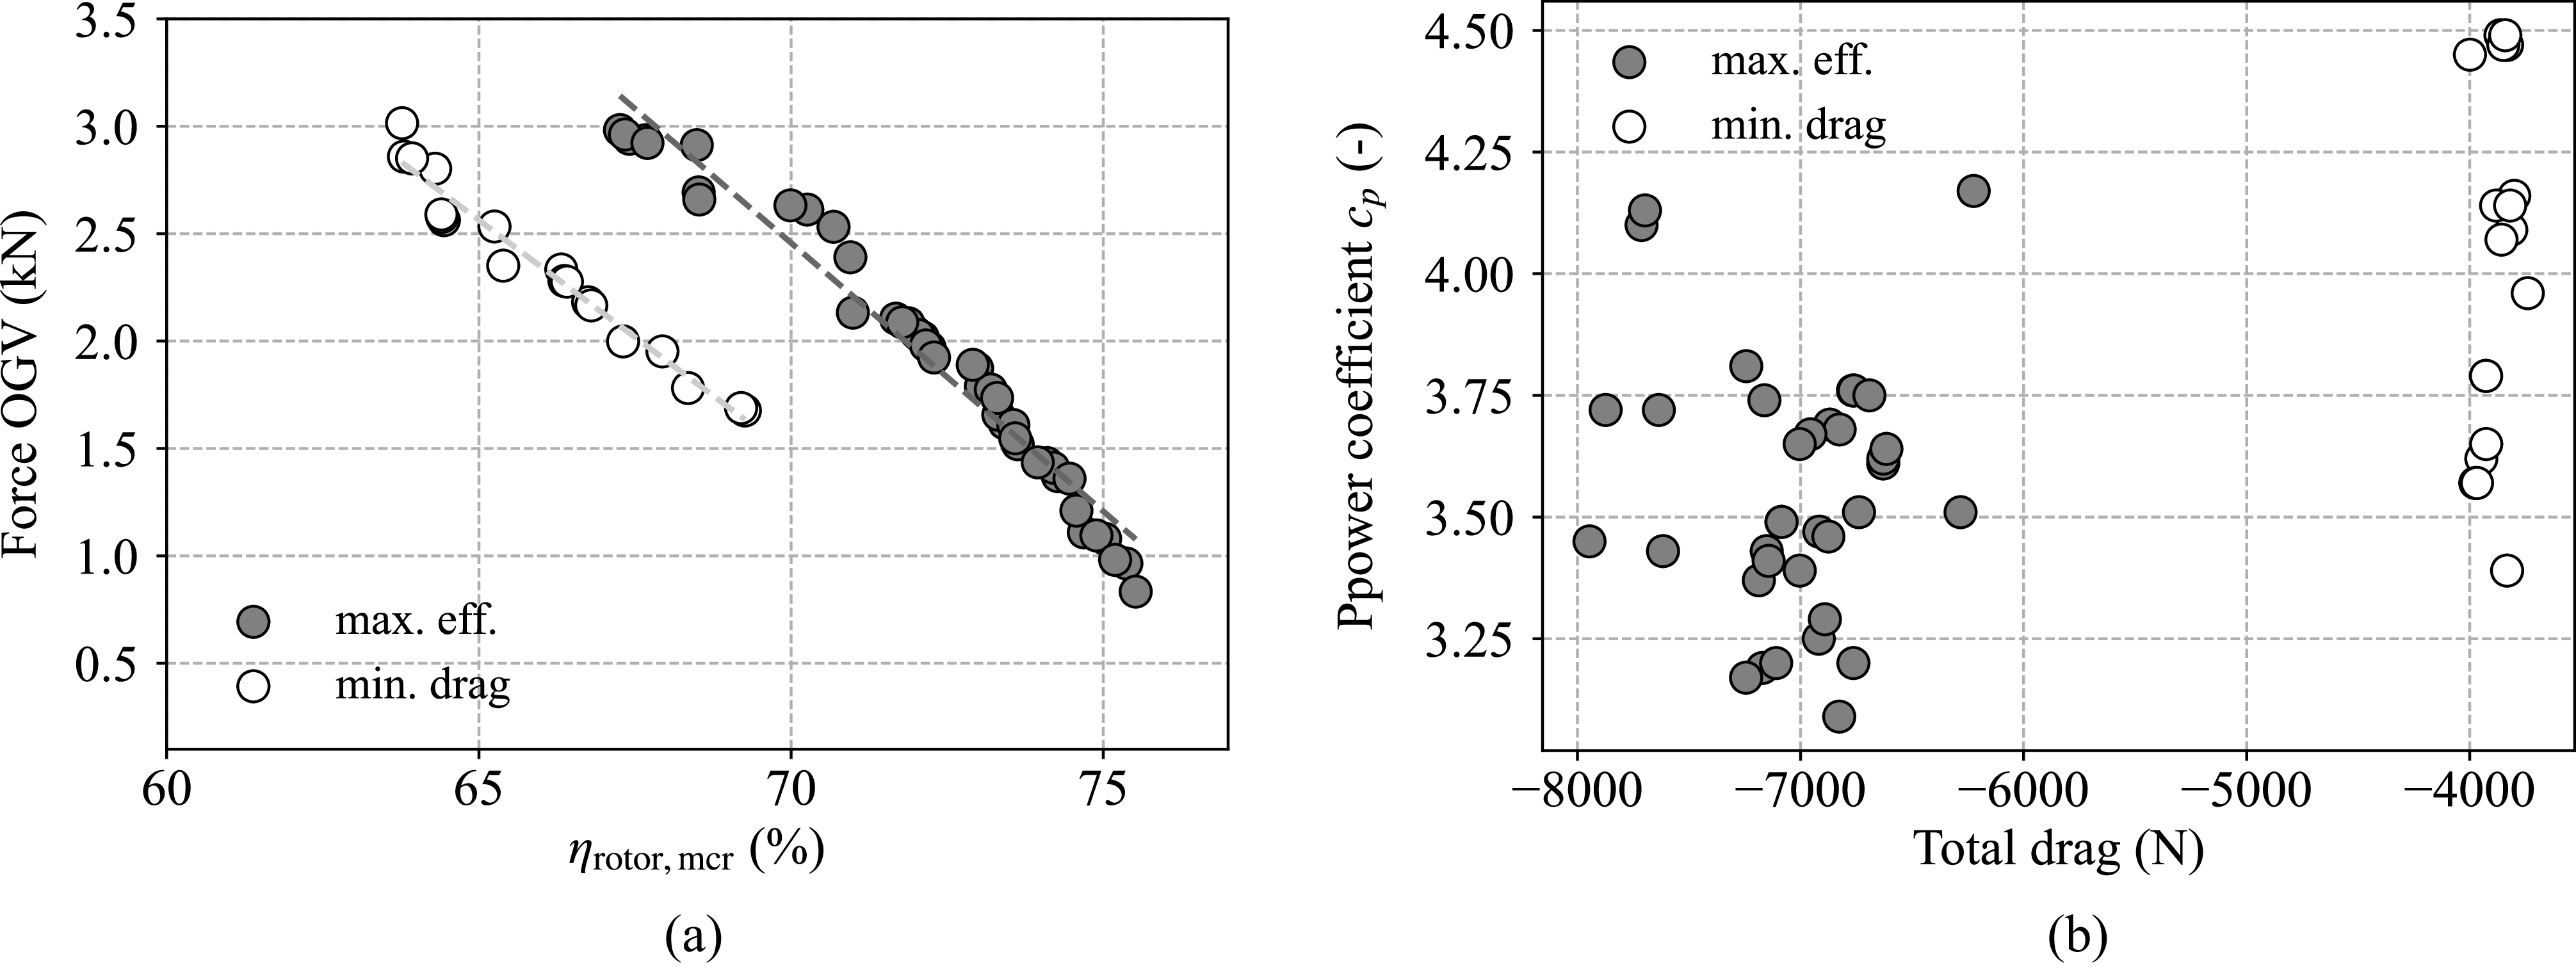
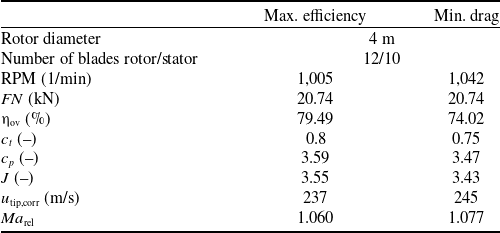
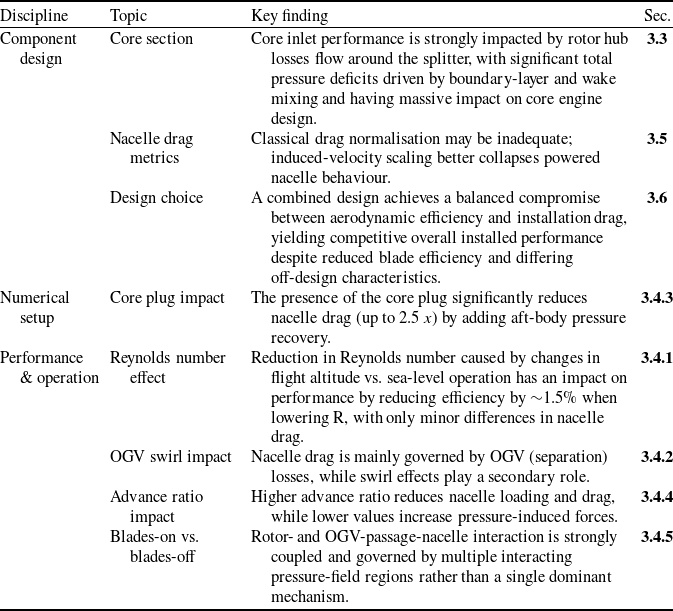

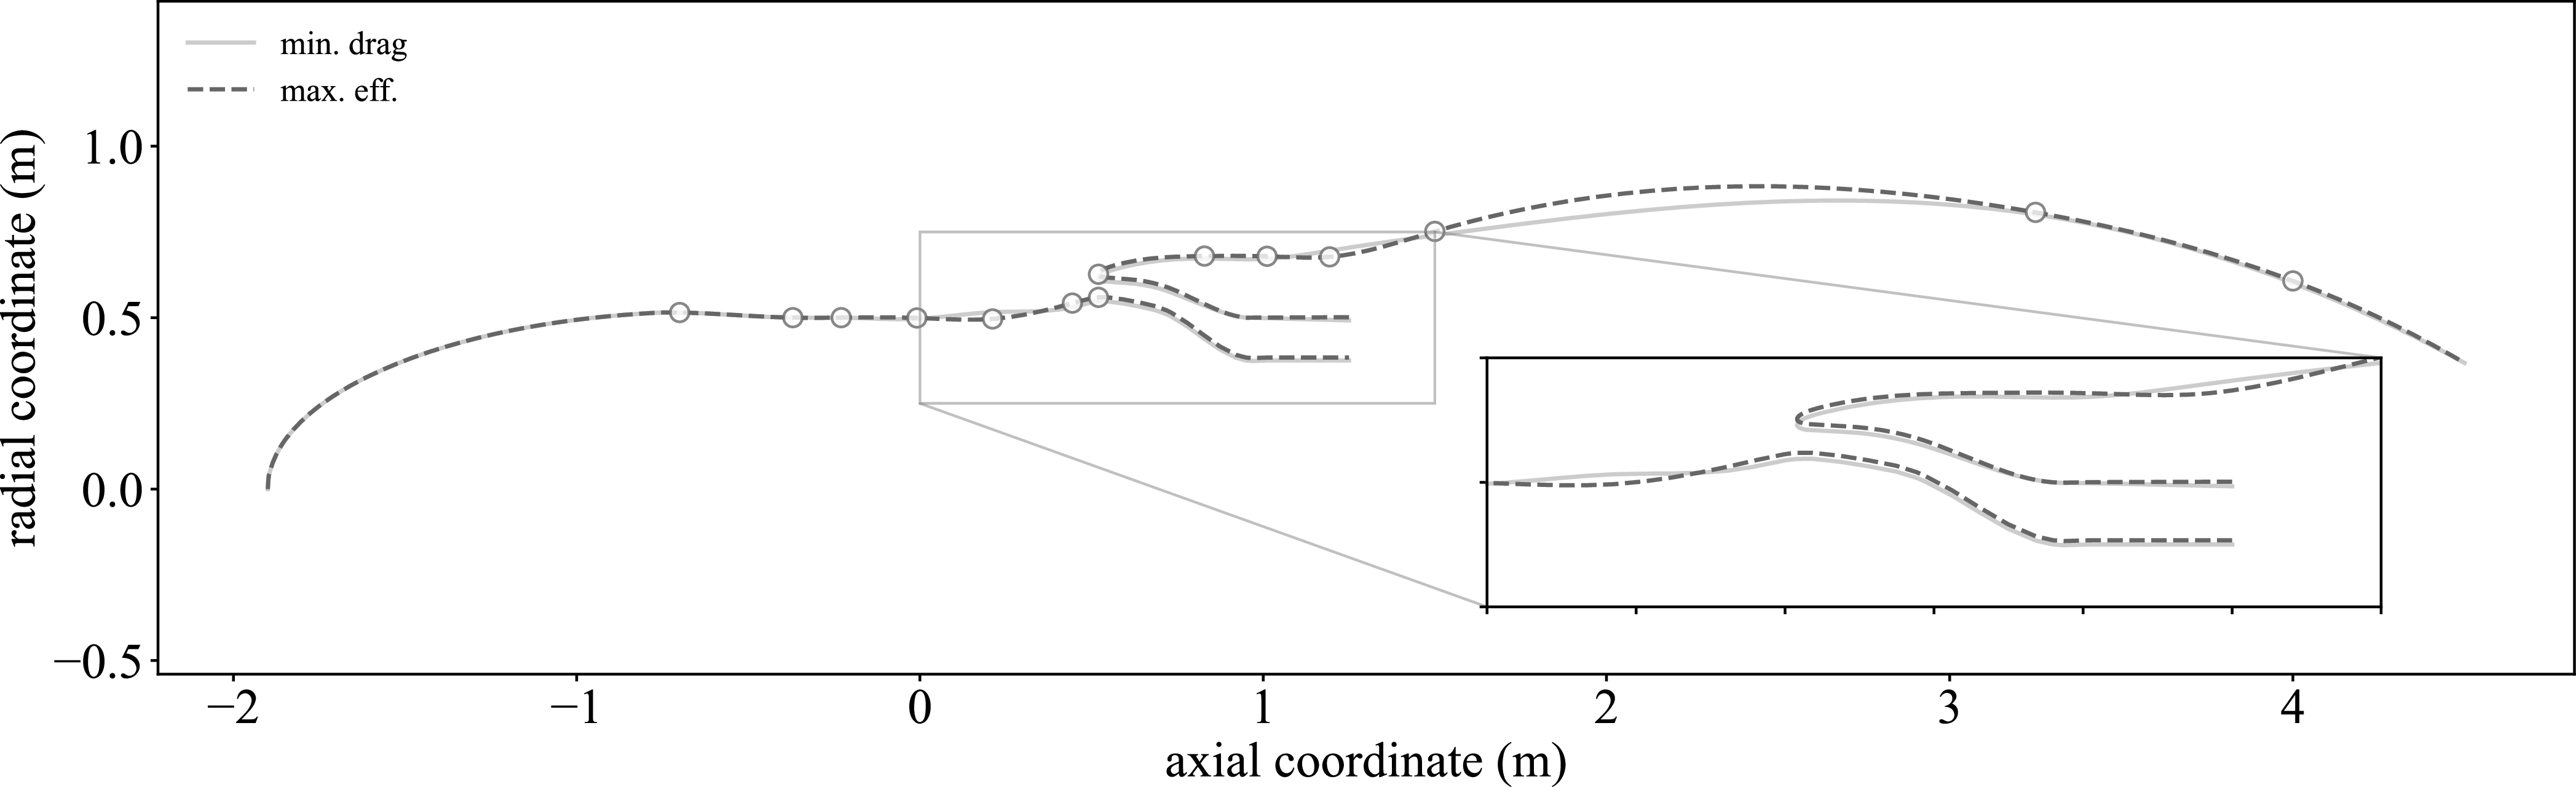

 Δcp
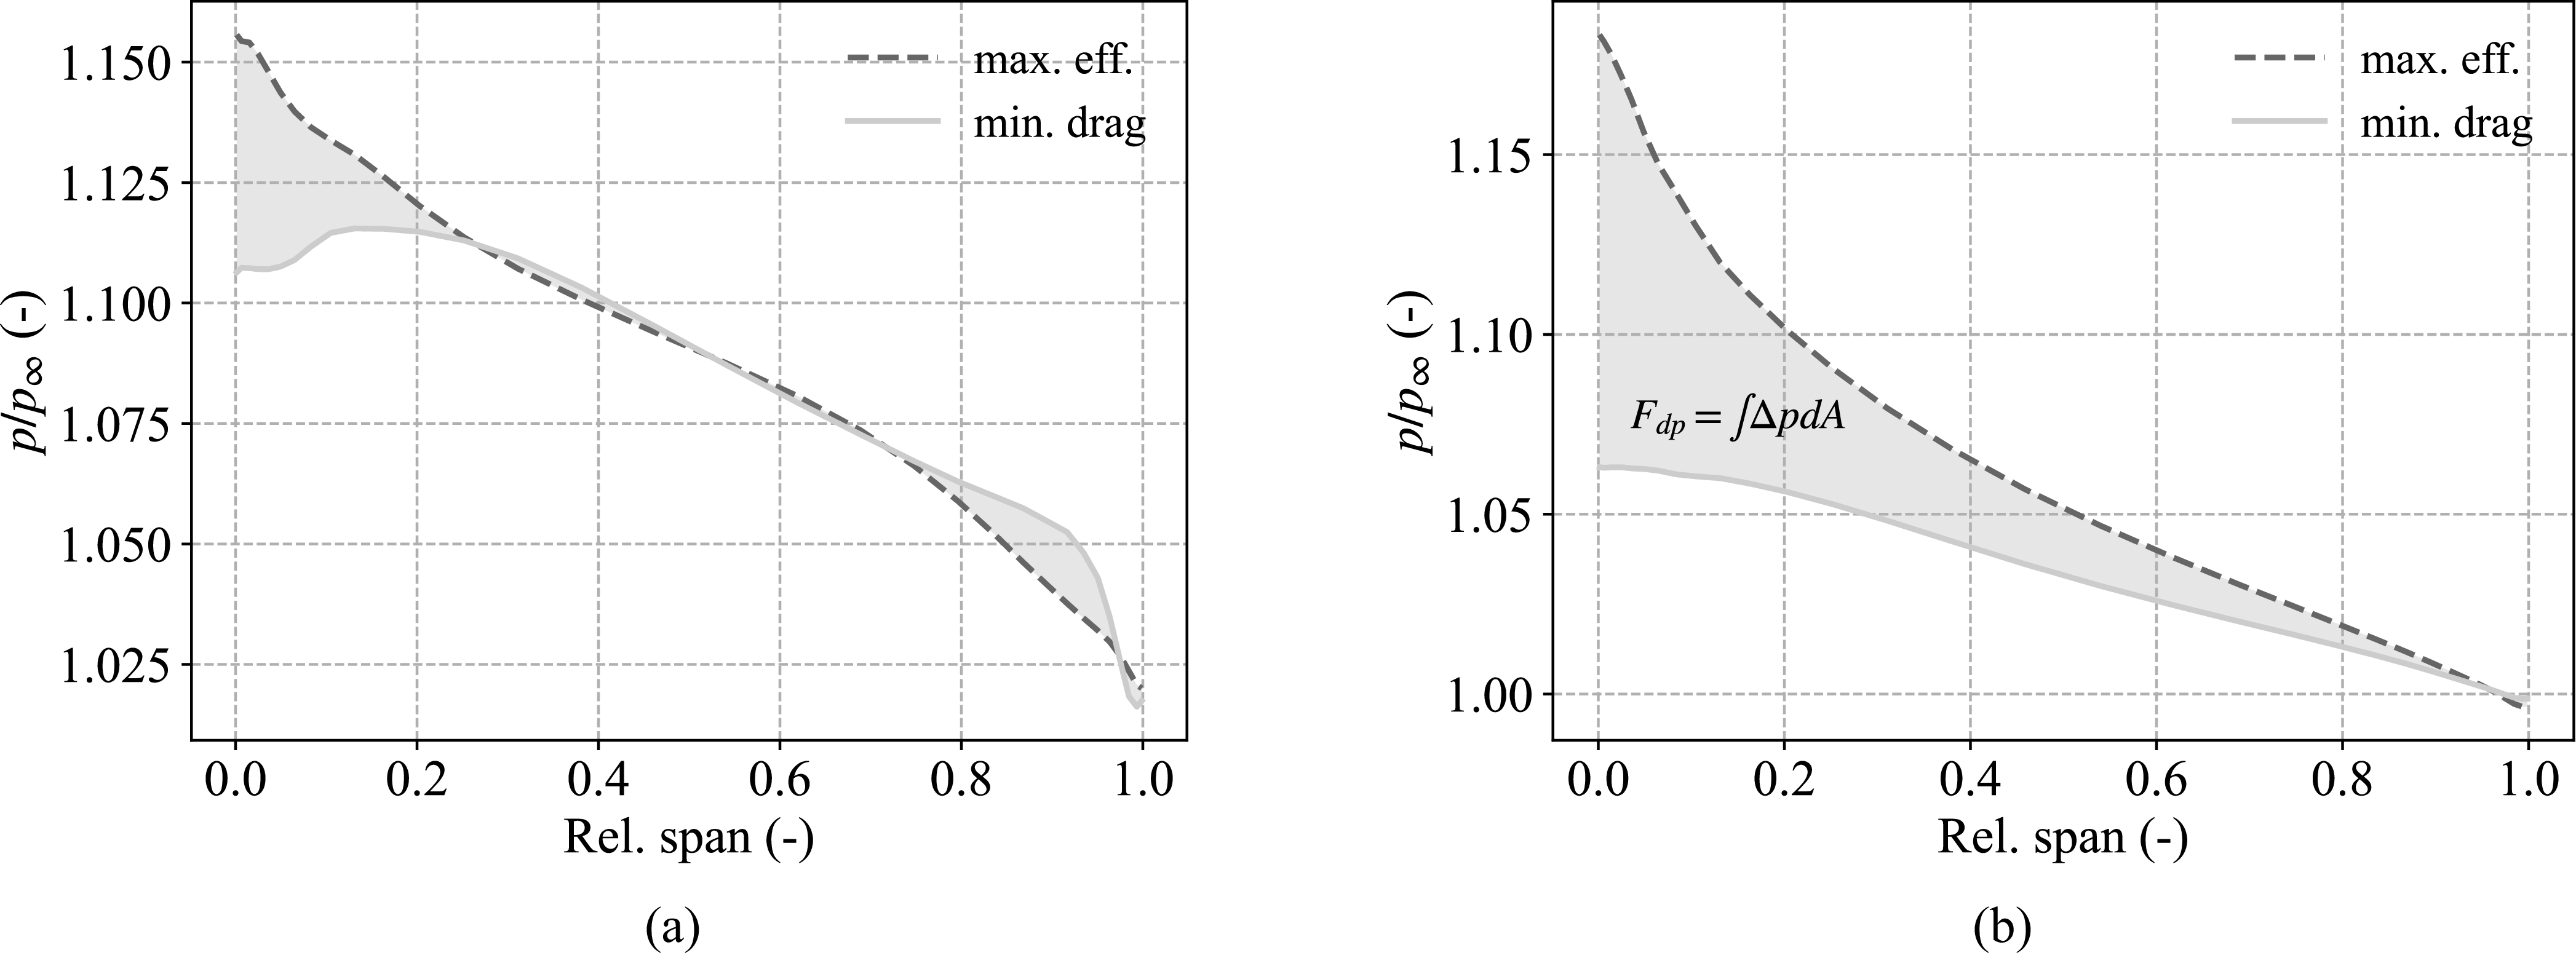


 Δηovinst/Δηov≈−1:4
 ηtrans=1→ηov=ηprop
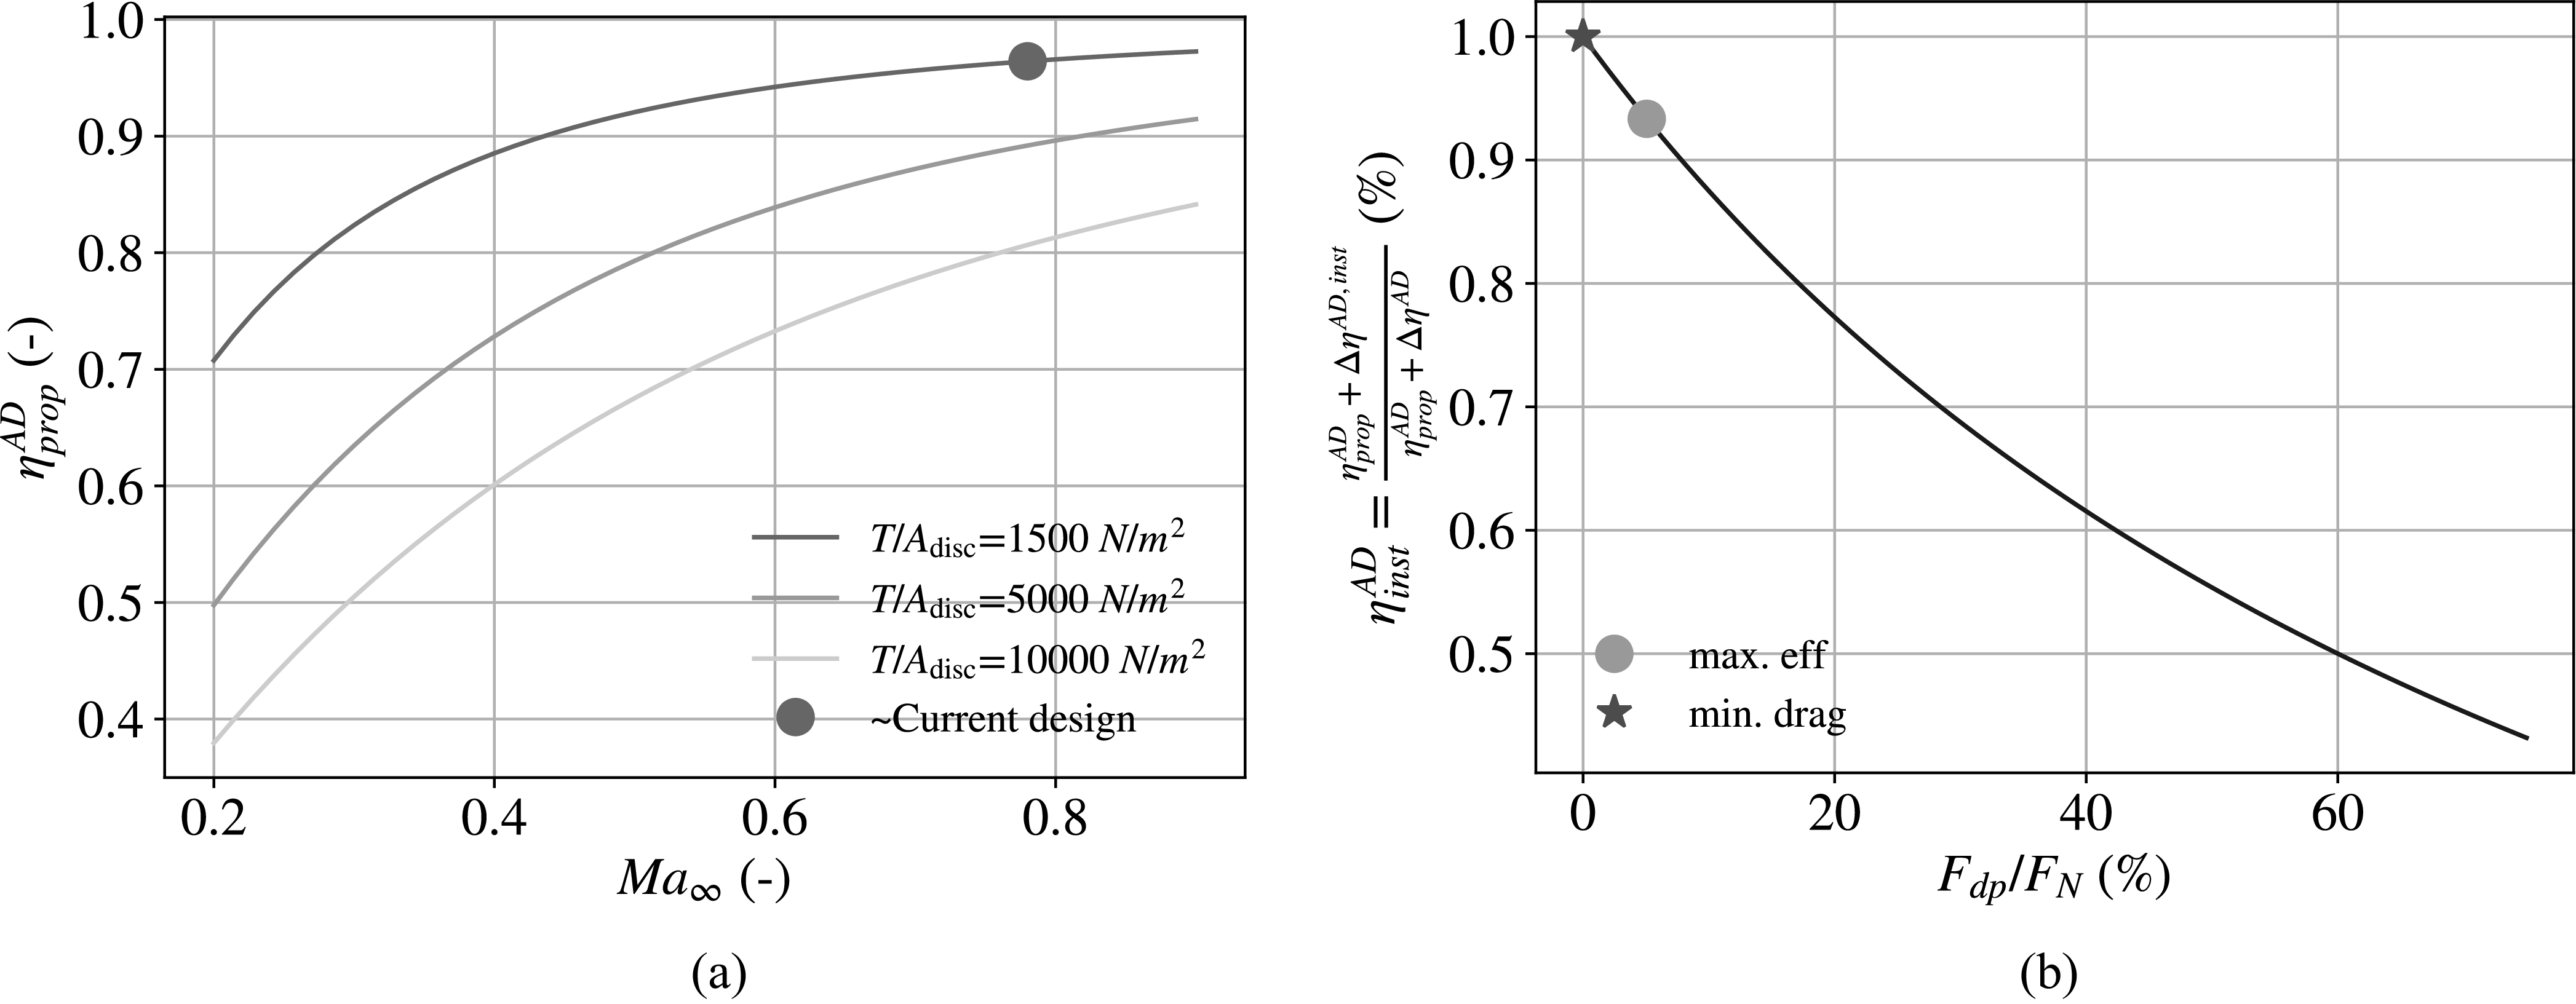

 pcore,inlet/p∞
 β


 β

 β

 β


 β

 β
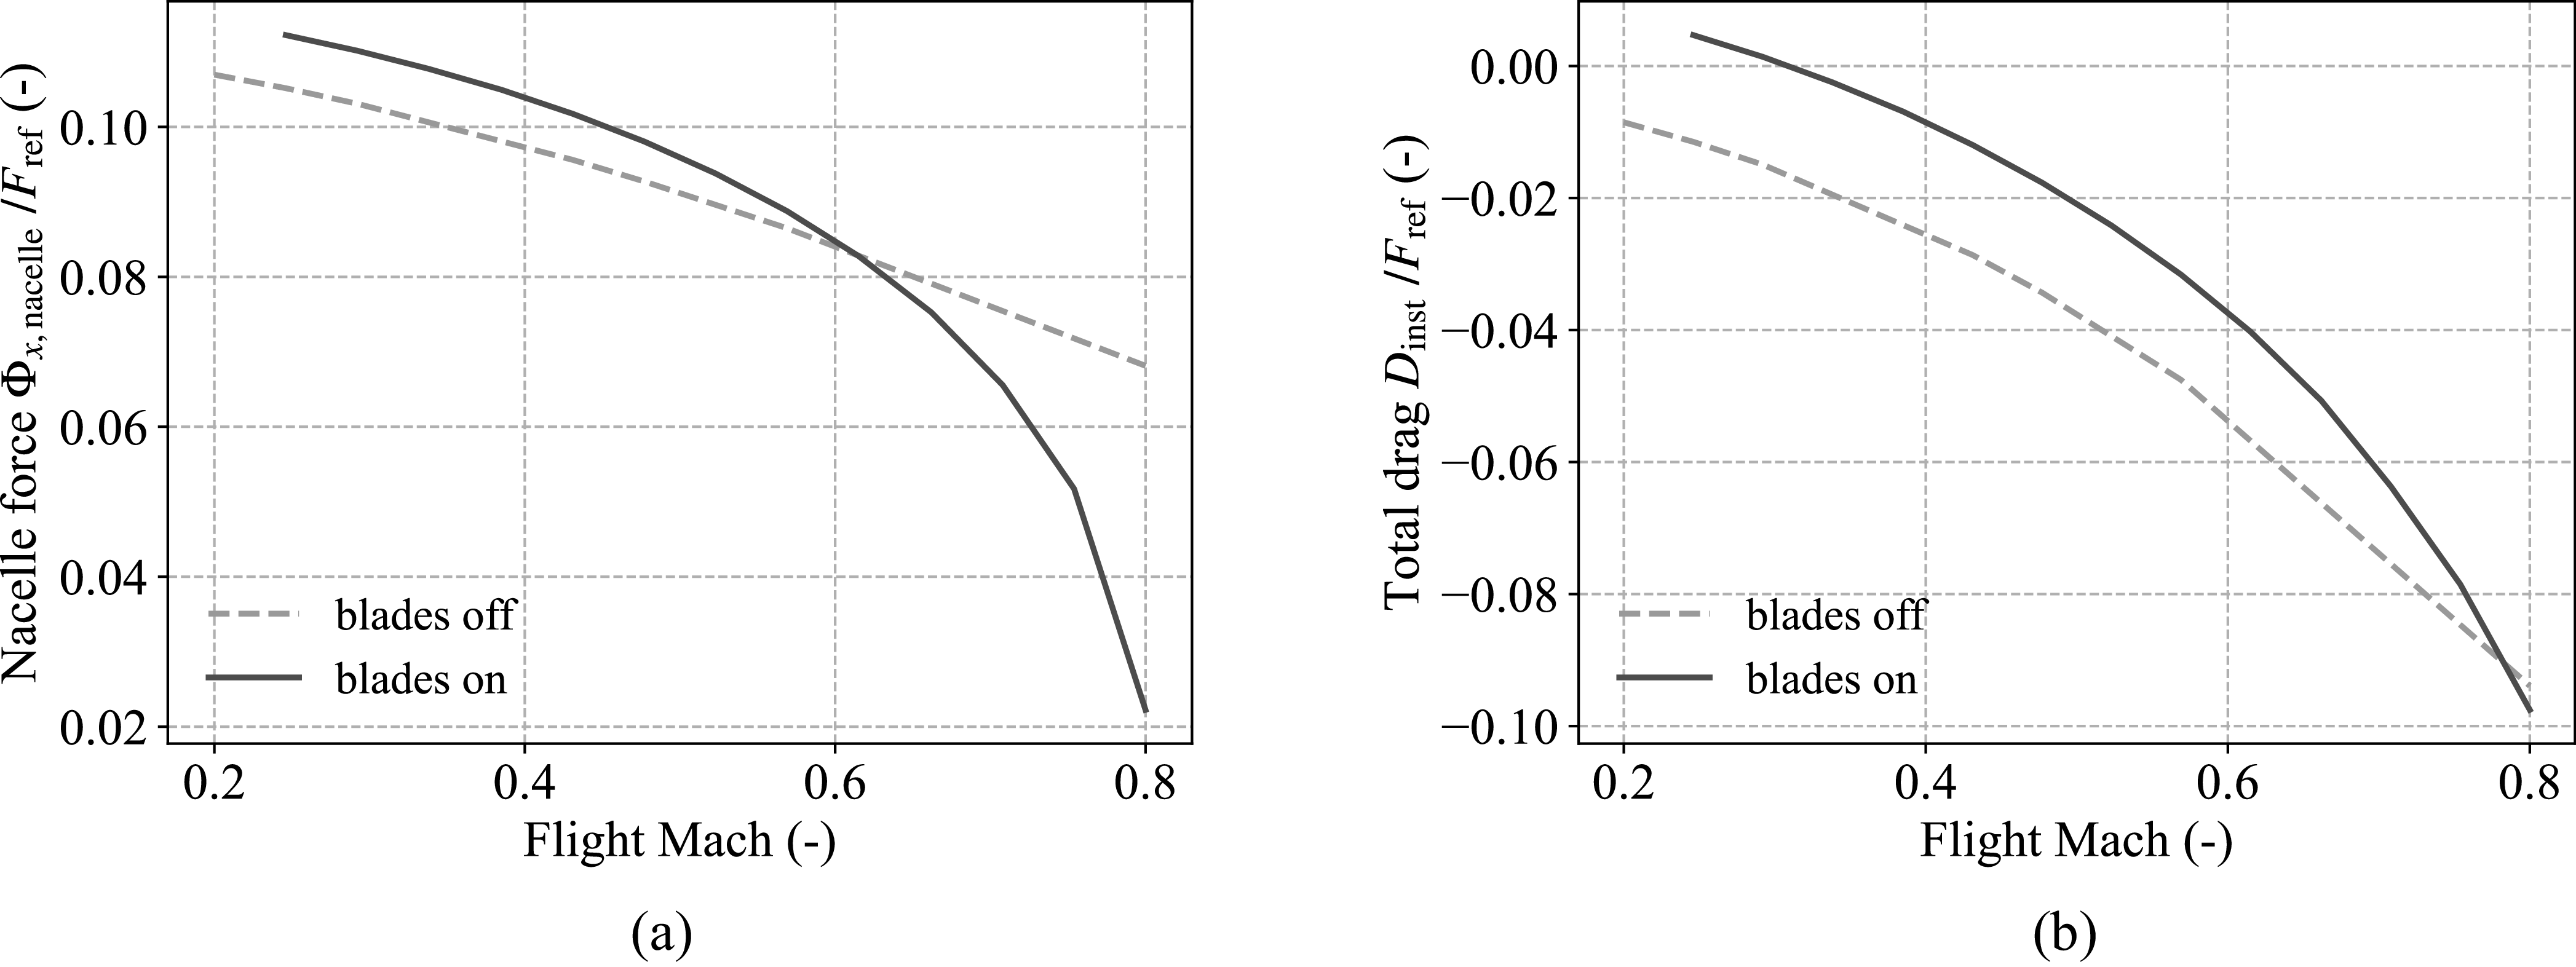


 cD


 Open access

