





1. Introduction
Traumatic spinal cord injury (SCI) affects an estimated 305,000 people in the United States and causes weakness or paralysis in the limbs (N. S. C. I. S. Center, 2024). Frequent long-term complications of SCI include osteoporosis, pressure ulcers, and loss of muscle mass (McKinley et al., 1999; Bauman and Cardozo, Reference Bauman and Cardozo2015; Sezer et al., 2015; Clark and Findlay, Reference Clark and Findlay2017). There is evidence that these symptoms can be diminished through functional electrical stimulation (FES) that applies low-level, repetitive electrical currents transcutaneously to paralyzed muscles to elicit active muscle contractions. FES-elicited contractions promote muscle growth and blood flow and can decrease the risk of pressure ulcers (Bogie et al., 2006; Dolbow et al., 2013). Forces exerted on the bone by active FES-induced muscle contractions may reduce or reverse the bone loss that often occurs in people with SCI due to lack of bone loading (Frotzler et al., Reference Frotzler, Coupaud, Perret, Kakebeeke, Hunt, Donaldson and Eser2008; Clark and Findlay, Reference Clark and Findlay2017; Lambach et al., Reference Lambach, Stafford, Kolesar, Kiratli, Creasey, Gibbons, Andrews and Beaupre2020). In addition, the application of FES in people with incomplete SCI can improve walking ability and independence (Donaldson et al., 2000; Kapadia et al., Reference Kapadia, Masani, Craven, Giangregorio, Hitzig, Richards and Popovic2014).
Despite the numerous benefits of FES, the prevalence of fatigue during FES-induced muscle contractions compared to volitional muscle contractions presents a major limiting factor. The rapid onset of muscle fatigue during FES causes deterioration of generated muscle forces, impacting functional movements. This fatigue onset is attributed to nonselective (Gregory and Bickel, Reference Gregory and Bickel2005) and simultaneous recruitment of fast and slow motor units (Doucet et al., 2012) during FES. This is in contrast with volitional muscle contractions, which follow a physiological recruitment order (i.e., slow to fast motor unit recruitment). Moreover, voluntary contractions use asynchronous recruitment for efficient activation amongst motor units. Physiologically similar approaches have been developed to mitigate fatigue during FES-only control, such as asynchronous stimulation (Downey et al., 2015a, 2015b) and frequency modulation (Ding et al., 2003; del Ama et al., Reference del Ama, Koutsou, Bravo-Esteban, Gómez-Soriano, Piazza, Gil-Agudo, Pons and Moreno2013). Although these methods can slow fatigue progression, they may not reduce the overall stimulation duty cycle sufficiently to promote adequate muscle recovery. Hybrid systems that combine FES with powered exoskeleton assistance offer an alternative strategy by offloading a portion of the required joint torque to motors, thereby reducing stimulation demands while preserving the physiological benefits of muscle activation (Sheng et al., Reference Sheng, Sun, Molazadeh and Sharma2021a; Gasperina et al., 2024).
In this article, we introduce a physiologically informed switching control paradigm for hybrid exoskeleton-assisted walking and evaluate muscle fatigue and gait performance metrics under different exoskeleton-FES control schemes. Our prior work developed a switching controller for input-delayed wearable robotic systems with theoretical stability guarantees under conservative assumptions (Sheng et al., Reference Sheng, Sun, Molazadeh and Sharma2021a). The present study extends this framework by incorporating US imaging–informed muscle state awareness, with the goal of evaluating feasibility and performance under realistic physiological conditions rather than experimentally certifying formal stability guarantees. A strong correlation exists between US-derived muscle strain and muscle fatigue (Sheng et al., Reference Sheng, Sharma and Kim2020), and, unlike dynamometer measurements, US images can be obtained during walking. We used a muscle efficiency index (MEI)-based switching criterion in which the MEI estimate is generated by a model-based fatigue observer that is periodically corrected using discrete US-derived measurements. This physiological feedback operates in a sampled-data manner rather than as continuous real-time sensing. To the authors’ knowledge, this is the first time a fatigue-based switching controller has been employed in real-time walking experiments.
The aims of this study are to (1) experimentally evaluate the feasibility of switching control of a hybrid exoskeleton for walking and (2) compare muscle fatigue progression, kinematics, and control effort during walking with hybrid, FES-only, and exoskeleton-only control. The primary focus is on understanding performance trade-offs rather than demonstrating controller superiority or population-level clinical efficacy. While the hybrid and FES-only control are directly compared, exoskeleton-only control was employed as a baseline that does not cause stimulation-induced fatigue. The controllers are evaluated in participants with and without SCI, with the latter included to assess system behavior across a broader range of neuromuscular conditions in this preliminary investigation.
2. Hybrid exoskeleton control design
The control objective is to track desired hip and knee joint angle trajectories during walking. We design a switched control mechanism that switches between two exoskeleton controller modes (hybrid and exoskeleton only) based on a sampled-data observer that receives real-time US updates to estimate MEI during walking.
2.1. Dynamic model
We use a two-link leg model to represent swing dynamics

where
$ q={\left[{q}_h,{q}_k\right]}^T $
 represents the hip and knee angles, respectively, with their first and second time derivatives denoted by
$ \dot{q},\ddot{q}\in {\mathrm{\mathbb{R}}}^2 $
 .
$ D,C\in {\mathrm{\mathbb{R}}}^{2\times 2} $
 are the inertial and Coriolis matrices,
$ {M}_{ev},G,W\in {\mathrm{\mathbb{R}}}^2 $
 are the passive viscoelastic, gravitational, and unknown disturbance torques, and
$ \tau \in {\mathrm{\mathbb{R}}}^2 $
 is the active torque due to motors and FES. The ground reaction torque is represented by
$ {\tau}_{ext}\in {\mathrm{\mathbb{R}}}^2 $
 and is multiplied by a switching signal
$ \sigma =\left\{0,1\right\} $
 , where
$ \sigma =0 $
 during the swing phase and
$ \sigma =1 $
 during the stance phase. The joint-level torques
$ {\tau}_i $
 ,
$ i=\left[h,k\right] $
 , may be broken down as

where
$ {T}_{m,i}\in \mathrm{\mathbb{R}} $
 is the torque due to the motor at joint
$ i $
 and
$ {T}_{s,i}^e,{T}_{s,i}^f\in \mathrm{\mathbb{R}} $
 are the torques due to FES activation of the extensor and flexor muscles, respectively. For
$ j=\left[e,f\right] $
 , the FES-elicited torques are calculated as

for MEI
$ {\mu}_i^j\in \left[{\varsigma}_i^j,1\right] $
 , unknown bounded nonlinear function
$ {\eta}_i^j\left(q,\dot{q}\right)\in {\mathrm{\mathbb{R}}}^{+} $
 , and delayed control input
$ {u}_{a,i,{\tau}_i^j}^j={u}_{a,i,}^j\left(t-{\tau}_i^j\right) $
 . The constant electromechanical delay is represented as
$ {\tau}_i^j\in {\mathrm{\mathbb{R}}}^{+} $
 , and the input is normalized so that
$ {u}_{a,i,{\tau}_i^j}^j\in \left[0,1\right] $
 .
The MEI quantifies the degree of muscle fatigue and is subject to its own dynamics

where
$ {w}_{f_i}^j,{w}_{r_i}^j\in {\mathrm{\mathbb{R}}}^{+} $
 are fatigue and recovery time constants. A fully rested muscle will have an MEI of 1, whereas a fully fatigued muscle will have an MEI of
$ {\varsigma}_i^j\in \left(0,1\right) $
 .
The motor torque in (2.2) is given by

for motor constant
$ {K}_{m,i}\in {\mathrm{\mathbb{R}}}^{+} $
 and normalized input
$ {u}_{m,i}\in \left[-1,1\right] $
 .
2.2. Switching controller
The control objective is to drive the joint angles
$ q $
 toward a desired trajectory
$ {q}_d(t)\in {\mathrm{\mathbb{R}}}^2 $
 using two modes. These modes are driven by a switching signal
$ \xi \in \mathrm{\mathbb{R}}. $
 When the hybrid mode (Mode H) is active,
$ \xi =1 $
 , whereas when the exoskeleton-only mode (Mode E) is active,
$ \xi =-1 $
 . A high-level diagram of the switching control scheme is provided in Figure 1. The switching controller alternates between modes based on muscle fatigue feedback. The controller begins in Mode H and remains in Mode H, with all MEIs initialized to 1. When at least one MEI falls below a predetermined threshold
$ \underline{\mu} $
 , the controller switches to Mode E. Once all muscles have recovered such that their MEIs are above another predetermined value
$ \overline{\mu}>\underline{\mu} $
 , the controller switches back to Mode H, and so forth. The switching logic is represented as follows:

High-level diagram of the switching control scheme. (a) The exoskeleton used in the experiments. (b) The switching control scheme. The controller alternates between hybrid (Mode H) and exoskeleton-only (Mode E) control based on real-time US-derived MEI values. There is no FES-only mode in the switching controller.

To describe the controller terms in the two modes, first, we introduce a proportional error
$ e\in {\mathrm{\mathbb{R}}}^2 $
 as

and an auxiliary error
$ r\in {\mathrm{\mathbb{R}}}^2 $
 as

for constants
$ \alpha, \beta \in {\mathrm{\mathbb{R}}}^{+} $
 , switching signal
$ \xi =\left\{-1,1\right\} $
 , and delay compensation term
$ {e}_c\in {\mathrm{\mathbb{R}}}^2 $
 . The delay compensation vector is calculated as

for the vectors
$ {e}_{c,i}^j\in {\mathrm{\mathbb{R}}}^2 $
 given by

The FES-elicited torques are given as

for constant gain
$ {K}_{a,i}^j\in \mathrm{\mathbb{R}} $
 . The motor torque is given by

for Mode H, where
$ {u}_{m_H} $
 is the motor input under Mode H, and by

for Mode E, where
$ {u}_{m_E} $
 is the motor input under Mode E. Combining (2.1) and (2.4)–(2.6) yields

2.2.1. Hybrid exoskeleton mode (H)
Mode H is governed by the feedback law

where
$ {K}_u\in {\mathrm{\mathbb{R}}}^{+} $
 and
$ {Q}_1^f,{Q}_1^e,{Q}_2,{Q}_3,{Q}_4\in {\mathrm{\mathbb{R}}}^{2\times 2} $
 are given as

for constant control gains
$ {\rho}_{s,i}\in {\mathrm{\mathbb{R}}}^{+} $
 . The electric motor gains are represented by
$ {\rho}_{m, ij}\in \mathrm{\mathbb{R}} $
 . The signum functions in
$ {Q}_1,{Q}_3 $
 account for the fact that the FES-elicited muscle torques are monoarticular and act in opposite directions. (Note that the FES-only controller utilized in treadmill walking is the same as (2.7) but without
$ {u}_{m_H} $
 .)
2.2.2. Exoskeleton-only mode (E)
Mode E is given by

for constant gain
$ {K}_v\in {\mathrm{\mathbb{R}}}^{+} $
 , small constant
$ {r}_c\in {\mathrm{\mathbb{R}}}^{+} $
 , and error vector
$ {y}_{er}={\left[{e}^T,{r}^T\right]}^T\in {\mathrm{\mathbb{R}}}^4 $
 . The guessing functions
$ \delta {\varPhi}^{\prime } $
 , which is positive globally invertible and nondecreasing, and
$ {\varPsi}^{\prime}\in {\mathrm{\mathbb{R}}}^{+} $
 are prescribed as


where
$ {\varPhi}_d(t)\in {\mathrm{\mathbb{R}}}^2 $
 is the desired torque obtained from (2.1) given
$ {q}_d(t),{\dot{q}}_d(t),{\ddot{q}}_d(t) $
 .
2.2.2.1. Remark
Details of control development as well as conditions for stability can be found in Sheng et al. (Reference Sheng, Sun, Molazadeh and Sharma2021a). While our previous work establishes rigorous stability criteria, deriving gain conditions that strictly satisfy these criteria under realistic physiological variability would require substantial additional analysis. Importantly, these criteria are sufficient – but not necessary – for stability, which allows the present study to evaluate the fatigue-compensation abilities of the controller using heuristically tuned gains that achieve safe and satisfactory performance. We selected functions similar to those in Sheng et al. (Reference Sheng, Sun, Molazadeh and Sharma2021a). The magnitudes were lower than those in Sheng et al. (Reference Sheng, Sun, Molazadeh and Sharma2021a) because, during initial testing,
$ \delta {\varPhi}^{\prime}\left(\left\Vert {y}_{er}\right\Vert \right)\left\Vert {y}_{er}\right\Vert +{\varPsi}^{\prime } $
 was large enough that it dominated
$ {u}_{m_E} $
 as defined in (2.8). Reducing the magnitudes of these functions allowed the
$ {K}_vr $
 term to influence controller behavior.
2.3. Sampled-data observer
A sampled-data observer as described in Iyer et al. (Reference Iyer, Sun, Lambeth, Singh, Cleveland and Sharma2024) was used to update the model-based MEI estimate in real time. Let the model-based MEI estimate of muscle
$ i,j $
 be
$ {\hat{\mu}}_i^j $
 , and let the US-derived MEI estimate at sample time
$ {t}_k $
 be
$ {\mu}_i^j\left({t}_k\right) $
 . The sampled-data structure combines the two estimates as

where
$ \gamma \in {\mathrm{\mathbb{R}}}^{+} $
 is a user-defined constant. A larger
$ \gamma $
 places greater emphasis on the US-derived MEI. The error term
$ {\tilde{\mu}}_i^j\left({t}_k\right) $
 is given by

This value is updated only when a new US-derived measurement is available. Conditions for asymptotic convergence of
$ {\tilde{\mu}}^i $
 to 0 may be found in Iyer et al. (Reference Iyer, Sun, Lambeth, Singh, Cleveland and Sharma2024).
We presented the algorithm for calculating US-derived axial strain in Sheng et al. (2020), where we established a correlation between FES-induced fatigue of the quadriceps and axial strain during isometric contractions. The basis of this algorithm is finding the displacement between successive frames at each 2D coordinate using an adaptive speckle-tracking algorithm (Lubinski et al., 1999). For stronger contractions, greater muscle tissue motion is produced, and therefore the average strain value across a 2D region of the muscle is larger. As muscle force and tissue motion decay with the onset of fatigue, strain also decays. We therefore consider a fully rested muscle to have an MEI of
$ \mu =1 $
 , whereas a muscle with an MEI of
$ 0 $
 is fatigued to the extent that it no longer responds to FES.
3. Experiments
In this section, we describe the treadmill and overground walking experiments. The treadmill experiments evaluated each of the three control cases, while the overground experiments evaluated the switching controller. The switching controller alternated between hybrid and exoskeleton-only modes and did not incorporate an FES-only mode. The experimental set up is shown in Figure 2.
Exoskeleton setup. Close-up view of the left leg depicting the hip and knee motors, quadriceps FES electrodes, and linear US probe.

3.1. Stimulation mapping
Prior to experiments, each participant’s threshold and saturation currents,
$ {I}_t\in {\mathrm{\mathbb{R}}}^{+} $
 and
$ {I}_s\in {\mathrm{\mathbb{R}}}^{+} $
 , respectively, were identified using the methods in Kirsch et al. (Reference Kirsch, Alibeji and Sharma2017). For both the stance and swing phases, the current supplied to the quadriceps,
$ {I}_Q\in {\mathrm{\mathbb{R}}}^{+} $
 , and to the hamstrings,
$ {I}_H\in {\mathrm{\mathbb{R}}}^{+} $
 , were calculated as follows:

For cases where
$ {u}_s^e $
 ,
$ {u}_s^f\le 0 $
 , the decision was made to map
$ {u}_s^f $
 ,
$ {u}_s^e $
 to 0 mA rather than to
$ {I}_t $
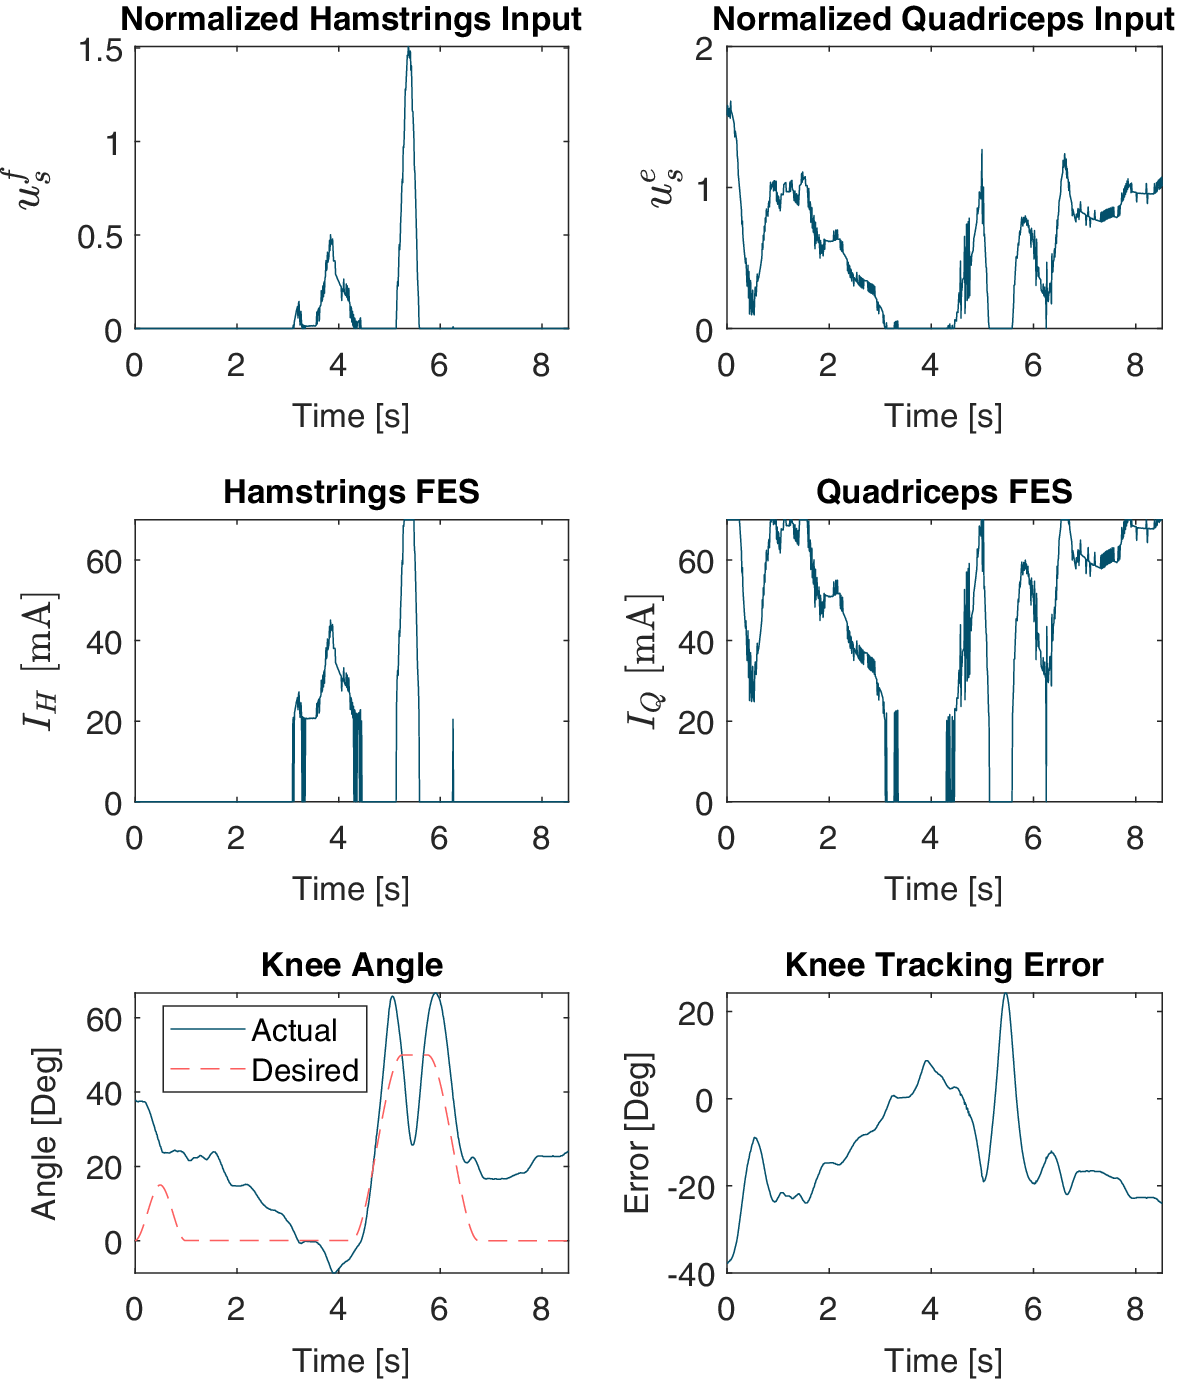
 to avoid agonist–antagonist coactivation and constant muscle stimulation. Figure 3 illustrates how (3.1) maps control input to current.
The top row depicts the hamstrings and quadriceps control inputs from (2.7) (
$ {u}_s^f $
 and
$ {u}_s^e $
 , respectively) over one gait cycle of FES-only control. The middle row shows how these inputs are mapped to hamstrings current
$ {I}_H $
 and quadriceps current
$ {I}_Q $
 . The bottom row shows the actual and desired knee angles during the gait cycle as well as the knee tracking error, defined as
$ {q}_d-q $
 .

Figure 3. Long description
The figure consists of six line graphs, all sharing a horizontal X-axis of Time in seconds from 0 to 8.
Top-Left Panel: Normalized Hamstrings Input u sub s super f. The Y-axis ranges from 0 to 1.5. The data shows two distinct peaks: a smaller jagged peak around 4 seconds and a sharp, narrow peak reaching 1.5 at approximately 5.5 seconds.
Top-Right Panel: Normalized Quadriceps Input u sub s super e. The Y-axis ranges from 0 to 2. The data shows high activity at the start, dropping near 0 at 3.5 seconds, then rising with multiple jagged peaks between 5 and 8 seconds.
Middle-Left Panel: Hamstrings F E S current I sub H in m A. The Y-axis ranges from 0 to 60. The trend mirrors the top-left graph, showing current spikes corresponding to the normalized inputs, peaking at 60 m A.
Middle-Right Panel: Quadriceps F E S current I sub Q in m A. The Y-axis ranges from 0 to 60. The trend mirrors the top-right graph, with current levels fluctuating and saturating at 60 m A during the active phases.
Bottom-Left Panel: Knee Angle in degrees. The Y-axis ranges from -10 to 60. It compares ‘Actual’ (solid blue line) and ‘Desired’ (dashed red line). The desired path shows a trapezoidal pulse between 4.5 and 6.5 seconds. The actual path follows the general shape but exhibits higher peaks and oscillations.
Bottom-Right Panel: Knee Tracking Error in degrees. The Y-axis ranges from -40 to 20. The error fluctuates significantly, starting at -40, rising toward 0, and showing a sharp positive spike to 20 degrees at 5.5 seconds before stabilizing around -20 degrees.
3.2. Gait segmentation and desired trajectory generation
The finite state machine, which is depicted in Figure 4 and was previously presented in Iyer et al. (Reference Iyer, Sun, Lambeth, Singh, Cleveland and Sharma2024), is time-based, not event-based. For participants with disabilities, the 2-s initialization phase is followed by a 20-s sit-to-stand phase. No motor assistance is provided during the initialization phase. A 10-s rest phase occurs before the onset of the right half-step. Note that the first step is a half-step because walking starts with the feet together. In participants with no disabilities, the initialization phase is immediately followed by the right half-step phase. The right half-step, as well as all subsequent full step phases, is 3.5 s in duration. The right half-step is followed by a 0.75-s rest/double support phase (DSP) wherein all desired trajectories are held constant. Next is the first full left step, and the finite state machine continues cycling between full steps and DSP phases until the experiment is finished. (Note that, for participant A3, the roles of the left and right leg were switched because data were collected from the right leg, not the left. This was because this participant’s right leg was significantly more responsive to FES than the left leg.) The desired trajectories themselves are created using third-order polynomial time scaling (Lynch and Park, Reference Lynch and Park2024), which requires only the duration and initial and final desired angles of each subphase.
(a) The finite state machine governing both treadmill and overground walking. DSP = double support phase.
$ st= $
 state time, or the time since the last state change. (b) Desired trajectories with gait phase.

Figure 4. Long description
Panel a is a flowchart of a finite state machine. It begins at Initialize, moving right to Sit-to-Stand when s t is greater than 2 s, then right to Rest when s t is greater than 20 s, and right to Right Half-Step when s t is greater than 10 s. From Right Half-Step, the path splits: one arrow leads down to Right D S P when s t is greater than 3.5 s, and another leads left to Right Step when s t is greater than 3.5 s. The main gait cycle forms a loop: Right D S P leads left to Left Step when s t is greater than 0.75 s; Left Step leads up to Left D S P when s t is greater than 3.5 s; Left D S P leads right to Right Step when s t is greater than 0.75 s; and Right Step leads down back to Right D S P when s t is greater than 3.5 s.
Panel b contains two line graphs with Time in seconds on the x-axis.
1. Desired Hip Trajectory: The y-axis is Hip Angle in degrees. The curve rises to 50 degrees during the Left Swing Phase (purple background), stays flat through the Left D S P (gray), then drops to 0 during the Right Swing Phase (red) and remains at 0 through the Right D S P (green).
2. Desired Knee Trajectory: The y-axis is Knee Angle in degrees. The curve rises to 50 degrees and falls back to 0 during the Left Swing Phase. It remains at 0 through the Left D S P. During the Right Swing Phase, it shows a small peak of approximately 15 degrees before returning to 0 for the Right D S P.
3.3. Treadmill walking with three control cases
This study was approved by the Institutional Review Board of North Carolina State University (IRB Approval # 20553). Three participants with SCI and three participants with no disabilities walked on a split-belt treadmill (Bertec, OH, USA) while wearing a powered lower-limb exoskeleton (INDEGO, Ekso Bionics, CA, USA) with bilateral hip and knee motors. Participant demographics are reported in Table 1.
Participant demographics

Table 1. Long description
The table consists of five columns: Subject, Age, Gender, Injury level, and Leg.
* Subject A 1: 55, M, T 10, incomplete, L.
* Subject A 2: 62, M, T 7, complete, L.
* Subject A 3: 47, M, T 12, incomplete, R.
* Subject B 1: 21, F, N / A, L.
* Subject B 2: 35, M, N / A, L.
* Subject B 3: 30, M, N / A, L.
Participants used parallel bars for balance, and a physical therapist provided additional stabilization for the SCI group. The Indego possesses built-in FES ports, which delivered stimulation to the quadriceps and hamstrings. Because FES was not applied to the hip muscles, the control laws from Section 2 were applied only to the knee joint, with the hip joint controlled simply as
$ {u}_{m,1}={k}_hr $
 for constant
$ {k}_h\in {\mathrm{\mathbb{R}}}^{+} $
 . Furthermore,
$ {\tau}_{ext} $
 was not measured and thus neglected during the stance phase. The exoskeleton motors and FES were controlled by Simulink Desktop Real-Time using MATLAB (R2020b, MathWorks, MA, USA) with a control frequency of 100 Hz. Stimulation was administered at a pulsewidth of 300
$ \mu $
 s and a frequency of 40 Hz. Subject-specific saturation and threshold currents were used, while generalized parameters for
$ D $
 ,
$ G $
 , and
$ {M}_{ev} $
 were used to calculate
$ {\varPhi}_d $
 in (2.8).
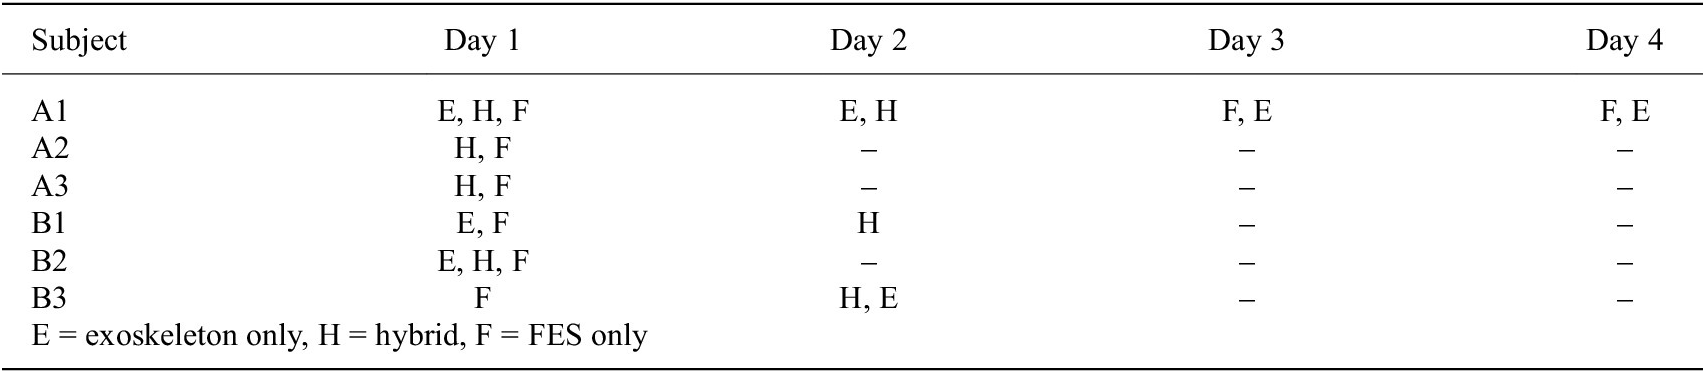
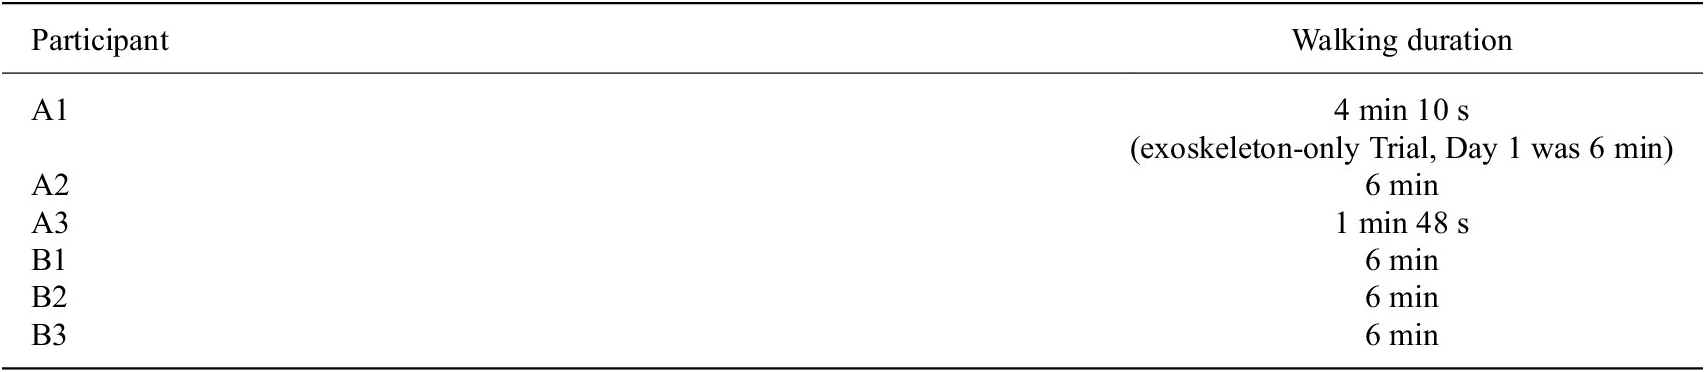
Each participant performed at least one hybrid exoskeleton trial and one FES-only trial, with one SCI participant completing multiple trials of each case. One SCI participant and all participants with no disabilities also walked with exoskeleton-only control. Participants walked for 6 min or the maximum amount of time which they could consistently walk, whichever was less. See the Appendix for details regarding the trial orders (Table A2) and for the durations each participant walked (Table A3).
Prior to walking, a linear US transducer (L7.0SC Prodigy Probe, S-Sharp, Taiwan) was secured along the quadriceps over the rectus femoris and vastus intermedius. Visual inspection using live B-mode imaging was used to verify that the location was suitable, that is, that a visible muscle contraction occurred in response to a 2-s FES pulse. For all US imaging, the participant remained seated to ensure an isometric contraction. US images were collected using a Prodigy Research Platform with an NVIDIA Titan V GPU (NVIDIA, CA, USA). Prior to each trial, five FES-elicited contractions were imaged, each for 0.5 s in duration. The same US imaging procedure was conducted immediately concluding each trial. To allow for muscle recovery, a minimum 10-min rest period was provided between walking trials if more than one trial was performed in the same day.
The controllers were tested only on the left knee (this was with the exception of participant A3, for whom the controllers were applied on the right knee due to the left quadriceps not eliciting a strong extension torque in response to FES). The hip motors and contralateral knee motor were controlled using position-based PID control, and a finite state machine governed the desired joint trajectories.
For each trial, root-mean-square (RMS) values of the FES current amplitudes were calculated from the onset of the right (left for participant A3) half-step state to the onset of the final right (left) step state. RMS values for participant A1, who completed multiple trials of each control case, were averaged across all trials of that respective case.
For each contraction in each pre-walking and post-walking trial, the peak strain value in the contraction was identified. All five pre-walking and all five post-walking strain peaks were normalized with respect to the maximum strain peak across both datasets. The average of the normalized pre-walking peaks was taken and considered the mean strain value for the pre-walking dataset, and likewise for the post-walking dataset. The difference between the pre-walking and post-walking mean peak normalized strain values was then determined and considered the change in strain for that trial and participant.
3.4. Overground walking with switching controller
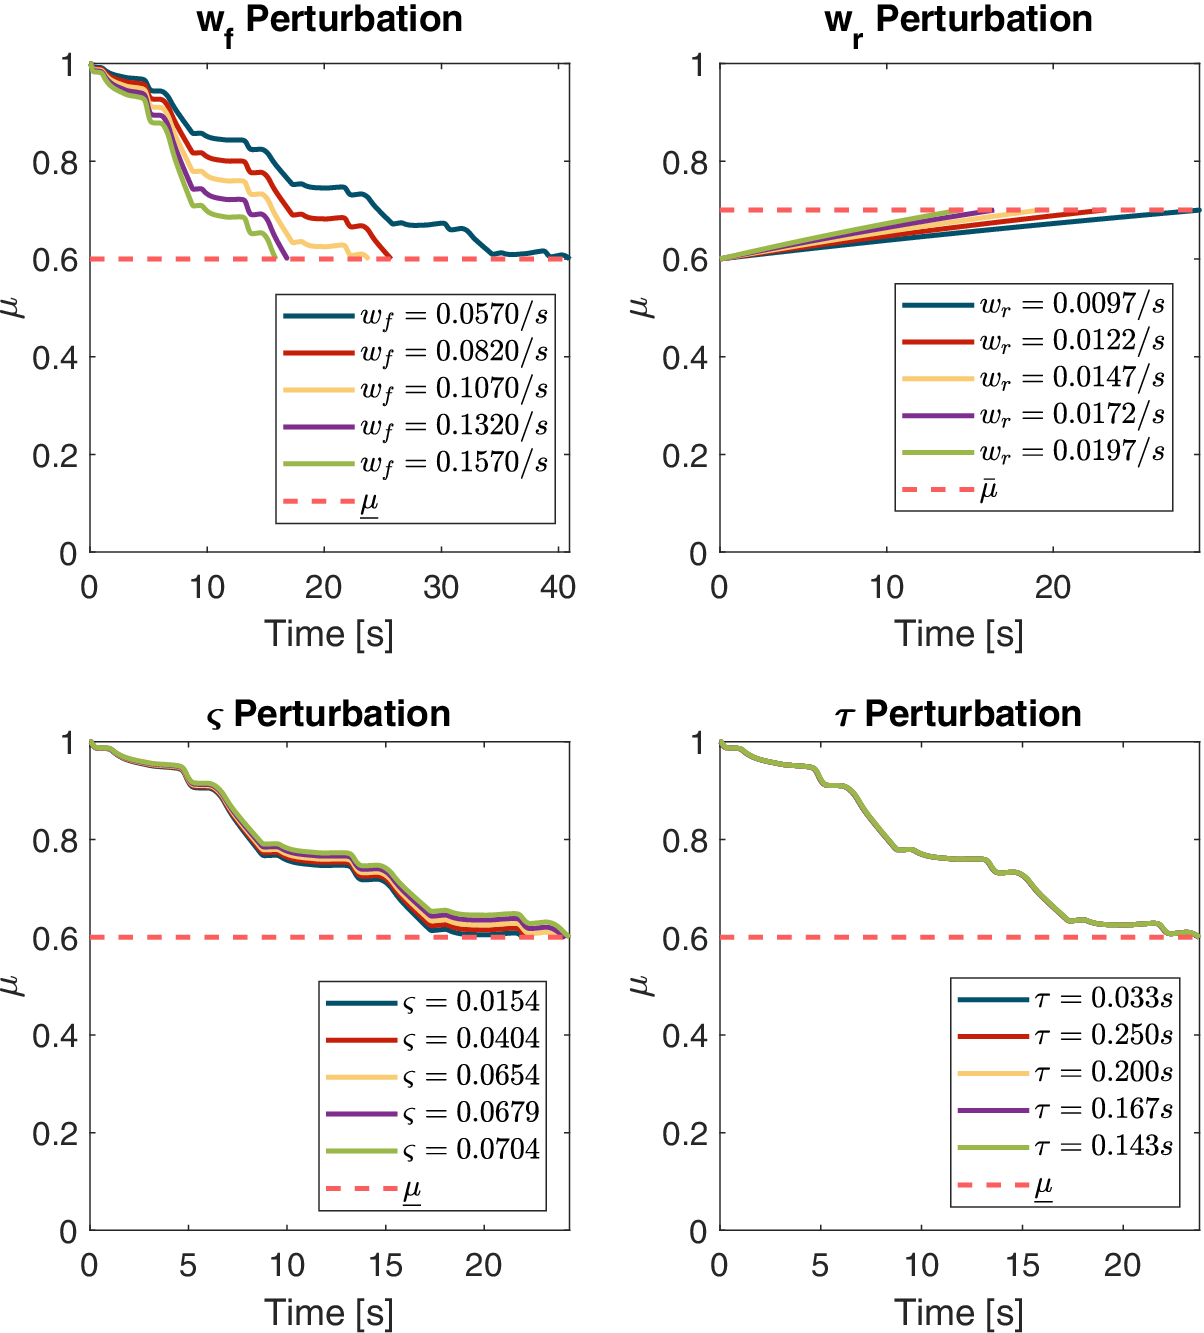
Two participants with SCI and three participants with no disabilities completed overground walking with the switching controller. A participant with SCI can be seen walking in Figure 5. Participants walked for 6 min or the maximum duration they could comfortably walk, whichever was less. The hamstrings MEI estimate was purely model-based using (2.3) with subject-specific parameters identified prior to experiments following the method in Bao et al. (Reference Bao, Sheng, Dicianno and Sharma2021), originally adapted in real-time control from Riener et al. (Reference Riener, Quintern and Schmidt1996). Values of the muscle parameters are reported in the Table A1, and a numerical sensitivity analysis of switching times with parameter perturbations is provided in Figure A1. For the quadriceps, the sampled-data observer in (2.11) was used.
Exoskeleton-assisted walking frames. A participant completes a step with exoskeleton assistance. (a) The participant starts in double support (left foot forward), (b) initiates right toe off, (c) enters the right swing phase, and (d) ends in double support (right foot forward).

Figure 5. Long description
A sequence of four photos labeled a through d from left to right.
* Panel a. The participant stands with both feet on the ground. The left foot is positioned forward while the right foot is behind. The participant grips the handles of a silver metal walker. The exoskeleton is visible as black mechanical bracing around the waist, thighs, and lower legs.
* Panel b. The participant shifts weight forward. The heel of the right foot is lifted off the ground while the toes remain in contact.
* Panel c. The right leg is lifted entirely off the ground and moves forward in a swing motion. The left leg remains planted for support.
* Panel d. The right foot makes contact with the ground in front of the left foot. Both feet are now on the ground again, completing the step with the right foot forward.
Prior to walking, five isometric FES-induced contractions of the quadriceps were imaged. The mean strain value was considered to correspond to an MEI value of 1, which was used to normalize US-derived strain values during walking so that MEI remained between 0 and 1. The quadriceps were imaged during the stance phase once every four gait cycles, and, once calculated, the computed US-derived MEI was sent to the observer.
4. Results
4.1. Switching controller
For all participants, the switching controller switched from hybrid control to exoskeleton-only control once muscle fatigue was detected by the sampled-data observer, and it switched back to hybrid control when muscle recovery was detected (recall that the FES-only control mode is not implemented in the switched design). The switching controller therefore functioned as desired, with fatigue and recovery thresholds tuned as-needed due to participants’ varying fatigue model parameters. Because the subject-specific parameters had a clear impact on the switching behavior, the threshold values for fatigue (
$ \underset{\_}{\mu } $
 ) and recovery (
$ \overline{\mu} $
 ), which governed switching behavior, were tuned accordingly. Participants with smaller values of fatiguing constant
$ {T}_f=1/{w}_f $
 saw more rapid decreases in the model-based MEI estimate, which precipitated faster switches to exoskeleton-only control. Participants with larger values of recovery constant
$ {T}_r=1/{w}_r $
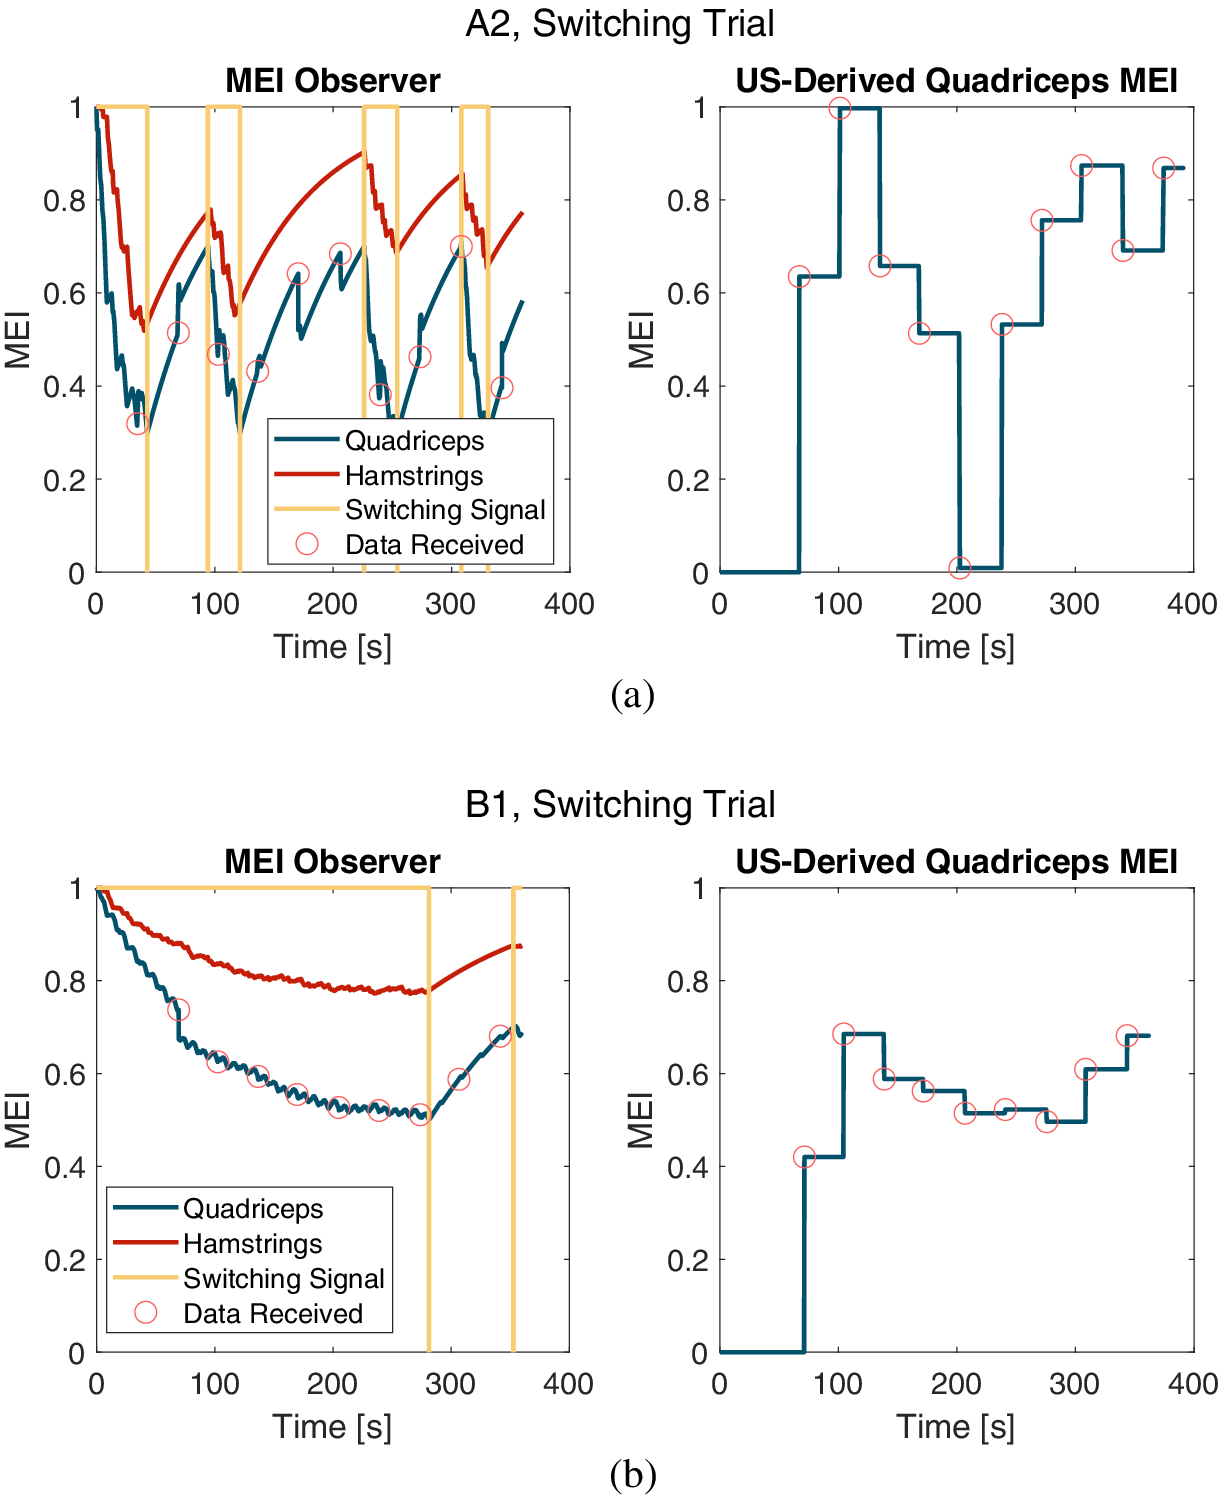
 saw slower recoveries of the model-based MEI estimate and therefore slower returns to hybrid control. For example, compared to participant A2 in Figure 6(a), participant B1 had a larger value of
$ {T}_f $
 and thus slower model-based fatigue progression. Thus, for B1, the controller switched to exoskeleton-only control only once during the 6-min trial, as can be seen in Figure 6(b). This is despite the fact that the MEI fatigue threshold for switching,
$ \underline{\mu} $
 , was lower for participant A2.
Left: The quadriceps MEI estimate from the sampled-data observer and the purely model-based hamstrings MEI estimate. For the switching signal,
$ \xi =1 $
 corresponds to Mode H and
$ \xi =-1 $
 to Mode E. The red circles highlight when the model is updated with a US-derived MEI estimate. Right: The values of the US-derived quadriceps MEI estimates. The sampled-data observer is updated with the US-derived estimate when a UDP packet is received from the US platform. (a) Plots for a subject with SCI. (b) Plots for a subject with no disabilities.

Figure 6. Long description
The figure consists of four line graphs organized into two rows, labeled (a) and (b). All graphs share an x-axis of Time in seconds from 0 to 400 and a y-axis of M E I from 0 to 1.
Row (a) A 2, Switching Trial for a subject with S C I:
- Left graph (M E I Observer): Shows three signals. The Quadriceps (blue) and Hamstrings (red) M E I estimates fluctuate between 0.3 and 1.0. A yellow Switching Signal toggles between 1 (Mode H) and -1 (Mode E). Red circles mark data updates on the Quadriceps line.
- Right graph (U S-Derived Quadriceps M E I): A blue step function showing discrete updates corresponding to the red circles in the left graph, with values jumping between 0 and 1.
Row (b) B 1, Switching Trial for a subject with no disabilities:
- Left graph (M E I Observer): The Quadriceps (blue) and Hamstrings (red) estimates show a smoother, gradual decay from 1.0 toward 0.5 and 0.8 respectively. The yellow Switching Signal remains at 1 for most of the trial, switching briefly near 300 and 350 seconds. Red circles indicate periodic updates on the Quadriceps line.
- Right graph (U S-Derived Quadriceps M E I): A blue step function showing discrete updates that stabilize between 0.4 and 0.7 after an initial jump from zero at 70 seconds.
During the overground walking, there was not a method of measuring ground reaction force, and therefore it was not included in the calculations for the control law for our experiments. Its inclusion may improve stance phase tracking, potentially reducing the delayed extension seen in Figure 7(d) and reducing the RMS errors (RMSEs) reported in the Table A7. Furthermore, in future walking trials with this controller, to account for the switched stance and swing dynamics, it is recommended that the gains in (2.7)–(2.8) be switched between these phases.
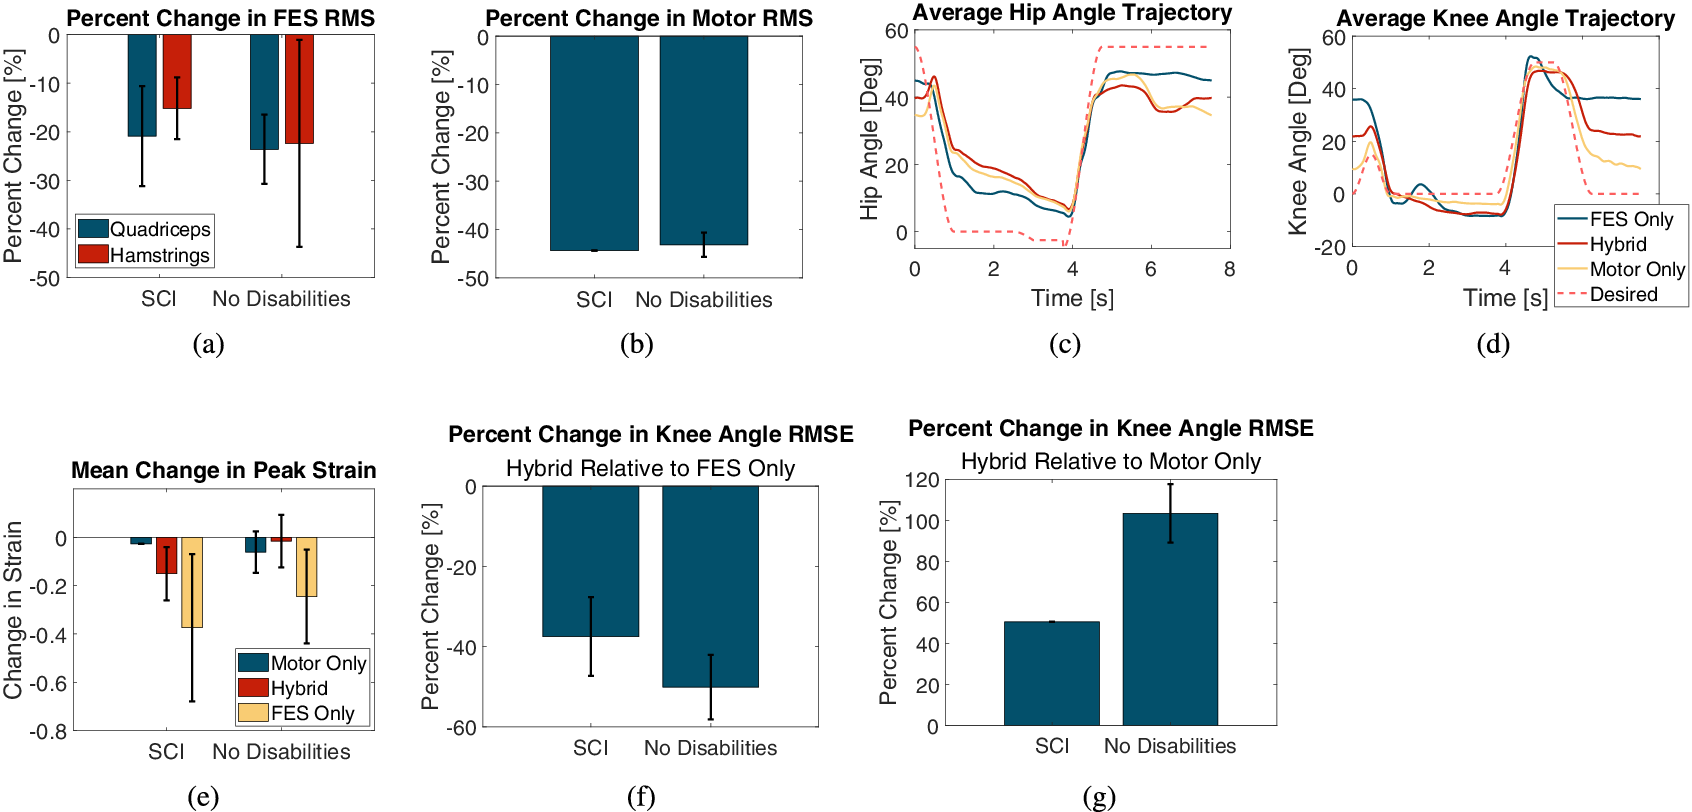
(a) Mean ± SD of percentage change in RMS FES amplitude with the hybrid controller relative to the FES-only controller. (b) Mean ± SD of percentage change in RMS motor torque with the hybrid controller relative to the exoskeleton-only controller. (c) Average hip angle trajectories and (d) average knee angle trajectories for participant A1 across all three control cases performed on Day 1. (e) Mean change in peak strain for all control cases across both participant groups. (f) Percent change in knee joint angle RMSE with the hybrid controller relative to the FES-only controller. (g) Percent change in knee joint angle RMSE with the hybrid controller relative to the exoskeleton-only controller.

Figure 7. Long description
A multi-panel figure containing seven graphs labeled a through g.
* Panel a: Bar graph showing Percent Change in F E S R M S for Quadriceps (blue) and Hamstrings (red). For S C I, both show a decrease of approximately 15 to 20 percent. For No Disabilities, Quadriceps decrease by 25 percent and Hamstrings by 22 percent.
* Panel b: Bar graph showing Percent Change in Motor R M S. Both S C I and No Disabilities groups show a significant decrease of approximately 45 percent.
* Panel c: Line graph of Average Hip Angle Trajectory in degrees over 8 seconds. Four lines (F E S Only, Hybrid, Motor Only, and Desired) show a dip from 40 degrees to near 0 at 4 seconds, then a rise back to 40 to 50 degrees.
* Panel d: Line graph of Average Knee Angle Trajectory in degrees over 8 seconds. The trajectories follow a similar temporal pattern to the hip, peaking near 50 degrees after 4 seconds.
* Panel e: Bar graph of Mean Change in Peak Strain. Three bars per group (Motor Only, Hybrid, F E S Only). F E S Only shows the largest negative change, reaching nearly negative 0.4 for S C I.
* Panel f: Bar graph of Percent Change in Knee Angle R M S E for Hybrid Relative to F E S Only. S C I shows a 38 percent decrease, while No Disabilities shows a 50 percent decrease.
* Panel g: Bar graph of Percent Change in Knee Angle R M S E for Hybrid Relative to Motor Only. S C I shows a 50 percent increase, while No Disabilities shows a 105 percent increase.
4.2. Control effort and exoskeleton kinematics
For the group with SCI, the hybrid controller reduced the RMS FES amplitude by
$ 23.60\pm 7.12 $
 % (quadriceps) and
$ 22.39\pm 21.28 $
 % (hamstrings) relative to the FES-only controller. For the group with no disabilities, the RMS FES amplitudes were reduced by
$ 20.90\pm 10.31 $
 % (quadriceps) and
$ 15.17\pm 6.35 $
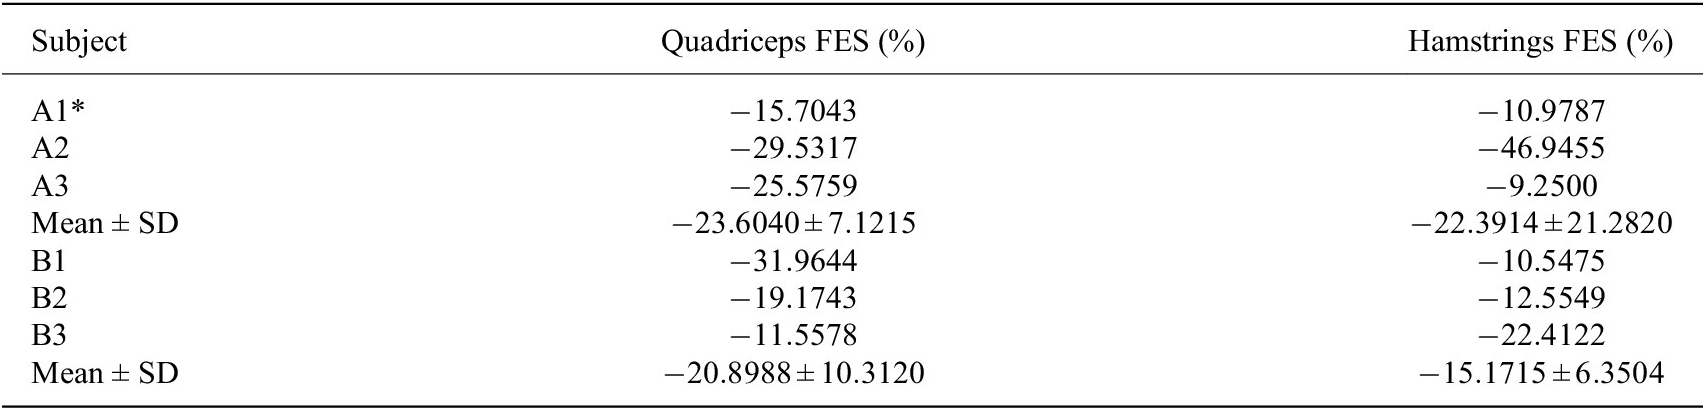
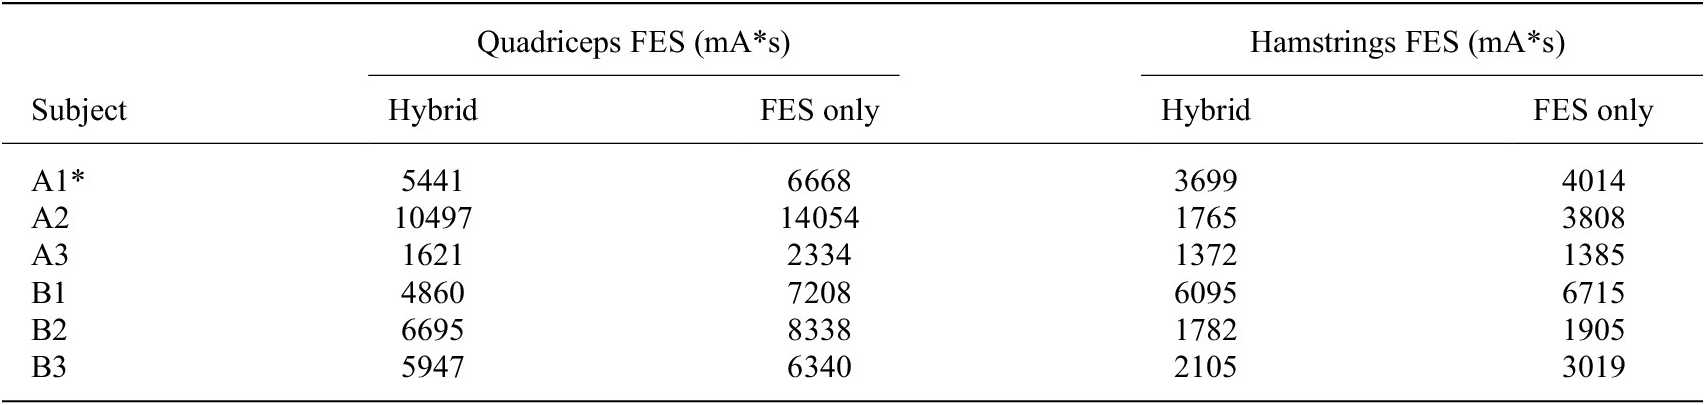
 % (hamstrings). The means and standard deviations are depicted in Figure 7(a). The large standard deviation in hamstrings FES RMS amplitude for the SCI group is likely due to participant A2’s walking performance. This subject was able to maintain single support phase for a long duration, which resulted in the leg oscillating from the FES-induced agonist–antagonist muscle activity. This is reflected in the large reduction in hamstrings FES dosage with the hybrid controller for this participant, as reported in the Tables A4 and A5.
For participants with no disabilities, the hybrid controller reduced RMS motor torque by an average of
$ 43.18\pm 2.52 $
 % (
$ p<0.005 $
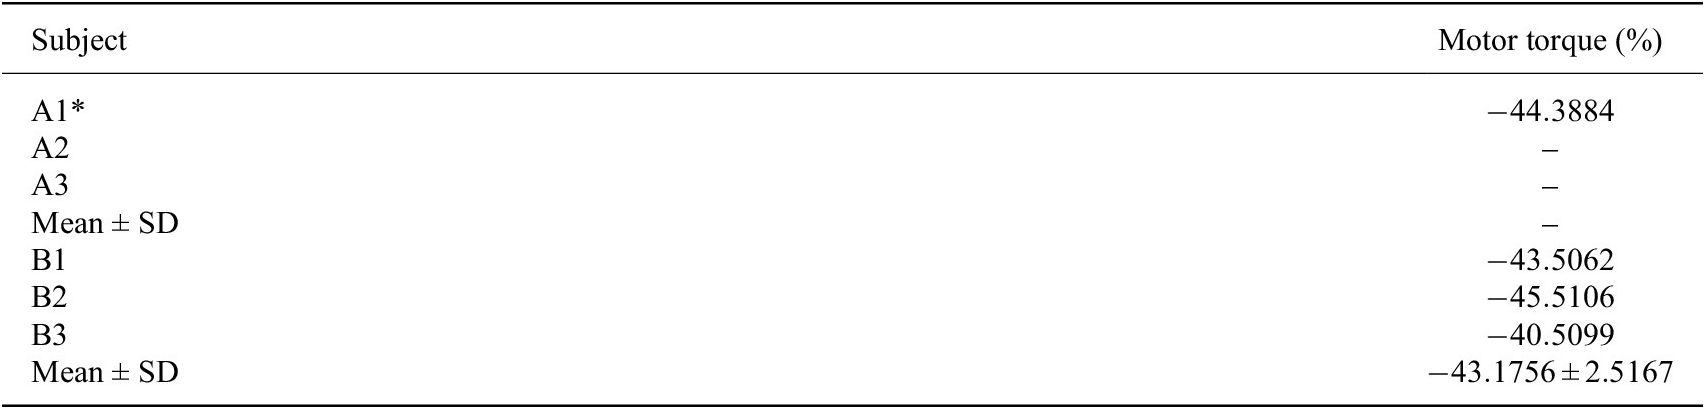
 ), as observed in Figure 7(b). For the participant with SCI who completed trials with the exoskeleton-only controller, RMS motor torque was
$ 19.81\pm 1.55 $
 Nm for the motor controller but only
$ 11.02\pm 0.50 $
 Nm for the hybrid controller. This represented a decrease of
$ 44.39 $
 % in motor control effort. Details regarding motor torque for each participant are reported in the Table A6.
A single-factor ANOVA test revealed significant differences for both the group with SCI (
$ p<0.02 $
 ) and the group with no disabilities (
$ p<{e}^{-5} $
 ). A Tukey–Kramer post hoc test revealed significant differences between exoskeleton only and hybrid, between hybrid and FES only, and between exoskeleton only and FES only for the group with no disabilities. We could not perform a post hoc test for the group with SCI as only one participant completed trials with the exoskeleton-only controller; however, a one-tailed t-test assuming unequal variances with
$ \alpha =0.05 $
 revealed a statistically significant difference between the hybrid and FES-only cases (
$ p<0.01 $
 ).
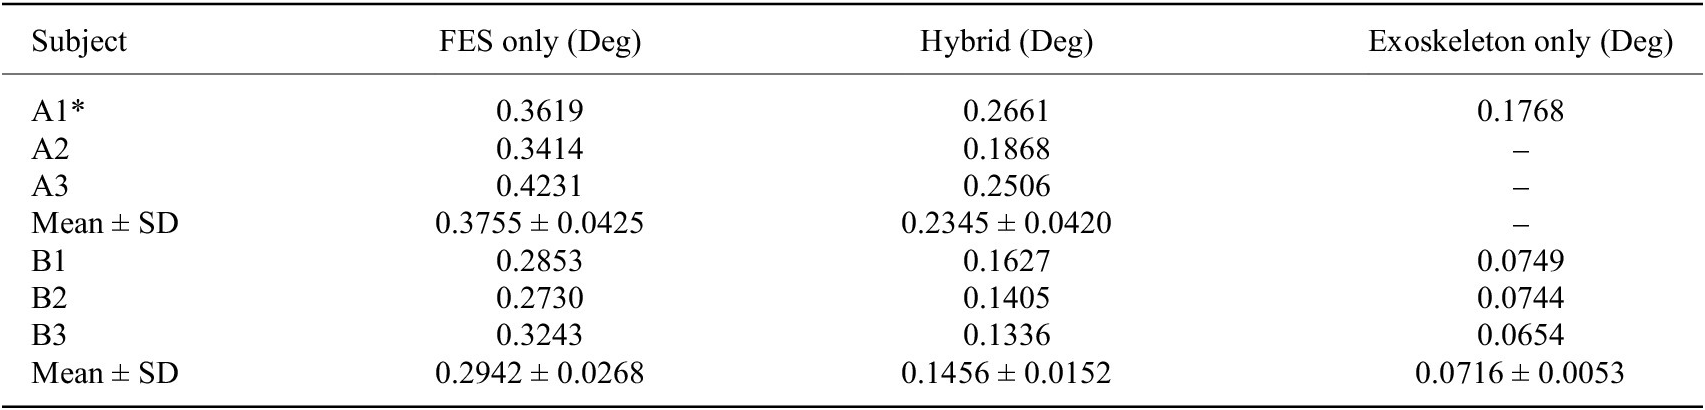
The hybrid controller improved knee angle kinematics relative to the FES-only controller. For the groups with SCI and with no disabilities, the hybrid controller reduced the RMSE of the knee joint angle by
$ 37.51\pm 9.82 $
 % and
$ 50.11\pm 8.03 $
 %, respectively. Averaged hip and knee angle trajectories for one of the participants with SCI are depicted in Figure 7(c)–(d), respectively, and the group results for knee angle RMSE are reported in Figure 7(f)–(g). The hybrid controller exhibited worse tracking performance compared to the exoskeleton-only controller, with an average RMSE increase of
$ 50.53 $
 % for the participant with SCI who completed exoskeleton-only trials (
$ p<0.005 $
 ) and
$ 103.39\pm 14.19 $
 % (
$ p<0.01 $
 ) for the group with no disabilities. Details for each participant regarding kinematic performance are provided in the Table A7.
The improvement in knee joint kinematics seen with hybrid control is particularly important for exoskeleton users with SCI. For the participant who completed multiple trials with all three controllers, trajectory tracking performance was consistent among trials within each case. Average RMSEs for this participant were
$ 20.73\pm 1.40{}^{\circ} $
 ,
$ 15.25\pm 0.63{}^{\circ} $
 , and
$ 10.13\pm 1.30{}^{\circ} $
 for the FES only, hybrid, and exoskeleton-only cases, respectively. The average knee joint angle trajectories for each case completed on Day 1 are depicted in Figure 7(d), illustrating how incorporating motor torque into the control design achieved greater knee extension during terminal swing and led to less overshoot during swing flexion. There is still some diminished knee extension during terminal swing with the hybrid controller relative to the exoskeleton-only controller, but the overshoot during the flexion subphase and subsequent over-correction are not present.
4.3. US-derived fatigue
Muscle fatigue is inversely related to MEI, which can be estimated by normalized US-derived muscle strain. Specifically, a fully rested muscle has an MEI of 1 and produces measurable strain, and a fully fatigued muscle that no longer produces force or measurable strain has an MEI of 0. A single-factor ANOVA test revealed no significant differences in strain in either participant group.
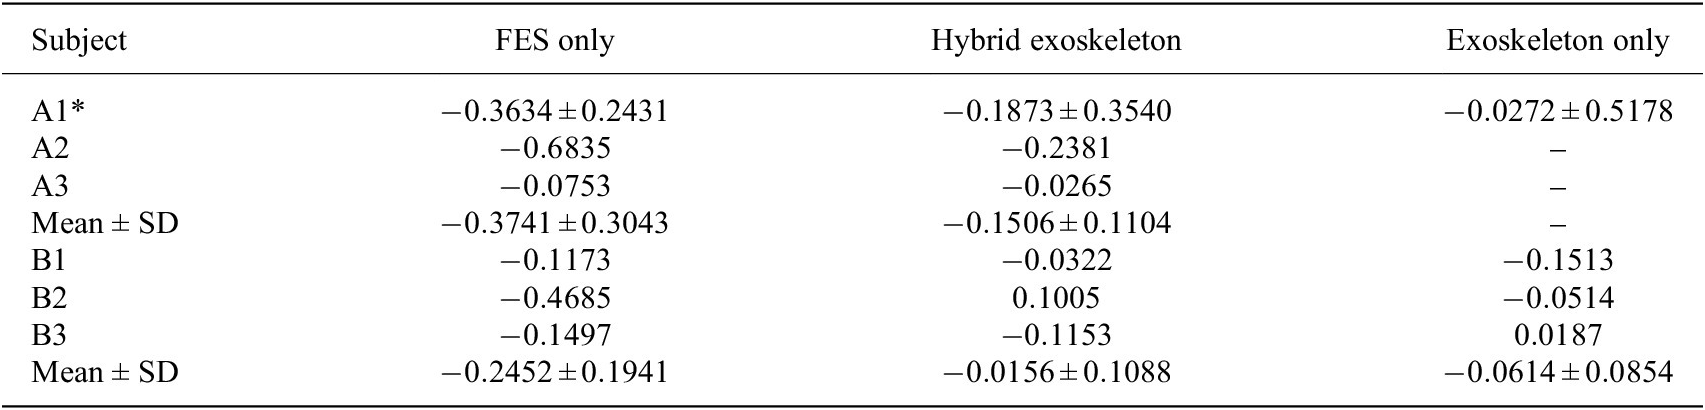
For the group with SCI, the change in normalized US-derived strain for the FES-only case, averaged across participants, was
$ -0.37\pm 0.30 $
 ; that is, there was a drop of
$ 0.37 $
 normalized units, on average. The mean change in strain for the hybrid case was only
$ -0.15\pm 0.11 $
 . For the group with no disabilities, the average change in strain for the FES-only case was
$ -0.25\pm 0.19 $
 , whereas the average change in strain for the hybrid case was
$ -0.02\pm 0.11 $
 . Although the drop in MEI was greater, on average, for the FES-only case in both groups, the differences between the hybrid and FES-only cases were not statistically significant.
The average change in strain for the exoskeleton-only case for the group with no disabilities was
$ -0.06\pm 0.09 $
 . The group results are depicted in Figure 7(e), and subject-specific changes in strain are reported in the Table A8. Although not all participants from the SCI group completed trials with the exoskeleton-only controller, participant A1 completed multiple such trials. For this participant, the change in strain, averaged across trials, was
$ -0.03\pm 0.52 $
 .
5. Discussion
The objectives of this study were to validate switched control of a hybrid exoskeleton for walking in participants with and without SCI and to measure fatigue and performance metrics under three different control conditions. The switched controller changed between hybrid and exoskeleton-only control according to estimated MEI, which was periodically updated with US-derived normalized strain metrics. The hybrid controller produced significantly less trajectory tracking error than the FES-only controller in both groups and utilized less motor effort than the motor-only controller in both groups, and the difference was statistically significant for the group with no disabilities. The hybrid controller therefore occupies a space in between exoskeleton-only and FES-only control. While it is not as precise as exoskeleton-only control, it uses less power from the motors. At the same time, it provides a lower FES dosage than FES-only control, and supplemental motor assistance yields superior tracking.
While several hybrid controllers have been proposed to dynamically allocate assistance between FES and exoskeleton motors (Del-Ama et al., 2014; Ha et al., 2016; Sheng et al., Reference Sheng, Sun, Molazadeh and Sharma2021a; Dunkelberger et al., 2023), direct comparisons of FES-induced fatigue progression during prolonged walking in people with SCI under hybrid versus FES-only control have not been reported. Our prior preliminary work (Lambeth et al., 2024) examined a single participant over short walking bouts, limited FES to the quadriceps, and employed different control laws for hybrid and FES-only conditions, complicating interpretation of fatigue-related outcomes. In contrast, the present study applies a consistent FES control law across hybrid and FES-only modes, incorporates stimulation of both knee extensors and flexors, and evaluates fatigue progression during extended walking.
Although the switched control framework was originally introduced in Sheng et al. (Reference Sheng, Sun, Molazadeh and Sharma2021a), it was not previously implemented for walking and was validated only in a single-participant, short-duration task. Here, we extend this framework to fatigue-informed exoskeleton-assisted walking with 6-min trials aligned with the Six-Minute Walk Test, providing the first experimental evaluation of such a controller during a clinically relevant walking duration.
While the hybrid controller reduced stimulation demand in terms of both RMS and integrated dose, it did not yield statistically significant reductions in the selected US-derived fatigue metric in this cohort. The absence of a statistically significant reduction in measured muscle fatigue highlights several important considerations. One possibility is that the fatigue metric employed–changes in muscle strain during isometric contractions–may not be sufficiently sensitive to capture fatigue accumulated during dynamic walking. The sliding filament model holds that microscopic contraction phenomena during force production are responsible for the visible deformation of the muscle (Huxley, Reference Huxley1965; Hill, Reference Hill1974, Reference Hill1976). Less force production, which results from greater fatigue, is therefore associated with less deformation. In summary, as is detailed in Sheng et al. (Reference Sheng, Sharma and Kim2020), because we can assume that skeletal muscle is incompressible (Manduca et al., Reference Manduca, Oliphant, Dresner, Mahowald, Kruse, Amromin, Felmlee, Greenleaf and Ehman2001), strain metrics in the axial and lateral directions are calculated from a localized section of the muscle, and these metrics are themselves obtained from the principal stretches along the muscle.
In prior work using seated knee-extension experiments, we demonstrated a strong correlation between fatigue-induced reductions in isometric force and US-derived axial strain (Sheng et al., Reference Sheng, Sharma and Kim2020, Reference Sheng, Sharma and Kim2021b), and this metric was successfully applied in cooperative hybrid knee exoskeleton control (Iyer et al., Reference Iyer, Sun, Lambeth, Singh, Cleveland and Sharma2024) in which participants performed ten overground steps. Even for such a short duration (Iyer et al., Reference Iyer, Sun, Lambeth, Singh, Cleveland and Sharma2024) noted the challenge of ensuring the US probe did not slip from the leg during walking. Translating this metric to prolonged overground walking introduces additional challenges that may reduce sensitivity.
In particular, although a skin-safe marker was used to maintain consistent initial probe placement, some relative motion between the US transducer and the limb is unavoidable during walking, especially due to axial rotation and soft-tissue deformation. Such motion can degrade the reliability of strain-based fatigue estimates. While the weighted fusion of US-derived MEI and model-based MEI helps mitigate the influence of these artifacts on the overall observer estimate, improved transducer design remains an important need. Recent advances in body-conformable and wearable US systems (e.g., Xue et al., Reference Xue, Zhang, Moon, Xu, Huang, Sharma and Jiang2023; King et al., Reference King, Patwardhan, Bashatah, Magee, Jones, Wei, Sikdar and Chitnis2024; Moon et al., Reference Moon, Xue, Ganesh, Shukla, Zhu, Sharma and Jiang2024) suggest that wearable US sensors may substantially improve measurement fidelity during dynamic tasks. The development of such sensors could enable higher-quality physiological feedback and reduce reliance on model-based fatigue prediction. Alternative fatigue metrics, such as dynamometer measurements before and after walking, could also be incorporated.
A second consideration is the influence of unmodeled physiological factors. For one, it is possible that passive muscle deformation occurred during imaging. Although the walking was quasi-static and the desired knee trajectory was held constant during imaging, some passive motion may have occurred. Additionally, results may be influenced by voluntary muscle activation in participants with incomplete SCI, which may contribute substantially to overall fatigue and is not explicitly accounted for in the control design. Furthermore, not all trials were conducted on separate days. Although rest periods were provided between trials and fatigue was evaluated on a per-trial basis during data analysis, if participants did not start the trial fully rested, this could have impacted the results. The disparate injury levels among participants with SCI could also have contributed to outcome variability.
Finally, the binary switching strategy itself may be suboptimal for fatigue mitigation, and more graded or cooperative control approaches (Iyer et al., Reference Iyer, Sun, Lambeth, Singh, Cleveland and Sharma2024) that continuously modulate FES and motor assistance may better distribute muscular load. While the present study cannot isolate these effects, articulating these hypotheses provides a framework for interpreting the results and motivates future work incorporating alternative fatigue metrics, estimation of voluntary effort, and adaptive control strategies.
This study should be interpreted as a preliminary feasibility investigation of physiologically informed switched control for hybrid FES-exoskeleton walking. The stability conditions derived for the proposed switched controller are based on Lyapunov–Krasovskii analysis for input-delayed
$ n $
 -degree-of-freedom systems and provide sufficient guarantees under conservative assumptions on delay bounds, switching signals, and model accuracy. While the theoretical analysis informs the controller architecture and switching logic, in the experimental hybrid FES-exoskeleton system, these assumptions are weakened by subject-specific dynamics, fatigue-induced nonstationarity, US-driven switching decisions, and time-varying electromechanical delays. As the primary objective of this investigation was to evaluate the controller’s fatigue-compensation capabilities rather than to establish formal robustness guarantees, controller gains were selected through empirical tuning to achieve safe and satisfactory performance. Developing stability certification methods that enable systematic and automated gain selection under physiological uncertainty remains an important direction for future work.
The small, heterogeneous group of subjects with SCI makes it difficult to draw clinical conclusions from these results which, while not statistically significant, still demonstrated the expected finding that a higher FES dosage leads to greater fatigue. As a result of the small SCI cohort, the statistical power of the analysis is limited, and the findings should be interpreted as hypothesis-generating rather than definitive. Intersubject variability in impairment level and neuromuscular response may influence controller performance and fatigue behavior. Future studies will require larger cohorts to enable robust statistical comparisons, assess generalizability, and establish clinically meaningful performance benchmarks.
The US-informed switching controller behaved as desired, alternating from Mode H to Mode E and back at least once for all participants. Notably, the time at which switching occurred was heavily influenced by subject-specific fatigue parameters determining each individual’s rate of muscle fatigue, rate of muscle recovery, and minimum possible MEI value. The MEI dynamics are indeed a useful model for predicting muscle fatigue progression, but they are only a mathematical estimate, while the US-derived measurements provide real-time MEI updates. The fact that the MEI dynamics heavily influence switching behavior, however, highlights the importance of accurately identifying subject muscle parameters, the general procedures for which are described in Riener et al. (Reference Riener, Quintern and Schmidt1996). Importantly, this reliance on model-based MEI dynamics is not fundamental to the control framework itself but is a consequence of the limited physiological sampling rate achievable with the current US implementation. If US measurements could be obtained at higher temporal resolution, the switching logic could rely more directly on physiological feedback, potentially reducing – or eliminating – the need for a predictive fatigue model altogether. Recent advances in wearable and ultrafast US systems suggest that such sampling rates may become feasible, enabling a transition toward more directly muscle-driven switching control in future implementations.
Although walking involves strongly coupled hip–knee dynamics, the physiologically informed switching controller was applied only at the knee joint in this study. This experimental simplification was necessitated by the lack of reliable noninvasive FES actuation of the hip musculature during overground walking. While the underlying control framework generalizes to multijoint systems, the present implementation does not fully capture interjoint coupling effects, and controller performance may not directly scale to full-leg control. Consequently, the results should be interpreted as a proof-of-concept evaluation of fatigue-aware switching control at a single joint. Future work will focus on extending this approach to coordinated multijoint control as actuation and sensing capabilities improve.
6. Conclusion
This study presents a preliminary feasibility investigation of physiologically informed switching control for hybrid FES-exoskeleton walking. The switched controller alternated between hybrid exoskeleton-FES and exoskeleton-only modes. We compared US-derived quadriceps fatigue progression, kinematic performance, FES dosage, and exoskeleton motor effort across FES-only, exoskeleton-only, and hybrid control modes in participants with and without SCI. The hybrid controller significantly improved knee angle tracking relative to FES-only control and significantly reduced motor effort relative to exoskeleton-only control, while differences in FES dosage and measured muscle fatigue did not reach statistical significance.
For the first time, a fatigue-informed switching strategy was implemented during exoskeleton-assisted walking, using subject-specific fatigue and recovery parameters together with US-derived muscle strain metrics to periodically update a model-based MEI. Although the controller relied primarily on model-based MEI dynamics, the sampled US measurements provided physiological corrections that enabled consistent switching between hybrid and exoskeleton-only modes during prolonged walking. These results demonstrate the technical feasibility of integrating physiological sensing into switched exoskeleton control.
Importantly, the variability in US-derived fatigue metrics suggests that unmodeled physiological factors–such as voluntary muscle activation, intersubject heterogeneity, and limitations of the selected fatigue metric–may play a dominant role during walking. Moreover, the binary switching strategy explored here represents only one strategy in a broader design space, motivating future investigation of graded or cooperative control strategies that continuously modulate FES and motor assistance.
Overall, rather than outperforming FES-only or exoskeleton-only control along a single metric, the proposed hybrid controller occupies an intermediate point in a multidimensional performance space, trading some tracking accuracy for increased physiological engagement and reduced stimulation burden while retaining the safety and consistency of robotic assistance. Importantly, physiological fatigue outcomes did not differ significantly between controllers in the present cohort, underscoring the complexity of fatigue modulation during walking. These results position the hybrid controller as a tunable compromise, with its suitability depending on the specific clinical or rehabilitative objectives rather than on a single notion of control design superiority. The primary contribution of this work lies not only in demonstrating a fatigue-aware switching controller but also in identifying key challenges in sensing, modeling, and control that must be addressed to enable effective closed-loop physiological fatigue management in hybrid rehabilitation robotics.
Supplementary material
A video of exoskeleton walking under hybrid and FES only control, as well as data pertaining to this study, can be viewed here.
Data availability statement
For data from this study, please refer to the Supplementary Material.
Acknowledgments
The authors wish to thank Martha Soyars, PT, for her assistance in the completion of the experiments. We also wish to thank our participants for their involvement in the study.
Authorship contribution
K.L. and N.S. conceptualized this study. K.L. and A.I. developed the experimental methodology. K.L. collected and analyzed the data. K.L. and N.S. interpreted the results and wrote the first draft. C.C. recruited subjects for this study. C.C. and M.L. reviewed this manuscript and provided feedback for revisions.
Funding statement
This work was supported by National Science Foundation SCH Award #2124017.
Competing interests
N.S. is founder of MyoMech, Inc., a company developing ultrasound-based rehabilitation systems.
Ethical standards
The authors assert that all procedures contributing to this work comply with the ethical standards of the relevant national and institutional committees on human experimentation and with the Helsinki Declaration of 1975, as revised in 2008. This study was approved by the Institutional Review Board of North Carolina State University (IRB Approval #20553).
Appendix
In the tables reporting trial results, an asterisk is placed beside participant A1 because this participant performed multiple trials of each control case. RMS and strain values reported for participant A1 are therefore averaged across trials of that respective case. Additionally, standard deviations are provided for the strain values for this participant.
Participant quadriceps muscle parameters

Table A1. Long description
The table consists of nine columns and seven rows including the header.
Column headers from left to right are:
1. Participant
2. I sub t sub Q (m A)
3. I sub s sub Q (m A)
4. I sub t sub H (m A)
5. I sub s sub H (m A)
6. w super e sub f (s super -1)
7. w super e sub r (s super -1)
8. sigma super e
9. tau super e (s)
Data rows for participants:
* A1: 20, 70, 20, 50, 0.11, 0.01, 0.07, 0.11
* A2: 20, 70, 20, 70, 0.13, 0.01, 0.12, 0.08
* A3: 20, 42, 20, 42, 0.05, 0.01, 0.18, 0.07
* B1: 23, 55, 23, 45, 0.01, 0.01, 0.00, 0.02
* B2: 20, 35, 20, 30, 0.08, 0.01, 0.26, 0.04
* B3: 20, 40, 20, 35, 0.06, 0.01, 0.10, 0.03
A note below the table states that hamstring parameters w super f sub f, w super f sub r, sigma super f, and tau super f were assumed to be equivalent to quadriceps muscle parameters.
Note: In the interest of time, hamstrings parameters
$ {w}_f^f $
 ,
$ {w}_r^f $
 ,
$ {\varsigma}^f $
 , and
$ {\tau}^f $
 were assumed to be equivalent to quadriceps muscle parameters.
Graphical depiction of the variation in switching times, defined as the instant the switching criterion
$ \mu =\underline{\mu} $
 or
$ \mu =\overline{\mu} $
 is met, with variations in parameters. For each simulation,
$ {w}_f=0.13/s $
 ,
$ {w}_r=0.015/s $
 ,
$ \varsigma =0.065 $
 , and
$ \tau =0.05s $
 , except where a given parameter was varied.

Figure A1. Long description
Four line graphs arranged in a two-by-two grid. All graphs share a Y-axis labeled mu ranging from 0 to 1 and an X-axis labeled Time in seconds s.
Top-left panel: w sub f Perturbation. Multiple lines descend from mu equals 1 toward a horizontal dashed red line representing mu-bar-lower at 0.6. Higher values of w sub f result in a faster, steeper descent. The legend lists w sub f values from 0.0570 forward slash s to 0.1570 forward slash s.
Top-right panel: w sub r Perturbation. Multiple lines ascend linearly from mu equals 0.6 toward a horizontal dashed red line representing mu-bar-upper at 0.7. Lower values of w sub r result in a slower rate of increase. The legend lists w sub r values from 0.0097 forward slash s to 0.0197 forward slash s.
Bottom-left panel: varsigma Perturbation. Multiple lines follow a similar stepped descending path from mu equals 1 toward the mu-bar-lower threshold at 0.6. The lines are tightly clustered, showing low sensitivity to varsigma. The legend lists varsigma values from 0.0154 to 0.0704.
Bottom-right panel: tau Perturbation. All lines are nearly perfectly overlapped, showing a stepped descent from mu equals 1 to 0.6. This indicates the switching time is highly insensitive to the tau parameter within the tested range. The legend lists tau values from 0.033 s to 0.143 s.
To run the simulations in Figure A1, the FES input trajectories were averaged across all gait cycles for the hybrid trial for participant B3 and multiplied by 1.3 to obtain a peak FES amplitude that was near 1.
Trial orders

Table A2. Long description
The table consists of five columns: Subject, Day 1, Day 2, Day 3, and Day 4.
* Subject A 1: Day 1 is E, H, F. Day 2 is E, H. Day 3 is F, E. Day 4 is F, E.
* Subject A 2: Day 1 is H, F. Days 2, 3, and 4 are empty.
* Subject A 3: Day 1 is H, F. Days 2, 3, and 4 are empty.
* Subject B 1: Day 1 is E, F. Day 2 is H. Days 3 and 4 are empty.
* Subject B 2: Day 1 is E, H, F. Days 2, 3, and 4 are empty.
* Subject B 3: Day 1 is F. Day 2 is H, E. Days 3 and 4 are empty.
A legend at the bottom defines the abbreviations: E equals exoskeleton only, H equals hybrid, and F equals F E S only.
Participant walking duration

Table A3. Long description
The table consists of two columns: Participant and Walking duration.
* Row 1: Participant A 1, Walking duration 4 min 10 s. A note specifies that the exoskeleton-only Trial on Day 1 was 6 min.
* Row 2: Participant A 2, Walking duration 6 min.
* Row 3: Participant A 3, Walking duration 1 min 48 s.
* Row 4: Participant B 1, Walking duration 6 min.
* Row 5: Participant B 2, Walking duration 6 min.
* Row 6: Participant B 3, Walking duration 6 min.
Change in FES RMS with hybrid control

Table A4. Long description
The table consists of three columns: Subject, Quadriceps F E S (%), and Hamstrings F E S (%).
* Subject A 1*: Quadriceps -15.7043, Hamstrings -10.9787.
* Subject A 2: Quadriceps -29.5317, Hamstrings -46.9455.
* Subject A 3: Quadriceps -25.5759, Hamstrings -9.2500.
* Mean plus or minus S D (Group A): Quadriceps -23.6040 plus or minus 7.1215, Hamstrings -22.3914 plus or minus 21.2820.
* Subject B 1: Quadriceps -31.9644, Hamstrings -10.5475.
* Subject B 2: Quadriceps -19.1743, Hamstrings -12.5549.
* Subject B 3: Quadriceps -11.5578, Hamstrings -22.4122.
* Mean plus or minus S D (Group B): Quadriceps -20.8988 plus or minus 10.3120, Hamstrings -15.1715 plus or minus 6.3504.
Integral of FES with FES and hybrid control

Table A5. Long description
The table consists of five columns. The first column identifies the Subject (A 1 asterisk, A 2, A 3, B 1, B 2, B 3). The next two columns fall under the header Quadriceps F E S (m A asterisk s), subdivided into Hybrid and F E S only. The final two columns fall under the header Hamstrings F E S (m A asterisk s), also subdivided into Hybrid and F E S only.
Data rows are as follows:
* Subject A 1 asterisk: Quadriceps (Hybrid 5441, F E S only 6668), Hamstrings (Hybrid 3699, F E S only 4014).
* Subject A 2: Quadriceps (Hybrid 10497, F E S only 14054), Hamstrings (Hybrid 1765, F E S only 3808).
* Subject A 3: Quadriceps (Hybrid 1621, F E S only 2334), Hamstrings (Hybrid 1372, F E S only 1385).
* Subject B 1: Quadriceps (Hybrid 4860, F E S only 7208), Hamstrings (Hybrid 6095, F E S only 6715).
* Subject B 2: Quadriceps (Hybrid 6695, F E S only 8338), Hamstrings (Hybrid 1782, F E S only 1905).
* Subject B 3: Quadriceps (Hybrid 5947, F E S only 6340), Hamstrings (Hybrid 2105, F E S only 3019).
A footer note states that Mean and S D are not reported because not all trials were 6 minutes in duration.
Note: Mean and SD are not reported because not all trials were 6 min in duration.
Change in motor torque RMS with hybrid control

Table A6. Long description
The table consists of two columns: Subject and Motor torque (%).
* Subject A 1 asterisk: -44.3884
* Subject A 2: dash
* Subject A 3: dash
* Mean plus or minus S D for group A: dash
* Subject B 1: -43.5062
* Subject B 2: -45.5106
* Subject B 3: -40.5099
* Mean plus or minus S D for group B: -43.1756 plus or minus 2.5167
Knee angle RMSEs

Table A7. Long description
The table consists of four columns: Subject, F E S only (Deg), Hybrid (Deg), and Exoskeleton only (Deg).
* Subject A 1 asterisk: F E S only 0.3619, Hybrid 0.2661, Exoskeleton only 0.1768.
* Subject A 2: F E S only 0.3414, Hybrid 0.1868, Exoskeleton only is blank.
* Subject A 3: F E S only 0.4231, Hybrid 0.2506, Exoskeleton only is blank.
* Mean plus or minus S D for Group A: F E S only 0.3755 plus or minus 0.0425, Hybrid 0.2345 plus or minus 0.0420, Exoskeleton only is blank.
* Subject B 1: F E S only 0.2853, Hybrid 0.1627, Exoskeleton only 0.0749.
* Subject B 2: F E S only 0.2730, Hybrid 0.1405, Exoskeleton only 0.0744.
* Subject B 3: F E S only 0.3243, Hybrid 0.1336, Exoskeleton only 0.0654.
* Mean plus or minus S D for Group B: F E S only 0.2942 plus or minus 0.0268, Hybrid 0.1456 plus or minus 0.0152, Exoskeleton only 0.0716 plus or minus 0.0053.
Change in strain values before and after walking

Table A8. Long description
The table consists of four columns: Subject, F E S only, Hybrid exoskeleton, and Exoskeleton only.
* Subject A 1: F E S only -0.3634 plus or minus 0.2431; Hybrid -0.1873 plus or minus 0.3540; Exoskeleton -0.0272 plus or minus 0.5178.
* Subject A 2: F E S only -0.6835; Hybrid -0.2381; Exoskeleton is blank.
* Subject A 3: F E S only -0.0753; Hybrid -0.0265; Exoskeleton is blank.
* Mean plus or minus S D for Group A: F E S only -0.3741 plus or minus 0.3043; Hybrid -0.1506 plus or minus 0.1104; Exoskeleton is blank.
* Subject B 1: F E S only -0.1173; Hybrid -0.0322; Exoskeleton -0.1513.
* Subject B 2: F E S only -0.4685; Hybrid 0.1005; Exoskeleton -0.0514.
* Subject B 3: F E S only -0.1497; Hybrid -0.1153; Exoskeleton 0.0187.
* Mean plus or minus S D for Group B: F E S only -0.2452 plus or minus 0.1941; Hybrid -0.0156 plus or minus 0.1088; Exoskeleton -0.0614 plus or minus 0.0854.













 Open access

