


Introduction
The ability of physically based climate models to provide detailed estimates of future climate changes has improved significantly in recent years. However, there remain some aspects of the climate which cannot be accurately simulated, due to a lack of understanding and of observational data, one of the most influential being the interaction of clouds with radiation and aerosols (IPCC, 2001). Indeed, despite considerable research into understanding the role of clouds in climate change there is still uncertainty surrounding the nature of changes in both cloud fraction and type, and even the sign of overall climate change induced by altered cloud cover. Some climate theories predict that a warmer atmosphere is capable of holding more water vapour, resulting in increased cover of low, thick clouds, which counteract warming by reflecting a greater proportion of incoming radiation back to space. However, recent research by Reference Del Genio and WolfDel Genio and Wolf (2000) suggests that warmer air temperatures cause cloud bases to form at higher elevations, generating thinner clouds which are less efficient at reflecting solar radiation, thereby limiting the cooling effect of clouds. Additional uncertainty is introduced at high latitudes, where climate-model simulations predict warming above the global average of 1.4–5.8°C, possibly by >40%, with local warming over Greenland likely to be 1–3 times the global mean (IPCC, 2001). This is largely attributed to the ice–albedo feedback mechanism, which relates the decrease in surface albedo associated with the retreat of snow and ice cover to an increase in the amount of incoming radiation absorbed by the Earth–atmosphere system. The uncertainty in the degree of attenuation of radiation by changing cloud cover, however, means that the contribution of the ice–albedo feedback to climate change remains unknown. Furthermore, it is important to realize that cloud cover over Arctic regions plays an important role not only in determining local climatological conditions but also in global atmospheric processes such as meridional heat transfer.
Cloud parameterization schemes within climate models vary widely but are often empirically based, with cloud cover incorporated through simplification of physical interactions derived from variables such as relative humidity. Consequently, model global cloud fractions can differ by a factor of nearly 2 (e.g. Reference CessCess and others, 1990), highlighting the need for an accurate global cloud climatology. Numerical models of ice-sheet surface energy and mass balance also rely on parameterizations of cloud cover, frequently derived from temporally and spatially limited surface observations that are often concentrated in coastal regions due to the inaccessibility of ice-sheet interiors. In such areas, satellite remote-sensing techniques provide the most consistent method of obtaining regular data with a comparatively high spatial and temporal resolution. However, distinguishing cloud from snow and ice in satellite imagery is difficult due to the lack of radiance contrast, the small differences in brightness temperature and exaggerated bidirectional effects at large zenith angles (Reference Lubin and MorrowLubin and Morrow, 1998). Many automated techniques of cloud identification in visible and thermal imagery rely on thresholding and classification algorithms whereby a number of images are visually analyzed and the characteristics of different cloud and surface types are applied to other images (e.g. Reference EbertEbert, 1987; Reference Welch, Sengupta, Goroch, Rabindra, Rangaraj and NavarWelch and others, 1992). Considerable success has been achieved for polar cloud recognition, but the dependence on the selection of representative images that form the training dataset from which an automated classifier is developed introduces an element of subjectivity. The Earth Radiation Budget Experiment (ERBE) and the International Satellite Cloud Climatology Project (ISCCP) have contributed much to our understanding of cloud radiative properties, but over snow- and ice-covered regions they are acknowledged to be less reliable (Reference Schweiger and KeySchweiger and Key, 1992). The ERBE and ISCCP cloud properties are presented on a relatively coarse spatial scale, which is adequate for most climate-modelling purposes. However, as Reference Yao and GenioYao and Del Genio (1999) demonstrated, a 50% reduction in the spatial resolution can cause modelled temperatures to be reduced by >1K, which in the sensitive environment of ice sheets can have a significant influence on model outcomes. For studies of glacier energy balance, therefore, it is desirable to have climate data on a much finer resolution (e.g. a 1km scale). Presented here is a transect over southern Greenland at 65.7°N (Fig. 1) of a 1year cloud record developed from imagery acquired from the AlongTrack Scanning Radiometer-2 (ATSR-2) during 1997. This record was compared with satellite data, climate re-analysis data and ground observations, and the net radiation flux across the transect calculated for each cloud climatology. The sensitivity of the model to cloud cover was also investigated.
Contour plot of the Greenland ice sheet from European Remote-sensing Satellite-1 radar altimeter data showing the transect at 65.7° N.

Cloud Climatology Development
Cloud cover from global data sources
Empirical cloud cover
Cloud-cover distribution has been parameterized as a function of latitude and distance to the margin of the ice sheet by Reference Van de Wal and OerlemansVan de Wal and Oerlemans (1994):

where n is cloud cover (0–1), ϕ is latitude (°) and d is distance to ice margin (km). This relationship is based on 10 and 20 year mean values of cloud cover from coastal meteorological stations that indicate a decrease of 40% from south to north Greenland (Reference Putnins and OrvigPutnins, 1970). Although few long-term measurements are available for the centre of the ice sheet, a decrease of 33% toward the interior was assumed (Reference Van de Wal and OerlemansVan de Wal and Oerlemans, 1994).
IPCC cloud cover
To capture the detailed spatial and temporal variations in cloud cover, it is advantageous to use a distribution that is based on more measurements, and over longer time-scales. One source of such data is the Intergovernmental Panel on Climate Change (IPCC) database that contains several climatological parameters of the entire world, including a monthly mean cloud-cover distribution for all continents except Antarctica. These data (on a 0.5˚ grid) are based on global meteorological station observations during the period 1961–90 (Reference New, Hulme and JonesNew and others, 1999).
ISCCP cloud cover
Satellite remote sensing also provides a method of monitoring cloud cover on a regular basis, and a number of datasets have been compiled using a variety of techniques. ISCCP was established in 1982 as part of the World Climate Research Programme to collect and analyze satellite radiance measurements in order to infer the global distribution of clouds, their properties and temporal variability. Data collection began on 1 July 1983 from a suite of national meteorological satellites, with the presence or absence of clouds determined from a number of threshold tests. The ISCCP results are presented at a number of spatial and temporal scales such as the level D2 climatological summary product that comprises monthly values from 1984 to 1993 on a 280 km equal-area grid (Reference Rossow, Walker, Beuschel and RoiterRossow and others, 1996).
NCEP re-analysis cloud cover
The NCEP/NCAR Re-analysis Project is a joint project between the U.S. National Centers for Environmental Prediction (NCEP) and the U. S. National Center for Atmospheric Research (NCAR) using state-of-the-art analysis/forecast systems to produce atmospheric analyses from 1948. A combination of historical rawinsonde data, surface marine and land synoptic data, aircraft and satellite data is assimilated into the model. The output consists of a large number of climatological parameters, with cloud cover presented as 6 hourly averages ona global Gaussian grid of 192694 points.
Cloud cover from ATSR-2
In contrast to the coarse global-scale grids described above, a regionally based dataset can be maintained at a higher resolution. The ATSR-2 measures radiances at visible, near-infrared and thermal wavelengths with a nadir ground resolution of 1 km. The conical scanning mechanism views each point at two angles, initially at 55˚ in the forward direction, and then approximately 150 s later an observation is made close to nadir (see Reference MutlowMutlow, 1998, for further information). When two or more views of the same cloud are available from slightly different positions, the amount of displacement perceived in the cloud’s position, i.e. the parallax, can be used to estimate its height. This technique has been used with pairs of geostationary meteorological satellites (e.g. Reference Wylie, Santek and StarrWylie and others, 1998) and also with ATSR nadir and forward 10.8 μm image pairs (e.g. Reference Prata and TurnerPrata and Turner, 1997). When the stereo-derived heights are subtracted from a radar altimeter-derived digital elevation model (DEM) of the Greenland ice sheet, cloud-free pixels can be identified, allowing a cloud mask to be created independently of brightness temperature or radiance thresholds (see Reference Cawkwell, Bamber and MullerCawkwell and others, 2001, for further details). Visual comparison of the resulting cloud mask with individual raw images confirmed that nearly 100 %of pixels identified by stereo-matching are recognized as cloud, and over 90% of the cloud-free pixels perceived by stereo-matching to be cloud-free are in agreement with those detected by manual analysis. Stereo-matching tends to distinguish more cloud than visual analysis. There are a number of reasons for this, including human error in identifying cloud on visible images, but also the use of thermal channels for the matching (to allow consistency throughout the year). Many of the additional cloud pixels found by stereo-matching are located along the edges of clouds and are a result of the size of the matching window used. Most of these anomalies can be removed by thresholding the 1.6 μm data, which have been normalized to limit the impact of illumination conditions. 1.6 μm is a spectral region for which reflectance from snow is markedly lower than for all cloud types, and when the threshold is set at a very low level, only spurious pixels which are unmistakably snow are removed. The resulting cloud fractions show a slight positive bias, but this is typically<5%.
In addition to identifying areas of cloud cover, stereomatching provides the cloud top heights. One method of validating these heights is through radiosonde soundings of temperature and relative humidity (Reference Chernykh and EskridgeChernykh and Eskridge, 1996) to identify regions of atmospheric change. In general, good agreement is seen between these two methods: 73% of cloud layers were found to lie within 500m of each other, rising to 89 % when the lowest cloud layer (which is least likely to be viewed by the satellite) is removed from the radiosonde dataset (Reference Cawkwell, Bamber and MullerCawkwell and others, 2001). When the cloud top heights are more generally classified as low (surface to 2000 m), middle (2000–6000m) and high (>6000m), almost 100% agreement is found.
Cloud cover over Greenland
Annual mean cloud cover along the 65.7° N transect determined from each of the sources of data described above shows considerable variation, particularly in the centre of the ice sheet (Fig. 2). The empirical relationship of Reference Van de Wal and OerlemansVan de Wal and Oerlemans (1994) shows a linear decrease from 0.69 at the land margin to 0.58 in the ice-sheet centre. The observational record of the IPCC is unique in showing a constant increase in cloud cover with movement inland, from 0.64 at the coast to peak at 0.69. The ISCCP mean cloud cover reveals a sharp decrease from about 0.74 at the margins to fairly constant values of 0.58–0.61 in the centre, resembling the empirical relationship in both overall trend and magnitude. The annual mean NCEP cloud cover differs significantly in that it is lower at both coastal margins than the other cloud datasets (0.64 on the west and 0.58 on the east) and has a central minimum of only 0.15. Mean cloud cover along the transect determined from 244 ATSR-2 image pairs acquired throughout 1997 shows considerable variation on a kilometre scale, which is plotted using a 10-point moving average. This average captures the detail without the oscillations of the raw data, showing values at the coastal margins that are comparable with the observations that feed both the Van der Wal and Oerlemans (1994) and the IPCC datasets. Like the latter, the ATSR-2 cloud cover also shows an initial increase with movement inland, peaking at 0.83 on the western flank of the ice sheet and 0.79 on the east in the zone around the equilibrium line, but values then drop sharply to a plateau of 0.48–0.52 at 313.5–317.5˚ E across the centre of the ice sheet.
The NCEP re-analysis data, which span the greatest time period, show relatively little interannual variation at this latitude. The annual mean for the periods of the IPCC and the ISCCP datasets differ by no more than 0.025 from the 1948–2000 NCEP mean. The 1997 mean also shows a variation of no more than 0.035 from any of the longer-term means, with the greatest difference occurring at the east coast. This may be due to the effect of the North Atlantic Oscillation which, in its positive phase in winter (as it was in early 1997), coincides with a strong Icelandic Low and reduced precipitation and cloud cover over southeastern Greenland (Reference Bromwich, Chen, Li and CullatherBromwich and others, 1999). It may be that the similarity between the long-term mean and single-year NCEP datasets is a function of the parameterization of the cloud cover. However, analysis of several years of data from automatic weather stations located across the Greenland ice sheet shows that while the daily variation in net longwave radiation fluxes is considerable, the seasonal and annual trends are comparable (Reference Serreze, Key, Box, Maslanik and SteffenSerreze and others,1998). While there may be some evidence from trends of albedo and passive-microwave melt that 1997 was a high-melt year for Greenland, for the purposes of this research it will be assumed that 1997 is a normal year, representative of annual cloud cover. Data from this year are used to illustrate the impact of cloud cover on the radiation balance. A more extensive analysis of multi-year data is underway.
Mean annual cloud-cover fraction for the transect at 65.7° N derived from the empirical relationship of Reference Van de Wal and OerlemansVan de Wal and Oerlemans (1994), 1961–90 IPCC meteorological observations, 1984–93 ISCCPsatellite data and 1948–2000NCEP re-analysis data. The 1997 cloud cover determined from 244 ATSR-2 stereo-matched pairs reveals the spatial variability, which when smoothed with a 10-point moving average shows a trend of initial increase in cloud fraction which falls sharply to a plateau over the centre of the ice sheet.

Intra-annual variation in cloudcover appears much more variable, with a standard deviation of 0.068–0.11 for the 12 months of the NCEP 1997 re-analysis across the transect. Both the IPCC and the NCEP datasets show that there is greatest cloud cover in the summer (July–September), particularly in the centre of the ice sheet (Fig. 3a). Approximately 5% more cloud cover is recorded for the summer than the spring (April–June), except on the east coast, where the NCEP re-analysis suggests a greater difference and the IPCC dataset shows an increased cloud cover in spring. The ATSR-2 data show a much more complex seasonal trend, with highest values (>0.9 in places) on the western margin during the summer months, and lowest values of 0.45–0.55 on the eastern side. Conversely, the highest values in the east (0.8) are seen during the spring, when cover in the west is at its lowest (0.65). During the autumn (October–December) and winter (January–March) the IPCC observations show almost no spatial or temporal variation, unlike the ATSR-2 and NCEP values which again show a minimum of cloud cover over the ice-sheet interior and generally higher values in the autumn (Fig. 3b). It is reassuring to note that at the edge of the ice sheet where the observations used in the IPCC dataset are concentrated (particularly on the west coast), the differences from the re-analysis values (which use meteorological data as a model input) are smallest. The discrepancy between the different datasets towards the centre of the ice sheet emphasizes the difficulty of interpolating cloud cover from a sparse network of ice-marginal data points. This is acknowledged by Reference New, Hulme and JonesNew and others (1999) for the IPCC data where interpolation to the interior is a spline function of latitude, longitude and elevation, with the increase in cloud cover inland potentially a direct consequence of the algorithmused. Reference Serreze, Key, Box, Maslanik and SteffenSerreze and others (1998) found that the NCEP re-analysis incoming shortwave radiation flux was consistently overestimated, which they attributed to an underestimation of cloud fraction or optical thickness. Topographic constraints may also influence the NCEP data, resulting in systematic biases, with an inaccurate orography having significant effects on weather systems and cloud development (Reference Hanna and ValdesHanna and Valdes, 2001).
(a) Spring and summer cloud cover for a transect at 65.7° N determined from 1961–90 IPCC data, 1948–2000 NCEP re-analysis and 1997 ATSR-2 stereo-matching. Higher spring values are seen on the eastern margin, and higher summer values on the western margins, with the NCEP cloud fractions noticeably lower than those achieved by other means. (b)Autumn and winter cloud cover for a transect at 65.7° N determined from 1961–90 IPCC data, 1948–2000 NCEP re-analysis and 1997 ATSR-2 stereo-matching. Little seasonal trend is seen, but there is slightly increased cloud cover on the eastern margin which may be due to the effect of the North Atlantic Oscillation.

Except for the empirical relationship at a constant value of 0.64, all the cloud climatologies show an increase in mean cloud cover for the transect as a whole during late summer (Fig. 4), peaking between July and October. The monthly range is very similar for all datasets (0.14–0.18), but the actual values are very different, with the NCEP cloud cover some 50% lower than in the ATSR-2 data, with exceptionally low values reported for the centre of the ice sheet. This trend of extensive summer cloud cover but tenuous winter coverage has also been reported by a number of climatologies derived from in situ surface observations (e.g. Reference Curry, Rossow, Randall and SchrammCurry and others, 1996; Reference Lubin and MorrowLubin and Morrow, 1998). These and other records expose the problem of using an empirical relationship that does not include a temporal dimension. This is particularly important during the summer months, when ablation takes place.
Mean monthly cloud cover for a transect at 65.7° N determined from the IPCC meteorological observations, NCEP re-analysis data for 1997 and ATSR-2 stereo-matching, with a maximum in late summer and a minimum in winter. The NCEP values are considerably lower due to the exceptionally low cover reported for the centre of the ice sheet.

Cloud classification from ATSR-2
Cloud types can be classified according to their optical and microphysical properties, of which the optical depth and particle effective radius are the most important in satellite remote sensing of clouds. Cloud optical depth is a measure of the cumulative depletion of radiation as it passes through the cloud, and is a function of the physical thickness of the cloud. The effective radius is a function of the water-droplet or ice-crystal size distribution. Reference HuntHunt (1973) demonstrated the sensitivity of cloude mittance and transmittance, and thus the radiation flux, to optical depth and particle size at thermal wavelengths. The retrieval of these variables for cloud classification from satellite imagery relies on modelled albedo and brightness-temperature values (e.g. Reference Hu and StamnesHu and Stamnes, 1993). Following the calculation of the optical depth and effective radius, the cloud-covered pixels previously identified by stereo-matching of ATSR-2 images can be classified according to the class boundaries defined by ISCCP (Reference Rossow and SchifferRossow and Schiffer, 1991). To maintain consistency, all retrievals use the ATSR-2 brightness temperatures measured at 10.8 and 12 μm and calculated from the combined emissivity/reflectivity value measured at 3.7 μm.
The mean cloud height determined from the ATSR-2 images along the 65.7°N transect shows a steady increase from 3100m at the margin to 6400m in the centre. This trend in cloud top height is mirrored by the frequency of each cloud type, with altocumulus and altostratus most common in the centre of the ice sheet (accounting for 40.3% of the total cloud cover). Cumulus, cirrus and cirrostratus each make up 14–16% of the cloud cover in the centre, and stratocumulus and stratus are detected almost exclusively at the coastal margins. Seasonal distribution of cloud types is much more revealing, however, than the annual cover, with a marked difference between the highest-level clouds dominating in spring (>50%), mid-level clouds most common during the summer months (>60%) and low-level clouds most frequent during winter (about 40%). Diurnal cloud distribution reveals increased cover during the night (75.9% vs 62.7 %during the day), with notably greater low cloud cover at night (26.1% more averaged over the year) and high cloud cover during the day (22.3% more). The ISCCP dataset is the only source of data with which a comparison of cloud type can be made, and a number of differences are apparent between the two. Perhaps the most significant of these differences is the greater proportion of low cloud reported in the ISCCP dataset, on the order of 40% more than from the ATSR-2 stereo-matching. This result is not surprising given that the downward-looking radiometer is limited to viewing the top cloud layer only, and this is an inherent problem in using satellite imagery as the only source of information. Secondly, the ISCCP data indicate even more exaggerated seasonal and diurnal differences, which may be due to their use of fixed threshold values for cloud discrimination which do not necessarily take into account temporal variation in cloud properties.
While it is impossible to make a quantifiable assessment of the reliability of each cloud climatology from the limited observations available, the trends derived from the ATSR-2 data do appear to most closely match field records. Sources of inaccuracy are inherent in each of the methods discussed, through either the gross interpolation made from a small number of data points, the coarse spatial and temporal resolution or the manner in which cloud cover is derived from digital data. As Reference Rossow and GardnerRossow and Garder (1993) showed in their ISCCP report, the diversity of conditions on Earth precludes use of any one method everywhere, with a successful global cloud-detection algorithm being scene-dependent and employing a series of tests to ensure flexibility.
Impact Of Clouds On The Surface Energy Balance
Energy-balance models
A large number of energy-balance models have been developed, of differing degrees of complexity and detail, but all aim to solve the following balance:

where B is the energy available for melting, α is surface albedo, Q is shortwave radiation, L is longwave radiation (i = incoming, o = outgoing), H is sensible-heat flux, and LE is latent-heat flux. For the purposes of this study, only the shortwave and longwave fluxes are calculated, and the sensible- and latent-heat fluxes are neglected as they are relatively unaffected by cloud cover.
The model presented here computes shortwave radiation using the following parameterization, described by Reference Konzelmann, de Wal, Greuell, Bintanja, Henneken and Abe-OuchiKonzelmann and others (1994):

where S is the solar radiation at the top of the atmosphere calculated from the position of the Sun (e.g. Reference WalravenWalraven, 1978), τcs is the clear-sky transmission and τcl the cloud transmission, and fmr is the multiple reflection for clear skies. Shortwave radiation is a function of time and location, and is modified by atmospheric scattering and absorption by air molecules, water vapour and ozone. The parameterizations of the clear-sky terms τcs and fmr, and more information on their derivation can be found in Reference Konzelmann, de Wal, Greuell, Bintanja, Henneken and Abe-OuchiKonzelmann and others (1994). Multiple reflections between the surface and cloud base are considered because of the high surface albedo of the ice sheet.
Clouds reflect much more shortwave radiation than clear skies, and transmission depends on both cloud amount and type. From a large number of observations Reference Atwater and BallAtwater and Ball (1981) determined transmissivity coefficients for each of the cloud types defined within the ATSR-2 classification strategy, which along with the fraction of cloud cover is incorporated in the radiation balance as:

where x and y are empirical coefficients for cloud type i, m is a directional factor related to the air mass, ni is the cloud amount and cx is a constant at which climatic mean transmittance is valid.
Surface albedo plays an important role in determining the contribution of shortwave radiation to the energy balance, and can be determined from the cloud-free pixels of the ATSR-2 visible images (ρ1 at 0.555 μm, ρ2 at 0.67 μm and ρ3 at 0.87 μm) corrected for atmospheric attenuation and view angle. On average, 20% of the reflected radiation at the surface is attenuated before reaching the satellite during the summer months (Reference Stroeve, Nolin and SteffenStroeve and others, 1997), but this can be corrected for with a radiative transfer model such as 6S (Reference Tanre, Holben and KaufmanTanre and others, 1992). This model is frequently used for such correction procedures. For this study it required the addition of a snow spectral albedo model, Arctic atmospheric profiles and the ATSR-2 channel filter functions. After these modifications were made, the outputs of the 6S model were input into the atmospheric-correction equations developed by Reference Mackay, Steven and ClarkMackay and others (1998) to retrieve the narrowband surface reflectances. The equation relating broadband albedo to the narrowband reflectances was derived from multiple regression of field spectrometry measurements of narrow- and broadband albedo values (see Reference Stroeve, Nolin and SteffenStroeve and others, 1997, for further information). It is given by:

Finally, a correction for the bidirectional reflectance from the snow and ice surface was made using the parameterization developed by Reference Greuell and de WildtGreuell and de Ruyter de Wildt (1999). Although originally developed for correction of Thematic Mapper surface albedos, as the authors explain the parameterizations can be applied to similar wavelengths, as the degree of anisotropy appears to be relatively independent of wavelength in this part of the spectrum. Initially derived for use over Swiss glacier ice, application of this bidirectional reflectance distribution function parameterization to Greenland ice surfaces in summer appears to be reliable (personal communication fromW. Reference Greuell and de WildtGreuell, 2001).
Incoming longwave radiation also has a clear- and cloudysky component. The clear-sky contribution follows the method of Reference Kimball, Idso and AaseKimball and others (1982), and is based on the surface elevation (hs) and air temperature (which here is assumed to be equal to the surface temperature, T).

where σ is the Stefan–Boltzmann constant and Lc is the cloud contribution. This temperature is derived from the 10.8 μm nadir and forward images (after correction for atmospheric attenuation) and relies on the fact that the difference between the two images is a function of the different atmospheric path length each is subjected to. This dual-view algorithm is less sensitive to changes in concentration of atmospheric constituents than the standard split-window technique (Reference Bamber and HarrisBamber and Harris, 1994). The coefficients for this algorithm were taken from Reference Stroeve, Haefliger and SteffenStroeve and others (1996). The cloudy-sky contribution is largely a function of cloud base height and temperature. The emissivity coefficient (ki) for each cloud type was based on observations made in the Arctic by Reference OhmuraOhmura (1981):

where ni is the cloud fraction.
Outgoing longwave radiation was based on the observation that ice and snow surfaces radiate as a black body with an emissivity close to 1.0, and is therefore a function only of surface temperature (Reference Van de Wal and OerlemansVan de Wal and Oerlemans, 1994).
Reference experiment
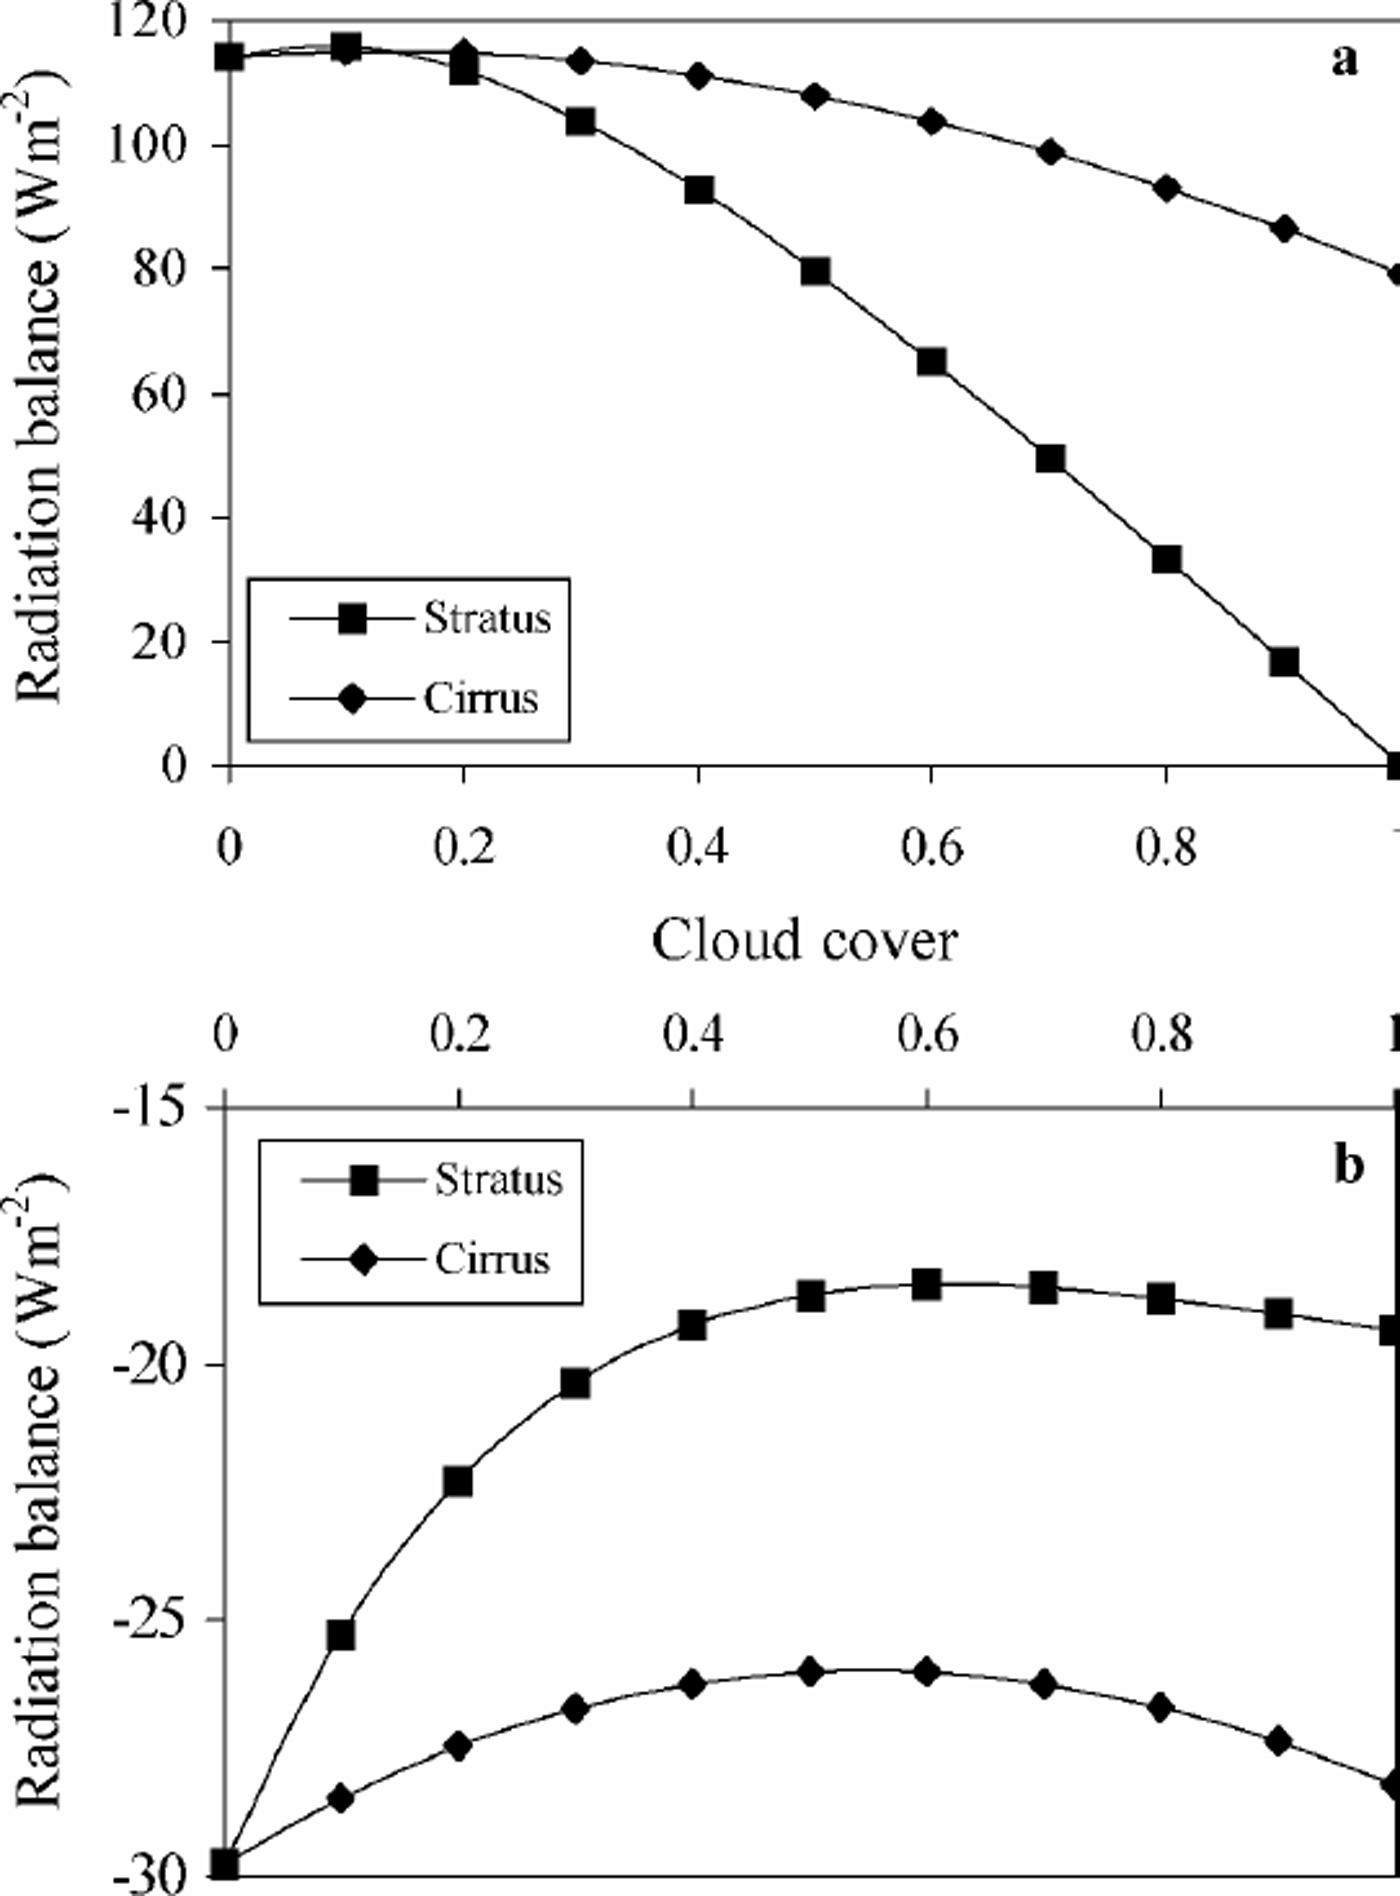
To test the impact of cloud cover on the radiation balance, a reference state needs to be defined, which for this study was taken to be 21 June with no cloud cover along the transect. This represents conditions of maximum radiation balance of 100–150Wm–2, with higher values generally seen towards the margins (Fig. 5). With 100% cirrus cover, the radiation balance is lowered by a factor of 1.4–1.5 almost universally across the transect. With 100% stratus cover, however, there is an equalizing of the radiation balance close to 0 Wm–2, with a range of only 15 Wm–2, including a negative balance in the centre of the ice sheet. With 50%cloud cover, the difference from the reference experiment for cirrus cover was about –5Wm–2, and for stratus about –30–40Wm–2, again with some smoothing of the peaks in net radiation but with values comparable to those of the 100% cirrus cover. The non-linearity of the relationship between the amount of cloud cover and the radiation balance can be shown by calculating the average radiation balance across the transect under conditions of increasing cloud cover from 0 to 1 (Fig. 6a and b). For an albedo of 0.6, typical of wet, melting snow or clean ice, an increase in cloud fraction results in a marked decrease in the net radiation balance (Fig. 6a), with total stratus cover responsible for a radiationbalance of 90Wm–2 less than total cirrus cover. In contrast, an increase in cloud cover over a high-albedo surface of 0.9 (typical of dry, fresh snow) results in an increase in the net radiation balance which is again more marked for the stratus cover (Fig. 6b), although of a smaller magnitude than for the lower albedo. These results concur with the observations of Reference AmbachAmbach (1974) and Reference Bintanja and BroekeBintanja and Van den Broeke (1996) who found an increase in net radiation with increasing cloud amount in the high-albedo accumulation zone, and the reverse in the ablation zone. The only variable changed between the model runs displayed in Figure 6a and b was the surface albedo, and it is interesting to note that for the lower-albedo case the radiation balance is positive for all cloud-cover fractions, implying that the longwave warming effect outweighs the shortwave cooling. Reference Bintanja and BroekeBintanja and Van den Broeke (1996) reported that the dependence of net longwave radiation on cloud amount is much less than for shortwave radiation, and as the results presented here show, the surface albedo has a significant impact on the net radiation budget over highly reflective surfaces. One of the main mechanisms of the loss of shortwave radiation over these high-albedo surfaces is the occurrence of multiple reflection between the surface and the cloud base (Reference Wendler, Eaton and OhtakeWendler and others, 1981; Reference RouseRouse, 1987).
Modelled radiation balance for a transect at 65.7°Nunder different cloud conditions for 21June showing the influence of both cloud amount and type.

(a) The average impact on the modelled radiation balance of increasing stratus and cirrus cover across the transect for 21June with a constant albedo of 0.6 (typical ofwet, melting snow or clean ice). Little impact is seen for cloud-cover fraction below 0.2, but an increasing divergence is seen in the decrease in radiation flux with increasing cloud cover. (b) The average impact on the modelled radiation balance of increasing stratus and cirrus cover across the transect for 21June with a constant albedo of 0.9 (typical of dry, fresh snow). An increase in cloud cover results in an increase in net radiation balance, but this balance is at all times negative unlike that at the lower albedo.
Using the 1997 mean cloud fraction for the transect determined from the ATSR-2 climatology, and assuming 50% stratus and 50% cirrus, a range in the net radiationbalance of 60– 120 Wm–2 was calculated, on average 40.6 Wm–2 below that of the reference state. This division of cloud type was selected in preference to the actual classified cloud types in recognition of the fact that there is almost certainly an underestimation of the low-cloud amount in the ATSR-2 climatology, and to neglect this would generate misleading results. Assuming a combination of the highest and lowest cloud types, the resulting impact on the radiationbalance should be comparable to that producedby the actual cloud cover. Whenthe cloud-cover fractions derived from the IPCCand NCEP datasets are used in place of the ATSR-2 values, the difference in radiation balance is considerable, averaging 10.3 and –18.7Wm–2, respectively (Fig.7). The influence of the surface albedo is very apparent in Figure 7. The increased cloud cover of the ATSR-2 climatology in the centre of the ice sheet (where the albedo is highest) caused the modelled net radiation balance to be considerably higher than for the NCEP cloud cover. By contrast, the higher IPCC cloud cover over the interior is reflected by the highest radiation balance. Towards the margins of the ice sheet, the sensitivity of the radiation balance to changes in both cloud cover and albedois seen by amore complex pattern of net flux. Importantly, there are areas of large discrepancy between the calculated radiation balances in the transition between the ablation and accumulation zones which is particularly sensitive to changes in climate.
The modelled radiation balance calculated under cloud-cover regimes derived from the meteorological observations of the IPCC dataset, NCEP re-analysis data and ATSR-2 stereo-matching. Fifty per cent of the cloud-cover fraction for each climatology is assumed to be stratus and 50% cirrus, with the greatest disparity between the three occurring in the transition from the accumulation to the ablation zone.

The sensitivity of the modelled radiation balance to different meteorological conditions can be ascertained by varying one of the model inputs whilst holding the others constant. Figure 8 indicates the high sensitivity of the modelled net radiation to relatively small changes (±0.02) in summer albedo. It also shows that a change in the cloud cover of ±5% has an effect on the modelled radiation balance that is comparable to a temperature change of 1K. The complexity of the feedbacks associated with changing cloud cover is evident, as a decrease of 5%in cloud fraction has a numerically smaller impact on the radiation balance than an increase of 5% at this albedo. This is contrary to the trend shown by altering the temperature and albedo inputs where only the sign, and not the magnitude, of change in the radiation balance is affected by increasing or decreasing the input conditions by a consistent amount. Varying cloud type has a smaller but no less significant impact on the radiation balance, demonstrating the need to incorporate not only cloud-cover fractions but also the cloud type into surface energy-balance models.
The sensitivity of the model to changes in the input parameters, expressed as a change in the average radiation balance across the 65.7°Ntransect. Changing cloud-cover fraction by 0.05 has an impact on the radiation balance that is comparable to changing summer temperature by 1K, with changes in cloud type having a lesser effect.

Implications For The Greenland Ice Sheet
If the surface is at 0°C, a positive energy balance can be assumed to be used entirely for the process of melting. The amount of potential dailymelt, based on the radiation-budget variation, can be calculated from the integration of the melting rate with respect to time over the day. When only one daily value for the energy balance is available (e.g. when using satellite imagery to derive the balance inputs), the amount of potential melt (W) in mw.e. is approximated by dividing the energy balance by the latent heat for melting (Lm) and the density of water (ρw) (Reference Henneken, Bink, Vugts, Cannemeijer and MeestersHenneken and others, 1994):

where Lm = 0.334×10⁶ J kg–1 and ρw =1000 kgm–3.
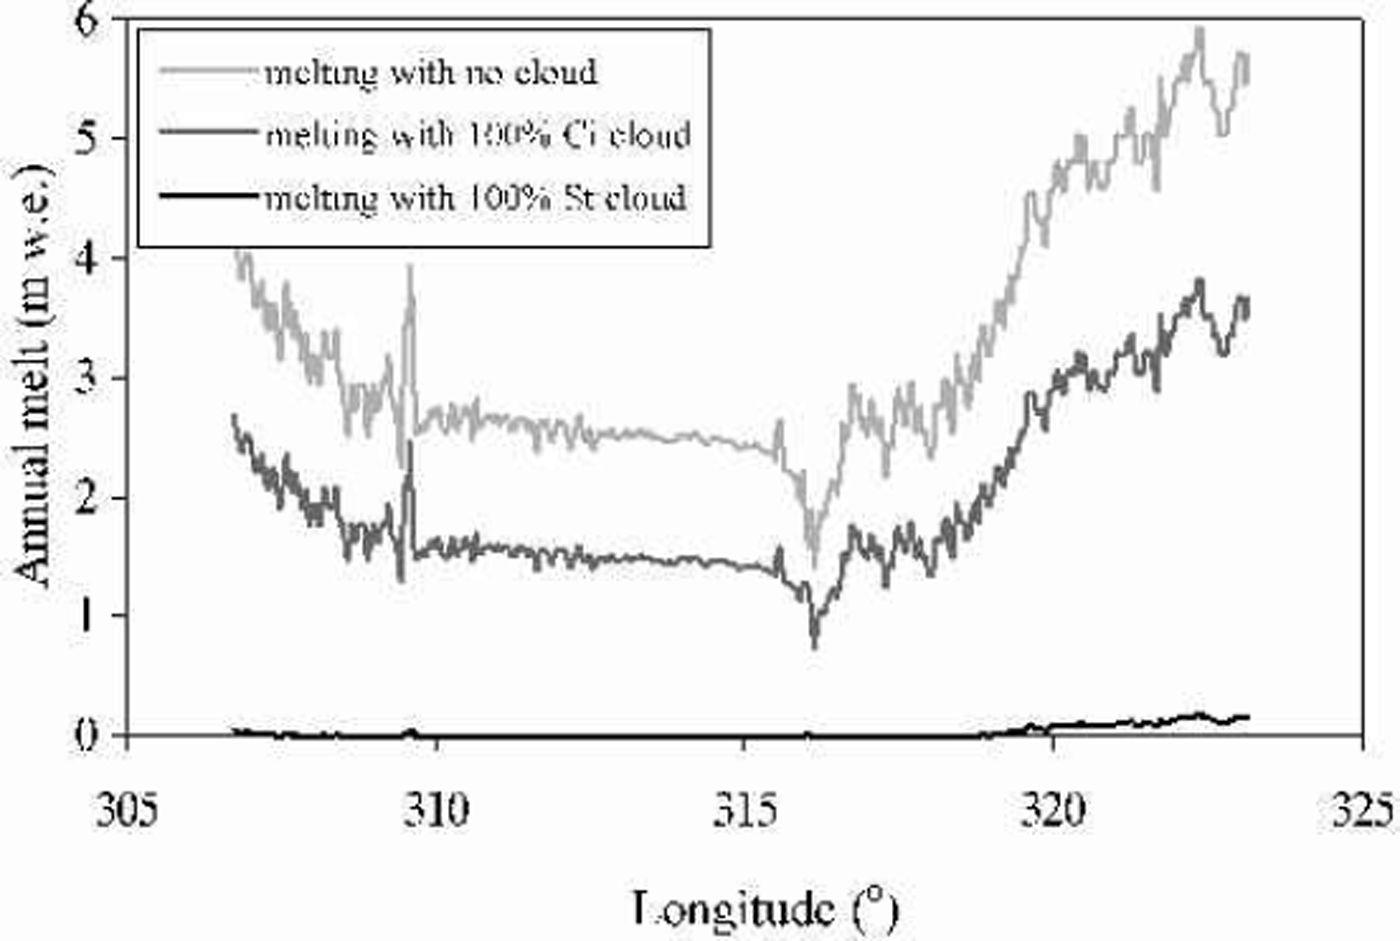
For no cloud cover across the transect, the annual melt (Fig.9) varies fromjust less than 2 mw.e. at the highest elevations to 3.5–6mw.e. at the margins. In the centre of the ice sheet, in the accumulation zone, the capacity for melt is relatively constant at all longitudes, but near the margins there is a rapid increase. This model suggests a considerably higher capacity for melt on the east than on the west coast in response to the lower summer cloud cover in the east (see Fig. 3a) when melting potential is maximum, and also due to localized temperature and albedo changes during the year. Under conditions of continuous cirrus cover, the potential annual melt is lowered by 1.5–2mw.e., with the greatest differences evident at the margins, and under total stratus conditions very little melt is calculated except at the extreme margins where up to 0.2 mw.e. may be lost annually. Under more realistic cloud-cover fractions based on the climatologies derived earlier, assuming 50% of the cloud to be stratus and 50% to be cirrus, a similar pattern is seen (Fig. 10). In the centre of the ice sheet, the potential for melting appears to be independent of the cloud fraction, reflecting the fact that air temperature is the greatest control. Toward the ice-sheet margins, however, the disparity in melt caused by the alternative cloud climatologies is more significant, with up to 1.5mw.e. difference between the ATSR-2 and the IPCC and NCEP fractions. These differences in potential melt between an energy balance that neglects cloud cover and one that incorporates a low-resolution cloud climatology are not insubstantial, and represent in some cases a more than doubling of the amount of meltwater produced annually. The implications of this for studies of the mass balance of the ice sheet, and in particular the marginal glaciers, may be significant. It is also important to acknowledge that with a changing climate there will be changes in cloud cover which, as demonstrated here, could have important consequences for the future mass balance of the Greenland ice sheet.
Modelled potential annualmelt inm w. e. under varying conditions of cloud across the 65.7°N transect, illustrating the impact of different types of cloud cover, with maximum melting occurring at the ice-sheet margins, while under 100% stratus cover there is little or no melting across most of the ice sheet.
Modelled potential annual melt in m w.e. under cloud-cover regimes derived from the IPCC meteorological observations, NCEP re-analysis data and ATSR-2 stereo-matching, assuming 50% of the cloud to be stratus and 50%cirrus. Melt is most dependent on cloud-cover fraction towards the margins, where it differs by a factor of 2 depending on the cloud climatology used.

Conclusions
Several different cloud-cover datasets have been compiled from a number of different sources at a range of spatial and temporal scales. The cloud climatologies derived from these data, for a transect across southern Greenland, show many inconsistencies, although there is a general trend of cloud cover to decrease moving inland. This pattern is also detected in the cloud climatology derived from stereo-matching ATSR-2 imagery on a 1km scale, although to a less extreme extent than in the NCEP data, and significantly greater cloud cover is identified in the vicinity of the equilibrium line. The higher spatial resolution of the ATSR-2 data reveals the variation in cloud cover over relatively short distances and the difficulty in interpolating cloud cover from a sparse network of data points. Where the reliability of the observations of the IPCC dataset is highest, at the coast, the correspondence with the ATSR-2 cloud cover is good. Seasonal cloud cover varies considerably in terms of both amount and type, with high and mid-level cloud dominating during the spring and summer months and low-level clouds in winter. However, it must be remembered that an apparent lack of low cloud identified by stereo-matching is not necessarily a reflection of the true state, as only the highest level of cloud evident to the radiometer is detected. When these different cloud climatologies are used as an input into a radiative transfer model, the importance of accurate cloud data is evident, with differences of up to 40 Wm–2 between the IPCC and NCEP climatologies in the centre of the ice sheet, where the albedo is high. In the ablation zone, where the albedo is lower and more variable, the sensitivity to cloud-cover fraction is less marked, but the higher spatial resolution of the ATSR-2 cloud record is reflected by a much more varied trend in radiation balance. Whether the net radiation balance increases or decreases with increased cloud cover is a function not only of changes in the cloud amount and type, but also of the surface albedo. The relationship between the radiation balance and cloud cover appears to be more complex than with either temperature or albedo, and is further complicated by the fact that a change in these parameters is inherent in changing cloud cover. When radiation balance is converted to mw.e. melt per year, the quantitative impact of cloud cover on the Greenland ice sheet is clearly evident, with a difference of as much as 1.5 mw.e. at some locations.
In light of the ongoing research into predictions of cloud amount using climate models, this work provides some insight into the relationship between possible future changes in cloud climatology and the impact on the radiative fluxes over ice and snow surfaces. We believe this work has demonstrated that inclusion of detailed information on cloud amount and type is key to accurately determining the effect of climate change on snowmelt using energy-balancemodels.
Acknowledgements
The authors would like to thank the European Space Agency for providing the ATSR-2 data, and J.-P. Muller and C. Moroney for the use of the stereo-matching software. We are also grateful for the helpful comments from the two anonymous referees.



