Introduction
Maternal environment during intrauterine life affects adult phenotype. Epidemiological observations as well as clinical and experimental studies have linked adverse maternal environmental conditions during embryonic and fetal development with risks of diseases later in life.Reference Barker, Gluckman and Godfrey 1 – Reference Costantine, Ferrari and Chiossi 5 This concept, described as fetal programming relates to the phenomenon of developmental plasticity where gene expressions can be physiologically and morphologically modified over a wide range in response to the environmental conditions during intrauterine growth and development.Reference Byrne and Phillips 6 During unfavorable environmental conditions (or insults), however, the physiological and morphological modifications may go out of the normal range of development and changes in the body structure and function at this critical period may become permanent through life.Reference Barker 7 Different insults can program different systems depending on the timing, duration and severity during exposure.Reference Fowden, Giussani and Forhead 8 Studies showed that hyperglycemia during intrauterine life is an abnormal stimulus hence an insult that could trigger fetal programming.Reference Hillier, Pedula and Schmidt 9 , Reference Clausen, Mathiesen and Hansen 10
Human studies have shown that babies born to women who experienced gestational diabetes are at risk of developing abnormal glucose homeostasis in adult life.Reference Fetita, Sobngwi, Serradas, Calvo and Gautier 11 Gestational diabetes mellitus (GDM) is one of the most commonly experienced pregnancy complications that affect about 14% of pregnancies in high-risk populations.Reference Bowers, Tobias, Yeung, Hu and Zhang 12 Insults in gestational diabetes could involve a relatively diminished insulin secretion as well as pregnancy-induced insulin resistance.Reference Buchanan, Xiang, Kjos and Watanabe 13 Therefore, factors that contribute to insulin resistance or impaired insulin secretion before pregnancy could increase risk of GDM. A number of pre-pregnancy dietary and lifestyle factors have been recently related to GDM risk.Reference Bowers, Yeung and Williams 14 – Reference Tobias, Zhang, van Dam, Bowers and Hu 16
During GDM, the fetus receives the high glucose from the mother’s blood and in response to that secretes large amounts of insulin as maternal insulin does not cross the placental barrier.Reference Kelly, Evans and Messenger 17 The resultant fetal hyperinsulinemia is believed to be the cause of various aspects of diabetic fetopathy.Reference Kelly, Evans and Messenger 17 There has been documented increase in body weight (bw) in infants of diabetic mothers compared with control subjects.Reference Ju, Rumbold, Willson and Crowther 18 – Reference Giang, Gjelsvik, Cain and Paine 22 The effects of maternal hyperglycemia on fetal development are varied and determined by the severity and the time of onset.
In addition, neonatal complications attributed to gestational diabetes (or hyperglycemia) include respiratory distress syndrome, hypocalcemia, hyperbilirubinemia, hypoglycemia, polycythemia,Reference Gilmartin, Ural and Repke 23 increased risk of childhood obesity,Reference Hillier, Pedula and Schmidt 9 , Reference Dabelea, Mayer-Davis and Lamichhane 24 and type 2 diabetes and hyperlipidemia in adolescence and adulthood.Reference McLean, Chipps and Cheung 25 , Reference Pettitt, Lawrence and Beyer 26 In rats, in utero exposure to maternal diabetes has been associated with the development of a salt-sensitive systolic hypertension and with a decrease in renal function in adulthoodReference Nehiri, Duong Van Huyen and Viltard 27 . GDM has also adversely affected the reproductive functions in female offspring of ratsReference Spadotto, Damasceno and Godinho 28 as well as male offspring in humans.Reference Jelodar, Khaksar and Pourahmadi 29 , Reference Amorim, Damasceno and Perobelli 30 Few studies have demonstrated the effects of maternal diabetes on male reproductive functions in animals and none of these studies has been able to show the critical period during which maternal hyperglycemia is likely to cause this type of programming. Therefore, the present study was designed to determine the effects of maternal hyperglycemia during different gestation periods on male reproductive functions in Wistar rats.
Methods
The experimental protocols and procedures used in this study were approved by the Ethical Committee, University of Ibadan, Nigeria and conform to the guideline of care and use of animals in research and teaching. 31
Experimental animals
Twenty virgin female Wistar rats (160–180 g, 12–14 weeks) and 10 male Wistar rats obtained from the animal house of the College of Medicine, University of Ibadan were kept in the cages and given feed and water ad libitum. They were allowed to acclimatize for 2 weeks before starting the study. The rats were grouped as follows: group 1 (control); group 2 rats were given a single intraperitoneal injection of alloxan on gestation day (GD) 1 and subsequently given 10% glucose in drinking water throughout pregnancy; group 3 rats were given a single intraperitoneal injection of alloxan on GD8 and subsequently given 10% glucose in drinking water till the end of pregnancy; group 4 rats were given a single intraperitoneal injection of alloxan on GD15 and subsequently given 10% glucose in drinking water till the end of pregnancy.
Mating procedure and determination of pregnancy
All female rats were mated overnight during proestrus phase with proven male breeders in ratio 2:1 (female to male). The vaginal lavage was examined under 40× objective lens of the light microscope (XS2 107, China) every morning following mating. The presence of spermatozoa in the vaginal lavage confirmed mating. The day on which spermatozoa were found in the vaginal lavage was GD1.
Induction of hyperglycemia
A single intraperitoneal injection of 90 mg/kg bw alloxanReference Palomar-Morales, Baiza and Verdin-Teran 32 was administered to dams in groups 2, 3 and 4 on GD 1, 8 and 15, respectively. Random blood glucose level was determined with tail blood using a glucometer (On call plus, USA) before administration of alloxan, 24 h after administration of alloxan and on GD 20. Rats with fasting blood glucose⩾120 mg/dl were considered hyperglycemic. The animals’ drinking water was replaced with 10% glucose solution immediately after alloxan administration until parturition in each, respectively.
Postnatal studies
Parturition was allowed to occur naturally and the day of parturition was designated as postnatal day (PND) 0. Birth weight and anogenital distance (AGD) were taken on PND 1. The male pups were fed and allowed to grow with their natural mothers and were weighed weekly. Starting from PND 15, the day of testicular descent was determined by daily palpation of the scrotal sac for testicular presence. Pups were weaned on PND 21 and preputial separation began to be investigated on PND 25 through manual retraction of the prepuce. All animals were fed standard laboratory rodent pellets (Ladokun feeds, Nigeria), which contain ∼25% protein, 48% carbohydrate, 4% fat, 6% fiber, 7% minerals and 3% vitamins and drinking water ad libitum. The mothers received the standard rodent pellets before, during and after gestation, whereas the offspring received the same feed after weaning till sacrifice. Fasting blood glucose level was determined at puberty by the 8th week of postnatal life. Blood sample was collected from medial canthus vein on PND 63 before sacrifice.
All animals were sacrificed by cervical dislocation after puberty on PND 63.
Assessment of reproductive organs
The animals were cut open from the linea alba of the abdominal cavity to the thoracic cavity after cervical dislocation. The testes and epididymes were collected and weighed. The testes were collected and fixed in Bouin’s fluid. The fixed organs were used in the preparation of histological slides (Histopathology Department, University Teaching Hospital, Ibadan).
Preparation of histological slides
The samples were fixed in Bouin’s fluid for at least 5 h, immediately after it was collected from the animal. After 5 h, each tissue was placed in 70, 80, 90 and 95% and two changes of absolute alcohol for 1 h each in order to dehydrate them. They were then placed in two changes of xylene for 1 h each. On removing it from xylene, it was placed in wax bath, at least two changes for h each and it was embedded in paraffin wax. The tissue was then trimmed nicked and sectioned at 3–5 micron with a microtome. The section was floated with 20% alcohol on water at a temperature of 5°C below paraffin wax melting point. The section was picked with a clean, grease-free microscope slide and water was drained and placed on microscope slide for at least 1 h. Staining was done with hematoxylin and eosin for the purpose of determining the general morphology. The procedures for staining are as follows: the tissue was dewaxed in two changes of xylene for 3 min each. The section was taken into water and rinsed in absolute alcohol for 2 min and in 95, 90, 80, 70 alcohol each for 2 min. It was rinsed in water and then stained with Harris-hematoxylin for 5 min, rinsed in water and differentiated in 1% acid alcohol – three dips. Thereafter, it was rinsed briefly in water and blued in running tap water for 3 min before being counterstained with aqueous eosin for 3 min.
It was dehydrated using ascending grades of alcohol, that is, 70, 80, 90, 95 and 100% – 1 min each. It was cleared in xylene and mount with DPX. A photomicrograph of the sections was made in order to observe morphological changes.
Sperm analysis
The caudal epididymis was collected for sperm analysis. Sperm motility was done immediately and quickly. The caudal epididymis was cut open, a drop of the content was placed on a slide and two drops of warm 2.9% sodium citrate was added. This was then covered with a cover slip and examined under the microscope using 40× objective lens of the light microscope to assess motility.Reference Morrissey, Schwetz and JCt 33
Sperm viability was done using the eosin/nigrosin stain, which contained 1.00 g of Eosin blue and 4.00 g of Nigrosin in 100 ml phosphate buffer. A drop of the epididymal fluid was placed on the slide, two drops of the stain was added, after which a thick smear was made and dried. The resulting stain was then studied under the microscope using 40× objective lens. The live spermatic cells were unstained, whereas the dead spermatic cells were stained. A minimum of 100 spermatic cells, stained and unstained sperm cells were counted and an average was taken for the percentage of live sperm.
Sperm count was done using a Neubauer counting chamber. The results were expressed as million/ml.Reference Freund and Carol 34 The caudal epididymis was homogenized in known volume of formal saline. It is further diluted to a total dilution factor of 200. Using the Neubauer counting chamber, spermatic cells in five big squares were counted. The volume of the five squares=1/50 µl sperm count=number of cells counted×50×diluting factor×1000/ml.
Reproductive hormone assay
Blood sample was collected before sacrifice on PND 63 from medial canthus vein into plain serum bottles and allowed to clot for about 45 min after which it was spun for 15 min at 3000 rpm. The clear serum was collected and concentrations of follicle-stimulating hormone (FSH), luteinizing hormone (LH) and testosterone were measured immediately in a single assay per hormone using ELISA following the kit instructions (Rapid labs, UK).
Statistical analysis
Data were analyzed using SPSS version 17. Data was summarized using means and 95% confidence interval for normally distributed data and medians and range for skewed data. Analysis of summarized data was done using ANOVA for the normally distributed data and non-parametric Kruskal–Wallis test for the skewed data. Global P-values for F tests of the equality of means of the four groups were reported. Ninety-five percent confidence intervals were reported for all four groups for all analyses involving comparison of means and the means were compared with control value. Difference in means based on confidence interval determined the level of significance. However, global P-values determined the level of significance of the skewed data.
Results
Effects of maternal hyperglycemia on mean birth weight (g) of male pups
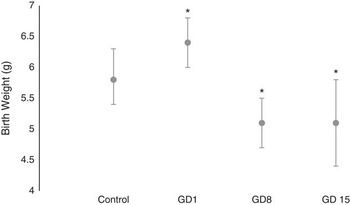
GD1 pups had birth weight (g) of 6.4 (6.0–6.8), which was significantly higher than the birth weights of pups from control [5.8 (5.4–6.3)], GD8 [5.1(4.7–5.5)] and GD15 [5.1(4.4–5.8)] groups (Fig. 1). GD8 and GD15 pups also had reduced birth weight (g) compared with control pups.
Effect of maternal hyperglycemia on birth weight (g) of male pups. Based on analysis of variance F tests, P<0.001; values expressed as mean (95% CI); n=8. *Significantly different from control based on 95% confidence interval.

Effects of maternal hyperglycemia on mean AGD index (AGDi) of male pups at bBirth
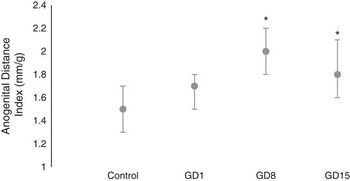
AGDi (mm/g) was significantly increased in offspring of GD8 [2.0 (1.8–2.2)] and GD15 [1.8 (1.6–2.1)] rats compared with that of the control pups [1.5 (1.3–1.7)]. The AGDi of GD1 pups [1.7 (1.5–1.8)] was increased but not significantly (Fig. 2).
Effect of maternal hyperglycemia on anogenital distance index of male pups. Based on analysis of variance F tests, P=0.008; values expressed as mean (95% CI); n=8. *Significantly different from control based on 95% confidence interval.

Effects of maternal hyperglycemia on testes descent and preputial separation
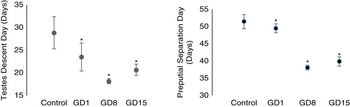
Testes descent occurred in the following order from the earliest to the latest: GD8 [18.1(17.6–18.7)], GD15 [20.6(19.4–21.9)], GD1 [23.5(20.4–26.6)] and control [28.8(25.3–32.4)]. Preputial separation also occurred in similar order as follows: GD8 [38.1(37.4–38.8)], GD15 [39.9(38.5–41.2)], GD1 [49.5(48.2–50.8)] and control [51.5(49.4–53.5)]. These occurred significantly earlier in all the experimental groups compared with the control (Fig. 3).
Effect of maternal hyperglycemia on testes descent day and preputial separation day. Based on analysis of variance F tests, P<0.001; values expressed as mean (95% CI); n=8. *Significantly different from control based on 95% confidence interval.

Effects of maternal hyperglycemia on progressive bw (g) of male pups
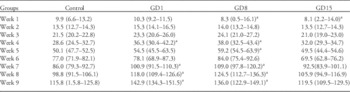
GD8 pups had the lowest mean birth weight but had the fastest progressive weight until after the 8th week of postnatal life. GD1 had the highest mean birth weight and the highest weight at sacrifice. Control group had the lowest weight at sacrifice. GD1 offspring had significantly higher weights (g) than control animals in the 1st [10.3 (9.2–11.5); 9.9 (6.6–13.2)], 4th [36.3 (30.4–42.2); 28.6 (24.5–32.7)], 7th [100.9 (91.5–110.3); 86.0 (79.3–92.7)], 8th [118.0 (109.4–126.6); 98.8 (91.5–106.1)] and 9th [142.9 (134.3–151.5); 115.8 (1.5.8–125.8)] week of postnatal life. GD8 offspring had higher weights (g) than the control offspring in the 4th [38.0 (32.5–43.4); 28.6 (24.5–32.7)], 5th [59.2 (54.5–63.9); 50.1 (47.7–52.5)], 7th [109.0 (97.8–120.2); 86.0 (79.3–92.7)], 8th [124.5 (112.7–136.3); 98.8 (91.5–106.1)] and 9th [136.0 (122.9–149.1); 115.8 (1.5.8–125.8)] week. GD8 [8.3 (0.5–16.1)] and GD15 [8.1 (2.2–14.0)] offspring had decreased weight (g) compared with control offspring [9.9 (6.6-13.2)] only in the 1st week of postnatal life (Table 1).
Effect of maternal hyperglycemia on mean progressive body weights of male pups

GD, gestation days.
Based on analysis of variance F test.Values expressed as mean (95% CI); n=8.
a Significantly different from control based on 95% confidence interval.
The effects of maternal hyperglycemia on fasting blood glucose of offspring
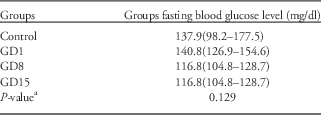
There was no significant difference in the fasting blood sugar (ng/dl) of offspring of GD1 [140.8 (126.9–154.6)], GD8 [116.8 (104.8–128.7)], GD15 [113.9 (99.3–128.5)] and control [137.9 (98.2–177.5)] groups (Table2).
Effect of maternal hyperglycemia on fasting blood glucose level (ng/dl) of male offspring

a Based on analysis of variance; values expressed as mean(95% CI); n=5.
Effects of maternal hyperglycemia on the serum levels of insulin, testosterone, LH and FSH
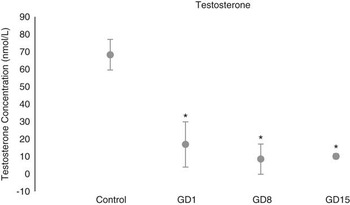
Testosterone level (nmol/l) was significantly lower in GD1 [16.9 (3.9–29.9)], GD8 [8.5 (−0.2–17.1)] and GD15 [10.1 (8.6–11.6)] compared with the control (Fig. 4). The control group insulin level [9.9 (8.6)] was significantly higher than GD1 [0 (12.6)], GD8 [0 (0)], and GD15 [0 (16)] insulin level. However, the pattern for LH though significant on Kruskal–Wallis test was less convincing (Table 3) Control, GD1, GD8, GD15 had serum LH level of 9.1 (7.5), 0 (2.7), 9.9 (15.8) and 1.5 (2.4), respectively. The concentration of FSH across all groups was not significantly different (Table 3).
Effect of maternal hyperglycemia on serum testosterone level of male pups. Based on analysis of variance F test, P<0.001; values expressed as mean (95% CI); n=5. *Significantly different from control based on 95% confidence interval.

Effects of maternal hyperglycemia on serum insulin, FSH and LH levels of male offspring

FSH, follicle-stimulating hormone; LH, luteinizing; GD, gestation days.
a Based on Kruskal–Wallis tests; values expressed as median (range); n=5.
Effects of maternal hyperglycemia on caudal epididymal sperm characteristics
Some of the offspring from the GD8 mothers had azoospermia and others had few sperm cells. The mean sperm count of GD8 offspring was 0 (10) 106/ml. Control, GD1 and GD15 offspring had sperm count (106/ml) of 72 (13), 73 (108) and 60 (81), respectively. Sperm viability of GD8 offspring was zero. Sperm viability (%) of GD1 [40(95)] and GD15 [40(60)] offspring was not different from that of control [70(25)]. Sperm motility (%) in all treatment groups: GD1 [0(70)], GD8 [0(0)] and GD15 [20(40)] was lower than sperm motility of the control [90(15)] (Table 4).
Effects of maternal hyperglycemia on caudal epididymal sperm characteristics

GD, gestation days.
Values expressed as median (range); n=5.
a Based on Kruskal–Wallis tests.
Effects of maternal hyperglycemia on histology of testes
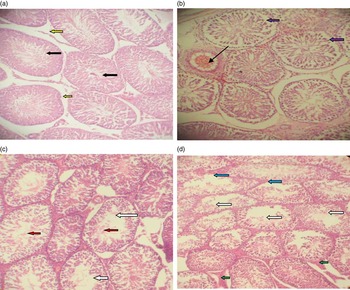
Photomicrograph of control testes showed normal seminiferous tubules (Fig. 5a). GD1 testes showed seminiferous tubules with shifted spermatogonia cells off the basal lamina. Some tubules also had reduced germ cells. There is evidence of vascular congestion (Fig. 5b). GD8 showed seminiferous tubules with incomplete maturation of spermatocytes and the lumens of some of the seminiferous tubules are empty (Fig. 5c). The photomicrograph of GD15 testes showed maturation arrest. The interstitium shows hyperplasia (green arrows). Some seminiferous tubules showed no germ cells layers (blue arrows, Fig. 5d).
Effects of maternal hyperglycemia on histology of testes. H&E stain: Mag ×100. (a) Normal seminiferous tubules (black arrows) and interstitial spaces (yellow arrows). (b) Seminiferous tubules with shifted spermatogonia cells off the basal lamina (purple arrows). There are inadequate germ cells in some tubules. There is evidence of vascular congestion (slender arrow). (c) Seminiferous tubules with incomplete maturation of spermatocytes (white arrows). Some germ cells are sloughed into the lumen (red arrows). The interstitial cells appear normal. (d) Seminiferous tubules with incomplete maturation of spermatocytes (white arrows). The interstitium shows hyperplasia (green arrows). Some seminiferous tubules showed no germ cells layers (blue arrows).

Discussion
Researchers have established that alterations from the normal birth weight are pointers to early adult onset of disease.Reference Barker, Gluckman and Godfrey 1 , Reference Barker 7 , Reference Palomar-Morales, Baiza and Verdin-Teran 32 , Reference Catalano, Thomas, Huston-Presley and Amini 35 Such alterations from the normal birth weight, could be a significantly lower or higher birth weight. The significantly higher birth weight observed in pups exposed to maternal hyperglycemia from GD1 is consistent with results from other studies that recorded increased birth weight in hyperglycemic and diabetic pregnancies in both animal and human.Reference Benjamin and Pridijan 21 , Reference Giang, Gjelsvik, Cain and Paine 22 , Reference Catalano, Thomas, Huston-Presley and Amini 35 – Reference Vohr and McGarvey 37 This may have resulted from the long duration of exposure to excess of fuel resulting in an increase in glucose transport across the placenta. Maternal insulin does not cross the placenta,Reference Reece, Leguizamon and Wiznitzer 20 , Reference Freinkel 38 thus the developing fetal pancreas would have a compensatory increase in insulin secretion thus promoting increase in pup growth and adiposity,Reference Reece, Leguizamon and Wiznitzer 20 , Reference Freinkel 38 and resulting in the higher birth weight. This does not however explain why GD8 and GD15 pups, which were exposed to a similar excess of fuel (although for a shorter period of time), had lower birth weight. In this case, low birth weight is not likely to be directly related to maternal hyperglycemia, but to the sudden change in the blood glucose level during the period of induction of hyperglycemia.
The AGDi, which is AGD/Cube root of bw, is used in this study because it normalizes the effects of bw on AGD.Reference Gallavan, Holson, Stump, Knapp and Reynolds 39 AGD is a marker of endocrine disruption in animal studies in which a decreased distance has been associated with testicular dysfunction.Reference Eisenberg, Jensen, Walters, Skakkebaek and Lipshultz 40 Increase AGD on the other hand has been reported to positively correlate with circulating androgen levels.Reference Eisenberg, Jensen, Walters, Skakkebaek and Lipshultz 40 The negative correlation observed between the level of androgen and AGDi in this study is not fully understood. The normal masculinization observed in the offspring suggests that exposure to androgen in utero was normal and therefore the reduction in testosterone observed in postnatal life is not directly linked to masculinization of the reproductive organs. In addition to the increase in the AGDi of GD8 and GD15 testes descent and preputial separation in all the pups exposed to maternal hyperglycemia were significantly earlier compared with control (Fig. 3). This suggests that exposure of male fetus to maternal hyperglycemia might lead to early onset of puberty irrespective of the time of exposure. The onset and course of puberty are under the control of the neuroendocrine system. For example, endocrine disruptors may cause early puberty via their estrogenic, antiandrogenic effects and also by increasing GnRH production.Reference Buck Louis, Gray and Marcus 41 , Reference Jacobson-Dickman and Lee 42 If the neuroendocrine system was involved, early puberty in these animals would have been accompanied by an increase in the level of testosterone. However, all test animals showed significantly reduced testosterone level, which corresponded with reduced LH level in GD1 and GD8 (Table 3) leading us to believe that this early puberty may be caused by something else. Early puberty in humans is known as precocious puberty, and one of the causes of precocious puberty in humans is increased body weight. Increased body weight is reported to lead to overexpression of kisspeptin, which leads to early onset of puberty; this is because kisspeptin has been shown to have synergistic effect with leptin.Reference Wahab, Atika and Shahab 43 Leptin concentration was not determined in these animals, but the higher body weight in GD1 and GD8 animals suggest increase in leptin. Leptin concentration is negatively correlated with serum testosterone level in infertile menReference Najem, Al-tayar and Al-Chalaby 44 and leptin has been shown to inhibit testosterone secretion from adult rat testis.Reference Tena-Sempere, Pinilla and Gonzalez 45 Thus, leptin may have been responsible for the reduced testosterone concentration. Body weight in GD1, GD8 and GD15 animals were higher than in control animals almost throughout the experiment, though not significantly so in GD15 at sacrifice, therefore, leptin may have been higher and the foregoing explanation may be or may not be applicable.
It has been established that at every age measured, the offspring of women with GDM are heavier (adjusted for height) and have higher adiposity than the offspring of women with normal blood sugar level during pregnancy.Reference Dabelea, Mayer-Davis and Lamichhane 24 This is true for most parts of the experiment especially for pups exposed to maternal hyperglycemia from GD1 to GD8, but not for pups exposed to maternal hyperglycemia from GD15 (Table 1). Testosterone reduction was associated with LH reduction in GD1 and GD15 but not in GD8 pups. This suggests that in GD1 and GD15 pups, testosterone reduction may have been caused by reduction in LH levels coupled with the suggested leptin effect. LH is produced from the anterior pituitary, therefore, the cells responsible for the production of LH but not FSH in the anterior pituitary may have been affected as the level of FSH was not different across all groups. Why the GD8 pups did not show this effect is not known. The varying degrees of pathologies seen in the testicular histology (Fig. 4) showed that maternal hyperglycemia adversely affected testicular development. The incomplete maturation of spermatic cells (Fig. 5c) was responsible for the close to nil sperm count in GD8. These cells were also dead and non-motile (Fig. 5). The implication of this is that this group of animals would not be fertile. Although GD15 offspring also showed incomplete maturation of spermatic cells, some seminiferous tubules had spermatic cells in their lumen (Fig. 5d). All groups had significantly lower sperm motility compared with control; therefore, programming may also involve the epididymis.
Conclusion
In conclusion, maternal hyperglycemia at different periods during gestation had varying adverse effects on the reproductive functions of the male offspring in Wistar rats. However, the male offspring belonging to GD8 mothers showed the most severely altered reproductive functions.
Acknowledgements
Special thanks to Babatunde Adedokun of the Department of Epidemiology and Medical Statistics, Faculty of Public Health, University of Ibadan who made significant contributions in the area of statistical analysis of data.
Financial Support
There is no financial support and there is no conflict of interest.
Conflicts of Interest
None.
Ethical Standards
All procedures contributing to this work comply with the ethical standards of the NIH guides on the care and use of laboratory animals (NIH Publication revised; No. 85–23 revised 1996) and has been approved by the Ethical committee, University of Ibadan.