Early analyses of the 2006 presidential election in Mexico have called our attention to the post-election process, to accusations of fraud, to the extent of partisan polarization, and to the prospects of democratic consolidation, but few have offered an explanation of why President Vicente Fox's National Action Party (PAN) was able to maintain control of the executive office, even by the slim margin of 0.56%. In this article, I argue that the first post-PRI-regime election split the anti-PRI vote into different ideological and policy-oriented camps. This made the 2006 race a choice between policy programs and priorities that reflected economic concerns, and voters' assessments of the economy were a central feature of candidate support. Economic growth in the second half of the Fox administration as well as unusually high oil prices played a crucial role in the election. They enabled the PAN candidate, Felipe Calderón, to appeal for stability and to attack his main contender, PRD candidate Andrés Manuel López Obrador, as a danger to it. Had economic growth remained slow and oil prices at the expected rate, the PAN's chances to keep the presidency would have been slim, especially against a popular leftist candidate who had a lead in the polls, promised to help the poor at the expense of the rich, and voiced harsh criticism against the “neoliberal” policies of the PRI and PAN governments.
Dramatis Personae
Three main presidential candidates, out of five in total, obtained over 95% of the votes in 2006. Because the president is constitutionally forbidden to run for reelection, his party organized a primary only open to party members and affiliates, which turned out to be an upset for Fox's favorite candidate, Interior Minister Santiago Creel. The winner was a relatively unknown figure at the time, Felipe Calderón, a young politician who had served as PAN congressional leader and as secretary of energy under Fox, a cabinet position he resigned in protest to Fox's open support for Creel.
As mayor of Mexico City, Andrés Manuel López Obrador was a national political figure and, accordingly, had been leading in the polls for at least 18 months, making him the natural candidate for the Party of the Democratic Revolution (PRD). His 10-to-12-point advantage in most of 2005 and early 2006 seemed insurmountable. His lead had been even larger before he was subject to impeachment by Congress early in 2005 in a prosecution started by the federal attorney general's office. He was accused of disobeying a court ruling that had ordered him not to construct a road to a hospital on what turned out to be private land.
The heated public debate about impeachment, or desafuero, that took place from 2004 to mid-2005, was the first sign of political polarization, with those supporting impeachment and the rule of law on one side, and those opposing impeachment and espousing arguments of injustice and conspiracy, on the other. López Obrador was stripped of his immunity as an elected official so that he might face trial, something that, because of the legal timing and the possibility of serving time in jail, would prevent him from running for president. In an unexpected and unexplained act, President Fox granted pardon to the PRD leader, dropping all charges previously placed by the attorney general, and thereby enabling López Obrador to run for president. Thereafter he was nominated as presidential candidate for the leftist coalition Por el Bien de Todos (For the Good of All), which was led by his party. However, the bitter desafuero debate proved a high cost for López Obrador, as his numbers in the polls dropped. López Obrador's electoral strength came mostly from Mexico City and surrounding areas, but his programs of economic aid to the poor and the elderly made him quite popular in several parts of the country, especially in the south.
The Institutional Revolutionary Party's (PRI) presidential candidate, Roberto Madrazo, was nominated after a virtually uncontested primary election open to all voters. The primary campaign was underway when Madrazo's main challenger, former State of Mexico Governor Arturo Montiel, dropped from the race after the media uncovered a series of properties he owned in Mexico and France that were allegedly bought with kickbacks he received as governor. Madrazo, a former governor of Tabasco (also López Obrador's home state), had served as PRI president, but his image was perceived of quite negatively by the electorate as a whole as well as those within his own party (see the discussion in Joy Langston's article in this symposium).
Changing Political Coalitions
In 2000, Vicente Fox defeated the long-ruling PRI by asking Mexicans to vote for a change. By “change,” voters and opposition politicians alike meant evicting the PRI from Los Pinos, the presidential residence. Fox's electoral coalition relied heavily on young, well-educated, urban, middle-class voters, but it was not limited to them; his support was ideologically heterogeneous, from voters on the left, center, and center-right, as well as geographically diverse (Moreno 2006). The PRI, in contrast, was increasingly dependent on older and rural voters, and its control of the corporatist vote had declined. The Fox voter was driven by a strong desire for democratic change, just as much of the opposition vote had been since the late 1980s. The appeal for change was eminently political, not economic. In fact, the Fox administration continued most of the economic policies of its PRI immediate predecessors. Without the PRI in the presidency, the 2006 race developed its own dynamics, putting the regime cleavage of the past aside. The PRI presidential candidate obtained less than 23% of the vote, well behind the two main contestants, who each won over 36%. The anti-PRI electorate split into different camps. Ideologically, the election represented a struggle of left against right, of state against market. The rising PAN-PRD competition also reflected an increasing divide based on socially conservative versus socially liberal political appeals. Geographically, election returns showed a pattern of regional division, with the PAN candidate winning in the industrial north and the heavily Catholic western states, and the PRD candidate winning in the central and southern states, the latter containing most of the country's population living in extreme poverty (see Joseph Klesner's article in this symposium). The candidates' rhetoric also fed the belief that the 2006 election was about class, about richer, middle-class voters who had savored the benefits of the North American Free Trade Agreement (NAFTA) versus poorer Mexicans who had been hitherto excluded from them. The trade agreement with the United States and Canada has indeed created divisions in Mexicans' policy preferences that translate into political support, to the extent that a NAFTA cleavage was more evident in 2006 than in any other national election in the 1990s. However, argument for a strong class cleavage finds less convincing evidence.
The PAN presidential candidate in 2000 won by calling for a change, but the PAN candidate in 2006 offered stability. The idea of change in 2000 was a political one, whereas the 2006 appeal for stability had an economic logic. The PAN campaigned against López Obrador, portraying him as a “danger to the country,” telling voters that his intentions to aid the poor with cash transfers would be financed by increasing the national debt. President Fox's own advertising reinforced the idea of stability by telling voters to “continue on this road” and that “we have to change the rider but not the horse.”1
Advertising by the Fox administration, and the president's own political statements during the campaign, became a controversial issue. The López Obrador campaign used it as a legal argument for a possible annulment of the election. In its ruling to validate the election, the Federal Electoral Tribunal (TRIFE) actually stated that, with no firm evidence that the president's statements and advertising influenced voters, Fox had nevertheless put the presidential contest in jeopardy (TRIFE 2006).
The Economy
During the first three years of the Fox administration, Mexico's economy was stagnant, averaging a growth rate close to zero for that period. This may have had its toll in the midterm election, when the PAN's share of the vote declined to 32%, from the 39% percent it had obtained in congressional elections three years earlier. However, the following years registered higher growth rates, and the average growth for the second half of Fox's term is projected to be slightly over 4%. According to exit polls conducted in both the 2000 and 2006 presidential elections by the newspaper Reforma,2
The exit polls were conducted at the national level, face to face, among 3,377 voters in 2000 and 5,815 in 2006. They are part of the survey data archives at Reforma.
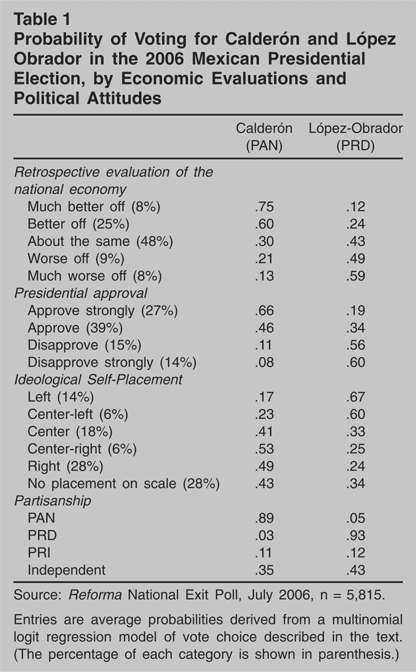
These assessments of the economy are, in fact, one of the strongest explanatory factors of presidential vote choice in 2006, when included in a multivariate model along with other common predictors of voting behavior (such as candidate image, presidential approval, partisanship, ideology, religion, region, and socioeconomic variables). Estimates derived from a multinomial logit regression model show that the probability of voting for Felipe Calderón among those who thought that the country's economy was much better off, other things being equal, is 0.75, and 0.60 among those who thought the economy was somewhat better off. In contrast, the probability of voting for López Obrador among those same groups is 0.12 and 0.24, respectively (see Table 1).
Probability of Voting for Calderón and López Obrador in the 2006 Mexican Presidential Election, by Economic Evaluations and Political Attitudes

In contrast, the PRD candidate had a clear advantage among voters who perceived economic deterioration: the probability of voting for him was 0.49 among those who thought the country's economy was somewhat worse off (as opposed to a 0.21 probability of voting for Calderón), and 0.59 among voters who said the economy was much worse off (and 0.13 for the PAN candidate). When considering assessments of the voters' personal financial situation, patterns of political support are very similar to those shown for evaluations of the national economy. The effect of sociotropic evaluations in 2006 was about the same as that for pocketbook evaluations.
Taken together, positive assessments of the national economy gave Felipe Calderón a 40-point advantage over López Obrador in that segment of the electorate, whereas negative economic evaluations gave the latter a 50-point advantage over the former. Of the usual predictors of vote choice, only party identification shows wider gaps in candidate support than these figures. The effect of economic assessments on the vote choice was stronger than that of presidential approval or ideology. Nonetheless, probabilities of voting for each candidate by ideological self-placement confirm that the 2006 race was a choice between the left and the right (see below).
Petropolitics
Oil is one of the most important aspects of Mexico's economic and political life, yet political scientists have largely ignored its weight on Mexican elections. A partial explanation for this is that the possible effects of oil-related issues are hard to portray in election surveys or other individual-level measures, and hence trying to establish a causal relationship between oil revenues—or other aspects of the oil industry—and election results in Mexico is a task that few, if any, have done. However, there are enough elements to argue that “petropolitics”—a term I will use vaguely to refer to the political use of oil resources—is crucial for understanding electoral dynamics in Mexico. This critical theme should be added to our research agenda.
High oil prices in 2005 and 2006 had at least two possible effects on the election. The first is related to a growing economy, as described in the previous section, and the second has to do with discretionary but legal political use of oil-related resources and, of course, surpluses. Here are some indicators. In 2001, the federal government estimated an average price per barrel of Mexican oil at $21.50 US (Quintana 2006). The price of West Texas Intermediate (WTI), a standard for Mexico's oil industry, rose to $50 US in March 2005, reaching $64 by August, $69 by April 2006, $71 in June (before the election), and $74.40 in July (right after the election). This created an unexpected surplus in oil revenues of close to $5.5 billion for the Fox government (or 62.8 billion pesos; see Sarabia 2006). On average, the oil price has been about $32.20 for the Fox administration compared to $16.90 for the six years of his predecessor, Ernesto Zedillo (Quintana 2006).
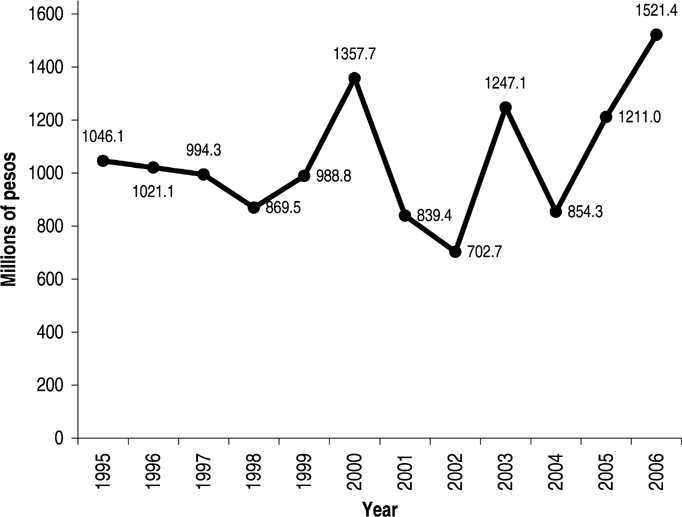
Additionally, data for 2006 reveal a pattern of donations and contributions made by Mexico's state-run oil company, PEMEX, which during election years since 2000 has increased its discretionary disbursements that go directly to beneficiaries in the states and municipalities (see Figure 1). According to journalists' reports, the main beneficiaries of these contributions are civic associations, schools, foundations, agricultural communities, fishing cooperatives, unions, and municipal governments (Barajas 2006). The transfer of oil resources has targeted certain states, possibly making petropolitics a selective use of pork-barrel politics.

An Electoral Oil Cycle: PEMEX Donations by Year
Source: PEMEX, “Informe de Rendici|fon de Cuentas,” Apartado XVII, Donativos y donaciones. www.pemex.com/index.cfm?action=content§ionID=10&catID=193. Converted to constant prices with 2006 as base. Also published in Reforma, October 11, 2006 (numbers calculated by the author using the original source vary slightly from the journalist report).
Note: The 2006 amount corresponds to the first semester only. National election years are 1997, 2000, 2003, and 2006.
In fact, most states that benefited from PEMEX donations in 2006 had PAN or PRI governments (Guanajuato, Tamaulipas, Veracruz, Coahuila, Hidalgo, Nuevo León, Oaxaca), but few had a PRD administration, such as Chiapas (Barajas 2006). This brings another piece to the electoral puzzle in 2006: regional divisions in Mexico show that, in several northern and western states (and also in Yucatán), the PAN candidate competed mainly against the PRI, while the PRD candidate competed mainly against the PRI in several southern states. In 14 of 32 states, PRI was the second political force, and in three more states it was a close third. The other 15 states saw direct confrontations between the PRD and the PAN. Generally, the PAN candidate had to defeat the PRI in the north, but, at the same time, had to rely on a strong PRI that could defeat the PRD in the south (see Klesner's contribution to this symposium).
Ideology and Class
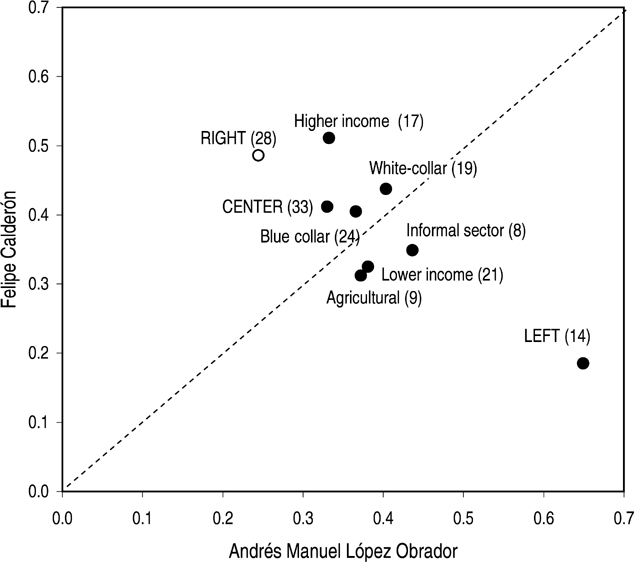
As mentioned above, the 2006 presidential race was a true confrontation of left against right at the national level. Voters self-identified as on the left voted disproportionately for López Obrador, while Felipe Calderón had his best performance among center-right voters, according to exit poll results. However, the effects of class were not as strong as those observed for ideological identities. Income had a more significant effect on the vote than occupation, but such an effect is relatively small if compared to the one produced by ideology (see Figure 2) or by assessments of the national economy (as previously shown in Table 1). Higher-income voters were more likely to vote for Calderón, and lower-income voters for López Obrador. However, political preferences amongst the great majority of voters at the intermediate income levels were almost indistinguishable.

Electoral Coalitions in 2006: Probability of Voting for Each Candidate by Left-Right Self-Placement and Class Indicators
Source: Reforma National Exit Poll, July 2006, n = 5,815.
Entries are average probabilities derived from a multinomial logit regression model of vote choice described in the text. (The percentage of each category is shown in parenthesis.)
Both white-collar and blue-collar voters split almost evenly between PAN and PRD candidates, with a slight bias toward the former. In contrast, Mexicans employed in the informal or the agricultural sectors were slightly more likely to vote for López Obrador than for the PAN candidate, although the difference is not substantial. The voting advantage in favor of Calderón among rightist voters is 24 points, and it is 46 points in favor of López Obrador among leftist voters. In contrast, occupational categories only show single-digit differences in favor of one candidate over the other. For example, the Calderón advantage is 3 and 4 points among white-collar and blue-collar voters, respectively. The highest income level included in the analysis (representing 17% of the sample) shows an 18-point Calderón advantage, but the lowest income category only favors López Obrador by 6 points. The effects of class, in comparison to ideology, were small.
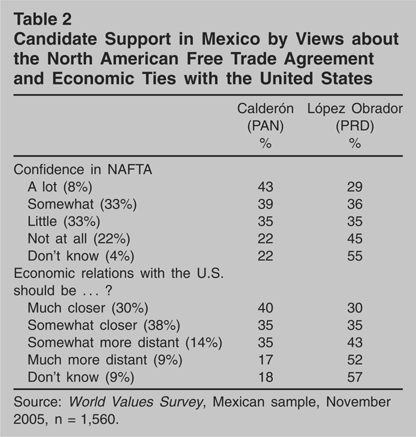
NAFTA is another source of political differentiation, but it is unclear, given the data at hand, whether this is so because of ideology or because of the performance and benefits of the trade agreement. Whatever the reason, confidence in NAFTA produced a modest but significant advantage for Calderón, whereas distrust yielded a 23-point difference in favor of the PRD candidate (see Table 2). This pro-López Obrador gap is accentuated among those who prefer that Mexico distance itself from its economic partner. As expected, those who prefer much closer economic ties to the United States were more likely to support Calderón.
Candidate Support in Mexico by Views about the North American Free Trade Agreement and Economic Ties with the United States

Discussion
Mexico's presidential election of 2006 was a first post-PRI-regime confrontation of left against right. Before the election campaign had even started, many analysts believed that a wave of victories by the left in Latin America would reach Mexico in 2006. A strong leftist candidate, López Obrador, who was leading in the polls for several months before the election, made that a reasonable expectation. López Obrador frequently used the word “hope,” both as mayor of Mexico City and as presidential candidate, when referring to his programs, his intentions, and himself. His image as a hard-working, austere man determined to help the poor at the expense of the rich was enhanced by the perceived injustice of his impeachment process months before the election. Nonetheless, this image suffered severe transformations during the campaign. PAN-sponsored attacks portrayed him as a “danger to the country,” a risk to economic stability, a return to Mexico's past of crisis, inflation, and debt. And they worked. The voters' assessments of the economy were a strong determinant of their vote choice. Positive economic evaluations gave the PAN candidate, Felipe Calderón, a boost in this tight race. Calderón ran a campaign based on the idea that Mexicans did not need government assistance but jobs, and that changing the country's policy direction only meant a turn back, not forward.
Campaigning for continuity, not for change, was a successful strategy only because, after being stagnant during the first three years of the Fox government, Mexico's economy started to grow again. And unexpectedly high oil prices helped significantly, giving the Fox administration considerable additional resources. Voters interviewed at the ballot place in 2006 perceived Mexico's economic condition to be in much better shape than voters did in 2000. It is likely that many of them were asking themselves: “Why change?” Perhaps López Obrador's voters thought retrospectively: “Fox's government of change has not delivered and the economy is worse, so let's throw the rascals out.” But Calderón's supporters may have thought prospectively: “Fox's accomplishments are modest but we are better off this way than with the left.” If true, this logic was not strongly anchored in class differences. Both white- and blue-collar voters split almost evenly amongst the two main presidential candidates. In contrast, ideology and economic expectations were more important than class. Pro-NAFTA Mexicans were more likely to vote for Calderón, and anti-NAFTA voters for López Obrador.
Economic conditions and oil prices help us understand the PAN's victory in 2006, but they also have important implications for the new government. Oil prices have started to decline, so the oil bonanza is less likely to continue into the next administration. In addition, oil exports have fallen significantly in the months following the election. Recent reports show a decrease of 5.5% in oil sales between August and September 2006—equivalent to a 22% decrease in PEMEX income (Vela 2006). As candidate, Felipe Calderón benefited from the oil boom, but as president he will face another, less favorable, reality. Frustrated reforms like the fiscal one discussed in Congress when he was a congressional leader, or the energy reform neglected by Congress when he was secretary of energy, seem even more urgent now that he has been elected president.