Nomenclature
- c
-
Chord length, m
-
 $\beta$
-
Collection efficiency, dimensionless
- f
-
Freezing fraction, dimensionless
- h
-
Ice thickness, m
- LWC
-
Liquid water content, Kg/
${{\rm{m}}^3}$
-
$\dot m$
-
Mass flow rate, Kg/s
-
$\dot e$
-
Energy flow rate, J/s
-
$\rho$
-
Density, Kg/
${{\rm{m}}^3}$
- T
-
Temperature, K
- S
-
Surface length, m
- t
-
Icing time, sec
- V
-
Free-stream velocity, m/s
- MVD
-
Median volume diameter, m
- Re
-
Reynolds number, dimensionless
- SLD
-
Super cooled droplets
-
$\mu$
-
Viscosity of air, Kg/ms
- AoA
-
Angle-of-attack, deg
- h c
-
Convective heat transfer coefficient, W/
${{\rm{m}}^2}$
K - Nu
-
Nusselt number, dimensionless
- K
-
Thermal conductivity, W/mK
- P
-
Static pressure, N/
${{\rm{m}}^2}$
- C p
-
Specific heat, J/Kg/K
- L f
-
Latent heat of fusion, J/Kg
- L v
-
Latent heat of vaporization, J/Kg
- C l
-
Coefficient of lift, dimensionless
- C d
-
Coefficient of drag, dimensionless


Subscripts
- com
-
Impinging water
- conv
-
Convection
- a
-
Air
- i
-
Ice
- ice
-
Freezing ice
- w
-
Liquid water
- in
-
Runback into the control volume
- out
-
Runback out of the control volume
- sur
-
Surface condition
- eva
-
Evaporation
- I
-
Control volume
1. Introduction
The widespread use of aircraft demands it to be able to fly in all situations and weather conditions. High altitude and long distant flight may be affected by severe meteorological conditions like wind, snow, liquid water content (LWC), rainfall, super cooled droplet (SLD) impingement etc. leading to the ice accumulation at different structural components. Ice accretion is considered to be one of the most critical causes of aircraft accidents and incidents. Accidents hazards due to icing mostly depend on the severity of icing, icing types, rate and amount of ice accumulation under varying meteorological conditions.
Thus, three major types of icing have been detected based on the aerodynamic measurements: (1) clear or glaze ice, (2) rime ice and (3) mixed ice [Reference Politovich1]. When an aircraft flies in presence of cumuliform clouds with high concentration of SLDs, small part of the droplets freezes on impact forming clear or glaze ice on the unprotected parts of the aircraft like wing and tail surfaces, propeller blades and antennas. Rime ice is formed when the aircraft flies through stratified form of clouds having a low catch rate of SLDs; the droplets freeze quickly and completely without spreading and accumulate on the leading edge of wings, antennas and pitot heads [Reference Amintabar2]. Mixed ice having the properties of both glaze and rime ice is formed in presence of cumuliform clouds embedded with strati-form cloud when air is concentrated with both small and large SLDs. The rate of ice accumulated on aircraft structure is affected by the shape of aircraft structure, collection efficiency (β), freezing fraction, time of ice accretion, aircraft surface temperature, airspeed and meteorological factors like LWC, droplet size, atmospheric temperature [Reference Mortensen3], types of clouds and precipitation [Reference Heinrich, Ross, Zumwalt, Provorse and Padmanabhan4]. Any type of icing on aircraft structure leads to a loss in lift, increase in drag, early stall as well as stability and control characteristics of aircraft [Reference Shinkafi5]. Research activities on aircraft icing to minimise the hazards due to icing accidents had started from the late 1920s and early 1930s but extensive experimental research using wind tunnel had started just after the Second World War. The earliest recorded experiential studies on in-flight icing were carried out by Gulick [Reference Gulick6] as he tested a 6-aspect ratio wing in the Langley Full-Scale Tunnel with leading edge ice roughness. He had measured a 25% reduction in maximum lift and a 90% increase in drag for the tested icing conditions. Gray [Reference Gray and Von Glahn7] conducted a series of experiments where ice was accreted under fully controlled conditions. By the mid-90s numerous experimental studies had been carried out to examine the case of an aerofoil with a large glaze ice shape and the fundamentals of the flow field with its large separation region were recorded. Kerho and Bragg [Reference Bragg and Kerho8] performed a very detail study on hot-wire boundary-layer development by simulating the early characteristics of leading-edge ice accretion on an aerofoil. A major achievement in ice aerodynamics research was the consideration of various aerofoil sections for a better understanding of aerofoil geometry on aerodynamic performance. Anderson et al. evaluated and validated the freezing fraction, one of the very important non-dimensional parameters in calculating leading edge ice accretion defined by the heat balance analysis of Messinger [Reference Anderson and Tsao9]. A low-speed, low-turbulence wind tunnel test was carried out by Broeren et al. [Reference Broeren and Bragg10] to evaluate the performance effects of inter cycle icing on three different aerofoil sections. Results from the aerofoil tests closely matched with those from a previous study, validating the ice-shape simulation method. This also showed that a simple geometric (chord-based) scaling of the ice was appropriate for icing analysis.
Early analytical research basically focused on the calculations of the flow field around the ice horns and performance of the aerofoil. Langmuir and Blodgett [Reference Langmuir and Blodgett11] used differential analyser to calculate the trajectories of small water droplets moving at high velocities around a cylinder. Messenger [Reference Messinger12] did a complete analysis of temperature of an unheated surface for varying regimes (32°F, below and above 32°F) in icing conditions as a function of ambient temperature, air speed, altitude and LWC. Though a number of parameters had been identified which play significant role in determining ice shape, only a few studies had attempted to determine how closely these parameters affect the ice shape. Anderson et al. [Reference Anderson13] had examined the physics of icing and had made a significant study of these parameters in icing scaling. A numerical ice accretion model with new improvements was developed by Fortin et al. [Reference Fortin, Laforte and Beisswenger14] by combining thermodynamic, roughness and mass model and the model had shown better agreement with experimental results. Yee et al. [Reference Son, Oh and Yee15] had presented an analysis code consisted of Messinger’s model and aerodynamic solver that employed the panel method and boundary layer theory for analysing icing behaviour under rime ice and glaze ice conditions. Zhang et al. [Reference Zhang, Min and Wu16] in 2016 proposed that aircraft icing has two modes, i.e. dry mode and wet mode as the previous models had addressed icing properties as constant. A significant drawback of this model was that they did not consider runback water effect, which was eventually considered in their next PVRI- RW model [Reference Zhang, Min and Wu17].
Navier-Stokes equation based computational fluid dynamics (CFD) method which can describe the aerodynamics of iced aerofoil and wings by analysing the flow field has become a powerful tool for the prediction of ice shapes and optimisation and simulation of the ice protection system. Ice code termed as LEWICE was developed at NASA Lewis to predict the ice growth for any aircraft under any meteorological conditions. Wright validated the LEWICE 2.0 code with experimental data from NASA IRT [Reference Bright18]. The LEWICE 2.0 data had showed only 7.20% variation from the experimental data for over 100 ice shapes. Yung and Mary [Reference Choo, Vickerman, Lee and Thompson19] had addressed two identical software named ICEG2D and Smagg Ice for the simulation of ice accretion and icing effects on aerodynamic performance. Habashi et al. [Reference Beaugendre, Morency and Habashi20] had developed a second-generation code named FENSAP-ICE for simulation of in-flight icing on simple or complex 3D geometries which can determine impingement and accretion for each flow via filed models based on partial differential equations (PDEs). Croce et al. [Reference Croce, Habashi, Munzar and Baruzzi21] had numerically predicted the time and space evolution of roughness of ice-growth by the use of phenomenological and quantitative data embedded in FENSAP-ICE. Bragg et al. [Reference Bragg, Broeren, Addy, Potapczuk, Guffond and Montreuil22] had briefly described LEWICE and ONICE computational ice accretion method to guide the experiments. CFD method had been used by Tabatabaei et al. [Reference Tabatabaei, Cervantes, Trivedi and Aidanpää23] for studying the effects of “critical ice accretion” on the aerodynamic properties of ice profiles to validate the LEWICE method through available experimental data. Study was carried out by Hanson and Kinzel [Reference Hanson and Kinzel24] on LEWICE coupled with CFD using discrete-element roughness method (DERM). Comparisons were made between SGR-LEWICE and DERM-LEWICE and the results indicate that DERM model gives improved prediction of ice roughness. A recent study was carried out by Anthony and Habashi [Reference Anthony and Habashi25] for studying the trajectory of ice on helicopter rotor in forward flight. They had suggested an inexpensive computational method, which can act as a natural de-icing mechanism.
The above literature review summarises that though numerous experimental, analytical and computational analysis had been carried out on ice accretion prediction and the aerodynamic penalties due to icing, very few data is available on real time ice-accretion under various cloud conditions and altitude variation. Moreover, much information about the effects of varying ambient conditions on a fixed geometry or the effects of varying geometry for specific conditions for efficient design of anti-icing and de-icing devices are not available. Hence the scope of the present research work aims at development of an analytical numerical model for investigating the effects of different parameters addressed previously in different literature on in-flight ice accretion. So, the objective of the study is to:
-
• Study the performance of NACA 2412 (base aerofoil) in dry condition by CFD analysis.
-
• Determine the leading-edge ice thickness and obtain the distorted aerofoil shape due to ice accretion of an NACA 2412 aerofoil based on the proposed numerical model.
-
• Analyse the performance of iced aerofoil against base aerofoil using CFD technique.
2. Proposed model
Present study approaches to the development of a numerical model for predicting icing behaviour on an NACA 2412 aerofoil to demonstrate the environmental effects and a CFD model for analysing the aerodynamic performance degradation of the iced aerofoil. As mentioned in various literatures, certain parameters affect the icing behaviour; this study considers free-stream velocity, freezing fraction and time of accretion as the prime parameters for varying ambient conditions.
2.1 Numerical model
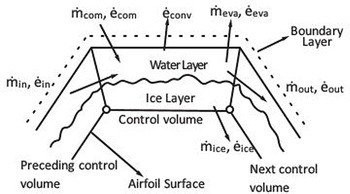
The proposed numerical model can determine the leading-edge ice thickness and successively find out the distorted aerofoil shape. Initially a control volume as Fig. 1 was considered onaerofoil surface to proceed with the model.
Mass and energy conservation within a control volume on aerofoil surface.

Within the control volume mass and energy are conserved as per the following equations [Reference Son, Oh and Yee15].
 \begin{align}{\dot m_{com}} + {\dot m_{in}} = {\dot m_{ice}} + {\dot m_{out}} + {\dot m_{eva}}\end{align}
 \begin{align}{\dot e_{com}} + {\dot e_{in}} = {\dot e_{ice}} + {\dot e_{out}} + {\dot e_{eva}} + {\dot e_{conv}}\end{align}
Where,
 ${\dot m_{com}}$
refers to the mass of impinging water that inflows onto the aerofoil surface.
 ${\dot m_{in}}$
is the mass of runback water towards the control volume that comes from the previous control volume.
 ${\dot m_{ice}}$
is the ice mass accreted on the surface.
 ${\dot m_{out}}$
is the runback water from the control volume under consideration.
 ${\dot m_{eva}}$
is the evaporated ice mass from the control volume.
Similarly, energy terms are applicable for the energy equations. All these terms in Equations (1) and (2) can be determined individually. As it is not possible to determine impinging water mass directly, it is calculated indirectly using collection efficiency [Reference da Silveira, Maliska and Estivamand Rafael Mendes26]. Where, collection efficiency is the ratio of perpendicular distance Δy between particles and distance ΔS on the surface where the impinging particles may stick Fig. 2.
Trajectory of the water droplet impinging on the surface (close up view).

Thus, the mass of liquid water impinging on the surface considering the particles are uniformly distributed in the air can be determined by the following equation.
 \begin{align}{\dot m_{com}} = \beta .LWC.{V_\infty }.\Delta S\end{align}
Where,
 ${V_\infty }$
is the free stream air velocity.
 $\beta = \frac{{{\rm{\Delta }}y}}{{{\rm{\Delta }}S}}$
is termed as the collection efficiency or ice accumulation rate or catch rate on the surface.
 $LWC$
is the liquid water content in the air, which depends on the temperature condition and cloud type.
As the calculation started the initial
 ${\dot m_{in}}$
is considered to be zero as there is no previous control volume to transfer mass. Evaporated water mass can be determined as per the following equation as it is the function of surface temperature [Reference Ozgen and Cambek27].
 \begin{align}{\dot m_{eva}} = \frac{{0.7}}{{{C_{Pa}}}}{h_c}\left( {\frac{{{P_{v,sur}} - {P_{v,\infty }}}}{{{P_\infty }}}} \right)\end{align}
Where,
 ${C_{Pa}}$
is the specific heat of air.
 ${h_c}$
is the convective heat transfer coefficient and it can be determined from the Nusselt number according to the following equation [Reference Anderson and Tsao9].
 \begin{align}{h_c} = \frac{{{k_a}{N_u}}}{d}\end{align}
Where, d measures the leading-edge diameter of the aerofoil. The stagnation line heat transfer coefficients of an NACA 0012 aerofoil were measured by Poinsatte [Reference Poinsatte28] at the IRT using the chord length as the characteristic length. In this study leading edge diameter of the aerofoil was considered as the characteristic length to cope up with the practice and Poinsatte expression can be re-written as per the following equation.
At 0° AoA,
 \begin{align}{N_u} = 1.10{R_e}^{0.472}\end{align}
Where,
 ${P_{v,sur}}$
and
 ${P_{v,\infty }}$
are the vapour pressure at the ice or water surface respectively for ambient air and can be computed from the following equations(Reference da Silveira, Maliska and Estivamand Rafael Mendes26).
 \begin{align}{P_{v,}} = 3386(0.0039 + 6.8096 \times {10^{ - 6}}{\bar T^2} + 3.5579 \times {10^{ - 7}}{\bar T^3})\end{align}
 \begin{align}\bar T = 72 + 1.8\left( {T - 273.15} \right)\end{align}
Ice mass and runback water mass can be determined using the freezing fraction which is the ratio of the freezing ice mass to the total ice mass as studied by Messinger [Reference Son, Oh and Yee15].
 \begin{align}f = \frac{{{{\dot m}_{ice}}}}{{{{\dot m}_{com}} + {{\dot m}_{in}}}}\end{align}
 \begin{align}{\dot m_{ice}} = f\left( {{{\dot m}_{com}} + {{\dot m}_{in}}} \right)\end{align}
 \begin{align}{\dot m_{out}} = \left( {1 - f} \right)\left( {{{\dot m}_{com{\rm{\;\;}}}} + {{\dot m}_{in}}} \right) - {\dot m_{eva}}\end{align}
From the energy conservation Equation (2), the energies coming from the air which is adjacent to the control volume and moves to the next control volume can be calculated using the following equations.
 \begin{align}{\dot e_{com}} = {\dot m_{com}}\left[\!\left( {{T_{sur}} - {T_i}} \right)\frac{{{V_\infty }^2}}{2}\right]\end{align}
 \begin{align}{\dot e_{in}} = {\dot m_{in}}\left[{c_{p,w}}\left( {{T_{sur\left( {I - 1} \right)}} - {T_i}} \right)\right]\end{align}
 \begin{align}{\dot e_{eva}} = {\dot m_{eva}}{[_{}}{c_{p,w}}\left( {{T_{sur}} - {T_i}} \right) + {L_v}]\end{align}
 \begin{align}{\dot e_{conv}} = {h_c}{[_{}}{T_{sur}} - \left( {{T_e} + \frac{{{r_h}{V_\infty }^2}}{{2{c_{p,a}}}}} \right)]\Delta S\end{align}
 \begin{align}{\dot e_{ice}} = {\dot m_{ice}}{[_{}}{c_{p,i}}\left( {{T_{sur}} - {T_e}} \right) - {L_f}]\end{align}
 \begin{align}{\dot e_{out}} = {\dot m_{out}}{[_{}}{c_{p,w}}\left( {{T_{sur}} - {T_i}} \right)\!]\end{align}
Where,
 ${c_{p,w}}$
and
 $\;{c_{p,i}}$
are the specific heat of water and ice, respectively [Reference Touloukian, Liley and Saxena29].
 ${L_{f}}$
and
 ${L_v}$
are the latent heat of fusion of ice and latent heat of evaporation of water, respectively.
While proceeding for the calculation all the terms of Equation (1) are substituted in Equation (2). The constant term values are obtained from the ambient conditions [30]. Thus, the final equation is left with only two unknown terms, surface temperature
 ${T_{sur}}$
and the freezing fraction, f. Finally, these two quantities are now calculated using an iterative process.
For initial iteration, the surface temperature is considered to be at 273.15K (freezing point) and freezing fraction f is calculated. If f< 0, it implies that the surface temperature is greater than freezing point, so f is set to be 0 and
 ${T_{sur}}$
is recalculated. On the other hand, if f >1, it means the
 ${T_{sur}}$
is less than 273.15K, so f is set to be 1 and
 ${T_{sur}}$
is calculated again. If two successive iterations give the
 ${T_{sur}}$
value close to each other, then only
 ${T_{sur}}$
and f are known and
 ${\dot m_{ice}}$
, are found using equations 1, 3, 4, 10 and 11 for each of the control volume.
Next step in the process is the calculation of the height of ice thickness for each surface panel of length
 $\Delta S$
. Height of ice growth on each surface panel is calculated based on the ice mass calculated in the previous step during a small-time interval Δt, using the following equation [Reference Son, Oh and Yee15].
 \begin{align}h = \frac{{{{\dot m}_{ice}}.\Delta t}}{{{\rho _{ice}}.\Delta S}}\end{align}
Where,
 ${\rho _{ice}}$
is the density of ice.
Assuming that ice grows only in the perpendicular direction to the aerofoil surface, these ice growth heights are added normal to the surface panels to produce a new profile. The ice growth becomes more as the time interval increases, and thus distorted aerofoil shape is generated due to ice accretion.
2.2 Computational fluid dynamics (CFD) model
An efficient design of aircraft anti-icing and de-icing devices and certificate of airworthiness requires the prediction of in-flight ice thickness and aerodynamic performance in varying ambient conditions. CFD offers the advantage of low cost and the ability to simulate realistic conditions. But the accuracy depends on the quality of the grid system [Reference Chi and Slater31] in resolving the geometry and hence a mesh validation was done comparing the experimental results for the proposed model. In this section advantages and disadvantages of various turbulence models are described and reasons for selecting k-
 $\varepsilon$
model for the present study are identified [Reference Shelil32, Reference Wilcox33].
-
(1) RANS Single equation model: SpalartAllamaras
If we want to observe the flow around an aerofoil or aircraft, Spalart Allamaras would be a great choice because it is well known and tested for this sort of application. but if we want to design further and determine the angle-of-attack at which the aircraft stall, it would be no longer a good choice.
-
(2) RANS two equation model:
-
(a) Standard k-
$\varepsilon$
modelThe standard k-
$\varepsilon$
model is based on transport equations for the turbulence kinetic energy (k) and dissipation rate (
$\varepsilon$
). For deriving the k-
$\varepsilon$
the assumption is that the flow is fully turbulent and the effects of molecular viscosity are negligible. This model uses wall functions to analytically account for the fluid velocity in the viscous sub layer near the wall. This model offers good convergence and is not memory intensive and it is typically used for external flow with complex geometries.
-


-
(b) Realizable k-
$\varepsilon$
modelThis model modifies the equation for epsilon and introduces the effect of mean flow distortion on turbulent dissipation. The model has improved performance for planar surfaces, round jets, rotation, recirculation and streamlines curvature. It can improve the boundary layer under adverse pressure gradients but can not do a magic as it’s still based on turbulent viscosity.
-
(c) RNG k-
$\varepsilon$
modelResults from the updated RNG turbulence model produces lower turbulence levels and can underestimate the value of k but it offers little or no advantage over the realisable k-
$\varepsilon$
. So, the model is not convincible to use for complex geometries like ice accreted aerofoils. -
(d) Standard k-
$\omega$
modelIt is a popular two-equation model that pairs the k with specific rate of dissipation of kinetic energy (
$\omega$
). It can model near wall interactions accurately than k-
$\varepsilon$
models but has difficulty of convergence than k-
$\varepsilon$
model. The model is very sensitive to inlet boundary conditions, which is disadvantage of the model compared to the k-
$\varepsilon$
models. -
(e) SST k-
$\omega$
modelThis model is an enhancement of the original k-
$\omega$
model and addresses the issue of sensitivity of freestream turbulence levels. It has superior performance in simulating the boundary layers with adverse pressure gradients but the performance is not very different from the realisable k-
$\varepsilon$
model. -
(f) Reynolds Stress Model (RSM)
This is the most complete representation of physical turbulent flow. These models attempt to model the flow and terms directly in RANS equations. These models are based on six equations which represent turbulent stresses. These models can represent flow very well but are typically used for flows with extremely complex geometries or flows which have not been studied before because of their computational expense, sensitivity to initial conditions, amount of modeling and high-quality mesh requirement.
Both steady and unsteady Spalart Allamaras, shear-stress transport, RNG k-
$\varepsilon$
turbulence model was used by Y. Li et al. [Reference Chi and Li34] to predict the lift, drag and moment coefficients of a business jet aerofoil with rough and jagged rime ice and glaze ice in 2005 and it was reported that unsteady simulations did not provide better results whereas steady RANS, WIND and FLUENT simulations gave almost identical results for the same grid and order of accuracy. CFD solutions of NLF0414 and B575/767 aerofoil were generated with and without ice shape to demonstrate the developed model and grid by X. Chi et al. in 2002 for conditions like Mach number 0.29, T
s
= −5
$^{\circ}$
C, R
e
= 6.4 × 10⁶ with no-slip boundary conditions and no wall function [Reference Chi and Slater31]. Three different turbulence models as SpalartAllamaras, low Reynold number k-
$\varepsilon$
model and SST k-
$\omega$
model were explored by Kim et al. in 2013 [Reference Kim, Brown and Kreeger35] for aero-thermodynamic modeling of aircraft ice accretion phenomenon and they found acceptable correlation for all turbulence models at low angle-of-attack but there was noticeable differences in stall prediction and convergence to the steady-state among the three solvers. 2D numerical simulation study of DTU-LN221 aerofoil performance was studied by N. Shelil in 2020 [Reference Shelil32] using seven different CFD models such as RANS, Spalart Allmaras, standard k-
$\varepsilon$
, RNG k-
$\varepsilon$
, standard k-
$\omega$
, SST k-
$\omega$
and RSM and he reported that there was no general model that can be called the best over the range of study. Aerodynamic performance of NACA0012, NACA4412 and JOUKOWSKI (T = 12%) aerofoil, at various angle-of-attack (from 2 deg to 18 deg) and high Reynolds number were studied using realisable k-epsilon turbulence model and were compared with experimental results [Reference Jain and Mohammad36]. Results of the study identified that NACA 4412 gives better aerodynamic performance compared to NACA 0012 and JOUKOWSKI (T = 12%) aerofoil. Atmospheric ice accretion for different NACA series like NACA 0012, NACA 23012, NACA 643218 was studied by Talasila et al. [Reference Talasila and Ravi37] using a 2D model developed with solid works and the aerodynamic performance was investigated using standard k-
$\varepsilon$
CFD model. They did the study to determine the NACA series, which is more efficient and resistant to icing. Results of their study found that six-series NACA aerofoil gives better efficiency at icing conditions. N.A. Khan et al. computationally studied the performance of a three-blade rotor of diameter 0.5m in ANSYS fluent and reported that the two equations realisable k-
$\varepsilon$
turbulence model predicted the rates of round jets more accurately. Moreover, it has a great performance for flows involving separation, recirculation and boundary layer with strong adverse pressure gradient [Reference Khan and Islam38].


Studying the above literature and considering all advantages and disadvantages the CFD model used in this study is based on the RANS (Reynolds Average Navier Stoke) two-equation based standard k-
 $\varepsilon$
turbulence model for observing the flow filed around the aerofoil geometry. Much attention was given in producing a better grid system as the produced aerofoil shape was much complex than the base aerofoil. In the present study a 2D pressure-based (as it is used for small velocity up to 0.7M and in this study the maximum Mach number was 0.48M) turbulence model was considered.
-
(1) Governing equations
The motion of viscous fluid substances is described by the Navier-Stokes equation which is the governing equation of CFD. The continuity equation and momentum equation can be derived applying the mass and momentum conservation [Reference Zou39].
-
(a) Continuity equation
 \begin{align}\frac{{D\rho }}{{Dt}} + \rho \frac{{\partial {U_i}}}{{\partial {x_i}}} = 0\end{align}
-
(b) Momentum equation
 \begin{align}\rho \frac{{\partial {U_j}}}{{\partial t}} + \rho {U_i}\frac{{\partial {U_J}}}{{\partial {x_i}}} = - \frac{{\partial P}}{{\partial {x_j}}} - \frac{{\partial {\tau _{ij}}}}{{\partial {x_i}}} + \rho gj\end{align}
Where,
1st term: Local change with time
2nd term: Momentum convection
3rd term: Surface force
4th term: Molecular-dependent momentum exchange (diffusion)
5th term: Mass force
And
 \begin{align}{\tau _{ij}} = -{{ {\rm{\mu }}\left( {\dfrac{{\partial {U_j}}}{{\partial {x_i}}} + \dfrac{{\partial {U_i}}}{{\partial j}}} \right) + 2/3{\delta _{ij}}\mu \dfrac{{\partial {U_k}}}{{\partial {x_k}}}}}\end{align}
For the purpose of simplification, the Navier-Stokes equations is
 \begin{align}\frac{{\partial \left( {\rho \varphi } \right)}}{{\partial t}} + \frac{\partial }{{\partial {x_i}}}\left( {\rho {U_{i}}\varphi - {{\rm{\Gamma }}_\varphi }\frac{{\partial \varphi }}{{\partial {x_i}}}} \right) = {q_\varphi }\end{align}
-
(2) Assumptions
For the CFD simulations using the standard k-
 $\varepsilon$
turbulence model following assumptions were made:
-
(a) The flow is fully turbulent and the effects of molecular viscosity are negligible.
-
(b) Standard atmospheric pressure of 1.225atms was considered in order to make the wake effect zero.
-
(c) 6th order of accuracy O(6) was considered for the computation.
(23)
\begin{align}{\varepsilon ^n}^{ + 1}-{\varepsilon ^n} \lt = {10^{ - 6}}\end{align}
-
(d) Standard wall function was considered.
-
(e) No slip boundary conditions were considered with roughness height = 0 and roughness constant = 0.5
-
(f) SIMPLE and 2nd order upwind solution method was utilised for the solution.

-
(3) Geometry
Figure 3.2D aerofoil geometry with a selected C domain.

For the CFD computation the fluid domain has been selected by exhausting the periphery of the flow field. A 2D aerofoil geometry was considered with a C domain which is extended up to 12.5C at the radius and 25C (C is the chord of the aerofoil) from the aerofoil trailing edge to observe the flow at the vicinity and far away from the aerofoil as shown in Fig. 3.
-
(4) Mesh
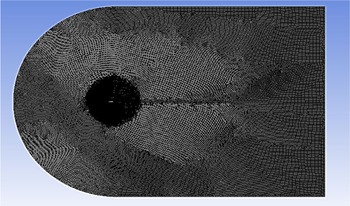
Figure 4.Generated unstructured mesh in the computational C domain.
Figure 5.Inflation layers around the edges of the iced aerofoil (asymmetric NACA 2412 aerofoil).
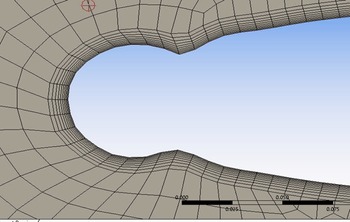
Figure 6.Close up view of the inflation layers around the edges (asymmetric NACA 2412 aerofoil).


The fluid domain was discretised into smaller elements based on a specific size. The unstructured mesh was applied in the fluid domain for better accuracy as the iced aerofoil has a complex geometry. A fine mesh was obtained with a total of 96,247 elements and 96,899 nodes with minimum and maximum cell sizes 0.00657 and 0.50m, respectively. The appropriate number of nodes can be determined by increasing the number of nodes so that further refinement does not change the results. So, a mesh validation was done and described in section IIIC of the present study to observe the effect of mesh quality. A body of influence with radius 3m, element size 5e-002m and local minimum size of 6.57e-003m was considered around the aerofoil. Smooth transition inflation was applied with maximum 10 layers, transition ratio of 0.272 and growth rate 1.2 for greater accuracy and better flow visualisation. The overall mesh and close-up mesh with inflation layer used for CFD study are presented in Figs. 4, 5 and 6, respectively.
-
(5) Boundary conditions
Figure 7.Selection of domain and boundary conditions for the computational analysis.
Table 1.Selected boundary conditions for ANSYS implementation


For the flow domain the applied boundary conditions are represented by Fig. 7 where the inlet velocity with free stream velocity is specified as inlet boundary and the x and y component of velocity is determined using the angle-of-attack. The upper and lower extents of the domain are termed as velocity inlet boundary conditions. A wall boundary condition is applied to the aerofoil and any ice accreted on aerofoil leading edge where no-slip boundary condition is applied and pressure outlet boundary condition is applied to the outlet presented by Table 1.
3. Validation
As very few 3D studies have been done with iced aerofoil, there are limited information available for 3D iced surfaces. Moreover, when 3D simulations are done with 3D ice shapes importance is given on qualitative features of the flow. As results, most of the simulations that focuses on the iced aerofoil aerodynamics has assumed the flow to be 2D and steady. Also, the generation of the performance curves like coefficient of lift/drag vs angle-of-attack requires many simulations which has made the 3D simulations not only expensive but also time consuming. Effect of the ice shapes on aerofoil aerodynamics with 2D simulations has been reported by many investigators where they found study of 2D steady flow is reasonable except for near wall where the flow may become unsteady. Validation of these studies was done comparing with the experimental results obtained from the wind tunnel tests. Results of these studies show that reasonable agreement can be obtained with 2D flow for the cases where ice shape doesn’t protrude too much. Considering the computational cost and timing a 2D simulation was done for the present study. As for simple 2D aerofoil geometry, much greater rigor is generally expected from verification and validation processes; the proposed ice accretion model and aerodynamic performance degradation were compared with experimental and computational results from other literatures for symmetric aerofoil and asymmetric aerofoils.
3.1 Ice accretion model validation
3.1.1 Validation for symmetric aerofoil
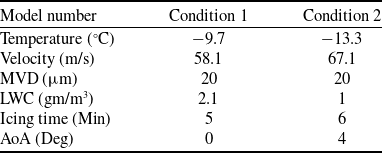
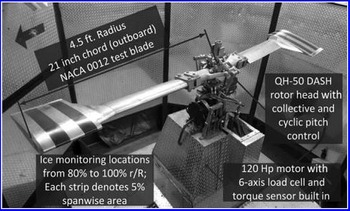
An experimental study was carried out by Hans and Palacios [Reference Hans and Palacios40] over an NACA 0012 aerofoil where two blade configurations of helicopter rotor were considered. Varying LWC, icing time, temperature and density ice accretion was considered over blades having a diameter of 2.7m and chord length of 0.533m presented by Fig. 8 and rotor rpm was varied between 200 to 1,200rpm. The temperature was maintained constantly between 0°C to −25°C inside a cold chamber at the test facility. The proposed ice accretion model had considered the following two experimental conditions for an NACA 0012 aerofoil as mentioned by Hans and Palacios [Reference Hans and Palacios40] listed in Table 2.
Figures 9 and 10 represent the comparison of the generated ice accreted aerofoil using the proposed numerical model with the experimental ice profiles for the above conditions. Though the numerically generated ice thickness almost appears to be the same with the experimental one, the leading-edge ice accretion for the proposed numerical model shows a slight deviation from the experimental ice shape referred from the open literature, which measures 6.26% and 3.89% for icing conditions 1 and 2 respectively at the stagnation point presented by Table 3.
Icing conditions for the ice-shape models mentioned in Ref. [30].

Rotor-icing-test stand with the test blade of the experimental set up from reference literature [30].

Test Condition 1: Comparison between experimental ice shape and numerical ice shape from proposed method for symmetric aerofoil.

Test Condition 2: Comparison between experimental ice shape and numerical ice shape from proposed method for symmetric aerofoil.

3.1.2. Validation for asymmetric aerofoil
Ice accretion and aerodynamic performance analysis of a NACA 5-digit asymmetric aerofoil was validated with the experimental results studied by Lee et al. [Reference Lee and Addy41] in 2016 on a 2D NACA 23012 aerofoil (test conditions listed in Table 4) as a joint effort by NASA, ONERA and the university of Illionois. The objective of their research was to develop a data base for ice accretions on small-scale, large-scale 2D aerofoil and data base for the ice accretion effects on aerodynamics.
Figure 11 describes the comparison of the ice shape obtained from the present model with the experimental ice shape for a sub-scale model of NACA 23012 aerofoil referred by Lee [Reference Lee and Addy41]. Results of the study shows very close result for the stagnation point (4.51%) and at other points at the leading edge the difference was small. But significant deviation was observed at some other points where the numerical model overestimated the ice accumulation. However, as the model can estimate ice accretion close to the experimental data for symmetric aerofoil and ice thickness with minor difference for asymmetric (5-digit aerofoil), the model will be now applied to predict the ice accumulation over asymmetric (4-digit) aerofoil.
Ice-shapes comparison with the reference literature

IRT sub-scale model test conditions from Ref. [Reference Lee and Addy41].

Comparison between experimental ice shape and numerical ice shape from proposed method for asymmetric aerofoil.

3.2 Validation of the CFD model
3.2.1 For clean aerofoil (NACA 2412)
Shubham et al. in 2021 [Reference Shubham and Arnav42] had studied the performance of different asymmetric aerofoils NACA 2412, NACA 2414 and NACA 2415 for selecting the appropriate turbulence model for 2D simulation. They had investigated the aerodynamic performance of these aerofoils using standard k-
 $\varepsilon$
, standard k-
 $\omega$
, RST and transition k-kl-ω models (parameters of CFD model are listed in Table 5). Results of their study showed that the standard k-e model gives good efficiency for larger range of angle-of-attack (5–20 deg) while all other models had good efficiency from 2 to 5 deg only. So, the standard k-
 $\varepsilon$
CFD model utilised in this study was validated for NACA 2412 (which is our aerofoil of interest) and compared with this literature.
Parameters for validation of the CFD model with asymmetric aerofoil

Comparison of lift force as a function of angle-of-attack for the present CFD model and from reference literature.

Comparison of drag force as a function of angle-of-attack for the present CFD model and from reference literature.

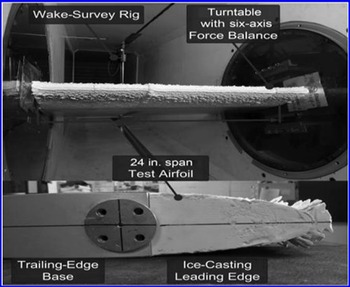
Wind-tunnel test section with aerofoil mounted for the experimental set up from reference literature [30].

Comparison of coefficient of Lift as a function of angle-of-attack for experimentally and numerically obtained ice shape with the base aerofoil.

Comparison of coefficient of drag as a function of angle-of-attack for experimentally and numerically obtained ice shape with the base aerofoil.

Dependency of mesh quality on the computational results.

Figures 12 and 13 describes the lift and drag force as a function of angle-of-attack for clean aerofoil (NACA 2412). From the graph of lift force for a range of angle-of-attacks from 0 deg to 22 deg shows that the present model shows only a small deviation at 8 deg angle-of-attack and at the stall angle-of-attack. For the present model the stall angle was 20 deg whereas for the reference literature stall angle was at 21 deg. The drag versus angle-of-attack graph shows almost similar nature except few places for both present model and reference literature. This validates that the present CFD model can be utilised for studying the aerodynamics of asymmetric iced aerofoil.
3.2.2 For iced aerofoil (NACA 0012)
The study carried out by Han and Palacios [Reference Hans and Palacios40] was extended for observing the aerodynamic degradation of the iced aerofoil by manually generating a poly Urythrene casting over the blades leading edge keeping exact match with the ice shape. With a test speed of 40m/s and Reynolds number 1.4 × 10⁶, the coefficient of lift and drag were plotted against angle-of-attack. The wind tunnel set up is represented in Fig. 14.
A comparison was made for condition 2 between the experimentally obtained coefficients of lift to computational data from the proposed model presented by Fig. 15. Both the cases had shown a reduction in coefficient of lift due to ice accretion compared to the base aerofoil and the converging simulated data with the experimental data proves the soundness of the proposed numerical model used in this study.
The study was further extended to the analysis of drag coefficient for both experimental data obtained from open literature and computational data from the proposed model presented by Fig. 16. The analysis had shown much similarity between the two data as it observes 90.21% and 89.81% increase in drag coefficient respectively from the base aerofoil. And such similarity illustrates the validity of the proposed numerical and computational model.
3.3. Mesh validation
With a view to observing the effect of mesh quality on the computational results, four different mesh qualities were considered. For a full scale of angle-of-attack, the lift coefficient was plotted and from Fig. 17, it was observed that with the increase of grid numbers, the lift curve almost converges to the experimental value. When an angle-of-attack of 16 deg was considered, it was observed that for mesh quality 2 and 4 the difference with the experimental result was minimum and was calculated as 3.09% and 3.035% respectively. Hence, for the proposed model, any one of the mesh qualities can be used. However, second grid numbers (96,000) were used throughout the study considering the computational time.
4. Problem specification
4.1 Solution
Ice accretion prediction and the aerodynamic effects of icing for symmetric aerofoils like NACA 0012 and NACA 0015 are widely available in the open literature both in form of experimental and numerical analysis. But much study on the asymmetric or cambered aerofoil had not been carried out to the best of author’s knowledge. But subsonic flight encompasses a pretty large range of airspeed/ airflow and NACA 2412 is a commonly used aerofoil for subsonic flight and the results are quite typical of aerofoil characteristics and it’s the simplest four-digit asymmetric aerofoil. Hence, in this study NACA 2412 was the chosen asymmetric aerofoil in order to observe the ice accretion phenomenon over cambered aerofoil. The main focus is to predict the ice accumulation over an asymmetric NACA 2412 (chord length of 1m) aerofoil and evaluate the aerodynamic performance degradation based on the aerofoil geometry, ambient conditions and flight conditions. Hence, it considers moderate to high altitude flights ranging from 10,000 to 25,000ft where air temperature varies from −10°C to −40°C and most of the icing phenomenon happens.
-
(1) Assumptions
To simplify the problem and ease of calculation the following assumptions were made:
-
(a) The freezing point of water and melting point of ice is the same.
-
(b) The aircraft surface or skin temperature is at freezing temperature for icing to be occurred.
-
(c) The analytical freezing fraction value ranges from 0.3 to 1.0 from Messinger’s heat balance analysis for effective ice accretion.
-
(d) Air flow around the aerofoil surface is considered to be turbulent and compressible.
-
(e) Ice accretion is considered for an aerofoil of a high-performance subsonic aircraft.
4.2 Analysis of icing parameters
For analysing the effect of each of the above-mentioned parameters, three reference cases were considered by changing each of the parameters at the same Reynolds number (Re = 6
 $ \times {10^{6{\rm{\;\;}}}})$
. For different cloud conditions, the parameters were selected from the established standards and experimental data available from open literature.
Ambient conditions for case I

-
(1) Case I
A high performance, subsonic aircraft moving at an airspeed of 122m/s within an altitude range of 12,700ft (3,898m approx.) through medium level Nimbostratus clouds [30]. At this altitude air contains a low amount of LWC, low catch rate but accumulation rate is higher as the air temperature is within −10°C. Other ambient conditions are listed in Table 6 according to the standard atmospheric chart (SI units).
As obtained from the standard atmospheric conditions, nimbostratus clouds have a horizontal coverage of several thousand feet (10–15NM) but small vertical coverage of about 3,000ft [43], flying within nimbostratus clouds will be affected by long duration of icing, which will result in rime ice accumulation. So, aircraft is supposed to be within icing clouds for about a duration of 227s (15NM/122m/s). Ice accumulation is calculated for the time duration and analytical freezing fraction values mentioned in Table 7.
-
(2) Case II
Icing duration and intensity case

Ambient conditions for case II

Icing duration and intensity case

The very particular aircraft is now considered to be at an altitude of 17,000ft (5,395m approx) with a higher airspeed of about 142m/s. At this altitude medium level altocumulus clouds exist, which have with high concentration of SLD, higher catch rate and high LWC. This causes the worst icing case but for a short duration as cumulus clouds have limited horizontal coverage but extended vertical coverage of several thousand feet. Other ambient conditions at this altitude are listed in Table 8.
As a single cumulus cell extend for a horizontal range of 2NM to maximum 6NM [43], with an airspeed of 142m/s the aircraft is supposed to be within icing cloud for a duration of 80s (6NM/142m/s) on an average. So, icing duration will be longer if the aircraft is to fly through a number of cumulus cells contributing to the most critical icing conditions. So, ice prediction time and freezing fraction values are considered as per Table 9.
-
(3) Case III
If the same aircraft is now considered to fly at a higher altitude range of 22,000ft (about 6,800m) where the air temperature is within −30°C to −40°C and icing threat is present due to the presence of cirrocumulus clouds (20,000ft to 40,000ft) containing high LWC and high catch rate contributing to the glaze ice or clear ice. According to the standard altitude chart other ambient conditions are enlisted in Table 10.
Ambient conditions for case III

As cumulus clouds usually have limited horizontal coverage (a single cumulus cell is extended up to 2–6NM), it covers a small duration of the flight time. So, icing time can be 56s (6NM/167m/s) to more. Hence, ice accretion prediction was made for the following freezing fractions and time durations of Table 11.
Icing duration and intensity case

4.3 Analysis of relative importance of form drag versus skin friction drag
Form drag on an aerodynamic body is due to the shape and size of the body. On the other hand, skin friction drag is more complicated and is related to the process of transition (when the laminar boundary layer becomes turbulent). A realistic drag analysis should always consider a mixed boundary layer. For a streamlined body like an aerofoil; almost 20% drag is form drag and 80% drag is from skin friction drag [Reference Anderson44]. Again, orientation of the body also has some effects on the relative proportions of the skin friction and pressure difference between the front and back portion. For a streamlined body like aerofoil; the drag is dominated by the skin friction drag.
The drag coefficient C d is sensitive to Reynolds number which is to be expected since both skin friction and flow separation are viscous effects. The skin friction drag coefficient is a combination of laminar skin friction drag coefficient over the forward part and turbulent skin friction drag coefficient over the remaining part. As a result, the boundary layer always starts from some distance from the leading edge and then transits to a turbulent boundary layer at some point downstream of the leading edge. A reasonable quantitative breakdown between the skin friction and form drag can be found in the results of Lombardi et al. [Reference Lombardi45]. Here using an accurate CFD technique at a Reynolds number 3×10⁶ they had calculated a total drag coefficient for NACA 0012 to be 0.00623 and a skin friction drag coefficient to be 0.00534, indicating that the form drag due to flow separation is 15% and this is reasonable as the skin friction is expected to be 80% and form drag is expected to be 20% of the total drag for a stream-lined body. However, at higher Reynolds number and hence higher velocity, increasing angle-of-attack and less streamlined body (adding some thickness, cambered or iced aerofoil) the transition point tends to move forward increasing the skin friction drag. On the contrary, as the body becomes less streamlined (more like a blunt body), the pressure drag becomes the dominant factor with the increase of angle-of-attack.
Assuming the aerofoil with a given surface (ice accretion-one of the factors that affect the location of transition) is in a flow at a free stream velocity V ∞, we can determine the location of transition point with the help of critical Reynolds number using the following equations [Reference Lee and Addy41].
 \begin{align}R{e_{{x_{cr}}}} = \frac{{{\rho _\infty }{V_\infty }{x_{cr}}}}{{{\mu _\infty }}}\end{align}
Where the assumption of critical Reynolds number = 500,000 is very conservative and more likely the actual value is closer to 1,000,000. If the velocity is increased, the transition point tends to move forward to the leading edge. The Reynolds number based on chord length is given by the following equation.
 \begin{align}R{e_c} = \frac{{{\rho _\infty }{V_\infty }c}}{{{\mu _\infty }}}\end{align}
Combining Equation (24) and (25) we can write that,
 \begin{align}\frac{{R{e_{{x_{cr}}}}}}{{R{e_c}}} = \frac{{{x_{cr}}}}{c}\end{align}
This location is the transition from the leading edge relative to the chord length. As the skin friction drag coefficient (c f ) is always based on this distance, we can measure it using the following equation [Reference Lee and Addy41].
 \begin{align}{C_f} = \frac{{{x_{cr}}}}{c}{\left( {{C_{f,1}}} \right)_{laminar}} + {\left( {{C_{f,c}}} \right)_{turbulent}} - \frac{{{x_{cr}}}}{c}{\left( {{C_{f,1}}} \right)_{turbulent}}\end{align}
 \begin{align} \textrm{or},\; {C_f} = \frac{{{x_{cr}}}}{c}\frac{{1.328}}{{\surd R{e_{{x_{cr}}}}}} + \frac{{0.74}}{{R{e_c}^{1/5}}} - \frac{{{x_{cr}}}}{c}\frac{{0.74}}{{R{e_{{x_{cr}}}}^{1/5}}}\end{align}
Taking into account both the surfaces of the aerofoil, the net skin friction drag coefficient will be
 \begin{align}{C_f}\left( {total} \right) = 2{C_f}\end{align}
The measured aerofoil drag coefficient C d includes both skin friction drag and pressure drag due to flow separation. So, the pressure drag coefficient can be obtained mathematically by subtracting the skin friction drag coefficient from the total drag coefficient.
5. Results and discussion
5.1 Ice thickness at the stagnation point for different cases
1. Case I

2. Case II

3. Case III

The mass rate of ice accretion on a structure is affected by various factors like shape of aircraft surface (aerofoil shape, leading edge radius and aerofoil symmetry), collection efficiency, freezing fraction, time of ice accretion, aerofoil surface temperature, airspeed and meteorological conditions like liquid water content (LWC), droplet size, atmospheric temperature etc [Reference Heinrich, Ross, Zumwalt, Provorse and Padmanabhan4]. In this study the obtained ice thickness was much greater than the reference ice shape of section 3.1 obtained from previous literature [30]. The reason of such differences lies in the selection of various parameters mentioned in Table 12.
Parametric differences between reference literature [30] and present study

5.2 Ice accretion for the worst cases
Using the proposed numerical model the worst cases of calculated leading edge ice thickness values are enlisted in Table 13.
The above results show the worst icing cases at the stagnation point in term of maximum thickness for freezing fraction value of 1 for each of the cases as the freezing fraction value was varied from 0.3 to 1.00. Though case II generated maximum (0.1282m) leading edge ice accretion at the stagnation point for maximum (700s) time of ice accretion, the free-stream velocity was maximum for case III (167m/s). Hence the time of ice accretion demonstrates a significant influence on aerofoil icing. Therefore, the ambient conditions like density of air, density of water, viscosity of air might have very small influence over ice accretion at the same Reynolds number.
Stagnation point ice thickness

Ice shape for case I (Re = 6
 $ \times {10^{6}})$
.

Ice shape for case II (Re = 6
 $ \times {10^{6}})$
.

Ice shape for case III (Re = 6
 $ \times {10^{6}})$
.

Figures 18, 19 and 20 reports that the ice shape accumulated on the NACA 2412 aerofoil resembles a circular shape which is different in shape than the reference literatures from Refs 30 and 43. The reasons lie in the fact that ice accumulation over aerofoil surfaces can be predicted through one layer mode or multi-layer mode. In one layer mode ice is predicted in one step through the entire duration of time which obviously overestimates the runback water and predicts the observed horns. The present study calculated ice thickness in multi-layer mode where time of ice accretion was divided into small segments. In this study, the height of ice growth for each surface panel of length
 $\Delta S$
. During a small time interval Δt, the height of ice growth on each surface panel is determined based on the ice mass calculated in the previous step. The flow- field, droplet trajectory calculations were repeated for each layer. This approach considered the effects of ice shapes on flow field trajectory and reflected the physics of the problem more realistically. The present model also treated the cases with varying ambient and flight conditions.
5.3 Aerodynamic performance analysis
The coefficient of lift and coefficient of drag of iced aerofoil was compared with the base aerofoil using the k-
 $\varepsilon$
turbulent model of CFD analysis and the following results were found.
1. Case I
From the above plot, the iced aerofoil shows a maximum 84.02% decrease in lift coefficient and 262% increase in drag coefficient at 6 deg angle-of-attack compared to the base aerofoil as shown by Figs. 21 and 22 respectively. And the maximum difference in ice thickness is 20% between upper and lower surface. The average increase in drag coefficient for the iced aerofoil is 158.28% compared to the base aedrofoil.
Coefficient of lift as a function of angle-of-attack for numerically obtained ice shape compared with the base aerofoil.

Coefficient of drag as a function of angle-of-attack for numerically obtained ice shape compared with the base aerofoil.

The lift curve shows a fall in coefficient of lift at 6 deg AoA, again a rise at 8 deg AoA and a fall at 10° AoA and then constant beyond 10° AoA. Such aerodynamic performance degradation of the iced aerofoil can be explained observing the velocity vector.
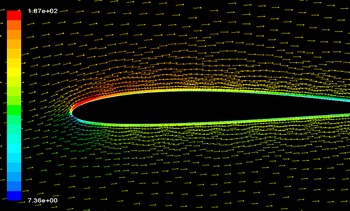
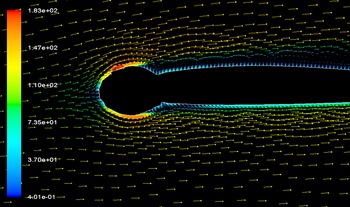
The velocity vector of Fig. 23 for base aerofoil shows still attached flow at 6 deg AoA generating more lift than drag. But the velocity vector of Fig. 24 for the iced aerofoil at 6 deg AoA shows a reverse flow at the ice accreted surface for both upper and lower surfaces causing the velocity to reach almost zero at the boundary layers. This reverse flow resulted in a very low lift coefficient and higher drag coefficient compared to the base aerofoil. This indicates that the aerofoil approaches to stall condition at only 6 deg AoA.
Velocity vector showing attached flow for base aerofoil at 6 deg AoA.

Velocity vector showing reverse flow for iced aerofoil at 6 deg AoA.

-
Form drag versus skin friction drag
An analysis of the skin friction drag and form drag for the icing condition of case I (velocity 122m/s) reveals the fact that for the base aerofoil of Figs. 25 and 26 and at lower angle-of-attack the drag was dominated by the skin friction drag which was about 65% of the total drag. And the skin friction drag tends to increase with the angle-of-attack but at a negligible amount whereas the form drag increases drastically as the body becomes less streamlined. At 16 deg angle-of-attack the drag was mostly form drag contributing 95% to the total drag.
Skin friction coefficient and form drag coefficient for with respect to the total drag coefficient for base aerofoil.

Relative percentage of the skin friction drag coefficient and form drag coefficient with he increase of angle-of-attack for base aerofoil.

Skin friction drag coefficient and form drag coefficient with respect to the total drag coefficient for iced aerofoil.

Relative percentage of the skin friction drag coefficient and form drag coefficient with the increase of angle-of-attack for iced aerofoil.

But the scenario was different for the iced aerofoil as can be seen from Figs. 27 and 28. As the surface roughness due to ice accretion gives rise to an early transition, the skin friction drag of the iced aerofoil (0.004287) was more compared to the base aerofoil (0.00410) but the total drag was dominated by the from drag (80.34% of the total drag) at zero deg angle-of-attack and it was due to the irregular size and shape of the iced aerofoil.
As the angle-of-attack increases the percentage of the skin friction drag to the total drag falls while the form drag increases rapidly.
2. Case II
The analysis of the results reports an average of 386.95% (Fig. 30) drag coefficient for the iced aerofoil compared to the clean one for the whole range of angle-of-attack. The analysis also reported that the lift coefficient falls to 89.713% (Fig. 29) of the clean aerofoil while the drag coefficient increased to 844% only at 2 deg angle-of-attack. However, the lift coefficient tends to increase again after 2 deg and showed the lowest possible degradation (reduction in lift coefficient is 77.42% and increase in drag coefficient was 199.77%.) at 10 deg angle-of-attack and finally the aircraft stalls at beyond 16 deg. Because due to flow separation at 2 deg angle-of-attack and reattachments beyond 2 deg.
Coefficient of lift as a function of angle-of-attack for numerically obtained ice shape compared with the base aerofoil.

Coefficient of drag as a function of angle-of-attack for numerically obtained ice shape compared with the base aerofoil.

Form drag versus skin friction drag
Skin friction coefficient and form drag coefficient for with respect to the total drag coefficient for base aerofoil.

Relative percentage of the skin friction drag coefficient and form drag coefficient with the increase of angle-of-attack for base aerofoil.

Skin friction coefficient and form drag coefficient for with respect to the total drag coefficient for iced aerofoil.

Relative percentage of the skin friction drag coefficient and form drag coefficient with the increase of angle-of-attack for iced aerofoil.

For case II (velocity 142m/s) the skin friction drag for both base aerofoil (at 4 deg AoA0.004508) and iced aerofoil (0.004514 at 4 deg AoA) represented by Figs. 31, 32, 33 and 34 respectively, was more than case I (0.0044 and 0.004506 respectively) because a higher angle-of-attack gives rise to an early transition increasing the skin friction drag.
Coefficient of lift as a function of angle-of-attack for numerically obtained ice shape compared with the base aerofoil.

Coefficient of drag as a function of angle-of-attack for numerically obtained ice shape compared with the base aerofoil.

Velocity vector showing flow separation for iced aerofoil at 4° AoA.

Skin friction coefficient and form drag coefficient for with respect to the total drag coefficient for base aerofoil.

Relative percentage of the skin friction drag coefficient and form drag coefficient with the increase of angle-of-attack for base aerofoil.

Skin friction coefficient and form drag coefficient for with respect to the total drag coefficient for iced aerofoil.

Relative percentage of the skin friction drag coefficient and form drag coefficient with the increase of angle-of-attack for iced aerofoil.

Comparison of skin friction drag as a function of angle-of-attack for three different icing intensities with different velocities.

Comparison of form drag as a function of angle-of-attack for three different icing intensities with different velocities.

For the iced aerofoil in this case with worst icing condition as described in section the drag was mostly form drag (93%–96% of the total drag) from the very beginning because of the large leading edge ice accumulation though the skin friction drag increases slightly with the angle-of-attack. The result of this study shows that the shape, size and orientation of the body has more effect on the total drag generated on an aerofoil.
3. Case III
From Fig. 35, the behaviour of iced aerofoil shows that the coefficient of lift falls only at 4° AoA as the region of high velocity separates from the aerofoil section, giving rise to the stall condition. However, for the iced aerofoil it increased again with angle-of-attack due to flow reattachment (Fig. 37) and again falls beyond 16° AoA. But the aerodynamic degradation of the iced aerofoil compared to the base aerofoil continued to be reducing with the increase in angle-of-attack as seen from Fig. 36.
Form drag versus skin friction drag
As can be seen from the Figs. 38 and 39, initially the drag was dominated by skin friction for the base aerofoil but as the angle-of-attack was increased pressure drag became prominent due to the orientation of the body. In terms of total percentage of drag skin friction drag yields only 6% of the total drag at maximum angle-of-attack and rest of the drag was generated due to the form drag.
For iced aerofoil of case III with a maximum velocity of 167m/s compared to case I and case II, the skin friction drag was the maximum at all angles of attack as seen from Fig. 40. At an angle-of-attack of 4 deg, skin friction drag was 0.004722, 0.004789 and 0.00493, respectively, for case I, II and III. As a total percentage of drag shown in Fig. 41 skin friction drag contributes to only 4.69% of the total drag at maximum angle-of-attack (18 deg) when the body becomes the less streamlined.
Figures 42 and 43 shows the comparison of skin friction drag and form drag for the three iced aerofoil. Results of the analysis show that with the increase of velocity the transition point moves forward giving rise to higher skin friction drag coefficient. Thus, ice case 3 with maximum velocity has the earliest transition and hence greater skin friction drag. Whereas case 2 is dominated by form drag mostly compared to case 1 and 3 because of highest ice accumulation and hence distorted aerofoil shape. Though the skin friction drag increases with angle-of-attack at higher angle-of-attack as the body becomes less streamlined drag is mostly dominated by the pressure drag for all three cases.
5.4 Applicable range and limitations of the proposed numerical model
-
a. By applying the present model a sensitivity analysis of roughness models can be made on the ice shape which is recommended for future extension of the present work.
-
b. As mentioned in various literatures, certain parameters affect the icing behaviour; this study considers free-stream velocity, freezing fraction and time of ice accretion as the prime parameters for varying ambient conditions. Effects of other parameters can be studied for further improvement of the model.
-
c. As it is not possible to determine impinging water mass directly, it is calculated indirectly using collection efficiency which is a major drawback of the current work.
-
d. Assuming that ice grows only in the perpendicular direction to the aerofoil surface, these ice growth heights are added normal to the surface panels to produce a new profile which is one of the limitations of the proposed method.
-
e. The present model calculates the ice thickness in multilayer mode that is unable to predict ice horn at different locations which can be obtained by one layer mode that overestimates the runback water and produce ice horns.
5.5 Limitations of the CFD model
-
a. A 3D simulations could have given better results than the 2D CFD study but at the cost of computational time and expenses.
-
b. RANS turbulence could have given better accuracy but it increases computational power and time.
-
c. The element size considered for the present CFD study was 8e−003m for meshing; a smaller element size would have given better accuracy.
-
d. Higher order of accuracy could be chosen for better CFD analysis.
-
e. As the k-epsilon model is based on average velocity concept, it can not produce turbulent wake.
-
f. The equation for in model, the k-epsilon model has the difficulty for solving epsilon, so it is postulated and that is why it is not the model with zero error.
-
g. Assessment and reduction of truncation error due to discretisation was neglected in the computational analysis.
6. Conclusions
The present work involves development of a numerical model to solve thermodynamic and conservation laws for prediction of ice accretion over NACA 2412 aerofoil under various flight conditions. The CFD analysis of the ice accreted aerofoil is undertaken to assess the variation of aerodynamic coefficients at varying angles of attack. The following conclusions can be drawn from the studies presented in preceding section.
-
(a) Comparison of the ice accreted aerofoil shapes for NACA 0012 aerofoil with the experimental shape available from open source shows a 6.26% and 3.895% difference for icing case I and II respectively at the stagnation point. Hence the validity of the proposed numerical model is established.
-
(b) For case I the maximum difference in ice thickness is 20% between upper and lower surface. So, leading edge ice accretion is more at the lower surface than at the upper surface for a positive cambered asymmetric aerofoil NACA 2412 while ice thickness is almost the same for both surfaces for symmetric NACA 0012 aerofoil.
-
(c) For the same Reynolds number, icing in altocumulus cloud is 50% more than nimbostratus cloud and 20% more than cirrocumulus cloud at the stagnation point. Hence icing might be most hazardous within altocumulus cloud having maximum amount of liquid water content.
-
(d) The angle-of-attack that provides the worst aerodynamic performance for each ice shape was also identified and it was reported that the aerodynamic performance deteriorated due to the combined effect of icing location and location of the transition point towards the leading edge.
-
(e) Observing the aerodynamic effect of the ice accreted aerofoil, icing caused the aerofoil to stall at only 2 deg angle-of-attack because of the large separated regions produced by the ice shape for case II with 89.7% reduction in lift coefficient and 844% increase in drag coefficient.
-
(f) Most dangerous and critical consequence of leading-edge icing is the increase in drag and for the worst icing case II it is almost 386.95% on an average compared to the base aerofoil.
-
(g) However, once ice is accreted on the aerofoil, it is observed that the icing effect on aerodynamic performance degradation is minimised by increasing the angle-of-attack. So increasing angle-of-attack might minimise the aerodynamic performance degradation of the iced aerofoil.
-
(h) The relative importance skin friction drag and form drag to the total drag acting on the clean and iced aerofoil was studied and the analysis of the results show that for clean aerofoil at low angles of attack total drag was dominated by skin friction drag (about 74%) but as the angle-of-attack increased about 95% of the drag was due to the pressure drag.
-
(i) As the velocity increases, transition point moves forward increasing the skin friction drag and it were maximum for the iced aerofoil for case III. At 16 deg angle-of-attack before the aerofoil stalls, the skin friction drag for case I, II and III were 0.12, 0.142 and 0.113, respectively.
-
(j) For the iced aerofoils form drag was more than the skin friction drag even at small angle of attacks. And this is due to the fact that ice accretion added some surface roughness and the aerofoil was less streamlined than the base aerofoil.
-
(k) Though the skin friction drag increases with angle-of-attack, total percentage of drag is dominated by form drag at higher angles of attack for both base and iced aerofoils.
Though most of the modern aircraft today are equipped with the anti-icing or de-icing devices, due to the high installation cost and weight issues, use of these devices are restricted to the small areas of the aircraft as well as for the limited duration of time. So an efficient design of these instruments requires an understanding of the ice accretion physics. The current study thus aimed at finding out some inputs for the efficient design of such devices and also to study the ice accretion behaviour for the unprotected surfaces of the aircraft for an additional safety requirement. Results found from such study will also help the pilot in pilot training on these devices and engineering evaluation of system failures due to in-flight ice accretion.
7. Recommendations for future work
Due to the lack of sufficient experimental facilities in terms of flight tests and icing wind tunnel set up a numerical study was carried out to understand the ice accretion and its effects on aerodynamic performance of aircraft wing cross section under various environmental conditions. However, the following recommendations are made to extend present research in future:
-
(a) A similar study could be carried out on other aerofoil section as well as the whole wing section.
-
(b) Though wind tunnels have high installations and maintenance costs, the aerodynamic performance analysis of the ice accreted aerofoil could be experimentally tested in a dry-air subsonic wind tunnel for better understanding of the aerodynamic performance degradation.
-
(c) Presently the study is undertaken where the ice accretion is de-linked with aerodynamic analysis. It is more prudent to undertake coupled icing/aerodynamic analysis using advanced tools.
-
(d) The developed code can be further modified to understand the influence of Reynolds number on the iced-aerofoil aerodynamics by considering varying Reynolds number.
-
(e) The present study could be extended to the detailed study on 3D aerofoil with realistic ice shapes.
-
(f) The developed code can be modified so that it can predict ice shape, ice masses and ice regions for a wide range of ambient Temperature, atmospheric conditions and geometries.
Acknowledgments
At the very outset, the author expresses her deepest gratitude and profound indebtedness to associate professor Wg Cdr Vikram Deshpande, PhD, department of Aeronautical Engineering, MIST, Dhaka for his continuous guidance, valuable suggestions and encouragement to the research work all through the time. The author is also thankful to the department of Aeronautical Engineering, MIST for providing the uninterrupted support all through the work. Finally the author would also like to express her sincere gratitude to Prof Dr. M A Taher Ali, department of Aeronautical Engineering, MIST for his valuable guidance for successful completion of the work.
Biographies
Mahbuba Ferdous (corresponding author) received her B.Sc in Aeronautical Engineering degree in 2015, M.Sc in Aeronautical Engineering degree in 2019 from Military Institute of Science and Technology (MIST), Dhaka, Bangladesh. She is currently an assistant professor in the department of Aeronautical Engineering, MIST. Her research interests include aerodynamics and computational fluid dynamics (CFD), aircraft guidance, control and navigation.
Professor Dr. MD Hossam-E-Haider received the B.Sc. degree in Electrical and Electronics Engineering from Dhaka University of Engineering & Technology (DUET), Gazipur, Bangladesh in 1990 and M.Sc. degree in Optical Fiber Communication from Bangladesh University of Engineering and Technology (BUET), Dhaka, Bangladesh in 2005. He completed his Ph.D. in Satellite Navigation from Beijing University of Aeronautics and Astronautics (BUAA) in 2000. His research area includes Satellite Navigation (GNSS), RADAR Engineering, Antenna Design, Optical Fiber Communication and Renewable Energy. He acted as a technical chair iCEEiCT 2014 & 2016, technical co-chair iCEEiCT 2015 and conference chair iCEEiCT 2021. He worked as coordinator of IEEE Bangladesh section in 2016 and also held the position of councilor of MIST IEEE Student Branch, Bangladesh up to 2020. He is an IEEE Senior Member. He belongs to member COMSOC, life time fellow of Institute of Engineers Bangladesh (IEB) and Bangladesh Electronic and Informatics Society (BEIS).