Implications
The current study has provided a temporal characterization of the impact of B6 deficiency and subsequent repletion on indices of sulphur amino acid metabolism in young pigs. The use of plasma and hepatic biomarkers, including pyridoxal-5′-phosphate (PLP) and thiol concentrations, appears to be appropriate for the assessment of vitamin B6 status, particularly under controlled settings. However, plasma PLP may serve as a better marker of vitamin B6 status, as compared to the thiols, in situations where the degree of control (i.e., free living subjects) is limited. The results do shed light on the sensitivity of plasma thiol concentrations to the degree of vitamin B6 deficiency and may help aid in the interpretation of the linkage between vitamin B6 status and plasma homocysteine concentrations in clinical settings. In particular, the results provide strong evidence that plasma homocysteine and cysteine are impacted by more severe levels of vitamin B6 deficiency, and that these perturbations are mediated by changes in the activity of key enzymes involved in their metabolism.
Introduction
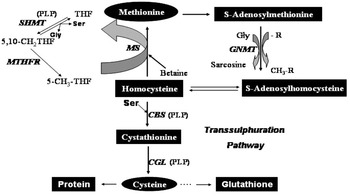
As depicted in Figure 1, the sulphur amino acid homocysteine stands at the intersection between the remethylation and transsulphuration pathways of methionine metabolism (Selhub, Reference Selhub1999). Pyridoxal-5′-phosphate (PLP), a major biological form of vitamin B6 in animal tissues, is a well established co-factor for the three enzymes directly involved in homocysteine disposition: cystathionine-β-synthase (CBS) and cystathionine-γ-lyase (CGL) are key PLP-dependent enzymes in the transsulphuration pathway, and serine hydroxymethyltransferase (SHMT) is a PLP-dependent enzyme important for the folate cycle and one carbon metabolism (House et al., Reference House, Jacobs, Stead, Brosnan and Brosnan1999). Vitamin B6 status and, therefore, nutritional supply are thus implicated in the regulation of homocysteine flux and overall sulphur amino acid metabolism (Smolin and Benevenga, Reference Smolin and Benevenga1982; Davis et al., Reference Davis, Scheer, Quinlivan, Coats, Stacpoole and Gregory2005; Lima et al., Reference Lima, Davis, Mackey, Scheer, Williamson and Gregory2006).
The methionine cycle. Abbreviations: SHMT = serine hydroxymethyltransferase; MTHFR = methylenetetrahydrofolate reductase; GNMT = glycine N-methyltransferase; CBS = cystathionine-β-synthase; CGL = cystathionine-γ-lyase; THF = tetrahydrofolate; Gly = glycine; Ser = serine and PLP = pyridoxal-5′-phosphate.

Over the last decade, interest in homocysteine metabolism has grown owing to the purported link between increased plasma concentrations and the risk for developing cardiovascular disease and stroke. As a clearer picture develops of the role that elevated homocysteine concentrations play in the risk for chronic disease development in humans, it is important not to lose sight of the fundamental importance of this amino acid in serving as the sole source of sulphur for the endogenous synthesis of cysteine. De novo synthesis of cysteine, through the transsulphuration pathway, represents the primary route for the oxidation of the carbon skeleton of methionine, and is therefore an important component in the control of plasma and tissue methionine levels (Blom et al., Reference Blom, Boers, Trijbels, van Roessel and Tangerman1989; Storch et al., Reference Storch, Wagner, Burke and Young1990; Stipanuk, Reference Stipanuk2004). Cysteine synthesis, besides being important for providing a substrate for protein synthesis, is crucial for the regulation of the availability of the biological antioxidant glutathione (Hunter and Grimble, Reference Hunter and Grimble1997), as well as other sulphur-containing compounds (e.g., taurine). Increased homocysteine and decreased cysteine concentrations induced by vitamin B6 deficiency have been documented in animal models, including pigs; however, the magnitude of the observed changes differs between studies. Due to the central importance of PLP as a co-factor for the enzymes of transsulphuration, the impact that vitamin B6 nutrition has on homocysteine and cysteine metabolism is warranted. To this end, two experiments were conducted to characterize the temporal changes in vitamin B6 status and biochemical measures of homocysteine metabolism, including the measurement of key enzyme activities, during the development of vitamin B6 deficiency and also during vitamin B6 repletion in young pigs.
Material and methods
Animals and feeding
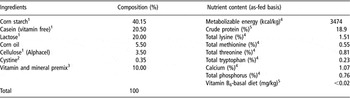
For Experiment 1, 12, 14-day-old weaned male piglets (initial body weight = 5.3 kg), cross-bred from a commercial line (Genesus line; Keystone Pig Advancement Inc, Oakville, MB, Canada) were delivered from the Glenlea Swine Research Unit, University of Manitoba to the T.K. Cheung Centre for Animal Science Research, Fort Garry Campus, University of Manitoba. Pigs were divided into two dietary treatments (n = 6 per treatment): (1) basal diet + 3.0 mg pyridoxine·HCl/kg diet (Control) and (2) basal diet + 0 mg pyridoxine·HCl/kg diet (Deficient). The semi-purified basal diet was formulated to meet or exceed the requirements for 5 to 10 kg pigs (NRC, 1998) and is presented in Table 1, together with calculated and analysed nutrient composition data. As indicated in Table 1, the basal diet was essentially devoid of vitamin B6 (<0.02 mg/kg). Analysis of the basal and treatment diets for vitamin B6 content, as measured via a microbial assay (Medallion Labs, Minneapolis, MN, USA), was used to confirm the integrity of the test article addition to the basal diet mixture. The powdered diet was mixed with water in a ratio of approximately three parts diet to one part water prior to feeding. A pair-feeding design was employed for this study to account for the potential confounding effect of feed intake on the biochemical measures of sulphur amino acid metabolism. All pigs were housed individually in pens with plastic-covered expanded metal flooring equipped with nipple water drinkers, individual feeders and stainless steel chains for enrichment. Pen partitions permitted visual contact with pigs in adjacent pens. Water was made available for ad libitum consumption. In order to avoid the confounding effect of weaning on initial feed intake, pigs were first adapted to the control diet (11 days) before implementation of the deficiency protocol. Pigs were maintained on the treatments for a total of 42 days, following the adaptation period. All experiments were approved by the University of Manitoba’s Institutional Protocol Management and Review Committee, in accordance with the guidelines established by the Canadian Council on Animal Care (1993).
Composition of the basal diet used in Experiments 1 and 2

1Ingredients purchased from Harlan Teklad, Madison, WI, USA.
2Purchased from Sigma Chemical Co., Oakville, ON, Canada.
3Provided (per kg diet): sodium, 2.4 g; chloride, 3.6 g; magnesium, 0.6 g; potassium, 4.2 g; copper, 9 mg; iron, 150 mg; manganese, 6 mg; zinc, 150 mg; iodine, 0.21 mg; selenium, 0.45 mg; vitamin A, 4400 IU; vitamin D3, 440 IU; vitamin E, 32 IU; vitamin K, 1 mg; biotin, 0.1 mg; choline, 1 g; folacin, 0.6 mg; niacin, 30 mg; pantothenic acid, 20 mg; riboflavin, 7 mg; thiamin, 2 mg; vitamin B12, 35 μg. When added, pyridoxine·HCl was used as a source of dietary vitamin B6.
4Calculated nutrient composition on the basis of the composition of purified ingredients.
5Analyzed nutrient composition: crude protein via LECO analysis; vitamin B6 via microbial analysis, Medallion Laboratories, Minneapolis, MN, USA.
For Experiment 2, 20, 14-day-old male piglets (initial body weight = 5.02 kg; same source and housing as indicated above) were maintained on the vitamin B6-deficient diet, under feeding conditions that permitted ad libitum consumption, and under housing conditions as described in Experiment 1, for 28 days (based on results from Experiment 1). Blood samples were collected for each pig, before and at the end of the depletion protocol. At the end of the depletion period, four pigs were killed for the establishment of baseline depletion conditions, and the remaining 16 animals were randomized to one of the four dietary treatments of vitamin B6 repletion (n = 4 per treatment): 0.75, 1.5, 2.25 or 3.0 mg/kg diet, as pyridoxine·HCl, to the vitamin B6-deficient diet. The duration of the dietary repletion period was 14 days. Pigs were permitted ad libitum consumption of feed in both the depletion and repletion periods in Experiment 2.
Experimental procedures
Feed intake was recorded on a daily basis. Prior to each sampling period, feed was withdrawn 16 h in advance. Following the overnight fast, pigs were weighed and fasting blood (12 ml) was taken via the jugular vein into EDTA-coated evacuated tubes and placed on ice and covered with aluminium foil. Blood was centrifuged at 9500 × g to harvest plasma. In Experiment 1, blood samples were collected every 7 days for 42 days. Following blood collection on day 42, animals were anaesthetised through exposure to a mixture of oxygen and isofluorane (2.5%) by way of a face mask. Once a surgical plane of anaesthesia was obtained, a midline incision was made. Livers were excised, blotted dry, weighed and sub-samples were immediately placed in liquid nitrogen. Animals were killed by exsanguination. All the plasma and tissue samples were stored at −80°C until analysis. In Experiment 2, baseline blood before implementation of dietary depletion and blood samples at the completion of depletion were collected, respectively, on each pig using sampling protocols described in Experiment 1 during the depletion phase. During the repletion phase, blood samples (10 ml) were taken on days 3, 7, 10 and 14 of repletion, and processed as described above. On day 14, pigs were killed and the tissues harvested as described above.
Analytical methods
Plasma PLP was measured using a commercial radioenzymatic assay (vitamin B6 PLP 3H-REA; ALPCO Diagnostics, Salem, NH, USA). As PLP is light sensitive, all analytical conditions were performed without exposure to direct light. The inter- and intra-assay coefficients of variation, across the range of concentrations encountered, were consistently less than 5%. The reported sensitivity of the assay was 2.6 nmol/l. Hepatic PLP was determined by the reverse phase-HPLC method with fluorescence detection, as described earlier (Gregory, Reference Gregory1980; Ubbink et al., Reference Ubbink, Serfontein and De Villiers1985). Plasma total homocysteine and cysteine concentrations were analysed according to the reverse phase-HPLC method of Araki and Sako (Reference Araki and Sako1987), with modifications as suggested by Gilfix et al. (Reference Gilfix, Blank and Rosenblatt1997). For liver thiol concentrations, extracts were first prepared as described earlier (Farris and Reed, Reference Farris and Reed1987), and subsequently treated as described for plasma (Araki and Sako, Reference Araki and Sako1987; Gilfix et al., Reference Gilfix, Blank and Rosenblatt1997). Concentrations of total homocysteine, cysteine and hepatic PLP were determined through the use of an external standard curve, and the inter- and intra-assay coefficient of variation (CV) were <2%. Liver thiol and PLP concentrations were expressed on a per gram of liver basis. Plasma-free methionine, serine and glycine were measured via ion-exchange chromatography (LKB 4151 alpha-plus amino acid analyzer, Pharmacia, Cambridge, UK), with post-column ninhydrin derivitization, using methods as previously described (Blom and Huijmans, Reference Blom and Huijmans1992).
For all enzyme assays, initial experiments were conducted to establish optimal conditions for protein assay duration. Protein concentrations for tissue homogenates were determined using a Bicinchoninic Acid Protein Assay Reagent kit (Product no. 23225; Pierce, Fisher Scientific, Nepean, ON, Canada). The hepatic activity of CBS was determined as previously described, using a radioisotopic technique that measures the production of 14C-cystathionine from a 14C-serine substrate (Mudd et al., Reference Mudd, Finkelstein, Irreverre and Laster1965; Taoka et al., Reference Taoka, Ohja, Shan, Kruger and Banerjee1998). The hepatic activity of CGL was quantified by a coupled-enzyme (lactate dehydrogenase) spectrophotometric assay (Stipanuk, Reference Stipanuk1979), measuring the oxidation of NADH at 37°C. The activity of hepatic SHMT was quantified by a binding assay using radioactive isotope L-[14C(U)]-serine (Geller and Kotb, Reference Geller and Kotb1989; Lewis et al., Reference Lewis, Godfrey, Jackson, Cameron and Hanson1998), which measured the transfer of label from serine to tetrahydrofolate and the subsequent formation of 5,10-methylenetetrahydrofolate. For all hepatic enzyme assays, incubations were carried out in both the presence (total activity) and absence (apo-activity) of exogenous PLP.
In order to gain additional insights into the impact of pyridoxine deficiency on enzymes of sulphur amino acid metabolism, quantitative real-time PCR was utilized to measure mRNA expression for both CBS and CGL in livers from pigs fed either the control or deficient diets from Experiment 1. Porcine liver samples were freshly harvested, immediately frozen in liquid nitrogen and then stored at −80°C. Total RNA was extracted from 70 to 80 mg of hepatic tissue by mixing with 1 ml TRIzol reagent (Invitrogen Canada Inc., Burlington, ON, Canada), homogenizing, transferring of the homogenate to a 1.5 ml tube and precipitating the proteins by adding 200 μl chloroform. After centrifugation at 12 000 r.p.m. for 10 min at 4°C, the aqueous phase was transferred to a new tube, and the RNA was precipitated with 500 μl of isopropanol, and washed with 75% ethanol. The RNA pellet was resuspended in 50–100 μl of DNase/RNase-free water, and was measured at 260 nm on a DU800 Spectrophotometer (Beckman Coulter Canada, Mississauga, ON, Canada). The absorbance ratio at wavelength 260/280 nm was within 1.7–2.0. For cDNA synthesis, 1 μg of total RNA was reverse transcribed at 42°C using a SuperScript First-Strand Synthesis System for an RT-PCR kit and Oligo (dT)12–18 primer (Invitrogen Canada Inc.) according to the manufacturer’s recommendations. The cDNA was diluted by 1 : 10 with DNase/RNase-free water prior to real-time PCR. For quantitative real-time PCR, each reaction consisted of 20 μl containing 2 μl of cDNA diluted by 1 : 10 and 6 pmol of each primer (Table 2). Real-time PCR was performed on a StepOne™ Real-time PCR System (Applied Biosystems Inc., Foster City, CA, USA) with ABI plates. The cycling conditions were: one cycle of denaturation at 95°C/10 min, followed by 40 two-segment cycles of amplification (95°C/3 s, 60°C/30 s) where the fluorescence was automatically measured during PCR and, 1 three-segment cycle of product melting (95°C/15 s, 60°C/1 min, 95°C/15 s). A melting curve was constructed for each primer pair to verify the presence of one gene-specific peak and the absence of primer dimer. All samples were amplified in triplicate and the mean was used for further analysis. Results were expressed as a ratio with the housekeeping gene β-actin, as has been done earlier with pigs (Villanueva et al., Reference Villanueva, Devlin and Halsted2001), that was simultaneously amplified in a separate PCR. When expressed as a proportion of total RNA, vitamin B6 deficiency did not significantly affect β-actin concentrations (P > 0.05; data not shown).
Primers and PCR conditions for real-time quantitative PCR of enzymes of the transsulphuration pathway

CBS = cystathionine-β-synthase; CGL = cystathionine-γ-lyase; β-actin: used as an internal standard. F = forward direction; R = reverse direction. T a: annealing temperature for each PCR reaction.
Statistical analyses
To adequately account for within-subject correlation over time and handle the missing data, the mixed model was applied to analyse the parameters with repeated observations, including growth performance and indicators from plasma samples (Littell et al., Reference Littell, Milliken, Stroup and Wolfinger1996; Wang and Goonewardene, Reference Wang and Goonewardene2004). The diet effect and interaction effect between diet and week were partitioned in the model. In Experiment 1, owing to the homogeneous variance over time in the control group and heterogeneous variances over time in the deficiency group, a common variance for control group and individual variance for deficiency group throughout the trial were employed. Since hepatic CBS, plasma methionine and glycine were not normally distributed, log transformations of these data were performed prior to statistical analysis. For tissue sample data, the PROC GLM was used, and an RCB design was applied to the model (SAS, 2003). Animals were treated as block and diet and block effects were partitioned in the model. In Experiment 2, for the data before diet treatment and at the end of depletion, average and standard error values were obtained using PROC MEANS (SAS, 2003).
A generalized function, the Richards equation (Thornley and France, Reference Thornley and France2007), was used to test whether the plasma PLP concentrations (PLP) v. repletion time (D) profile could be better described using a sigmoid function. The functional form used was

where PLP0 is PLP at 0 repletion time, PLPf is PLP at final repletion time, k (/day) is a positive rate parameter and n ⩾ −1. The Richards equation was chosen because it encompasses the logistic, Gompertz and monomolecular (diminishing returns) when its additional parameter (n) has a value of 1, 0 and −1, respectively. Fitting the Richards equation to the composite data showed that n was not significantly different from 1. Therefore, the logistic equation was used. The logistic function was fitted to the data set using the nonlinear procedure (PROC NLIN; SAS Institute Inc., Cary, NC, USA). The function was fitted with a common PLP0 value but PLPf and k were allowed to vary. The parameter estimates with their standard errors and the repletion time at 90% of the final repletion time (PLP90f) were obtained.
Results
In Experiment 1, one pig from the control group was excluded at the end of the first week of experimentation due to failure to thrive.
Growth performance
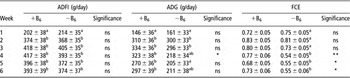
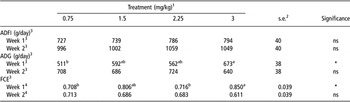
In Experiment 1, vitamin B6 deficiency did not affect average daily feed intake (ADFI) (Table 3), as a result of the use of a pair-feeding design (P > 0.05). However, average daily gain (ADG) was decreased on the 4th week and feed conversion efficiency (FCE) was decreased (Table 3) from the 4th week until the 6th week (P < 0.05). In the latter 3 weeks ADG was reduced by 29% to 33%, while FCE was lowered by 33% to 50% due to vitamin B6 deficiency. In Experiment 2, ADFI, ADG and FCE during the depletion period were 390 ± 15, 291 ± 14 g/day and 0.742 ± 0.013, respectively. During the repletion period, ADFI was not affected by vitamin B6 repletion (Table 4; P > 0.05) when pigs were permitted to consume feed ad libitum. However, significant differences in ADG were observed in the first week of repletion (P < 0.05) during which ADG in pigs receiving 3 ppm pyridoxine·HCl was higher than that in pigs receiving 0.75 ppm pyridoxine·HCl (P < 0.05). However, there were no differences in ADG among pigs consuming diets containing vitamin B6 at levels of 1.5, 2.25 and 3 ppm as pyridoxine·HCl. Significant differences in FCE were detected after 7 days of repletion (P < 0.05), and these differences mirrored those observed with ADG.
Effect of vitamin B6 deficiency on growth performance in piglets (Experiment 1)Footnote 1

ADFI = average daily feed intake; ADG = average daily gain; FCE = feed conversion efficiency (ADG/ADFI).
1 Data are presented as least-square mean ± s.e.
* P < 0.05, **P < 0.01, ns = non-significant.
a,b Within a column, values that do not share the same alphabetical superscript are significantly different (P < 0.05).
Effect of vitamin B6 repletion on growth performance in vitamin B6-depleted piglets (Experiment 2)

1Vitamin B6 was supplemented as crystalline pyridoxine·HCl.
2Data are presented as least-square means. s.e. refers to the pooled standard error of the mean from least-square means presented within a row.
3Average daily feed intake (ADFI), average daily gain (ADG) and feed conversion efficiency (FCE; ADG/ADFI) throughout the depletion period were 390 ± 15, 291 ± 14 g/day and 0.74 ± 0.01, respectively (n = 20).
a,bWithin a row, means without a common superscript letter are significantly different (P < 0.05).
4Week 1 = the first week after starting vitamin B6 repletion; Week 2 = the second week after starting vitamin B6 repletion.
*P < 0.05, ns = non-significant.
Plasma and tissue PLP concentrations
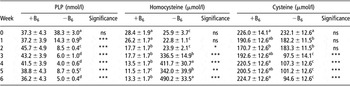
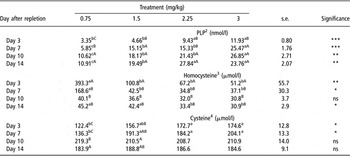
In Experiment 1, with the exception of the baseline data, plasma PLP concentrations in vitamin B6 devoid pigs were significantly lower in comparison to those observed in control animals (P < 0.01) (Table 5). In the control pigs, there was no change in plasma PLP concentration over time. However, plasma PLP concentrations in vitamin B6-devoid pigs were decreased by 63% on the first week (P < 0.05), and were further reduced during later weeks (P < 0.05). Plasma PLP concentrations in vitamin B6-deficient pigs were similar on the 3rd, 4th and 6th week (P > 0.05) but were all lower than other time points (P < 0.05). Plasma PLP concentrations on the 6th week in the deficient group were approximately 13% of baseline and control groups. In Experiment 2, plasma PLP concentrations before diet treatment and at the end of depletion were 24.93 ± 1.58 nmol/l (n = 20) and 3.18 ± 0.22 nmol/l (n = 20), respectively. Plasma PLP concentrations increased with increased dietary B6 levels throughout the repletion period (P < 0.01; Table 6). In the 0.75 mg/kg pyridoxine·HCl dietary treatment, plasma PLP concentrations increased significantly over repletion until day 10 after repletion. In dietary treatments of 1.5 and 3.0 mg/kg pyridoxine·HCl, plasma PLP concentrations on day 7 were higher than those on day 3 after repletion (P < 0.01), but not different with those at later repletion time points (P > 0.05). In 2.25 mg/kg pyridoxine·HCl dietary treatment, plasma PLP concentrations on the 2nd week after repletion were higher than those on the 1st week after repletion (P < 0.05). Subjecting the plasma PLP data to nonlinear statistical analysis yielded parameter estimates for k (rate or plasma PLP repletion; nmol/(l)), PLPf (maximal plateau; nmol/l) and PLP90f (days to reach 90% maximal plateau) (Table 7). With the exception of the 2.25 mg/kg repletion level, as the level of dietary pyridoxine·HCl increased during the repletion phase, the k and PLPf estimates increased, with a corresponding decrease in the PLP90f estimates.
Effect of vitamin B6 deficiency on plasma pyridoxal-5′-phosphate (PLP), total homocysteine and cysteine concentrations in piglets (Experiment 1)Footnote 1

1 Data are presented as least-square means ± s.e.
a–d Within a column, values that do not share the same alphabetical superscript are significantly different (P < 0.05).
* P < 0.05, **P < 0.01, ***P < 0.001, ns = non-significant.
Effect of vitamin B6 repletion on plasma pyridoxal-5′-phosphate (PLP), total homocysteine and cysteine concentrations in vitamin B6-depleted piglets (Experiment 2)Footnote 1

1 Data are presented as least-square means with pooled s.e.
Statistical designations: a–cWithin a row, means without a common superscript lowercase letter differ (P < 0.05).
A–CWithin a column, means without a common superscript uppercase letter differ (P < 0.05). *P < 0.05, **P < 0.01, ***P < 0.001, ns = non-significant.
2 Average PLP concentrations before and at the end of depletion were 24.93 ± 1.58, and 3.18 ± 0.22 nmol/l, respectively (n = 20).
3 Average homocysteine concentrations before and at the end of depletion were 32.3 ± 2.2 and 510.9 ± 33.9 μmol/l, respectively (n = 20).
4 Average cysteine concentrations before and at the end of depletion were 198.7 ± 7.1 and 80.3 ± 6.2 μmol/l, respectively (n = 20).
Non-linear parameters estimated from a logistic function relating plasma pyridoxal-5′-phosphate (PLP) to days of vitamin B6 repletion in depleted piglets receiving graded levels of pyridoxine·HCl (Experiment 2)Footnote 1

1 Data represent parameter estimates derived as described in ‘Material and methods’ section.
2 Vitamin B6 was supplemented as crystalline pyridoxine·HCl.
3 PLPf = plasma PLP at plateau; k = rate of repletion of plasma PLP; PLP90f = days required to reach 90% of maximal plasma PLP concentrations.
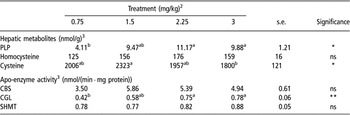
In Experiment 2, hepatic PLP concentration in depleted piglets was 2.88 ± 1.38 nmol/g. Hepatic PLP concentration at the end of repletion in pigs receiving 0.75 mg/kg pyridoxine·HCl was lower than those observed at the highest repletion levels (2.25 and 3 mg/kg; P < 0.05; Table 9). There were no differences in hepatic PLP concentrations in pigs receiving 1.5, 2.25 and 3 mg/kg vitamin B6 as pyridoxine·HCl, respectively (P > 0.05).
Hepatic enzyme activities
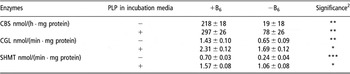
In Experiment 1, vitamin B6 deficiency decreased hepatic CBS activity to 10% and 33% of control values for activities established in the absence or presence of PLP in the incubation media, respectively (P < 0.01; Table 8). Hepatic CGL and SHMT activities were reduced (P < 0.05) by vitamin B6 deficiency, irrespective of PLP inclusion in the media. Despite changes in enzyme activity, pyridoxine deficiency did not significantly affect the expression, when measured against β-actin expression of either CBS (Control: 0.59 ± 0.09; Deficient: 0.74 ± 0.04; P > 0.05) or CGL (Control: 2.67 ± 0.63; Deficient: 2.95 ± 0.34; P > 0.05). In Experiment 2, hepatic CBS and SHMT activities, established in the absence of PLP in the incubation media, did not differ by dietary B6 repletion level at the end of the repletion period (P > 0.05; Table 9). Hepatic CGL activity, however, was significantly affected by the level of vitamin B6 repletion (P < 0.01). CGL activities, established in the absence of PLP in the incubation media, in pigs receiving 0.75 mg/kg pyridoxine·HCl were lower than those in pigs receiving the highest repletion levels (2.25 and 3 mg/kg; P < 0.05; Table 9), but there were no differences in activities amongst the higher dietary vitamin B6 treatments (P > 0.05).
Effect of vitamin B6 deficiency on hepatic enzymatic activities in piglets (Experiment 1)Footnote 1

CBS = cystathionine-β-synthase; CGL = cystathionine-γ-lyase; SHMT = serine hydroxymethyltransferase.
1 Data are presented as least-square mean ± s.e.
2 P values are derived from difference of main effect of diet. P values<0.05 are considered significant. *P < 0.05, **P < 0.01, ***P < 0.001.
Effect of vitamin B6 repletion on hepatic pyridoxal-5′-phosphate (PLP), homocysteine and cysteine concentrations and hepatic apo-enzymatic activities in vitamin B6-depleted piglets (Experiment 2)Footnote 1

1 Data are presented as least-square means plus pooled s.e.
a,b Within a row, means without a common superscript lowercase letter differ (P < 0.05). *P < 0.05, **P < 0.01, ns = non-significant.
2 Vitamin B6 was supplemented as crystalline pyridoxine·HCl.
3 Apo enzyme means without adding exogenous PLP to the incubation media for analysis; CBS represents cystathionine-β-synthase; CGL represents cystathionine-γ-lyase; SHMT represents serine hydroxymethyltransferase; average hepatic apo CBS, CGL and SHMT activities at the end of depletion were 1.65 ± 0.14, 0.14 ± 0.01 and 0.30 ± 0.07 nmol/(min·mg protein), respectively (n = 4). Average hepatic PLP, homocysteine and cysteine concentrations at the end of depletion were 1.51 ± 0.31, 392 ± 63 and 1716 ± 77 nmol/g, respectively (n = 4).
Plasma and hepatic total thiol concentrations
In Experiment 1, vitamin B6 deficiency significantly increased plasma total homocysteine concentrations from the 2nd week until the 6th week (P < 0.05; Table 5). In particular, severe hyperhomocysteinemia in vitamin B6-deficient pigs occurred from the 3rd week until the 6th week. During this period, the concentration of plasma total homocysteine reached approximately 336.5–490.2 μmol/l, which was approximately 19 to 37 times that in the control group. In the control group, plasma total homocysteine decreased as the age increased. Contrastingly, significant decreases in plasma total cysteine were detected from the 3rd week (P < 0.01). As in the plasma, a significant increase in hepatic total homocysteine (Control = 17.7; Deficient = 307.5; s.e. = 5.3 nmol/g; P < 0.01) and a decrease in hepatic total cysteine (Control = 161.9; Deficient = 89.6; s.e. = 7.1 nmol/g; P < 0.05), as a result of vitamin B6 deficiency, were observed.
In Experiment 2, consistent with the findings from Experiment 1, plasma homocysteine concentrations (Table 6) before and after depletion were 32.3 ± 2.2 and 510.9 ± 33.9 μmol, respectively (n = 20). With the exception of day 10 after repletion, plasma homocysteine concentrations were significantly affected by vitamin B6 repletion (P < 0.05). Within the 1st week of repletion, plasma homocysteine concentrations in pigs receiving 0.75 mg/kg pyridoxine·HCl were higher than those in pigs receiving higher repletion levels of vitamin B6 (P < 0.05). At the end of repletion, plasma homocysteine concentrations in pigs receiving 2.25 and 3 mg/kg pyridoxine·HCl were lower than those in pigs receiving 0.75 and 1.5 mg/kg pyridoxine·HCl (P < 0.05). Plasma cysteine concentrations (Table 6) before and after depletion were 198.7 ± 7.1 and 80.3 ± 6.2 μmol/l, respectively. The effect of graded levels of vitamin B6 repletion on plasma cysteine was significant only on the first week after repletion (P < 0.05). Hepatic homocysteine and cysteine concentrations at the end of depletion were 392 ± 63 and 1716 ± 77 nmol/g, respectively. Hepatic homocysteine concentrations decreased and cysteine concentrations increased with repletion, but there were minimal differences due to the repletion level of vitamin B6 at the end of repletion (Table 8).
Plasma amino acid concentrations
In Experiment 1, vitamin B6 deficiency had no effect on plasma methionine, serine and glycine concentrations on the 3rd week (P > 0.05) (data not shown). At the end of the 6th week, plasma glycine concentration in the deficiency group (724 ± 64 μmol/l) was 55% of control (1319 ± 335 μmol/l) (P < 0.05). By contrast, vitamin B6 deficiency increased plasma methionine (71 ± 13 v. 836 ± 413 μmol/l) and serine (119 ± 18 v. 179 ± 16 μmol/l) concentrations by 10-fold and 50%, respectively (P < 0.05).
Discussion
Vitamin B6 serves a critical role as a co-factor in the metabolism of amino acids, one carbon units and lipids, and is required for glucose and neurotransmitter biosynthesis (Mackey et al., Reference Mackey, Davis and Gregory2006). As such, this vitamin plays a central role in intermediary metabolism. The adverse metabolic effects of vitamin B6 deficiency (Kirchgessner and Kösters, Reference Kirchgessner and Kösters1977) are likely to be responsible for the observed reductions in weight gain and feed utilization efficiency even though feed intake between treatments was not different, due to the use of a pair-feeding design. The experimental design employed for Experiment 1 reflects a major difference between the current data set and that of others (Smolin et al., Reference Smolin, Crenshaw, Kurtycz and Benevenga1983) who did not employ a pair-feeding regimen. Pair feeding provides a measure of control over variables that could confound the interpretation of the changes in measures of sulphur amino acid metabolism (i.e., protein and co-factor intake, including folate and cobalamin). Additionally, blood samples were collected in the fasted state for all subjects, likely reducing the variability associated with the effect of consumption patterns on metabolite profiles, since pair-fed animals tended to consume a greater proportion of their daily feed allotment within a short time period following feed delivery. The results provide strong evidence that dietary pyridoxine deficiency leads to perturbations in the transsulphuration pathway, as characterized by reductions in the activities of key enzymes and alterations in fasting metabolite profiles. Furthermore, the extent of the perturbations is highly dependent on the duration of the deficiency period.
Plasma PLP concentration is the most commonly used direct measure of vitamin B6 status, and the current study provides a detailed temporal characterization of the changes in this indicator, as well as other biochemical indices, for the pig. Plasma PLP concentrations in vitamin B6-depleted pigs were decreased by 38% on the first week of diet treatment in Experiment 1. Further reductions in plasma PLP concentrations were observed during subsequent weeks, with a nadir of 4–6 nmol/l reached by the end of the third week. Reduced plasma PLP concentrations induced by vitamin B6 restriction have been reported in humans (Davis et al., Reference Davis, Scheer, Quinlivan, Coats, Stacpoole and Gregory2005) and rats (Martinez et al., Reference Martinez, Cuskelly, Williamson, Toth and Gregory2000; Scheer et al., Reference Scheer, Mackey and Gregory2005) but data in pigs are limited. In the experiment examining vitamin B6 repletion, plasma PLP at the beginning of the depletion phase was 24.9 nmol/l and declined to 3.2 nmol/l, consistent with observations from Experiment 1. The patterns of response in plasma PLP to pyridoxine repletion reflect both dose and time dependency. Martinez et al. (Reference Martinez, Cuskelly, Williamson, Toth and Gregory2000) provided evidence of a dose dependency of plasma PLP to increasing dietary vitamin B6 from 0 to 2 mg/kg diet in rats. In the current study, the fitting of the plasma PLP data to a logistics function yielded further information with respect to temporal changes in this marker of vitamin B6 status. In general, as repletion levels increased, the rate at which plasma PLP levels changed also increased (k values), and this corresponded to a reduction in the time required to reach 90% of the maximal estimated plasma PLP concentration. In the current pig model, plasma PLP appeared to reach a plateau value at repletion rates of 2.25 mg/kg diet (as pyridoxine·HCl) and higher, where plasma PLP reached levels of 24 to 28 nmol/l upon repletion. The latter values are generally consistent with the baseline, pre-depletion plasma PLP concentrations. From a clinical perspective, the data support the use of plasma PLP as a marker of vitamin B6 status, particularly in response to depletion : repletion protocols, and highlight the fact that repletion phases of at least 7 days are required in order to reach near-maximal concentrations in plasma PLP concentrations. With respect to other markers of B6 status, a similar pattern was observed for hepatic PLP concentrations during the repletion phase, as well as for ADG and FCE after 1 week of vitamin B6 repletion. Where the aforementioned results allow for the characterization of vitamin B6 status through the use of direct markers of plasma and hepatic PLP concentrations, the primary intent of the current study included the examination of the sensitivity of sulphur amino acid metabolism to dietary vitamin B6 supply.
As shown in Figure 1, the remethylation and transsulphuration pathways are the primary routes for homocysteine removal, with the transsulphuration pathway representing the sole route for de novo cysteine synthesis. In the current study, decreases in both the apo- and total activities of hepatic CBS, CGL and SHMT were observed after 6 weeks of vitamin B6 depletion, consistent with observations from rat studies (Smolin and Benevenga, Reference Smolin and Benevenga1984; Lima et al., Reference Lima, Davis, Mackey, Scheer, Williamson and Gregory2006), although the magnitude of changes differed from published reports. In particular, the activities of hepatic apo-CBS and CGL were 9% and 45% of control animals, respectively, in the current trial. Earlier authors have reported reductions of apo-CGL activities in rats receiving semi-purified diet without addition of pyridoxine to 30% of control animal values, where rats were receiving 2 mg/kg pyridoxine, with no change in apo-CBS activities (Lima et al., Reference Lima, Davis, Mackey, Scheer, Williamson and Gregory2006). However, the current data support the position that, in the young pig, both CBS and CGL are sensitive to a 6-week vitamin B6-depletion period.
Based on enzyme activity results, an impaired transsulphuration pathway was likely present in pigs as a result of the 6-week vitamin B6-depletion period in Experiment 1. Previous research in vitamin B6-deficient rodents provided evidence that the decreased activity of CGL may be related to an increased turnover of the enzyme, coupled with an increase in mRNA levels, as determined by Northern blot analysis (Sato et al., Reference Sato, Nishioka, Awato, Nakayama, Okada, Horiuchi, Okabe, Sassa, Oka and Natori1996). The current data for the pig, however, do not support an effect on gene expression; the impact of vitamin B6 deficiency on enzyme protein levels was not directly assessed, and this may play a role in the observed reduced enzyme activities, in addition to reduced co-factor availability. While enzyme activity levels are not available at all time points, data from Experiment 2 confirm that after a 4-week depletion period, the activities of the apo-forms of CBS, CGL and SHMT were depressed relative to control activity levels, and that a 2-week repletion period resulted in substantial restoration of activity levels. Examination of key amino acid concentrations provides an additional level of detail related to the impact of vitamin B6 deficiency on whole-body sulphur amino acid metabolism.
The accumulation of homocysteine and reduction of cysteine in plasma and liver support an impairment in the transsulphuration pathway. Plasma homocysteine concentrations in vitamin B6-depleted piglets in the current study did not change within the first 2 weeks of B6 depletion. Interestingly, dramatic increases in plasma homocysteine concentrations were observed at the end of the 3rd week, and these were maintained through the 6th week of the depletion period, with levels approaching 500 μmol/l. The abrupt increase in plasma homocysteine concentrations coincided with the halving of plasma cysteine concentrations at the end of 3 weeks on vitamin B6-deficient diets. Previous research has shown that CBS has a strong affinity for PLP (Kery et al., Reference Kery, Poneleit, Meyer, Manning and Kraus1999), potentially explaining the delay in the observed hyperhomocysteinemia and hypocysteinemia. Additionally, decrease in plasma PLP may not have paralleled decrease in hepatic PLP stores, offering an additional potential explanation for the observed delay. The hyperhomocysteinemia induced by vitamin B6 deficiency in this study is consistent with other reports in pigs (Smolin et al., Reference Smolin, Crenshaw, Kurtycz and Benevenga1983) and rats (Smolin and Benevenga, Reference Smolin and Benevenga1982; Smolin and Benevenga, Reference Smolin and Benevenga1984; Martinez et al., Reference Martinez, Cuskelly, Williamson, Toth and Gregory2000), but not in healthy humans (Davis et al., Reference Davis, Scheer, Quinlivan, Coats, Stacpoole and Gregory2005) with vitamin B6 restriction treatment. The discrepancy with the latter observation likely reflects the severity of vitamin B6 restriction; pigs with depressed plasma PLP concentrations are able to maintain plasma homocysteine concentrations within normal limits, however, this is limited to the first 2 weeks of depletion. Miller et al. (Reference Miller, Nadeau, Smith and Selhub1994) observed that vitamin B6-deficient rats had similar fasting plasma homocysteine concentrations as control rats, an observation at odds with the current results, whereas when given a methionine load, plasma homocysteine increased 30-fold in the deficient rats but not in the controls. Therefore, in the current study, impairments in the transsulphuration pathway may have been detectable earlier under a methionine loading protocol, but this remains to be determined. Since the current study employed a pair-feeding design, cysteine intake was kept constant for the two treatments. Therefore, the observed reductions in plasma cysteine concentrations in vitamin B6-deficient pigs provide strong evidence that de novo synthesis of cysteine is a major contributor to circulating cysteine, and supply to peripheral tissues in adequately nourished pigs. Consistent with the observed restoration in enzyme activity levels upon vitamin B6 repletion, plasma total homocysteine and cysteine concentrations reverted back to control levels during the repletion phase. The pattern of changes for both total homocysteine and cysteine mirrored the temporal and dose-dependent responses observed for plasma PLP. In general, when plasma PLP concentrations exceeded 10 nmol/l, plasma total homocysteine and cysteine approximated concentrations observed in pigs receiving diets with adequate levels of vitamin B6.
Previous research has shown that hepatic methionine concentration in rats (Scheer et al., Reference Scheer, Mackey and Gregory2005) and plasma methionine concentration in humans (Davis et al., Reference Davis, Scheer, Quinlivan, Coats, Stacpoole and Gregory2005) are not affected by vitamin B6 restriction. In the current study, increases in fasting plasma methionine concentrations in vitamin B6-deficient pigs were observed at the end of 6 weeks, relative to those of the control pigs. Increased plasma methionine may result from a number of perturbations, including increased remethylation of homocysteine and a reduction in the utilization of methionine for protein synthesis, as supported by the markedly depressed feed conversion efficiency in the deficient pigs. Results from a previous study in pigs (Kirchgessner and Kösters, Reference Kirchgessner and Kösters1977) documented the fact that vitamin B6-deficient pigs retained less nitrogen than their pair-fed controls. However, to date, little research (Martinez et al., Reference Martinez, Cuskelly, Williamson, Toth and Gregory2000) has been performed to examine the impact of vitamin B6 deficiency on protein kinetics, despite the recognized importance of this vitamin in protein and amino acid metabolism. An inhibition of transmethylation in vitamin B6-deficient animals can also contribute to increased methionine concentrations, although previous researchers did not observe reductions in transmethylation rates in vitamin B6-deficient rats (Martinez et al., Reference Martinez, Cuskelly, Williamson, Toth and Gregory2000). Elevated homocysteine levels are linked to increased S-adenosylhomocysteine concentrations (Yi et al., Reference Yi, Melnyk, Pogribna, Pogribny, Hine and James2000), an inhibitor of methylation reactions. It is likely that the severity of vitamin B6 restriction in the current study was greater than that observed in rats, as supported by the depressed CBS and CGL activities, and the magnitude of the changes in plasma and hepatic thiol concentrations. This could have induced a reduction in overall transmethylation rates, but remains to be determined.
The vitamin B6-dependent enzyme, SHMT, catalyzes the interconversion of glycine and serine, and exists in both cytosolic and mitochondrial forms (Garrow et al., Reference Garrow, Brenner, Whitehead, Chen, Duncan, Korenberg and Shane1993). In the current study, hepatic apo-SHMT activity was reduced to 34% of control values after 6 weeks of vitamin B6 deficiency. Concurrent to the reduction in SHMT activity, plasma serine concentrations were increased and plasma glycine concentrations decreased as a result of vitamin B6 deficiency. While these data supports a reduced net flux of serine to glycine through SHMT, perturbations in the concentrations of these amino acids may have resulted from alterations in other metabolic processes. Depressed flux through the transsulphuration pathway could lead to an increased supply of serine. Glycine metabolism is governed by (1) SHMT reaction, (2) glycine N-methyltransferase (GNMT) reaction, (3) folate-dependent glycine cleavage system (GCS) and (4) sarcosine dehydrogenase reaction (Dickson et al., Reference Dickson, Edison, Brosnan and House2005). A reduced flux through SHMT may limit the supply of 5-methyltetrahydrofolate, lead to a reduced flux through the remethylation pathway, and reduce the inhibitory effect of 5-methyltetrahydrofolate on GNMT activity (Wagner et al., Reference Wagner, Briggs and Cook1985). This would then lead to a further decrease in glycine concentrations. Stable isotopic studies in the vitamin B6-deficient pigs would help to further characterize the impact of vitamin B6 status on sulphur amino acid and one carbon metabolism.
While not the primary focus of the present study, the results do provide additional insight into the adequacy of current dietary vitamin B6 recommendations for young pigs. In the repletion experiment, plasma PLP and homocysteine concentrations in pigs receiving 2.25 mg/kg diet of pyridoxine·HCl were significantly different from those in the treatments of 0.75 and 1.5 mg/kg, but not different from those of pigs consuming 3.0 mg/kg by day 14 of the repletion period. As such, these data support increasing vitamin B6 requirements to 2.25 mg/kg, as added pyridoxine·HCl, for pigs in the 10 to 20 kg weight class, reflecting an estimate that is 150% of the current NRC recommendation (NRC, 1998). These results support the recommendations of others to readjust vitamin B6 recommendations upwards for young pigs (Woodworth et al., Reference Woodworth, Goodband, Nelssen, Tokach and Musser2000; Matte et al., Reference Matte, Giguère and Girard2005).
Acknowledgments
The authors acknowledge the assistance of Jason Neufeld and Prakash Sharma, with respect to the provision of animal care and technical assistance. The research was supported by the Discovery Grants program of the Natural Sciences and Engineering Research Council of Canada (NSERC). There are no conflicts of interest to declare. The research was conducted as part of the doctoral program of Z. Zhang who, under the advisorship of J. D. House, designed the experiment, collected and analysed the data and co-authored the manuscript.