Children with CHD may require cardiac surgery and resource-intensive perioperative care. Prolonged hospital length of stays following cardiac surgery are due to patient-related and patient-care related factors. Reference Alsoufi, Gillespie and Mahle1–Reference Nathan, Gauvreau and Liu9 While survival has improved over time, many children require life-long care, including multiple hospitalisations, catheter, and surgical interventions into adulthood. Reference Downing, Allen and Goldberg10–Reference Burstein and Shamszad Pl12 Resource utilisation among this growing survivor population is substantial Reference Downing, Allen and Goldberg10,Reference Zielonka, Snarr and Liu13,Reference Jacobs, O’Brien and Pasquali14 and may be increasing. Reference Mackie, Tran, Marelli and Kaul15
Existing studies examining CHD resource utilisation are limited to patient subsets (e.g., neonates), Reference Downing, Allen and Goldberg10,Reference Nelson, Pasquali and Pratt11,Reference Smith, Gay and Patel16 focused on specific operations, Reference Nelson, Pasquali and Pratt11,Reference Pasquali, Peterson and Jacobs17–Reference Pasquali, Jacobs and He19 or phases of care. Reference Edelson, Rossano and Griffis20 Cost-influencers were identified, but most were single centre Reference Downing, Allen and Goldberg10,Reference Czosek, Anderson, Heaton, Cassedy, Schnell and Cnota21 or did not consider inpatient care across age groups. Reference Mackie, Tran, Marelli and Kaul15,Reference Pasquali, Sun and Almada18,Reference Pinto, Waitzman, Nelson, Minich, Krikov and Botto22–Reference Jantzen, He and Jacobs26 Except in rare cases, nationwide post-surgical CHD hospital healthcare cost estimates are lacking. Reference Mackie, Tran, Marelli and Kaul15,Reference Huang, Schilling and Dalziel27 To address this knowledge gap, we performed a retrospective cohort study to compare surgical resource utilisation, outcomes as well as readmission and long-term hospital costs associated with CHD surgery.
We hypothesise that children receiving congenital heart surgery consume substantial and increasing healthcare resources and that costs are unevenly distributed across patient age strata and variation exists between hospitals of different surgical volume. We anticipate that most inpatient costs are associated with the first surgery admission (index admission); younger children require more frequent subsequent interventions and have higher long-term hospital costs.
Materials and methods
Data source
The Pediatric Health Information System, managed by the Children’s Hospital Association (Lenexa, KS), contains inpatient, emergency department, and observation unit information submitted by over 50 United States not-for-profit, tertiary care paediatric hospitals. Pediatric Health Information System data includes demographics, diagnoses, procedures, discharge disposition, and daily billings for medications, laboratory tests, imaging procedures, clinical services/procedures, supplies, and room and board. Each patient has a unique identifier for longitudinal follow-up. Data quality is assured through a joint effort between the Children’s Hospital Association and participating hospitals. This study merited exemption by the Institutional Review Board.
Study cohort and follow-up
The retrospective cohort study identified children <19 years old hospitalised in a Pediatric Health Information System centre between January 2004 and September 2015 and with any cardiac diagnosis (International Classification of Diseases-9 codes: 394.XX–397.XX, 410.XX–417.XX, 420.XX–429.XX, 745.XX–746.XX, 747.0–747.4, V15.87. Only patients receiving cardiac planned surgeries (see Supplemental Table S1) during the index admission were included, and each patient’s records from index operation were followed longitudinally for up to 5 years, from index admission to death or the last Pediatric Health Information System hospitalisation discharge.
Covariates
Patients were grouped into three categories based on age at index cardiac surgery: neonates (≤30 days at cardiac surgery date), infant (31–365 days), and children (>1 year). Patient characteristics included sex, insurance type (private, public, self, other, or unknown). Genetic syndromes (trisomy 21, trisomy 18, trisomy 13, DiGeorge, Turner, and Williams syndrome) were determined by International Classification of Diseases-9 diagnosis codes at index admission. Chronic complex conditions include congenital and/or genetic anomalies, gastrointestinal, hematologic/immunologic, malignancy, metabolic, neuromuscular, renal, and respiratory defined by Feudtner et al. Reference Feudtner, Feinstein, Zhong, Hall and Dai28 Since all study patients had cardiovascular chronic complex conditions, it was not included as a covariate.
As Pediatric Health Information System only reports discharge diagnoses (not surgical diagnoses), and RACHS-1 score and case ascertainment based on administrative data may be inaccurate, Reference Pasquali, Peterson and Jacobs17 diagnostic classification from the index surgical admission was assessed based on discharge diagnoses and grouped hierarchically into four diagnostic complexity groups: Simple two ventricle, complex two ventricle, single ventricle, and unclassified. Reference Burstein, Shamszad and Dai29
Pre-operative length of stays include days from the index surgical admission date to the day before surgery. ICU-level care was determined by pre-operative ICU-level resources and defined a priori by specific International Classification of Diseases-9-CM procedure codes or clinical resource utilisation. Reference Maude, Fitzgerald and Fisher30 Daily pre-operative resource utilisation was identified from Pediatric Health Information System billing data.
Outcomes
Pediatric Health Information System-adjusted inpatient costs
Pediatric Health Information System provided wage index adjusted charges for each billing item. These charges and the cost-to-charge ratios were multiplied to derive each patient’s daily inpatient treatment costs and adjusted to 2017-dollar value with Medical Services component of the Consumer Price Index for overall comparison. Daily adjusted costs were summarised within six billing departments: room and board, pharmacy, laboratory, clinical, supply, and imaging. At follow-up, adjusted overall cost and billing department costs were derived by summing the daily costs reported. All billings were a priori grouped into 21 categories (Supplemental Table S2) to describe resource utilisation; the top ten were reported as cost drivers. Cost per inpatient day was calculated by dividing total inpatient cost by inpatient day number during the selected follow-up period.
Mortality, in-hospital length of stays, readmissions, and resource utilisation
Inpatient mortality was evaluated at index surgical admission and at 1- and 5-year follow-up. Pediatric Health Information System discharge status identified inpatient deaths. Index total hospital length of stays were calculated. At each follow-up, total readmission in-hospital days were determined for patients requiring post-surgery discharge hospitalisation.
Post-operative and follow-up ICU resource utilisation and medication use were determined from billing data. Binary indicators for resource exposure on each inpatient day were created and summed to obtain number of exposed days at follow-up.
Statistical analyses
Patient characteristics were summarised using frequencies and percentages for categorical variables and median and interquartile range for continuous variables. Characteristics were compared across age groups using chi-square test for categorical variables and Wilcoxon test for continuous variables. Mortality, resource utilisation, and readmissions during follow-up were compared using the chi-square test; length of stays, resource utilisation days, and cost by the Wilcoxon test.
Time-trend was evaluated using logistic regression (for mortality) and linear regression with gamma distribution (for cost), including year, age group, geographic region, diagnostic complexity, and hospital annual surgical volume. Odds ratio and cost ratio for the current year versus previous year were reported, with 95% confidence intervals.
Hospital volume variation, mortality, and median costs were plotted. Pearson’s correlations between hospital mortality and hospital median cost (or hospital annual surgical volume) were estimated to explore the associations between these hospital-level summaries. All analyses were performed in SAS 9.3; two-sided p value of <0.05 was considered significant.
Results
Cohort characteristics
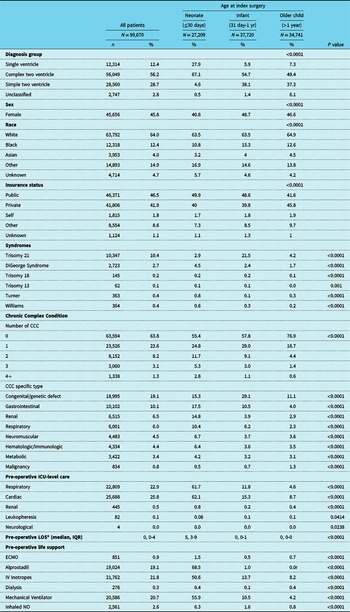
The cohort comprised 99,670 patients from 46 Pediatric Health Information System-contributing institutions during the study period. Neonates represented 27% of the cohort, while 38% were infants and the remaining were older children (Table 1). Females represented 46% (n = 45,656) and 47% (n = 46,371) had public insurance. Sixty-four percent (n = 63,792) were white, 12% were black (n = 12,318), and 15% (n = 14,893) were unclassified. Genetic syndromes were prevalent with trisomy 21 (n = 10,347, 10%) most common. Index diagnostic complexity was highest among neonates with 28% having single ventricle heart disease and 67% having complex two ventricle heart disease (Table 1). Over one-third had chronic complex conditions at index hospitalisation with non-cardiac congenital or genetic anomaly being most common (Table 1).
Patient characteristics at index surgery

*LOS: In-hospital length of stay, in days
Index surgical admission resource utilisation
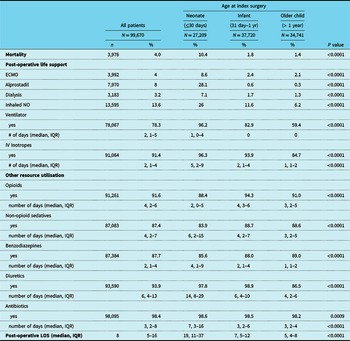
Pre-operative hospitalisation (median 5 days, interquartile [3,9]) and ICU-level therapies were more common among neonates (Table 1), including mechanical ventilation (56%) and intravenous inotropic support (51%), (p < 0.001 for all). Post-operative ICU care was common with 91% of patients receiving inotropic support, 78% receiving mechanical ventilation, 14% receiving nitric oxide; neonatal utilisation was highest for all post-operative life support categories while post-operative pharmaceutical utilisation varied across age groups (Table 2, p < 0.001 for all).
Post-operative outcomes, index surgical admission

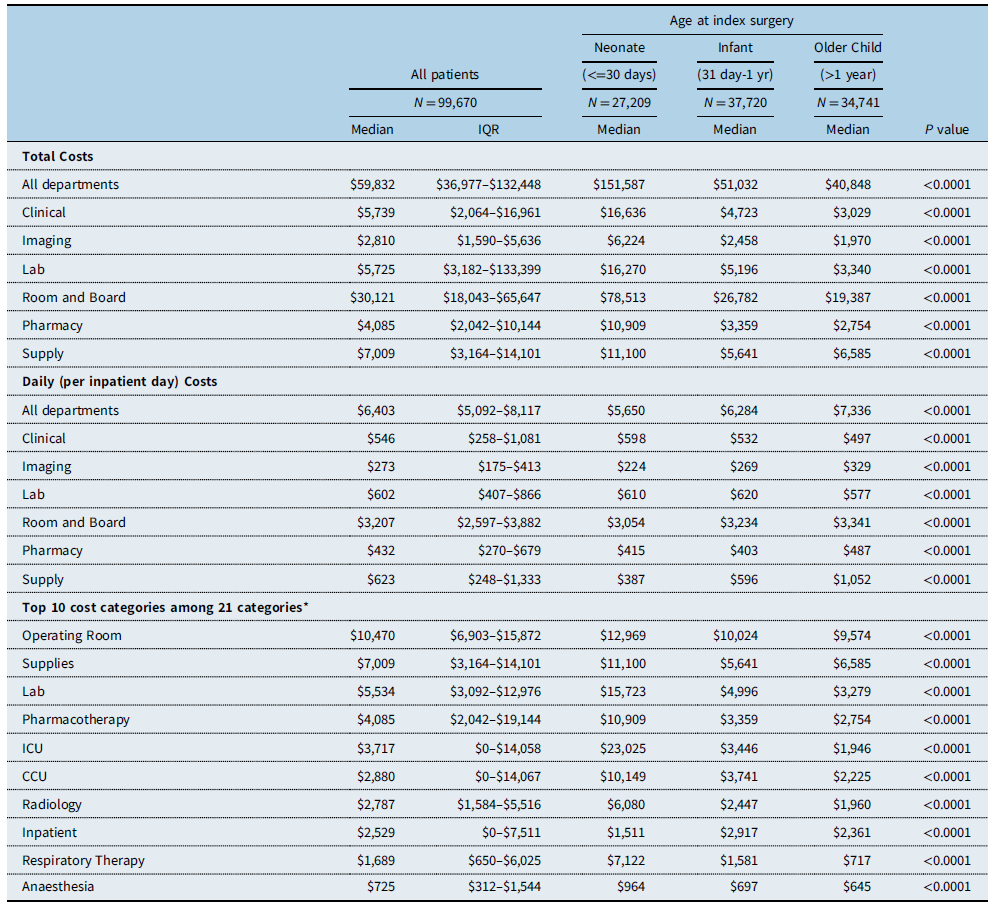
Index surgical hospitalisation costs are summarised in Table 3. Overall median patient-level hospital cost was ∼$60,000 in 2017 value. While total neonatal costs were highest (median $151,587 for neonates, $51,032 for infants, and $40,848 for older children, p < 0.0001), neonates had the lowest daily inpatient costs among the three age groups (median $5650, versus $6284 for infants, and $7336 for older children, p < 0.0001), suggesting that longer length of stays were the driver for higher total neonatal hospital costs. Compared across six billing departments, room and board represented the largest cost driver for all age groups (Table 3, p < 0.0001 for all).
Total costs, index cardiac surgery admission

* Billing-based resource utilisation categories, see Supplemental Table S2 for complete listing
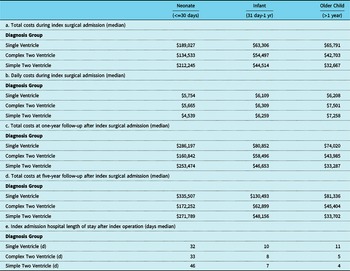
In sub-group stratified cost analyses (Table 4a–e), neonates with simple two ventricle diagnosis at index hospitalisation had highest overall hospital costs and lowest daily hospital costs, suggesting that prolonged hospitalisation informed the higher overall hospital costs these children incur (Table 4e) Except for neonates, patients with single ventricle diagnosis had the highest overall hospital costs. After adjusting for hospital length of stay, patients in each age group showed no difference in daily hospitalisation costs across diagnostic groups (Table 4a–b). In contrast to index hospitalisation costs, at 1- and 5-year follow-up, overall hospital costs were highest among the single ventricle diagnosis population (Table 4c–d). Hospital length of stay was longest among infants undergoing simple two ventricle repairs, as compared to more complex two ventricle and single ventricle surgery (Table 4e).
Median costs by diagnosis complexity and age category

Index surgical hospitalisation costs were further evaluated across 21 resource utilisation sub-categories, the 10 highest of which are reported in Table 3. Room and board accounted for >50% of total and daily hospital costs, whereas imaging, pharmacy supply, and laboratory accounted for <10%. Age-related variation in hospital costs was observed across billing departments (Table 3), with the difference between age groups in the ICU, acute care unit , pharmacotherapy and respiratory therapy categories, and the smallest differences in the anaesthesia category. Non-neonatal infants and older children had higher costs in the “inpatient” (non-ICU or acute care unit) category (Table 3). Greater hospital costs occurred post-operatively for all age groups; neonates had overall higher pre-operative costs (Supplemental Table S3), indicating that ICU care variation occurred across all age groups.
Post-operative outcome and mortality and cost trends
Median post-operative length of stays were 8 days (interquartile 5–16), with neonates having longer post-operative length of stays (Table 2). Index hospitalisation mortality was 4% overall and differed across age groups (10.4% for neonates vs. 1.8% for infant and 1.4% >1 year, p < 0.0001).
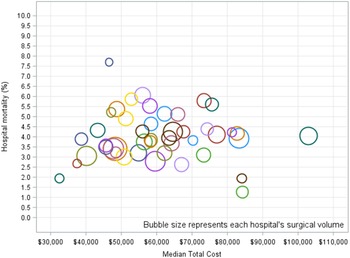
Figure 1 showed each hospital’s mortality and its relationship to median hospital cost and annual hospital surgical volume. While there was substantial cost (p < 0.001) and mortality (p < 0.001) variation between hospitals, no relationship between hospital mortality and hospital costs (correlation = −0.03, p = 0.831) or surgical volume (correlation = −0.11, p = 0.469) was identified.
While we found variation in surgical volume, mortality and median hospital costs, no relationship between surgical volume, mortality, and median hospital costs was identified.

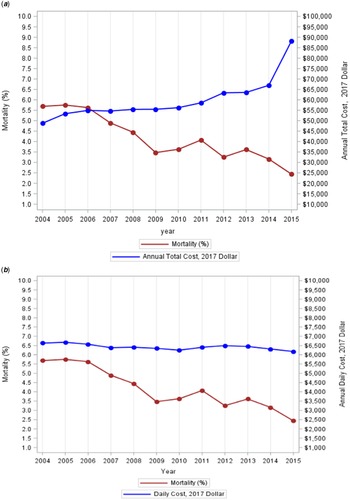
Mortality declined during the study period, while overall hospital costs increased (Fig 2a) with a year-over-year adjusted odds ratio 0.90 for mortality (95% confidence intervals 0.89–0.91) and a year-over-year adjusted cost ratio 1.05 for total cost (95% confidence intervals 1.04–1.05). In comparison, daily hospital costs decreased only slightly (Fig 2b): year-over-year adjusted cost ratio 0.993 (95% confidence intervals 0.992–0.994, p < 0.0001), indicating annual 1% decline in daily hospital cost.
A: While mortality declined, median cumulative hospital costs increased. Adjusted for surgical complexity. B: While mortality declined, median daily hospital costs were relatively constant over time. Adjusted for surgical complexity.

One- and five-year outcomes and hospital readmission costs
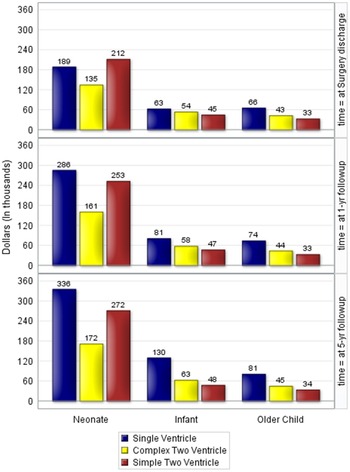
When stratified by diagnosis complexity group (Fig 3), single ventricle patients had the highest hospital costs at 1- and 5-year follow-up, while simple two ventricle neonates had higher costs at 1- and 5-year follow-up than neonates with complex two ventricle disease. Among subjects >30 days of age at index operation, those subjects with simple two ventricle operations had the lowest hospital costs at 1- and 5-year follow-up.
Cumulative median costs at index surgery discharge, 1- and 5-year follow-up.

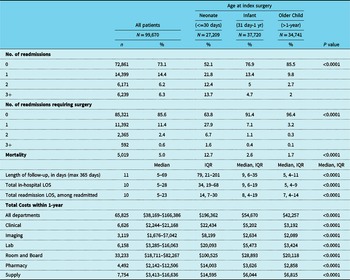
Tables 5 and Supplemental Table S4 summarise mortality, hospital readmission, and hospital costs at 1- and 5-year follow-up, respectively. While most patients (73%) required no hospital readmission at 1-year follow-up, 48% of neonates were readmitted and 54% of the readmitted patients had additional cardiac surgery. Among readmitted, median length of stays were 10 days, with neonates staying twice as long as older children (14 days for neonates, 8 days for infants, and 7 days for older children, p < 0.001). Given the infrequency of hospital readmission, 1-year post-surgery total hospital costs were similar to costs observed during the index operation with neonates (median $196,362) having the highest hospital costs. Cumulative hospital costs for the nine stratified sub-groups also identified highest hospital costs among neonates (Fig 3).
Hospital readmissions and costs, one-year post-index surgical admission

Discussion
In our large, multi-centre cardiac surgery cohort, we identified variations in pre- and post-operative resource utilisation among and across age strata, with neonates contributing the longest index hospitalisation and greatest index hospital costs, 1-year and 5-year hospitalisation costs compared to infants and older children. The findings that neonates had lower daily hospital costs indicated longer length of stays were the primary driver of hospital costs. There were substantial age-related differences in resource utilisation categories; in most categories, neonates required higher costs across these categories. In long-term, post-operative follow-up, only neonates showed significant inpatient resource utilisation. Mortality declined among patients receiving surgery more recently, while surgical-related healthcare costs increased by year, mostly due to longer length of stays.
Interestingly, while daily hospital costs were higher among neonates with single ventricle diagnosis, we observed that those with simple two ventricle diagnosis had greater median overall hospital costs and longest post-surgery hospital stay than those with more complex two ventricle or single ventricle surgery. We postulate that many neonates with simple two ventricle diagnoses (e.g., ventricular septal defect) had important unmeasured (e.g., gestational age, low birth weight) comorbidities which prolonged the hospitalisation contributed to higher post-operative and overall index hospitalisation costs.
While Pasquali identified that children undergoing Society of Thoracic Surgeons’ benchmark operations had wide hospital cost variation, Reference Pasquali, Jacobs and He19 we identified no relationship between mortality, surgical volume, and median hospital costs from our long-term cohort follow-up.
Not surprisingly, pre-operative care represented relatively little overall resource burden as few patients were hospitalised pre-operatively. While neonates often required pre-operative ICU care, non-neonatal patients generally did not. In addition, the overall pre-operative length of stays for patients requiring pre-operative admission were much shorter compared to the post-operative hospitalisation. While neonates required overall higher pre-operative ICU-level care and had higher pre-operative costs, this was relatively low, suggesting that most were relatively “well” prior to surgical intervention. Our data confirmed findings from previous reports that neonates had more organ system dysfunction compared to non-neonatal subjects, which may increase overall care costs. Reference Brown, Ridout and Pagel31
We noted decreasing mortality over time coupled with slightly declining daily costs. This trend was observed with recent practice changes after single ventricle palliation with at least some post-surgical convalescent care occurring in the inpatient setting versus at home Reference McHugh, Pasquali, Hall and Schurer32 . In addition, as overall post-surgery mortality declined, patients are spending longer time in-hospital due to recovery from post-operative morbidities, narcotic weaning, and feeding difficulties. We identified that longer hospital length of stays may not always reflect long ICU-level care.
Our observation is that higher neonatal resource utilisation is consistent with previous reports. Neonates require more complex surgery with higher mortality rates. Reference Berger, Holubkov and Reeder33 As a result, neonates require more ICU care, including extracorporeal membrane oxygenation, mechanical ventilation, and intravenous therapies compared to older children. Reference Blinder, Thiagarajan, Williams, Nathan, Mayer and Kulik5,Reference Brunetti, Gaynor and Retzloff34 Our data are consistent with previous reports identifying that room and board was the principal CHD cost driver. Reference Burstein and Shamszad Pl12,Reference Pasquali, Jacobs and He19,Reference Huang, Schilling and Dalziel27,Reference Burstein, Li and Getz35,Reference Huang, Dalziel and Schilling36 Prolonged hospitalisation would increase utilisation of these expenditures. Neonates required more frequent rehospitalisation translating to 48 and 58% increase in cumulative costs at 1- and 5-year follow-up, compared to relatively insubstantial cost increases observed from infants (0%, 2%) and older children (0%, 0%) (data not reported). As neonates may require readmission following the index operation for surgical or catheter-based reintervention, as well as medical admissions for non-surgical needs, this finding is consistent with clinical practices. Healthcare costs incurred from these subsequent readmissions represent a substantial cost burden for both patient families and society.
Previous reports have suggested a relationship between hospital cardiac surgical volume and post-surgery mortality, that may in part be explainable by local surgical experience and post-operative standardised care practices. Reference Welke, Pasquali and Lin37–Reference Hirsch, Gurney, Donahue, Gebremariam, Bove and Ohye42 While we found substantial variation in hospital costs and mortality, we identified no discernible relationship between hospital volume, mortality and hospital costs. This may at least be partially explained by hospital variations in case-mix which we could not account for in this administrative database analysis.
Our analysis includes several important limitations. First, the Pediatric Health Information System database lacks detailed clinical information, limiting our ability to make important conclusions about the relationship between case-mix and outcomes, though we have used a limited classification scheme to identify anatomic complexity. Reference Burstein and Shamszad Pl12 While we can surmise parts of the clinical state based on resource utilisation (e.g., need for inotropes, mechanical ventilation or renal replacement therapies), we are unable to identify what role hemodynamic residua have in driving variations in hospital costs, resource utilisation and mortality. We lack important patient-level covariates, including prematurity, gestational age, and birth weight, which may influence clinical outcome, but are frequently missing from Pediatric Health Information System administrative data. Important hospital-level covariates influencing variations in costs, resource utilisation, and outcome may not have been captured. Deaths outside the hospital as well as deaths and hospitalisations at other hospitals could not be captured. Most patients with CHD die in-hospital and were exposed to significant medical technology in the ICU. Reference Morell, Wolfe, Schurer and Thiagarajan43,Reference Hollander, Dykes, Chen and Barkoff44 We lack data regarding resources consumed in the outpatient environment, which may make up a substantial fraction of overall healthcare resources consumed. Recent data found that higher inpatient costs were associated with greater outpatient resource utilisation in a large cohort after tetralogy of Fallot, though the outpatient costs were approximately 30%–40% of inpatient costs. Reference O’Byrne, Decost, Katcoff and Savla45 Due to our large cohort size, result interpretation should focus on the magnitude of estimated effect size (difference) rather than statistical significance (p value). Finally, we only have data from centres contributing to the Pediatric Health Information System database; while these tertiary hospitals encompass a substantial fraction of institutions in the United States where cardiac surgery occurs, the findings may not be generalised to other CHD centres.
Conclusions
By establishing one of the largest paediatric CHD surgical cohorts and following each patient’s hospital care for 5 years, we observed two important trends: an annual mortality rate reduction over the study period with a concomitant annual increase in CHD surgery costs. We identified several drivers associated with variations in hospital costs, including the role longer hospital length of stays may play in the observed hospital total cost increases. Neonates utilise the largest portion of inpatient hospital resources and consume substantial additional hospital resources after index hospital discharge due to subsequent hospital readmission. While there was hospital mortality and cost variation between institutions, we identified no discernable pattern among surgical volume, mortality, and hospital costs. Further analysis with more detailed clinical data merged with administrative data is necessary to understand factors driving variations in outcome, resource utilisation, and hospital costs among children undergoing cardiac surgery.
Supplementary material
To view supplementary material for this article, please visit https://doi.org/10.1017/S1047951122001019
Financial support
This research received no specific grant from any funding agency, commercial or not-for-profit sectors.
Conflicts of interest
Dr. Rossano reports consultant relationships with Amgen, Bayer, CSL Behring, Novartis. The remaining authors report no conflicts.
Ethical standards
The authors assert that all procedures contributing to this work comply with the ethical standards of the relevant national guidelines with the use of protected health information and with the Helsinki Declaration of 1975, as revised in 2008, and have been approved by the Children’s Hospital of Philadelphia Institutional Review Board.