INTRODUCTION
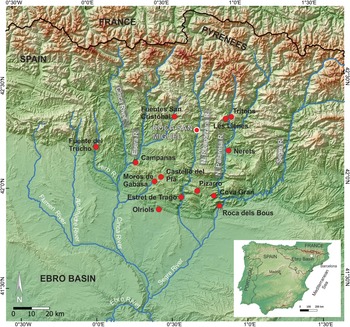
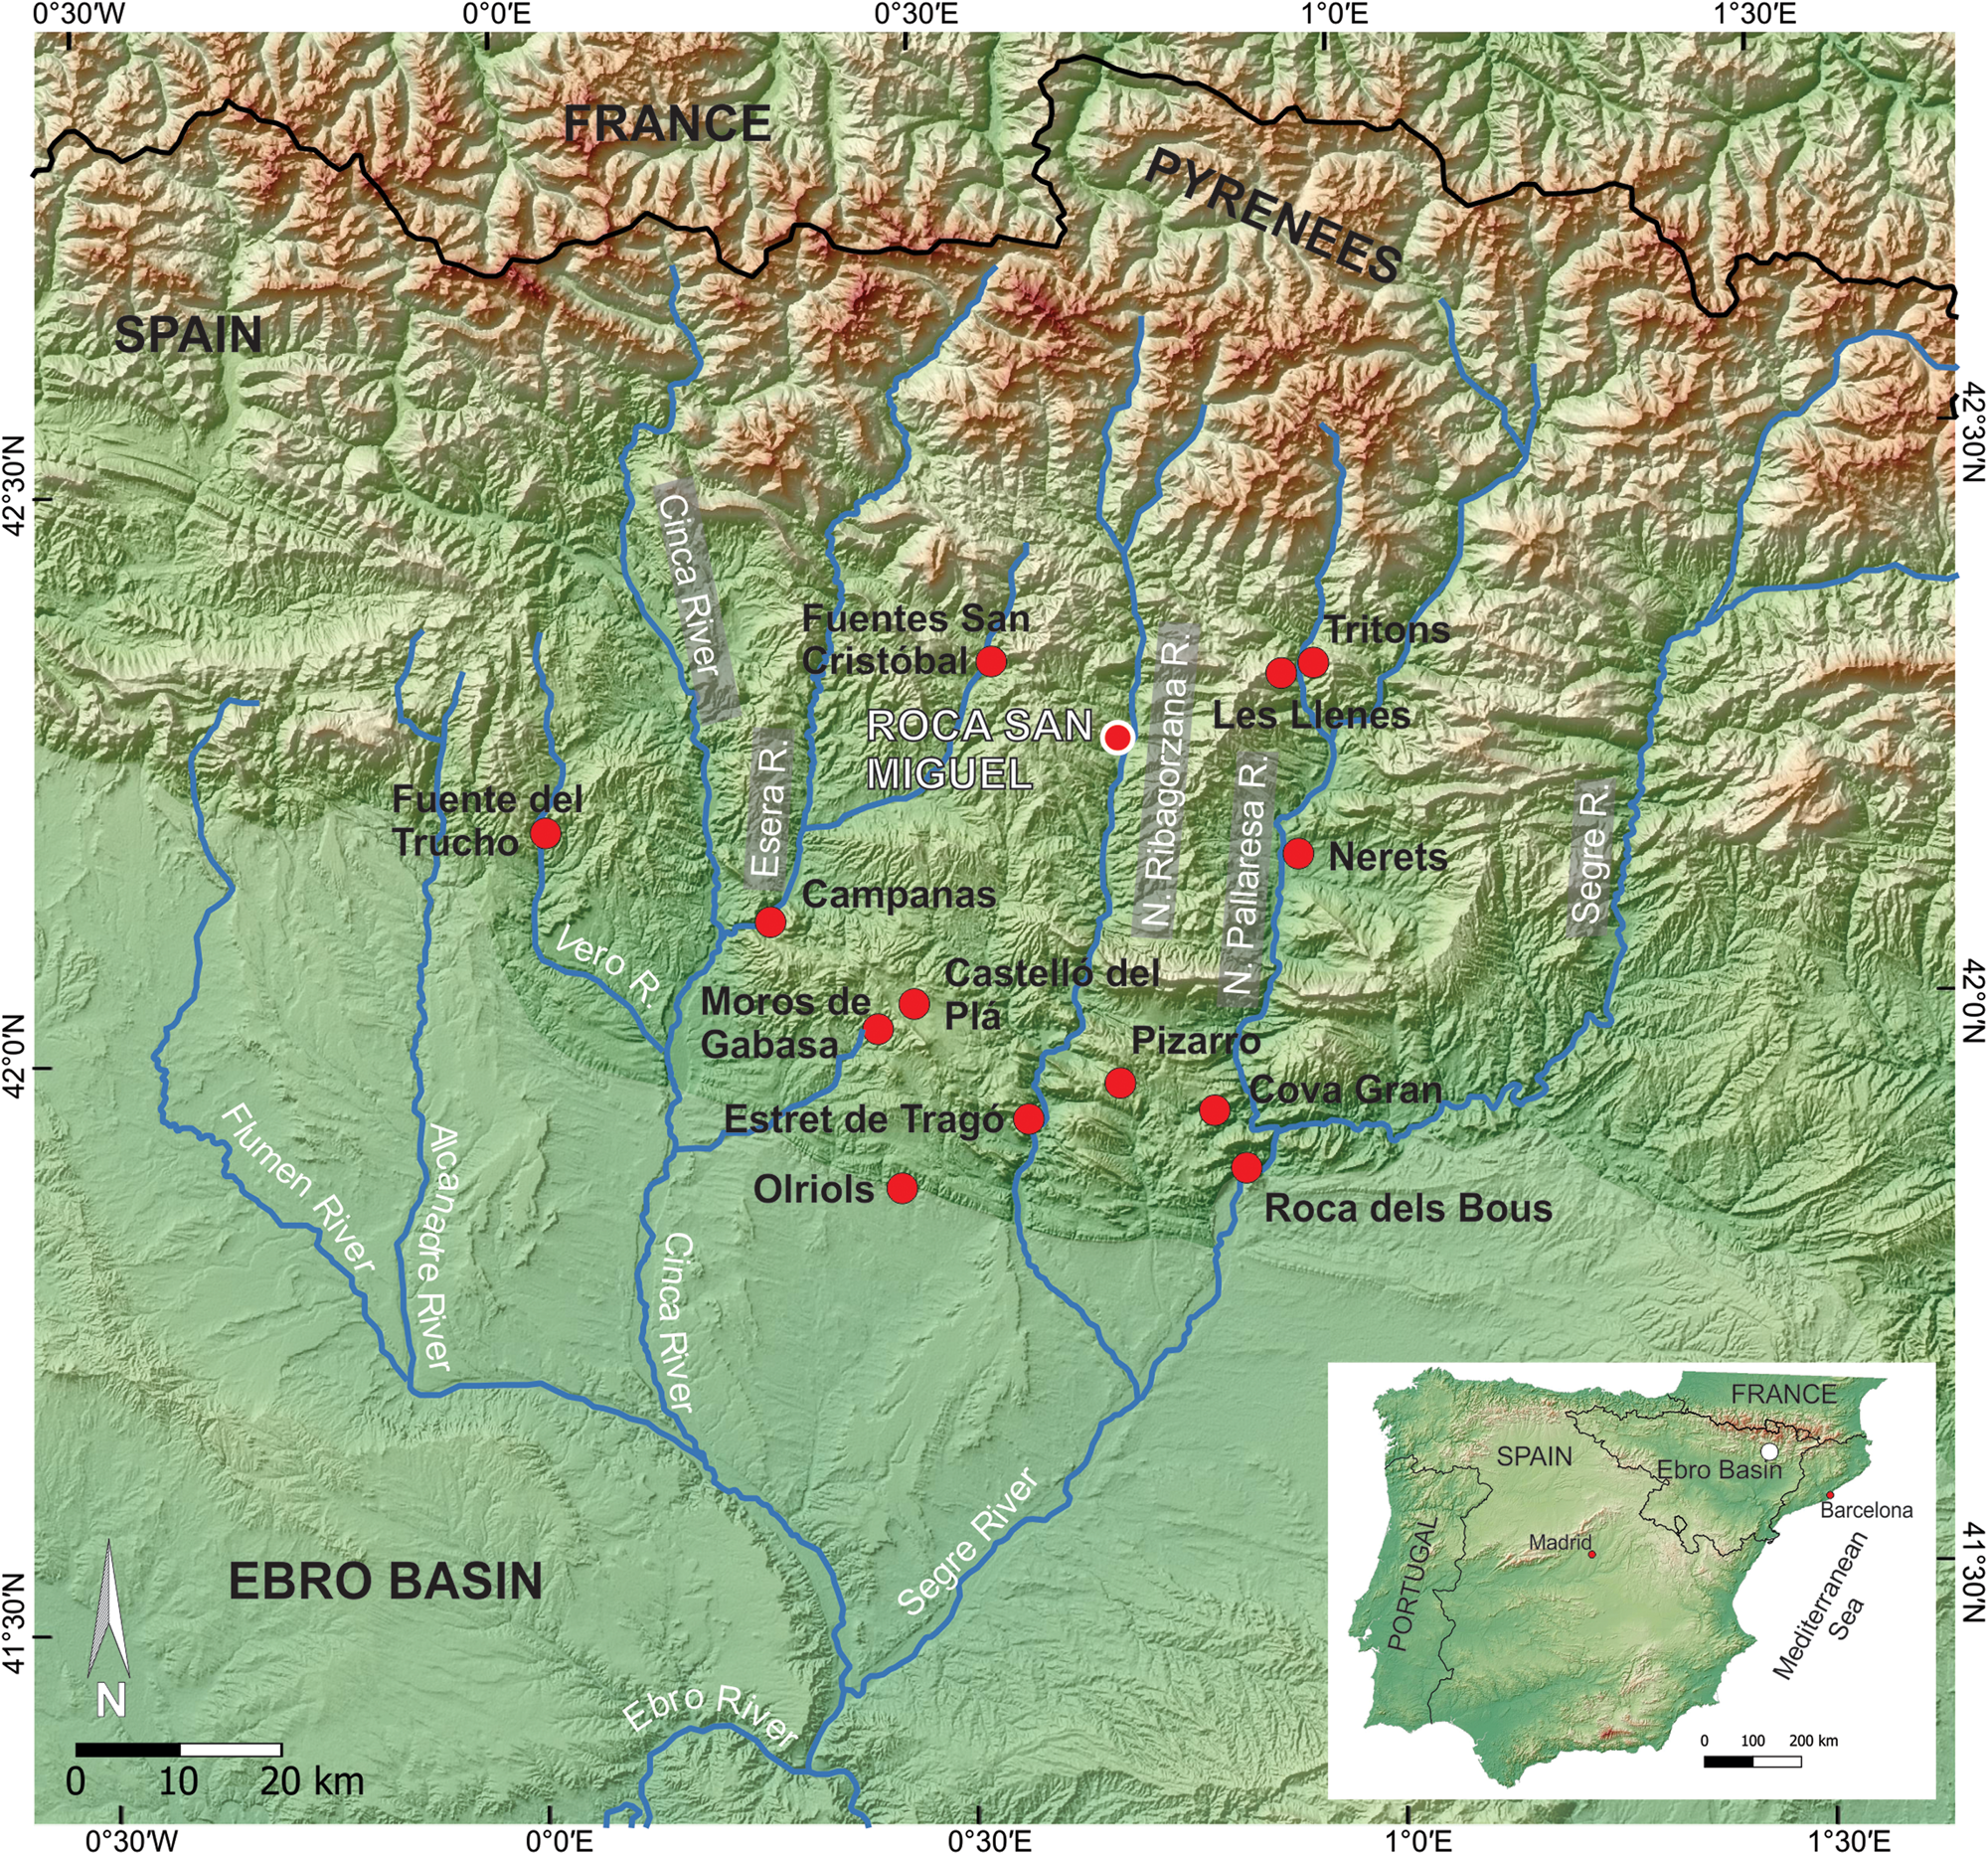
Neanderthal occupations in the south-central Pre-Pyrenees have, until now, only been found in the Cinca and Segre basins (Fig. 1). These rivers, along with their main tributaries (the rivers Vero, Ésera, Noguera Ribagorzana, and Noguera Pallaresa) act as communication corridors aligned N–S, and offer excellent locational opportunities because of karst lithologies that contain caves and rock shelters. These assets were taken advantage of by prehistoric groups and constitute easy landmarks for present-day archaeologists to look for their remains. Fourteen sites are known in this area (Fig. 1) with occupations extended between marine isotope stage (MIS) 6 and MIS 3. The chronological framework is still partially unknown; some of the available ages, such as those from Estret de Tragó (based on thermoluminescence [TL] dating), offer long intervals with accuracy that is far from reliable. Others, such as Cova Gran or Gabasa, have been dated using amino acid racemization (AAR), TL, and radiocarbon methods, and mostly seem to correspond to late Neanderthal times. As some authors have pointed out, these radiocarbon ages could only be taken as rough estimates because they are at the limits of the technique (Santamaría Álvarez and De la Rasilla Vives, Reference Santamaría Álvarez and De la Rasilla Vives2013), particularly if we consider that almost all the samples were analyzed before the year 2000 when the ultrafiltration procedure was introduced. Concerning Middle Paleolithic occupations, the Segre-Cinca basin area is a well-known territory, but we must remember that these 14 sites cover a prolonged timespan, and the information they offer is nonuniform (Montes, Reference Montes1988; Blasco, Reference Blasco1995; Martínez-Moreno et al., Reference Martínez-Moreno, Mora and Casanova2004, Reference Martínez-Moreno, Mora, Roy Sunyer and Benito-Calvo2016; Montes et al., Reference Montes, Utrilla and Martínez-Bea2006, Reference Montes, Domingo, Peña-Monné, Sampietro-Vattuone, Rodríguez-Ochoa and Utrilla2016; Utrilla et al., Reference Utrilla, Montes, Blasco, Torres and Ortiz2010; Montes and Utrilla, Reference Montes, Utrilla and Sala Ramos2014; Vega et al., Reference Vega, Samper Carro, Pizarro Barberà, Mora, Martínez-Moreno and Benito-Calvo2015; Mora et al., Reference Mora, Martínez-Moreno, Roy, Benito-Calvo, Polo and Samper2018). Only a few sites have had contextual studies that allowed the establishment of paleogeographical and paleoenvironmental relationships, including Olriols (Montes et al., Reference Montes, Domingo, Peña-Monné, Sampietro-Vattuone, Rodríguez-Ochoa and Utrilla2016), Estret de Tragó (Martínez-Moreno et al., Reference Martínez-Moreno, Mora and Casanova2004), Cova Gran de Santa Linya (Mora et al., Reference Mora, Benito-Calvo, Martínez-Moreno, González-Marcén and de la Torre2011, Reference Mora, Martínez-Moreno, Roy, Benito-Calvo, Polo and Samper2018; Polo-Díaz et al., Reference Polo-Díaz, Benito-Calvo, Martínez-Moreno and Mora Torcal2016), and Roca dels Bous (Benito-Calvo et al., Reference Benito-Calvo, Arnold, Mora, Martínez-Moreno and Demuro2020).
Location map of the Roca San Miguel (RSM) site and other Middle Paleolithic sites in the Spanish Pre-Pyrenean zone. N. = Noguera.
The study of the Pleistocene on the southern Pyrenean side and the central sector of the Ebro Basin has grown in importance. More accurate maps of the fluvial terraces and age estimates of fluvial, glacial, and related deposits using radiocarbon, optically stimulated luminescence (OSL), and cosmogenic exposure dating have become available, together with the establishment of correlations in wide fluvial basins. Therefore, there has been considerable research on the fluvial terraces and related deposits in the Segre-Cinca basin (Peña |Monné, Reference Peña Monné1983, Reference Peña Monné1988; Peña Monné and Sancho, Reference Peña Monné and Sancho1988, Reference Peña Monné, Sancho, Turu and Constante2011; Sancho, Reference Sancho1991; Sancho et al., Reference Sancho, Peña Monné, Lewis, McDonald, Rhodes, Colombo, Liesa, Meléndez, Pocoví, Sancho and Soria2004, Reference Sancho, Calle, Peña-Monné, Duval, Oliva-Urcía, Pueyo, Benito and Moreno2016, Reference Sancho, Arenas, Pardo, Peña-Monné, Rhodes, Bartolomé, García-Ruiz and Martí-Bono2018; Turú and Peña Monné, Reference Turú, Peña Monné, Pérez-Alberti and López-Bedoya2006a, Reference Turú, Peña Monné, Pérez-Alberti and López-Bedoyab; Lewis et al., Reference Lewis, McDonald, Sancho, Peña-Monné and Rhodes2009; Peña Monné et al., Reference Peña Monné, Turu, Calvet, Turu and Constante2011; Calle et al., Reference Calle, Sancho, Peña-Monné, Cunha, Oliva-Urcía and Pueyo2013; Stange et al., Reference Stange, Van Balen, Carcaillet and Vandenberghe2013a, Reference Stange, van Balen, Vandenberghe, Peña-Monné and Sanchob).
Inside this framework of Quaternary evolution and Middle Paleolithic occupations in this Pre-Pyrenean area, the main objective of this paper is to provide information about the Roca San Miguel (RSM) archaeological site. The RSM Mousterian site is now an open-air location in the Pre-Pyrenean Ranges in the province of Huesca (NE Spain), close to the village of Arén (Areny), at 671–677 m above sea level (asl) (Fig. 1). It is situated 46–52 m above the present Noguera Ribagorzana River channel, part of the Segre-Cinca basin, a tributary of the Ebro River. The specific objectives for this study are to: i) reconstruct the original morphology of the site, determining whether it was a rock shelter or an open-air campsite; ii) show the present stratigraphy of the site where lithic and bone materials have been found; iii) locate the site within the general evolution of the valley during the Pleistocene using geomorphological records available from its surroundings and the site itself; iv) reconstruct geomorphological elements and paleoenvironmental characteristics; v) establish a chronological framework of the occupational period and its later evolution using OSL and U/Th ages; vi) explore the spatial, cultural, and chronological relationships with other Pyrenean archaeological sites of the same cultural characteristics; vii) frame the obtained information within the chronology of the central and southern Pyrenean valleys through fluvial terrace sequences and related glacial deposits; and viii) relate these data to global environmental changes.
GEOLOGICAL AND GEOGRAPHICAL SETTINGS
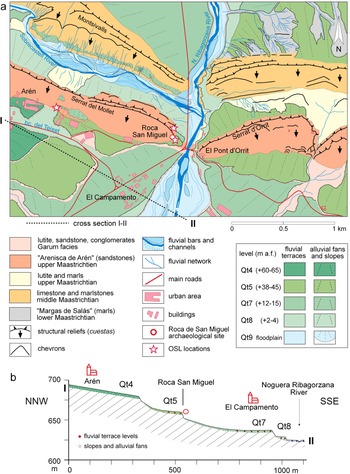
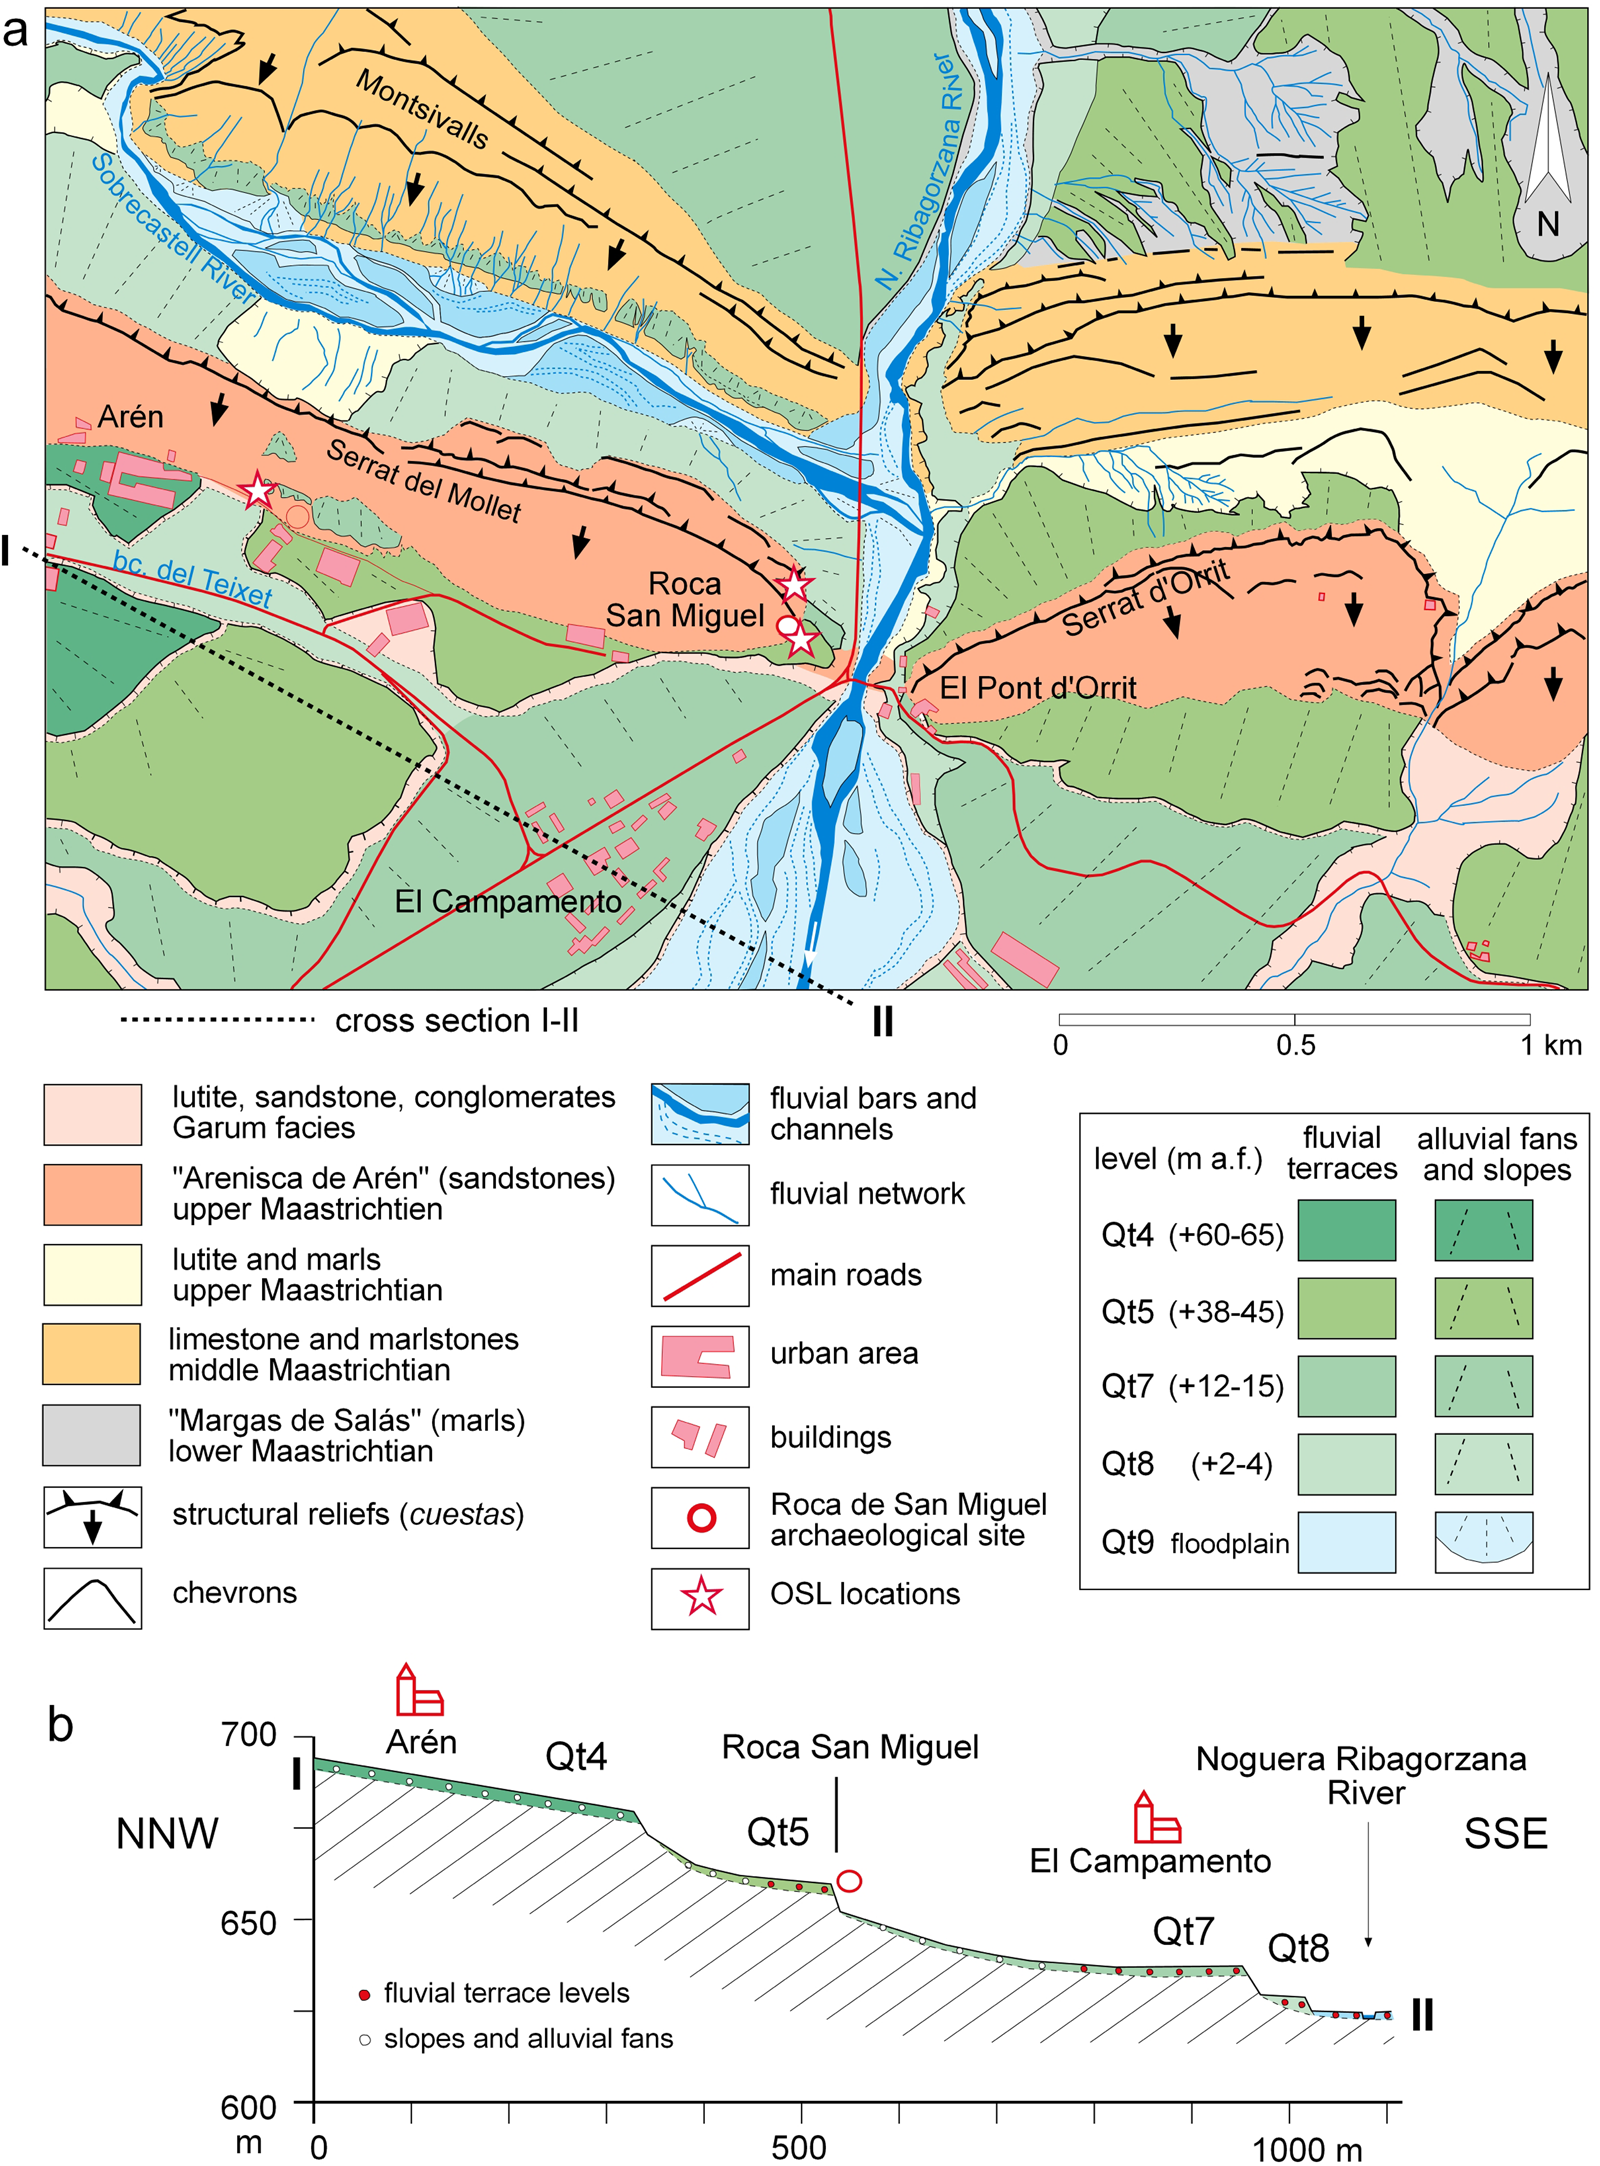
Geologically, the Arén sector is within the South Pre-Pyrenees Ranges (Fig. 2a) and is characterized by great structural simplicity. Upper Cretaceous–Paleocene–Eocene units are ordered in W–E oriented monoclines following the Pyrenean structural trends, with dips between 25–40° S to SSW. The Mesozoic–Eocene sedimentary basin is formed by lithologies of highly contrasting hardness (López Olmedo and Ardévol, Reference López Olmedo and Ardévol1994; Samsó et al., Reference Samsó, Cuevas, Mercadé, Arbués, Barberá, Corregidor, López Blanco and Salueña2010, Reference Samsó, García Sainz, Mateos, Tallada and Copons2012) and this has led to development of a succession of aligned cuestas formed by more-resistant materials separated by open depressions formed in the softer and more-erodible interbedded materials. In addition, large accumulations of Oligocene conglomerates, discordant over the Pyrenean structures, are preserved in the high divides of the valley of the Noguera Ribagorzana River (Llarás, l'Estall, and Sis mountains). These detrital materials have been partially eroded by the fluvial network, exposing the structural reliefs (Peña Monné, Reference Peña Monné1983).
(a) Geological and geomorphological map of the Noguera Ribagorzana River valley in the areas of Arén, the RSM site, and the OSL dating locations; (b) cross-section of the fluvial terrace system of the Noguera Ribagorzana River. a.f. = above floodplain.
According to the Köppen-Geiger classification, the current climate is classified as temperate oceanic (Cfb), without a dry season and with a temperate summer. The weather station at Arén (668 m asl) records a median annual temperature of 11.2°C; and monthly average temperatures vary between 3.1°C (January) and 19.9°C (July). Annual average rainfall is 784 mm, with maxima between May and June and also during autumn. The Noguera Ribagorzana River has pluvio-nival characteristics. It has a gauge station ~7 km north of Arén (Sopeira) where mean annual flows are about 15.7 m3/s, with maximum flows beginning in March, then reaching their highest levels in June–July. This is due to the addition of rain and snowmelt in the headwater reaches.
METHODOLOGY
Archaeological fieldwork at the RSM site was performed between 2013 and 2019. The excavation grid was oriented according to the natural slope of the hillside and focused on three undisturbed areas. Sediments were removed in 5-cm-thick horizontal layers. A Leica total station was used to register the largest (>2 cm) and most relevant remains (>5000 elements), while the remainder was recovered in 33×33×5-cm units after sieving with water. The main stratigraphic units were named A to E, while archaeological levels within these stratigraphic units were identified by relative location (S: upper trench; M: middle trench), main composition (C: cobbles; P: pebbles, A: sands, L: silts), and layer color (R: red; N: orange; B: white).
A detailed geomorphological map of the study area was drawn following the criteria proposed by Peña Monné (Reference Peña Monné1997) and using aerial photographs (National Flights 1983–1987; http://centrodedescargas.cnig.es/), cartographic information (Peña Monné, Reference Peña Monné1983), Plan Nacional de Ortofotografía Aérea (PNOA) orthoimage series 2018 (Instituto Geográfico Nacional–Spain; http://centrodedescargas.cnig.es/), and lithological information (IGME, 1993; ICGC, 2012). Geological and geomorphological information was field surveyed and georeferenced with a Trimble Geoexplorer GNSSS GPS. All information was processed in QGIS 3.14 (https://www.qgis.org/es/site/).
Five samples were taken from the sandy layers of the archaeological site and its surrounding deposits for mineralogical analyses to identify mineralogical composition and provenance. Samples were taken from the upper excavation trench (RSM-1), fluvial terrace Qt5 (38–45 m above riverbed) near the site (RSM-Qt5), intermediate layers of the debris slope (RSM-P1), sandy layers of Arén (RSM-P2), and sandstone from the Arén Formation (RSM-R1). Petrographic thin sections were prepared in the laboratory of the Departamento de Geología y Geoquímica (Universidad Autónoma de Madrid) and analyzed with an Orto Plan POL ZEISS petrographic microscope. Mineral identification was made following the criteria of Kerr (Reference Kerr1965), Uytenbogaardt and Burke (Reference Uytenbogaardt and Burke1971), and MacKenzie et al. (Reference MacKenzie, Donaldson and Guilford1991).
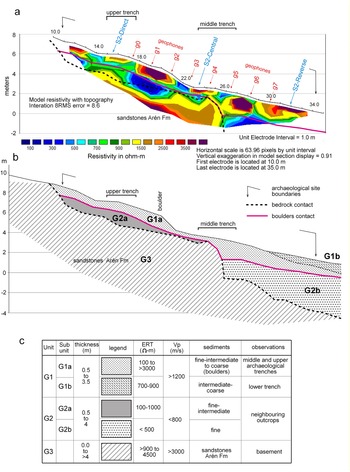
Geophysical data were acquired during field surveys in 2020, including resistivity and seismic refraction to ensure the depth of the geological contacts. For resistivity, 2D electrical resistivity tomography (ERT) data were collected using a 64-channel resistivity meter with 1 m and 2 m electrode spacing. Four profiles were recorded with lengths of 48 m and 26 m (ERT1 and ERT2, respectively). The final field data set showed good quality recording with average measurement errors of ~10% (Loke and Barker, Reference Loke and Barker1996; Loke et al., Reference Loke, Wilkinson and Chambers2010). The seismic refraction profile was performed using longitudinal seismic waves (P-waves). The profile was located across the archaeological site and its upper and lower margins. A multichannel recorder was used to obtain the electrical signals coming from vertical component geophones that are specifically designed to detect mechanical waves of ~50 Hz. Seismic waves were generated using a 6 kg hammer on a metal plate (Sheriff and Geldart, Reference Sheriff and Geldart1991).
Nine samples were dated by OSL. Six samples were taken from different stratigraphic levels of the upper (RSM-S1 to RSM-S3) and middle trenches (RSM-M1 to RSM-M3) during the excavations. Two samples were taken from the sandy layers located close to Arén village (AREN-1, AREN-2), and one sample was taken from the Qt5 fluvial terrace close to the archaeological site (AREN-3). All samples were collected using steel and PVC tubes. Quartz grains with diameters of 180–250 μm were extracted from each sample using standard methods under light-controlled conditions (Wintle, Reference Wintle1997). The resulting fraction was then treated with HF to remove any remaining feldspar and to remove the outer layer of the quartz grains. Equivalent doses were estimated from the OSL signal of 24–48 aliquots per sample (Galbraith et al., Reference Galbraith, Roberts, Laslett, Yoshida and Olley1999). Total dose rates were based on the radionuclide activity concentrations derived from high-resolution gamma spectrometry measured on ~100 g of bulk material from the sediment matrix of each sample (Table 1a). Estimated equivalent doses, total dose rates, and derived ages are summarized in Table 1b.
Analysis of samples from the Roca San Miguel (RSM) site. (a) Radionuclide concentration derived from high-resolution gamma spectrometry measured at the Radioisotopes Unit of the University of Sevilla (RDI US). A water content of 10 ± 5% is considered representative of burial duration. Cosmic contribution has been determined according to burial depth (Prescott and Hutton, Reference Prescott and Hutton1994). (b) Optically stimulated luminescence (OSL) ages for the RSM site and its immediate surroundings; total dose rate calculated considering attenuation for water content as reported in (a); CL = University of Cologne; RDI = University of Sevilla. Qt5 = fluvial terrace Qt5 of Peña Monné (Reference Peña Monné1983). See text for detailed description of sample sites, stratigraphic units, and archaeological levels. (c) U–Th data from samples from a speleothem/flowstone found in the upper trench adjacent to the detrital sequence. Samples analyzed at the University of Minnesota (= AR); M = middle of the dated carbonate layer; B = bottom of the dated carbonate layer.

A flowstone was discovered in the upper trench lying to the side of the detrital sequence. The flowstone was extracted, and two ~70 mg samples (AR-B and AR-M) () were taken along the growth axis for U/Th dating. The samples were analyzed in the laboratories of the University of Minnesota (USA). After chemical separation (Lawrence Edwards et al., Reference Lawrence Edwards, Chen and Wasserburg1987), measurements were conducted using a Neptune Thermo Finnigan ICP-MS multicollector, following the method described by Cheng et al. (Reference Cheng, Lawrence Edwards, Shen, Polyak, Asmerom, Woodhead and Hellstrom2013). Uranium concentration in the samples ranged between 117–166 ppb, while detrital thorium (232Th) was relatively low and provided accurate ages (Table 1b).
RESULTS
Geomorphological context of the RSM site
The geological and geomorphological map (Fig. 2a) shows the main geological and landscape morphologies surrounding the RSM archaeological site. The main geomorphological relief in the area is characterized by two parallel cuesta cuts near the Noguera Ribagorzana River. The front of the northern cuesta (Serrat de Montsivalls –Obaga de Orrit) is composed of middle Maastrichtian limestones and an accumulation of Margas de Salás Formation marls covered by Quaternary deposits (Fig. 2). The southern cuesta (Serrat del Mollet–Serrat d'Orrit) is formed of sandstone and calcarenites of the Arén Formation (Arén Sandstone) which is upper Maastrichtian in age. The cuesta dips 30–35° to the south and the upper part presents as an abrupt scarp (Fig. 2a). The north foot of the cuesta is formed of a talus, composed of bluish lutites and marls of the end Maastrichtian–Paleocene, descending toward the Sobrecastell River.
The Roca San Miguel archaeological site occupies the end of this cuesta alignment formed by the Areniscas de Arén (upper Maastrichtian) and very near to the Noguera Ribagorzana River (Fig. 2a). The Arén Formation is composed of quartzitic sandstone with fine grains and abundant bioclasts, as well as coarser sand and also microconglomerate interbeds (Ghibaudo et al., Reference Ghibaudo, Morelli, Mutti, Obrador, Pons, Ramasco and Rosell1973). These sediments were interpreted as being deposited in a deltaic front environment (López Olmedo and Ardévol, Reference López Olmedo and Ardévol1994). Close to the RSM site, the Arén Formation displays some dinosaur ichnites (Canudo et al., Reference Canudo, Barco, Cuenca-Bescós, Ruiz-Omeñaca and Cruzado2005). The cuesta backslope is formed by resistant layers of sandstone, showing incisions made by small ravines formed by a combination of the rock fracture network and weathering. At the foot of the cuesta, the sandstone is in contact with the lutites and marls of the upper Maastrichtian-Paleocene, barely exposed due to the thick detrital Quaternary covering.
The tributary creeks (Sobrecastell, Solá, del Teixet, Orrit) flow over soft materials (marls), increasing the prominence of the cuesta reliefs and promoting the formation of landslides, debris flows, and badlands. The main valley is mostly covered by different levels of Quaternary fluvial terraces of the Noguera Ribagorzana River and several of its main tributaries, together with slopes and alluvial fans coming in from the sides.
Stratigraphy and chronology of the archaeological site
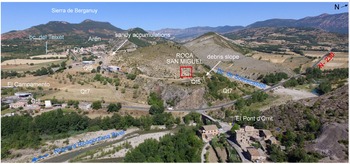
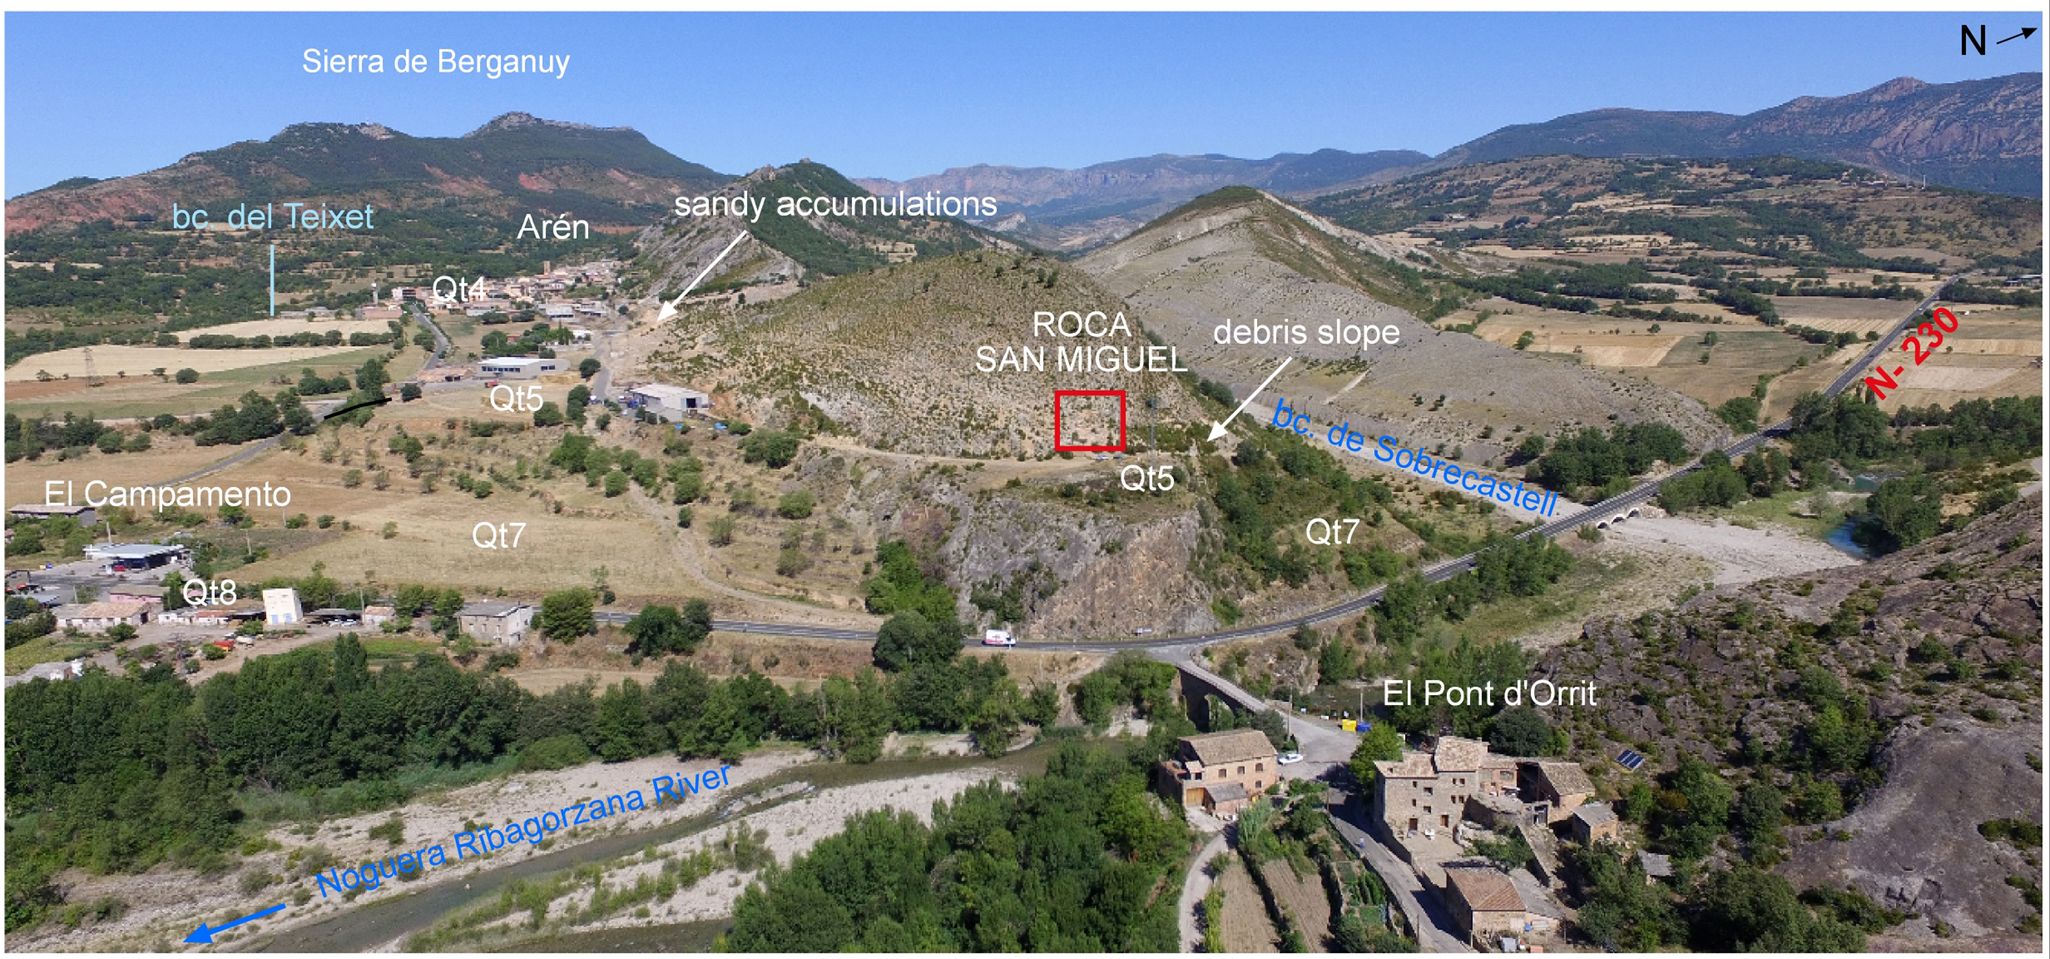
The archaeological site is currently an open-air deposit, located on the east-facing slope of the Roca San Miguel (Figs. 2a, 3) and is subject to natural erosion processes that are increased by its steep gradient. The site is bordered by two sandstone layers of the Arén Formation, forming a depression resulting from the erosion of the bedrock where the archaeological deposit is preserved (Fig. 3). We infer that those sandstone strata were larger when the site was occupied by Neanderthals, forming a rock shelter oriented to the north.
Aerial view of the RSM archaeological site in the geomorphological framework of the Noguera Ribagorzana River. The main geomorphologically analyzed features in the surroundings indicated on the photo are fluvial terraces (Qt4, Qt5, Qt7, Qt8), debris slope, and sandy accumulations.
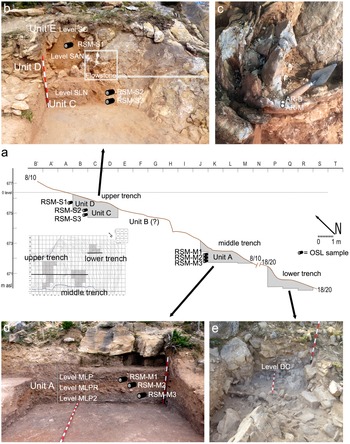
Archaeological fieldwork at RSM was conducted in three trenches (Fig. 4a). The lower trench shows an unsorted sedimentary filling, with large (40–100 cm) slope blocks (DC level in Fig. 4e). Among the abundant clasts of the deposit there are many remains of vertebrates, such as generally well preserved long bones, teeth, and mandibles of large herbivores (i.e., bovids, horses, ibex, and deer), as well as some lithic elements. We interpreted this as a slope deposit that was only slightly displaced from anthropic occupational areas located further up the slope because there are bone remains that are relatively lightly fractured. The deposit characteristics indicate transportation processes, mainly creep and solifluction. Due to the coarse sediment, the deposit was not sampled for OSL dating. We cannot ascertain the stratigraphical relationships between this lower trench and the other two excavated areas.
(a) Topographic profile of the archaeological area showing the stratigraphy and location of OSL samples; (b) stratigraphical units, archaeological levels, and location of OSL samples in the upper trench; (c) flowstone detail and location where U/Th samples were taken (AR-B, AR-M); (d) Unit A levels and samples in the middle trench; (e) lower trench showing level DC. See text for detailed descriptions of units and stratigraphy.
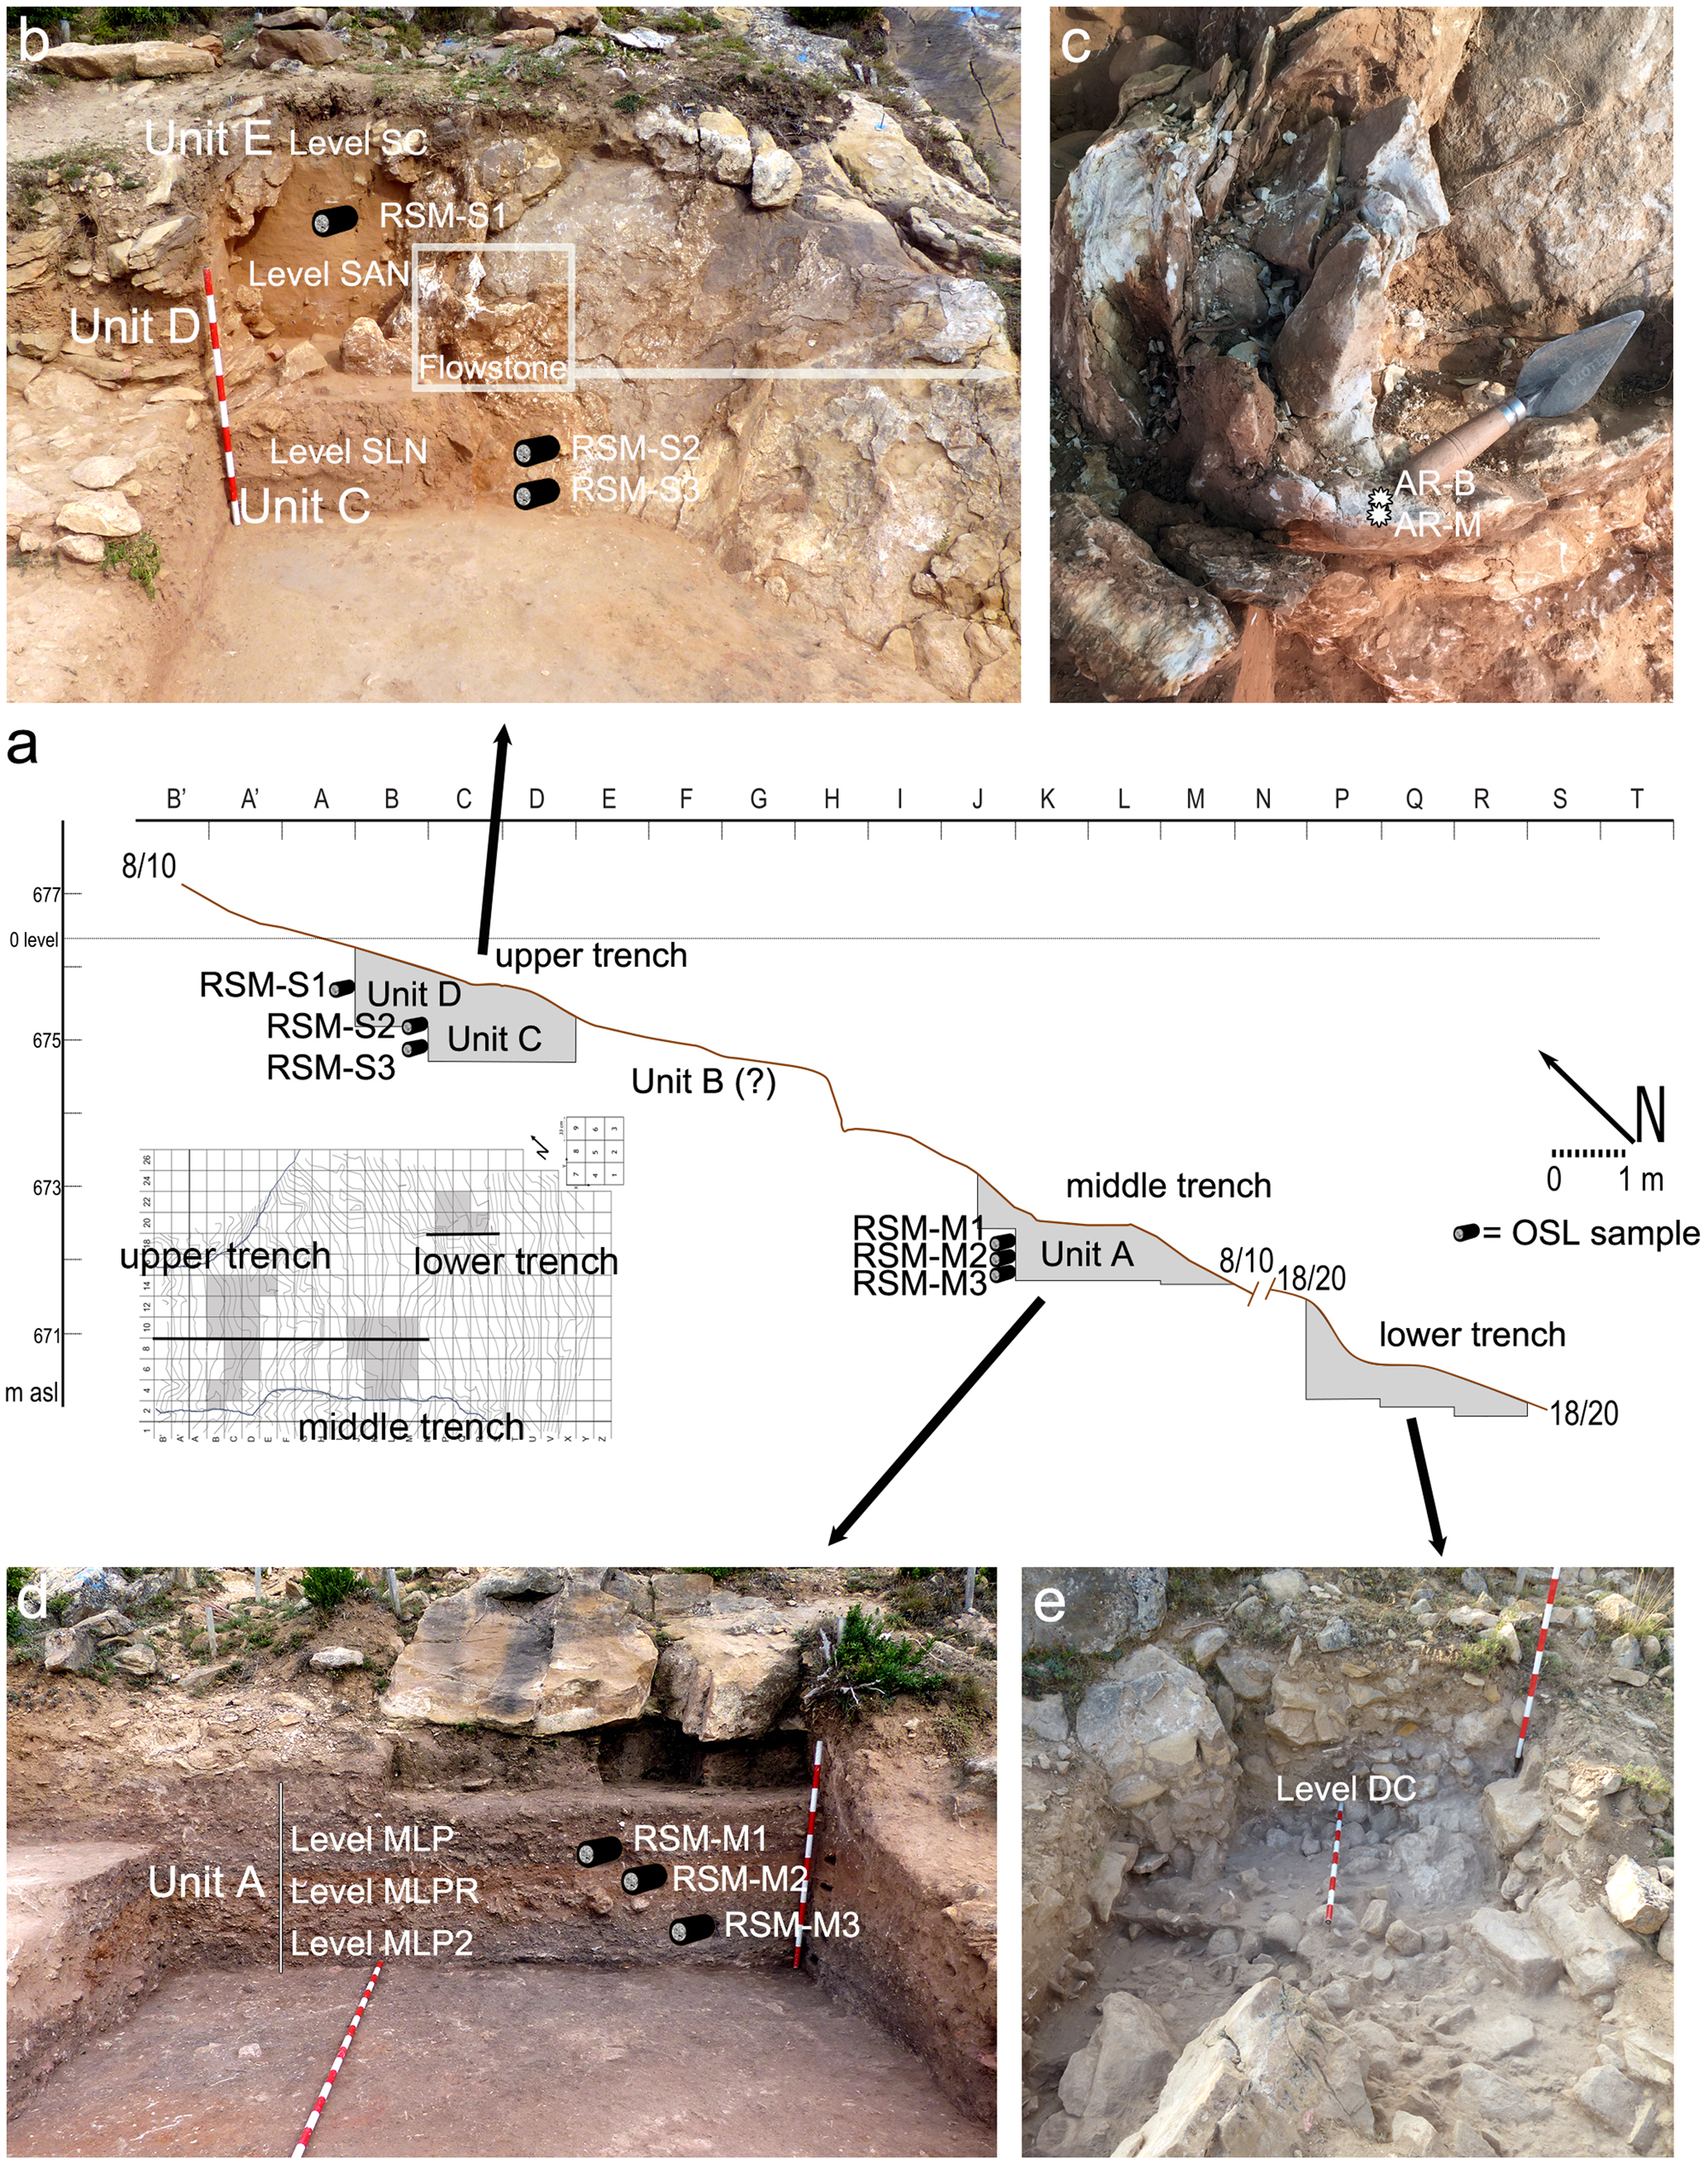
In the middle trench (Unit A; Fig. 4a, d), the sediment is a coarse sand with clasts from 3–15 cm, and is very compacted and indurated due to the abundance of carbonate. During the excavations, several layers of hearths and ashes were documented. Unit A here has a maximum thickness of 100 cm. In the trench, three archaeological levels have been identified by their colors: a lower dark level (MLP2) up to 25 cm; a middle level (MLPR) that is reddish in color and ~30 cm thick; and an upper dark level (MLP) that is ± 35 cm thick (Fig. 4d). Based on their structure, composition, and features, these levels seem to correspond to wide hearths that occupied an area of at least 12 m2, reflecting successive phases of occupation and abandonment. A thick, whitish crust only appears close to the rocky side of the trench. The different levels of Unit A contain a high proportion of small stones, lithic elements, and bone splinters that are fragmented and reveal different degrees of cremation. The burned bones might be the result of residue thrown into the fire to clean the area, but could also have been employed as fuel (Sola et al., Reference Sola, Ramírez and Martínez2016). Three samples from Unit A were OSL dated. The deepest sample (RSM-M3 from MLP2) was dated to 169.6 ± 9.1 ka; an overlying sample (RSM-M2 from MLPR) yielded an age of 160.1±14.3 ka; and sample RSM-M1, taken in the base of the MLP level, gave an age of 151.9±11.1 ka (Table 1b).
The upper trench, formed by the stratigraphic units C, D, and E (Fig. 4a, b), corresponds to three archaeological levels (SLN, SAN, and SC, respectively) and the maximum excavated thickness reached 165 cm. From the bottom of Unit C to the top of Unit A (of the middle trench), the temporal gap between the OSL dates enables us to infer the presence of a sedimentary unit corresponding to a hypothetical Unit B. Unit C is formed from very fine silt (archaeological level SLN) and reaches 70 cm in thickness (Fig. 4a, b). The Unit C would correspond to a prehistoric occupation due to abundant anthropic remains of both lithics and bones, even if no signs of fire or structures have been found. This unit, as well as the following Unit D, contains some decimeter-sized blocks, fallen from the inferred ancient sandstone shelter, which tend to lie horizontal. Two samples for OSL dating were taken (RSM-S3, RSM-S2), yielding ages of 118.9 ± 11.5 and 103.4 ± 6.9 ka respectively (Fig. 4b; Table 1b).
Overlying Unit C, Unit D is formed by sandy, orange-colored sediments (archaeological level SAN, Fig. 4b), with a thickness of up to 50 cm. One sample of the sands at this level (RSM-S1) was OSL dated to 81.2 ± 4.7 ka (Table 1b). Both units, C and D, are covered by a slope deposit of large-sized clasts (20–60 cm; Unit E) that correspond to the archaeological level SC; and are parallel to the slope. The thickness of the layers varies from ± 110 cm (filling previous erosive channels) to barely 20 cm in places where the layers have been eroded. Neither SAN nor SC belong to in situ human occupations, although they include some lithic remains from the erosion of the now-missing deposits farther up on the slope.
While working on the archaeological dig in this upper sector of the site, a 12-cm-thick flowstone was discovered attached to the sandstone (Fig. 4c). A dense outer fragment was taken to be dated by U/Th, and three subsamples were extracted, one of which had a low 230Th/232Th atomic ratio and was considered a poor dating target due to the presence of detrital thorium and high porosity. Uranium concentration in samples AR-B and AR-M ranged between 117–166 ppb, while detrital thorium (232Th) was relatively low; therefore these samples should yield accurate ages. The flowstone covers the period between 129.2 ± 1.5 and 123.6 ± 0.6 ka (Table 1c). These U/Th ages fit with the OSL ages of the sediments from the site (119 to 81 ka, Table 1c).
Archaeological remains
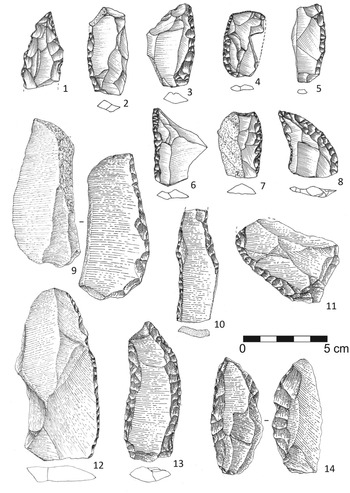
During archaeological fieldwork, 5171 remains were recovered and georeferenced with a total station, as well as 10 charcoal fragments, all from the MLPR level. In addition to these remains, several thousand smaller objects were recovered by sieving. The archaeological material recovered is mainly composed of faunal and lithic remains (Fig. 5; Table 2). In-depth analysis of these archaeological remains has only begun recently; therefore, we can only offer limited data.
Lithic materials (1–11) from SLN level in the upper trench (Unit C); (12–14) from MLP level in the middle trench (Unit A). Lithics present classic Mousterian features and the raw material only seems to affect only size. (1) A Tayac point in chert; (2–8) different types of sidescrapers; and (9–14) larger sidescrapers in other raw materials. According to Bordes typology, sidescrapers are mainly simple (2–7, 12), déjeté (8, 11), double (10, 13), on the inverse side (9), or with a thinned back (14).

Archaeological remains distribution by type and levels. Please see text for details regarding levels and trench locations. RS = surface remains of the whole site. In the upper trench, the remains of the non-anthropic SC and SAN levels are grouped together.

Preliminary scrutiny of the lithic elements recovered at RSM shows that 35% of the lithic remains (Table 2) were made from chert (this proportion varies between ~20% and 50% among the occupational levels), while the rest are composed of other rocks (hornfels, ophite, and quartzite) that could be obtained from the riverbed or the fluvial terraces at the foot of the site. All the chert remains can be ascribed to a single variety that outcrops about 7 km to the north of the site in limestone cliffs (Pardina Formation, Sánchez de la Torre and Mangado, Reference Sánchez de la Torre and Mangado2016) where the Sopeira dam (42°18′45″N; 0°44′35″E) currently stands. The chert is gray and fine-grained, and contains frequent orthogonal fractures as well as voids and geodes that limit the technical processes and the maximum tool size that could have been produced. Consequently, larger elements were systematically knapped using other rocks; on average, they are 35% longer, 54% thicker, and 50% wider than the chert pieces.
Knapping strategies also varied according to the raw material: in the search for the best flakes, chert seems to have been knapped by non-systemic extractions, conditioned by morphology, failures, and the smallness of the nodules; while volcanic or metamorphic rocks were often knapped by a recurrent centripetal production system (discoid cores) that took advantage of the good quality of these local raw materials. These materials were exploited in situ and reveal all the chaîne opératoire steps at the site. Levallois knapping is uncommon, although some flakes and cores have been found. Finishing and retouching also took place in situ, chert being preferred for making retouched tools in a ratio of three to one. The most common pieces are sidescrapers with an extremely wide range of types, followed by denticulate tools, and some Mousterian and Tayac points (Fig. 5). Some macro-tools, such as chopping tools and hammers, have also been found. All the techno-typological features fit well with Mousterian technocomplexes, and currently we cannot identify differences between the tool sets from the A and C units (Fig. 5).
This similarity does not apply to the faunal remains. Although the taxonomic determination by species is still unfinished, the bone distribution by levels presents marked differences in terms of the number and type of remains (Table 2). In the middle trench, the faunal share is high: in the MLP2 and MLPR levels, osseous remains are ~33%, and in the highest MLP level, they are up to almost 60%. In all three subunits, the features are the same: hundreds of very small bone splinters, with most showing obvious signs of having been directly affected by fire after being defleshed (Sola et al., Reference Sola, Ramírez and Martínez2016). In the SLN level of the younger upper trench, bone remains are minor compared to lithics (10% versus 90%), and are mostly splinters of unburned long bones, although some butchery marks (scratches) of anthropic origin have been detected. The richest and best preserved set of bones is from an undated DC level (lower trench), where faunal remains exceed 63%. The remains do not present thermal alterations, even though some show butchery scratches, and there are many well-preserved bones and teeth that enable the identification of the taxon and species. In this level, red deer, horse, and ibex remains are most common, although the thickness of some diaphysis fragments suggests the presence of large bovids as well.
Paleogeographic and paleoenvironmental information derived from surrounding Quaternary deposits
Given the limited extension of the archaeological excavations, other sedimentary records from the surrounding areas including the Noguera Ribagorzana River terraces, debris slope deposits, and nearby sandy accumulations, were surveyed to complete the paleoenvironmental and chronological framework of the site.
Fluvial terraces and debris slopes
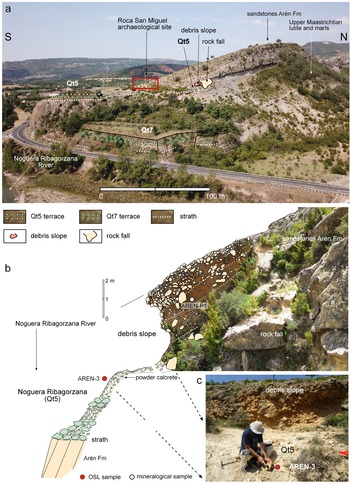
Several outcrops of fluvial terraces occur near the archaeological site. In the general terrace system of the Noguera Ribagorzana River, Peña Monné (Reference Peña Monné1983) identified the following terrace levels above the present floodplain: + 85–90 m (Qt3), + 55–60 m (Qt4), + 38–40 m (Qt5), + 18–20 m (Qt6), + 5–10 m (Qt7), and + 1.5–3 m (Qt8). Only the Qt4, Qt5, Qt7, and Qt8 terraces are preserved in the Arén sector (Fig. 2a, b).
Around the archaeological site, the Qt4 terrace is found in the village of Arén on both sides of the Barranco de Teixet (Fig. 2a, b). The Qt5 terrace forms a wide surface of + 38–45 m, although it is divided into three sections by the incision of lateral streams and with alluvial fans that cover it with a 0.5–2 m-thick deposit (Fig. 2a, b). A third step composed of the Qt7 terrace is located + 12–15 m above the present channel, on which the houses of the Campamento de Arén are built, next to National Highway 230 (Fig. 2a, b). Another lower terrace level (Qt8) between this last terrace and the floodplain is located at + 2–4 m and is part of the floodplain during large overbank floods of the Noguera Ribagorzana River. Finally, the present floodplain is formed by a main channel, abundant secondary channels occupied during annual floods, and several stable bars.
A few meters north of the site, there is a small remnant of the Qt5 terrace (+ 38–45 m) that is overlapped by a debris slope (Fig. 6a, b). Overlying the basement sandstone of the Arén Formation, there is a mostly massive fluvial deposit up to 3.5 m thick with variable grain and clast sizes. The lower portion of this bed is composed of unsorted boulders, cobbles, gravel, and sand. The upper portion of the deposit is 1.2 m thick, and is composed of unsorted gravel, sand, and pebbles. A powdery calcrete has developed on the surface of the upper portion of the fluvial deposit (Fig. 6b). In the upper layers of the terrace with calcrete (Fig. 6c), an OSL sample (AREN-3) was taken that yielded an age of 130.7 ± 7.0 ka (Table 1b).
(a) Photo of the surroundings of the archaeological site showing the structural cuesta of the sandstone in the Arén Formation, fluvial terrace levels (Qt5, Qt7) and slope deposits; (b) Close-up photoschematic and schematic of the general profile of the fluvial terrace Qt5 (+ 38–40 m above present floodplain) and debris slope indicated in (a), showing the location of the sample AREN-P1 taken for mineralogical analysis; and (c) location of the AREN-3 OSL sample.

In the same profile, there is a debris slope deposit overlapping the Qt5 terrace deposit. The debris slope deposit is 2.7 m thick and shows a gradient of ~30% NE towards the river (Fig. 6b). It is composed of sandstone clasts within a fine matrix conserving the general gradient of the slope. Some layers of this debris slope can be defined as a periglacial stratified scree. Absolute dating is impossible given the nature of the deposit.
Sandy accumulations of Arén
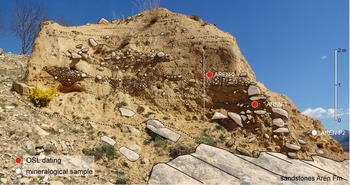
Sandy accumulations are located toward the east of Arén, overlying the cuesta backslope of the Arén Formation. An outcrop located next to the village has the best stratigraphic succession (Fig. 7). The accumulation follows the topography of the basement sandstone layers and forms a deposit with variable thickness, between 2.5 and 4.3 m (Fig. 7). The gradient of the stratigraphy diminishes, changing from a slope deposit to one mixed with fluvial sedimentary structures. Sandy materials are dominant along with gravels and blocks. Mineralogical analysis of the sediment was conducted (AREN-P2 sample) (Figs. 7, 8). Sand samples taken for OSL dating (AREN-1 and AREN-2; Fig. 7) yielded ages of 19.8 ± 1.1 and 19.4 ± 0.8 ka, respectively (Table 1b). These ages indicate that this sedimentary record dates to the last glacial maximum, and corresponds to an environment that was compatible with highly dynamic geomorphological conditions favoring sediment movement along slopes and valley floors.
Photoschematic of the stratigraphic units in the sandy deposit close to Arén, showing the sampled points for OSL dating (AREN-1, AREN-2) and the sample point for mineralogical analysis (AREN-P2). Thin dashed line = bedding planes; Thick dashed line = presumed contact with Arén Formation; thin solid lines = channel base; thick solid lines = Arén Formation contact; larger clasts are outlined by thin solid lines.

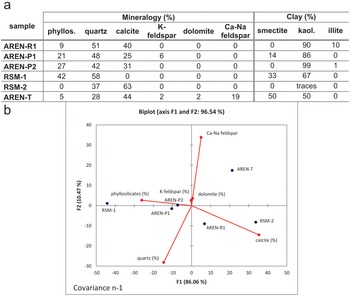
(a; left) Semi-quantitative mineralogical analysis of samples from the RSM archaeological site and surroundings; phylo = phyllosilicate minerals. (a; right) Content of layered silicates from the 4-μm clay fraction from oriented aggregates. (b) Principal component analysis (PCA) plot for the mineralogy of the samples. The first axis explains 86.06% of total variation in the mineralogy data and the second axis explains 10.47% of total variation; samples indicated on plot: AREN-R1 = Arén Formation sandstone; AREN-P1 = debris slope; AREN-P2 = sandy deposit; RSM-1 = upper trench deposit; RSM-2 = middle trench deposit; AREN-T = Qt5 fluvial terrace.

Mineralogical composition of the RSM site and surrounding morphostratigraphic units
Mineralogical analyses of six samples from the bedrock (AREN-R1), upper (RSM-1) and middle trenches (RSM-2), Qt5 terrace deposit (AREN-T), debris slope (AREN-P1), and sandy accumulations of Arén (AREN-P2) are shown in Figure 8a. The mineral composition of the samples is generally quartz-rich (~50%), excluding sample AREN-T (28%). Calcite is more abundant in samples RSM-2 (63%), AREN-R1 (~40%) and AREN-T (~44%), while the proportion of calcite is less in samples corresponding to debris and sandy slope deposits (25% and 31%, respectively). Phyllosilicates are more abundant in AREN-P1 and AREN-P2 and in the RSM-1 upper trench, but were not detected in RSM-2. Note that the unique presence of plagioclase (19%) observed in the AREN-T sample is because it originated from Paleozoic rocks in the Pyrenean headbasins. Among all samples, clay content comprises smectite, kaolinite, and illite. Higher kaolinite content (>50%) appears in all samples except for RSM-2. Smectite varies notably among the samples from undetectable to 50%, while illite is absent except in sample AREN-R1.
The first axis of PCA analysis shown in Figure 8b explains 86.06% of total variance in the mineralogy data, while the second axis explains 10.47%. The samples are clearly grouped into those containing carbonate or Ca-rich elements (calcite, dolomite, and plagioclase) and siliceous components (quartz, phyllosilicates, and K-feldspar; Axis 1; Fig. 8b).
The mineralogical makeup of the debris slope (AREN-P1) and the sandy deposit (AREN-P2) are very similar, showing that they belong to the same accumulative set. The differences shown by the fluvial terrace (AREN-T) with respect to the bedrock (AREN-R1) as well as the other samples, reflect the different genesis of the materials. The upper trench sample (RSM-1) is clearly different from AREN-P2 deposits and shows large amounts of phyllosilicates and quartz, but no calcite. The middle trench sample (RSM-2) is quite different from sample RSM-1 from the upper trench, especially in calcite content (63%). This difference in calcium content may be related to the older age and depth of RSM-2. The larger carbonate content also may be related to coatings found on the lithic artifacts and in small nodules and root wraps. In addition, the firing features of the middle trench may have affected the sample geochemistry.
Geophysical study of the RSM site
A geophysical study was conducted to discover the deposit depth of the unexcavated areas of the RSM site and to establish continuity among the trenches. It was also necessary to deepen our stratigraphic knowledge of the site and to help plan for future excavations.
Electrical resistivity is a very informative physical parameter for interpreting complex subsurface stratigraphy due to its high sensitivity, resolution, and coverage. An analysis of the continuity and geometry of the resistivity gradients (Fig. 9a) makes it possible to interpret distinct geo-resistive units (Fig. 9b). This initial interpretation based on resistivity was further integrated with the seismic results to integrate geophysical units (Fig. 9c). In the case study, seismic refraction enables the identification of the basement and contributed only as a secondary technique.
Geophysical results from the RSM site. (a) Electrical resistivity mapping from the archaeological site. Shot points from the seismic profile in blue (S2-Direct/Central/Reverse) with geophones (g0–g7) placed 2 m apart. Highly resistive areas close to the surface are interpreted as sandstone boulders. Large low resistive areas are interpreted as areas rich in fine-grained sediments. The red line divides both high and low resistive geoelectrical levels; the dotted line divides bedrock and sediments. The continuous and large resistive portion of terrain located at the bottom of the profile is interpreted as bedrock. (b) Geoelectrical units and subunits derived from electrical resistivity tomography (ERT), following the red and dotted line boundaries from (a). Geoelectrical Unit G1 and Unit G2 are subdivided into two subunits following field observations. Geoelectrical Unit G3 may be related to the bedrock. (c) Geoelectrical units and subunits characteristics table.

Three main geophysical units were identified (G1, G2, and G3; Fig. 9c) using the combined geophysical methods. Units G1 and G2 correspond to slope sedimentary accumulation, and G3 corresponds to basement (Arén Formation). In the middle part of the profile, the seismic velocity propagation (>3000 m/s), and resistivity results (>1000 Ω•m) point to a shallow basement location (~1 m). A larger depth-to-basement is observed at both extremes of the seismic profile, beneath the upper archaeological trench (3.5 m depth) and at the lowermost zone of the middle trench (4 m depth).
Geophysical Unit G1 consists of a shallow layer covering the slope, overlying all other units. It is highly continuous and subparallel to the slope (Fig. 9b). This suggests an erosive contact between this unit and the other units. As can be observed on the surface, some rock boulders, also identified in seismic results by their highly resistive clouds, are embedded in Unit G1 (Fig. 9a). These boulders are derived from collapses of the Arén Formation sandstone that were then buried by fine-grained sediments. However, from field observations, we can distinguish between Subunit G1a (most of Unit G1) and Subunit G1b, which only exists below the middle trench as separate and distinguishable from Subunit G1a and Unit G2. Unit G2 is a transitional unit identified by its homogeneous, low-resistivity values (Fig. 9a) created by the presence of fine- to medium-grained sediments. The archaeological context of this unit is unknown. Nevertheless, the thickness of Unit G2 is reduced between the archaeological trenches, or potentially absent. Unit G2 is thicker on the lowermost portion of the ERT profile where Unit G3 is deeper. Unit G2 also shows two subunits (Fig. 9c). Unit G3 is highly resistive (Fig. 9a) and is characterized by irregular contacts that follow troughs and crests and emulate a paleorelief surface (Fig. 9b). The geometry of Unit G3 is analogous to the Arén Formation relief that can be observed in the field (crest and shaped ridges), and in this context, suggests that the erosional trough was mostly filled by Unit G2.
DISCUSSION
Human occupation and paleoenvironmental context
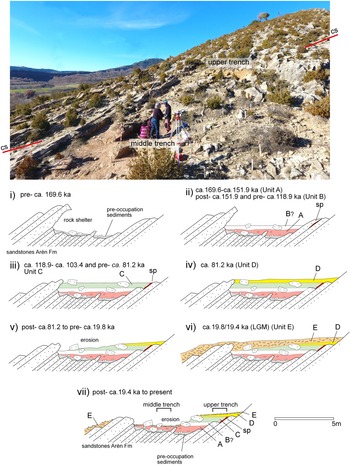
The recovered data are organized in evolutionary stages starting from the shelter formation up to present. Each stage is represented in Figure 10, emphasizing its relationship within the archaeological site, dates obtained, local geomorphological context, environmental data of the Central-Southern Pyrenees, and correlation with MIS stages.
Evolutionary model of the RSM archaeological site showing a SE–NW cross section (cs in upper image; lower l to upper r); (i) pre-occupational sandstone rock shelter; (ii) Unit A and unexcavated Unit B and speleothem outcrop (sp); (iii) Unit C; (iv) Unit D sedimentation; (v) erosional period; (vi) Unit E capping the previous units of the site; and (vii) erosion of Unit E and part of the archaeological site, and approximate location of the two archaeological trenches.
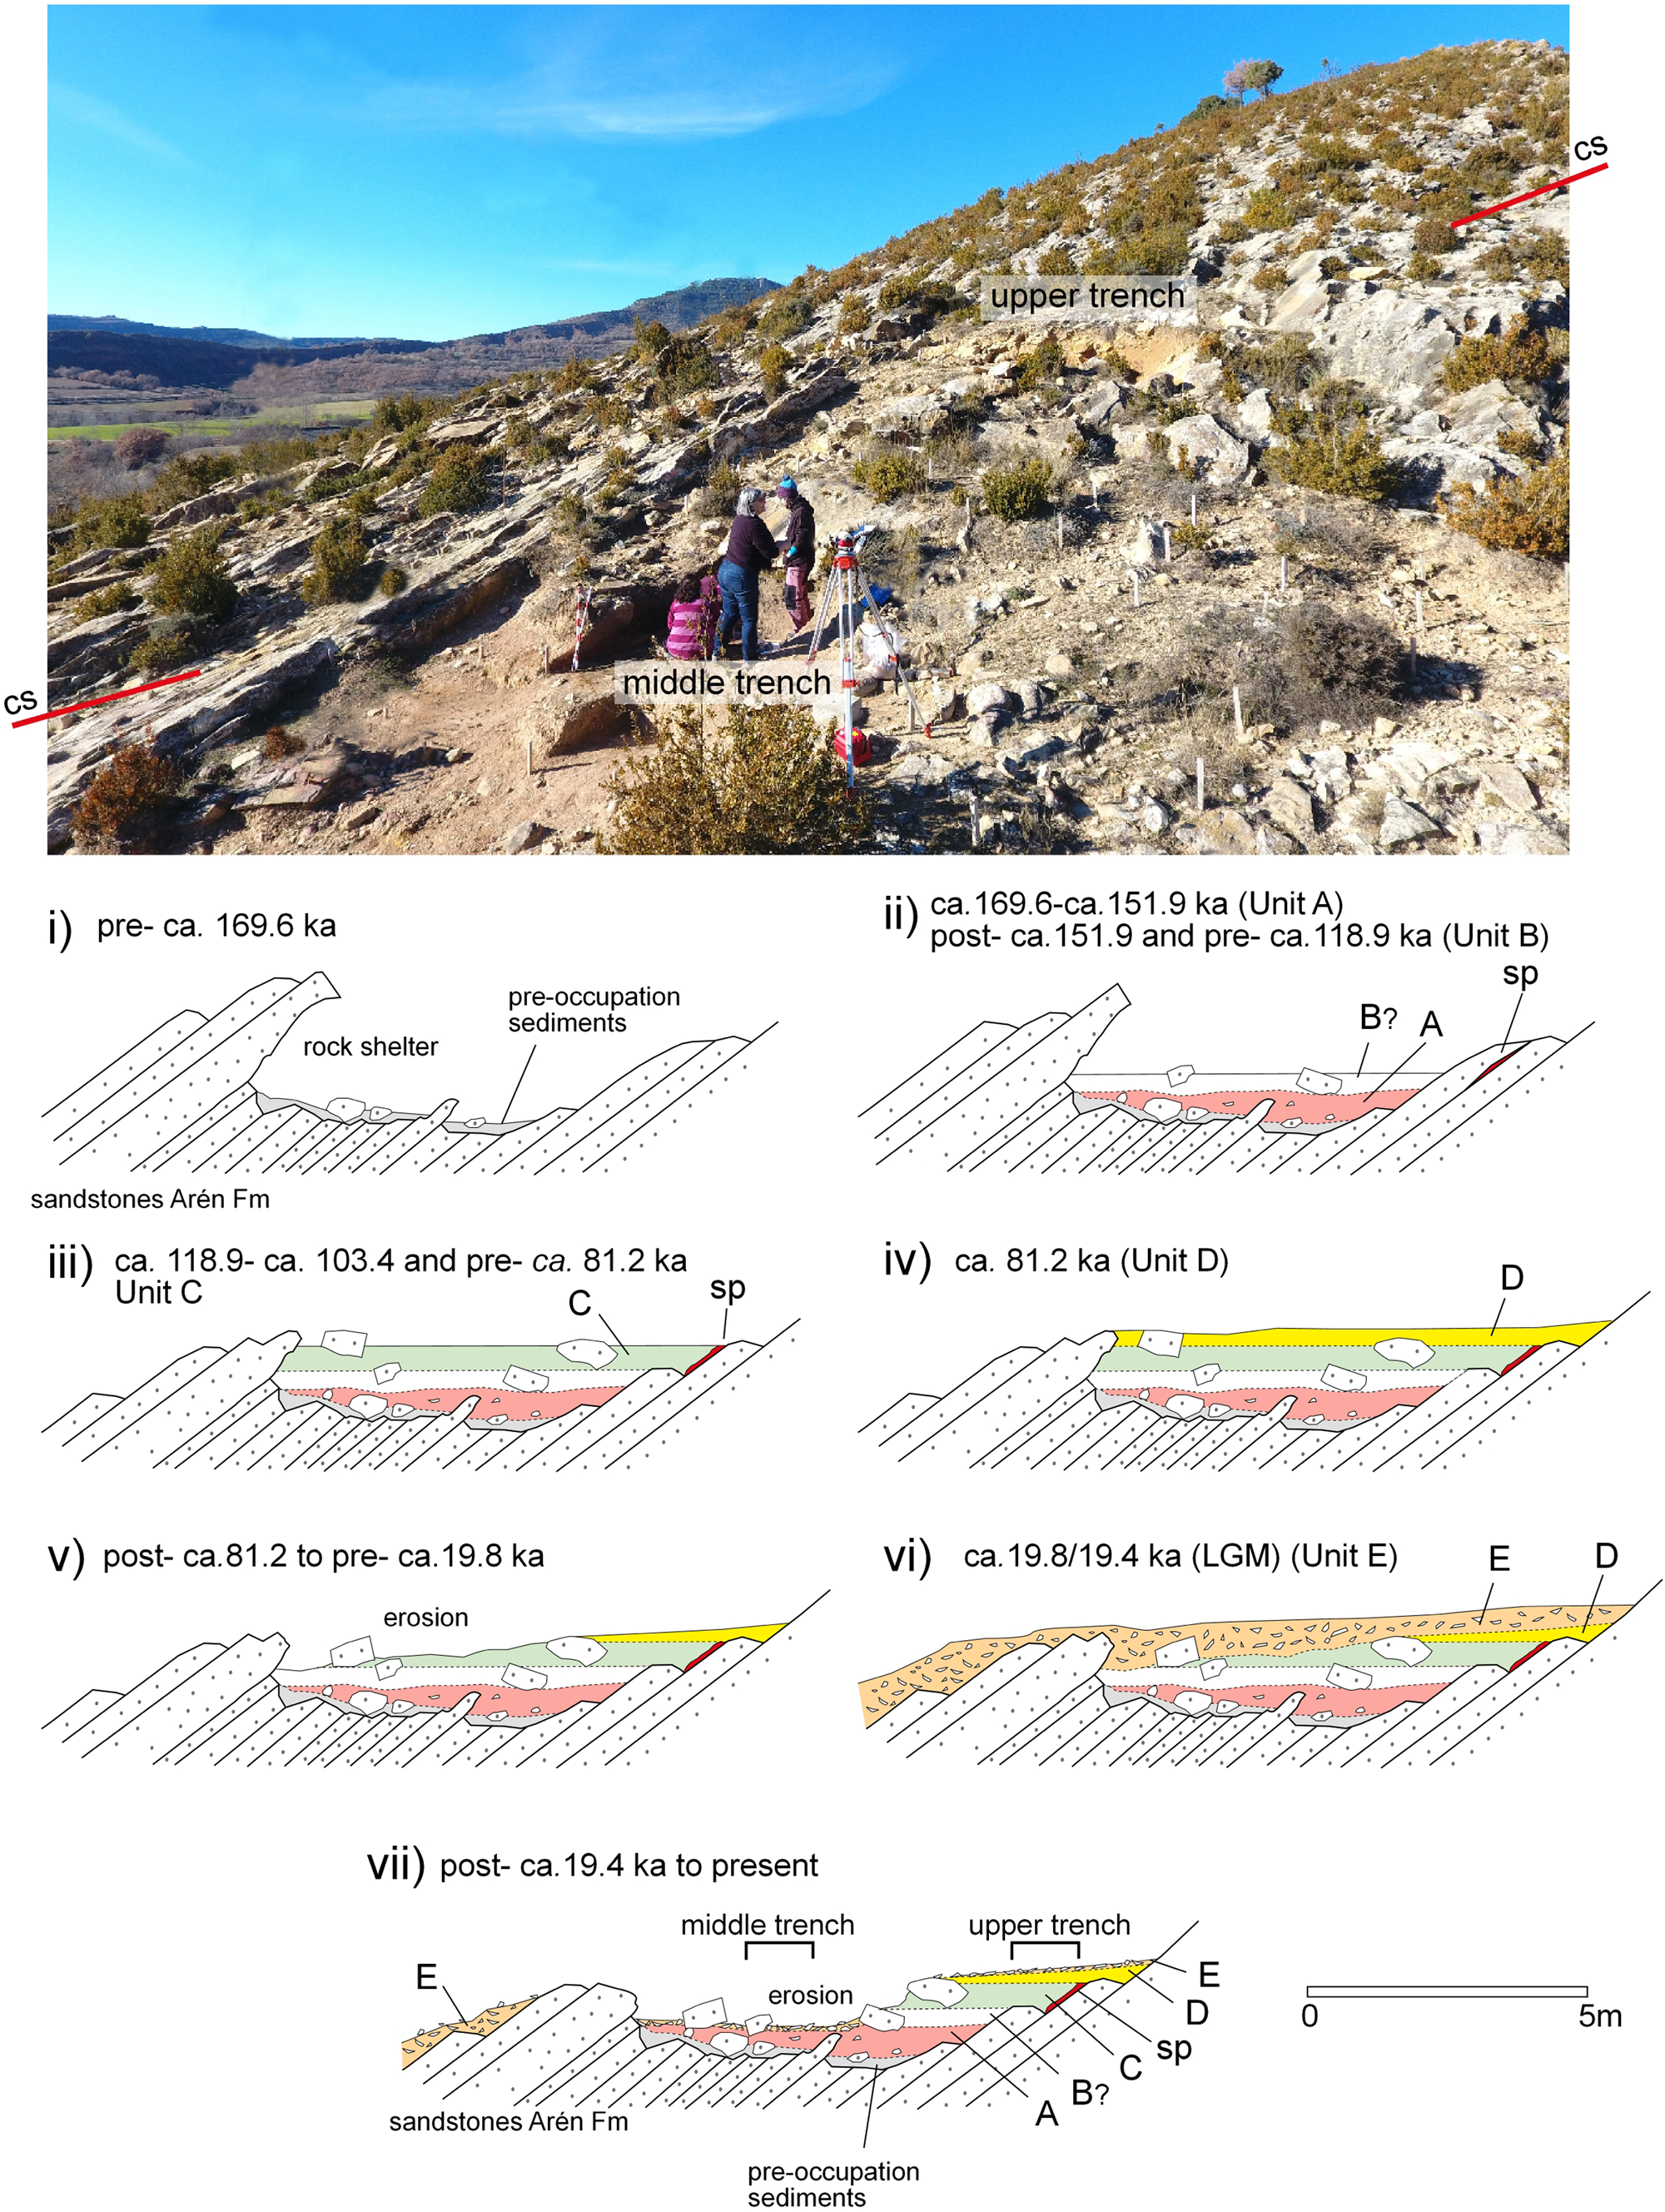
i) It seems the shelter already existed in the prehistoric occupation period, and we believe that when Neanderthals inhabited the site, the rocky projections were probably higher, which created a readily habitable site whose strategic advantages were evident (Fig. 10i). Rock shelter formation was favored by the lateral erosion produced by the Noguera Ribagorzana River when it traversed this narrow passage during the incision process of the channel. When the area was occupied, the river flowed next to the lower section of the site where the Qt5 terrace is located. The rock shelter formation was also favored by a significant weathering of the sandstone, which tends to produce depressions through mechanical weathering and dissolution.
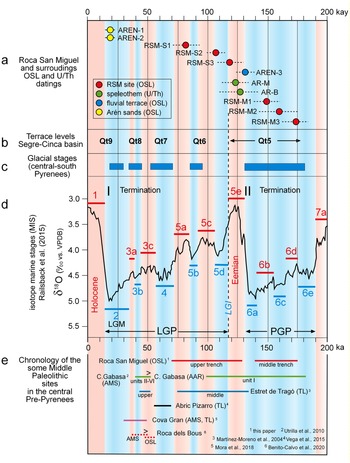
ii) Mousterian occupation started before the oldest OSL age obtained in the middle trench (169.6 ± 9.1 ka, Unit A; Fig. 10ii). Because bedrock was not reached, older occupations may underlie this basal sample. Unit A spans at least up to 151.9 ± 11.1 ka. Unit B hypothetically must be developed from this unit, and is dated up to 118.9 ± 11.5 ka (Fig. 10ii). Thus, units A and B were probably developed during the MIS 6d to MIS 6b stages during the penultimate glacial period (PGP) (Fig. 11).
Composite figure showing temporal relationships among: (a) samples from the RSM site and its surroundings; (b) ages of the Segre-Cinca fluvial terraces system; (c) the glacial stages in the central-south Pyrenees; (d) Marine isotope stages (MIS) for the last 200 ka (modified after Railsback et al., Reference Railsback, Gibbard, Head, Voarintsoa and Toucanne2015); and (e) the chronological relationship with other Middle Paleolithic sites from the south Pyrenean area. PGP (penultimate glacial period); LGP (last glacial period); LGM (last glacial maximum). OSL = optically stimulated luminescence; AAR = amino acid racemization; TL = thermoluminescence; AMS = radiocarbon dating by accelerator mass spectrometry. Shading indicates periods of warmer and cooler temperatures.
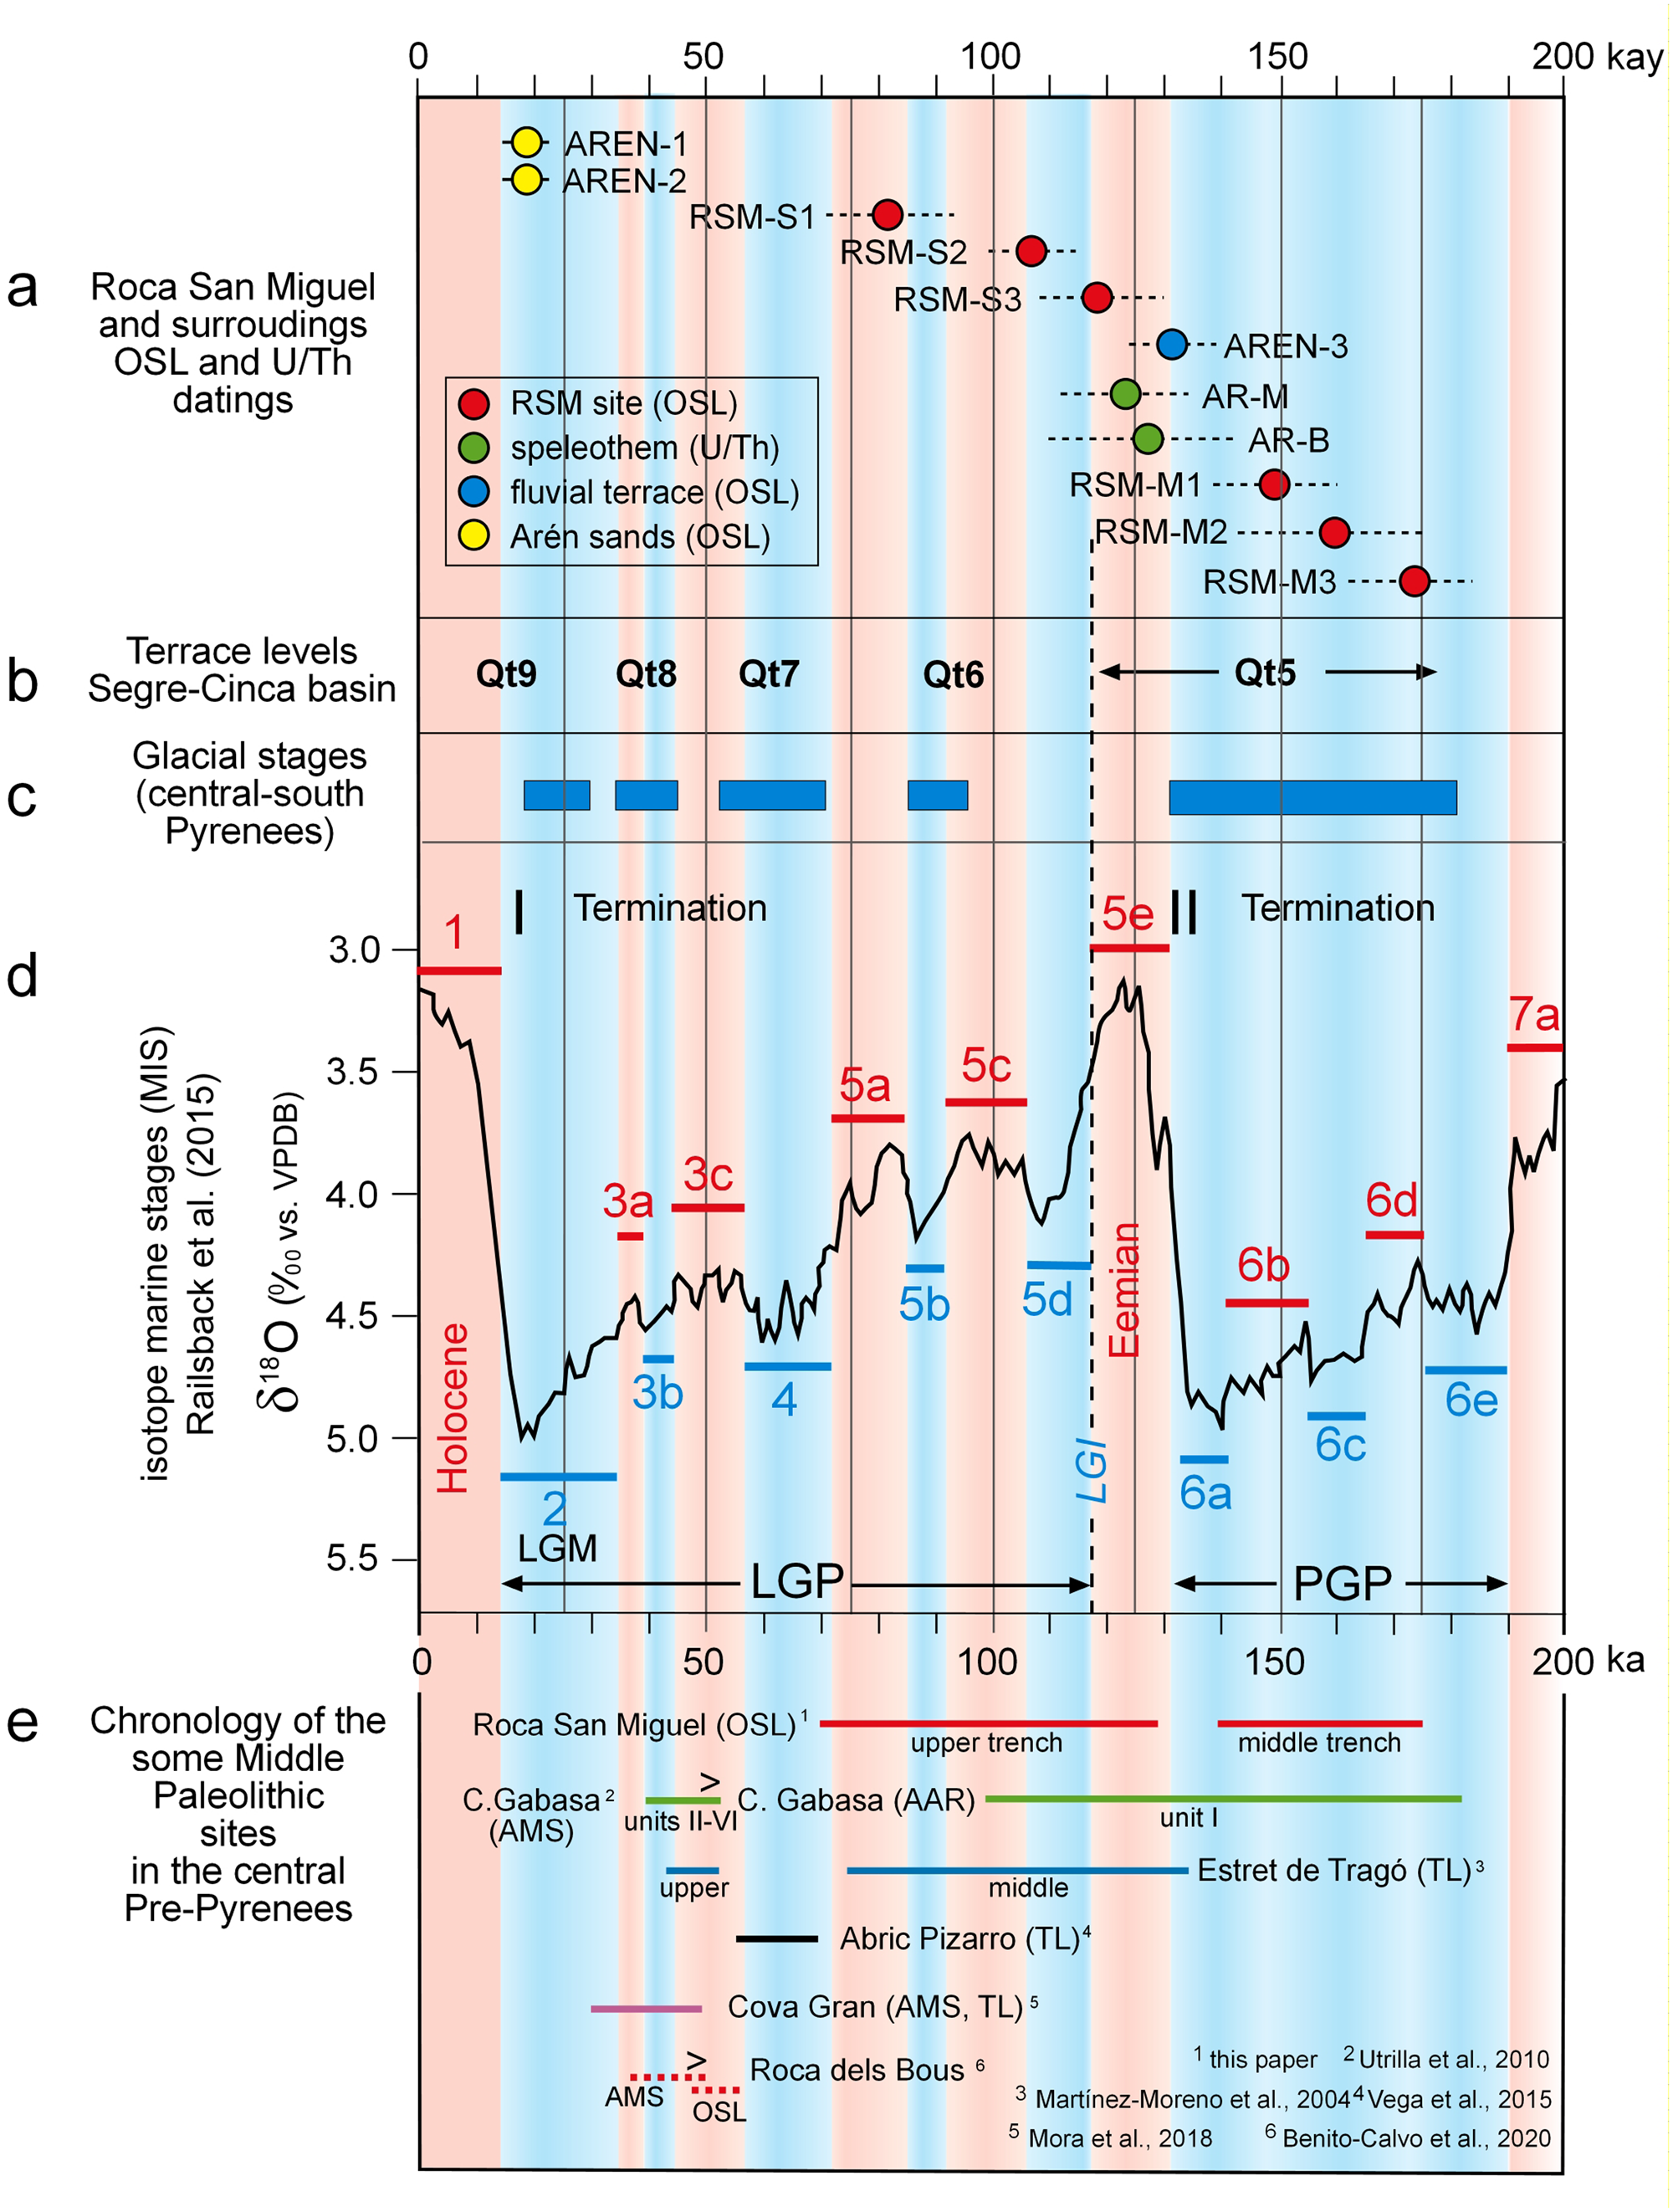
The relationship between the Roca San Miguel occupation during units A and B and the fluvial terrace system of the Noguera Ribagorzana River can be established through the age obtained (130.7± 7.0 ka) from the top of the Qt5 fluvial terrace (Fig. 6a). In the Segre-Cinca basin, the Qt5 terrace shows ages between 180–130 ka (Fig. 11b). In the lower Segre River, Stange et al. (Reference Stange, Van Balen, Carcaillet and Vandenberghe2013a) obtained an age of 138.8 + 46.7/-22.8 ka with cosmogenic nuclides, and in the Cinca River, Lewis et al. (Reference Lewis, McDonald, Sancho, Peña-Monné and Rhodes2009) published OSL ages of 171 ± 22 and 180 ± 12 ka for this terrace. Outside of the basin, in the upper and middle course of the Gállego River (Peña Monné et al., Reference Peña Monné, Sancho, Lewis, McDonald and Rhodes2003; Sancho et al., Reference Sancho, Peña Monné, Lewis, McDonald, Rhodes, Colombo, Liesa, Meléndez, Pocoví, Sancho and Soria2004; Lewis et al., Reference Lewis, McDonald, Sancho, Peña-Monné and Rhodes2009), the ages for the fluvial and fluvioglacial accumulations of the Qt5 range are between 148 ± 7 and 156 ± 10 ka. In the lower section of this river, dating established an age between 133 ± 10 and 181 ± 13 ka (Benito et al., Reference Benito, Sancho, Peña-Monné, Machado and Rhodes2010). Moreover, other south Pyrenean fluvioglacial deposits for these periods have been dated, such as in the head basin of the Gállego River with dates to 156 ± 10 ka (Peña Monné et al., Reference Peña Monné, Sancho, Lewis, McDonald and Rhodes2003, Reference Peña Monné, Sancho, Lewis, McDonald, Rhodes, Monné, Longares and Sánchez Fabre2004; Lewis et al., Reference Lewis, McDonald, Sancho, Peña-Monné and Rhodes2009), in the Valira River to 120 ± 15.6 ka (Turú and Peña Monné, Reference Turú, Peña Monné, Pérez-Alberti and López-Bedoya2006b), and in a moraine of the Aragón River dated to 171 ± 22 ka (García-Ruiz et al., Reference García-Ruiz, Martí-Bono, Peña-Monné, Sancho, Rhodes, Valero-Garcés, González-Sampériz and Moreno2012). Therefore, this is a set of fluvial terraces that correlates well with moraines and fluvioglacial terraces in the head basin and are the result of glacial melt discharges.
Considering the chronological data, the Qt5 terraces were developed during MIS 6, in correspondence with the PGP, with a maximum in MIS 6a (Termination II) (Fig. 11). The archaeological site at RSM is located ~17–20 km downstream from the limit of the Quaternary glacial fronts of the Noguera Ribagorzana River (Pont de Suert–Vilaller). Thus, the Qt5 terrace related to the archaeological site must have been active from at least ca. 180 ka (older ages of the terraces of this stage in the basin) until 130.7 ± 7.0 ka (Table 1b), which is the age of sample AREN-3 (Fig. 11). The most frequent ages for the fluvial terraces dated in the basins of the Cinca-Segre rivers enables us to infer that the most active glacial period was ca. 155–156 ka, in concurrence with the chronology presented by Margari et al. (Reference Margari, Skinner, Hodell, Martrat, Toucanne, Grimalt, Gibbard, Lunkka and Tzedakis2014) of ca. 157–154 ka for central Europe. Comparatively, this glacial phase (PGP) is more significant than the Last Glacial Period (LGP), and constitutes the most extensive glaciation of the last 400 ka over Eurasia (Hughes and Gibbard, Reference Hughes and Gibbard2018). Until now, the oldest occupational date for Roca San Miguel (169.6 ± 9.1 ka) was contemporary with the cold extreme climatic conditions of the Central Pyrenees during the MIS 6.
iii) The upper trench begins with Unit C (Fig. 10iii), with estimated ages between 118.9 ± 11.5 and 103.4 ± 6.9 ka. It displays good stratigraphy and might be partially formed by materials moved from along the slope. Unit C began in the Eemian (MIS 5e) and continued after the Last Glacial Inception (LGI) up to MIS 5d (Fig. 11). Its ending corresponds with the abandonment of the site.
This unit laterally covers the flowstone (Fig. 10iii) formed earlier (129.3 ± 1.5 and 123.6 ± 0.6 ka; Table 1c, Fig. 11). This flowstone was formed in an inner cavity of the rock, a gallery, or perhaps a fissure widened by dissolution. Later, it was exposed by erosion more recently than the oldest age for the upper trench (118.9 ± 11.5 ka). It dates to the Eemian interglacial period (MIS 5e) and was covered by the sediments of Unit C (Fig. 4b).
The Eemian interglacial period is classically recognized between ca. 135–130 to 118 ka, although these ages are being revised. Holzkämper et al. (Reference Holzkämper, Mangini, Spötl and Mudelsee2004), in a study of speleothems in the Alps, pointed out that the beginning of the warmer climate was slightly later at ca. 125.7 ± 0.9 to 116 ± 1.9 ka. In the southern Pyrenees, dated speleothems are closer in age and cover between 115 and 68 ka, although on the island of Minorca, dates between 125 and 113 ka were obtained (Torner et al., Reference Torner, Cacho, Moreno, Sierro, Martrat, Rodriguez-Lazaro, Frigol, Arnau, Balmonte, Hellstrom, Cheng, Edwards and Stoll2019). However, the end of the LGI is better known due to a global sea-level drop (Sirocko et al., Reference Sirocko, Seelos, Schaber, Rein, Dreher, Diehl, Lehne, jäger, Krbetschek and Degering2005), dated to 118 ± 1 ka (Lambeck and Chappell, Reference Lambeck and Chappell2001) and the growth of ice at 118 ka (Calov et al., Reference Calov, Ganopolski, Claussen, Petukhov and Greve2005), and was a relatively short (~10 ka) warmer period. The growth of the flowstone in the RSM site occurred during this phase of climatic amelioration.
These environmental changes between the PGP and Eemian, and between the Eemian and the LGP, are reflected in the mineralogical information provided by the clays in our samples (Fig. 8). The proportion of smectite and kaolinite is a useful proxy for the paleoenvironmental reconstruction because these clay minerals are formed under very different and contrasting conditions (Zhang et al., Reference Zhang, Guo, Deng, Ji, Wu, Paterson, Chang, Li, Wu and Zhu2016). Smectite needs less chemical weathering (i.e., a colder climate) to form than does kaolinite. The samples RSM-1 and RSM-2, collected in the upper and middle trenches respectively, show very low kaolinite/smectite ratios. The low kaolinite/smectite ratio of the RSM-1 (same sample as the RSM-S2 age sample, 103.4 ± 6.9 ka) points to the transition from the Eemian to the colder LGP environment.
iv) During the final stages of occupation, a landscape degradation process began in MIS 5e. The upper and middle slope, including part of the site, was partially eroded, moving part of the materials towards the lower areas during the LGP (Unit D; Fig. 10iv). Unit D is sandier and has fewer lithic materials coming from the upper slope. The sands dated at 81.2 ± 4.7 ka (MIS 5a) (Fig. 11) could be the first to be deposited on a surface already semi-degraded by erosion.
v) A hiatus was identified between units D and E (Fig. 10v). It could be related to an erosive phase that eliminated part of the deposits from previous phases. Thus, Unit E lies unconformably over the older units and the basement sandstone.
vi) When the archaeological excavation began, there were many sandstone fragments forming a recent cover from the erosion of Unit E (Fig. 10vi), and was observed locally in the sandy deposits of Arén and the debris slope.
The OSL age estimates obtained for the sandy deposits of Arén were 19.8 ± 1.1 ka (AREN-1) and 19.4 ± 0.8 ka (AREN-2) (Table 1b; Fig 7). Topographically, this deposit occupies an altitude equivalent to that of the archaeological site. Therefore, it might be an extension of the same accumulations during the LGM (Last Glacial Maximum) covering most of the sandstone cuesta backslope and capping the site.
Towards the north of the archaeological site, the debris slope with interbedded stratified screes (Fig. 6) belongs to a cold stage with periglacial characteristics. In the Pre-Pyrenean area, these types of accumulations were radiocarbon dated by Peña-Monné et al. (Reference Peña-Monné, Chueca, Julián, Gómez Ortiz, Franch, Schulte and García Navarro1998) to between 20.06 ± 0.18 and 9.65 ± 0.15 cal ka BP and by García-Ruiz et al. (Reference García-Ruiz, Martí-Bono, Valero Garcés, González Sampériz, Lorente, Beguería, Edwards, Peña Monné, Sánchez-Fabre and Lozano Tena2000) to between 13.77 ± 0.10 and 9.0 ± 0.10 cal ka BP. Thus, they are very common landforms formed during the LGM to the beginning of the Holocene. Although we do not have an age for this specific slope, it probably belongs to the same cold phase.
vii) After the LGM, probably in the Holocene, the RSM slopes were highly eroded (Fig. 10vii). The preserved area where the archaeological excavations were conducted remained due to the presence of rocky obstacles protecting the sediment and because the large clasts of Unit E formed a protective rock barrier.
Stratigraphic continuity between the upper and middle trenches
Considering that our data originates from two stratigraphic sequences (upper and middle trenches) it is necessary to understand whether they belong to two independent deposits or one single stratigraphic set.
The archaeological site is configured to the terrain gradient, and was 4.5 m thick close to the river while thinning upslope. The ages obtained are coherent in both trenches, but the intermediate section (Unit B) is still unexcavated. However, an estimation of the sedimentary accumulation rates for each sector as well as the entire set enabled us to establish that in the middle trench (Unit A), the sedimentation rate was ~1.1 cm/1000 yr; while concurrently, in the upper trench (units C and D), the rate reached 2.1 cm/1000 yr. If we apply these parameters to a theoretical Unit B between both trenches, with an altimetric separation of 2.66 m and a chronological gap of about 33 ka, the accumulation rate would be much higher (8 cm/1000 yr) than previous rates.
The geophysical study supports the hypothetical stratigraphic continuity between the two main trenches, and provided an estimation of the deposit thickness available for future excavations. The 2D electrical resistivity tomography (ERT) and seismic refraction profiles enabled us to identify three main geophysical units, each with several subunits (Fig. 10ii). Among them, Unit G1a covers the upper and middle trenches, while Unit G1b represents the deposits of the lower trench that have been transported downslope. Between units G1 and G3 (Arén Formation basement) is Unit G2, which is composed of fine- to medium-grained sediments. The thickness estimation for Unit G2 for the upper trench was 3.5 m, and was 4 m for the middle trench (Fig. 9b). These depths are sufficient to affirm that stratigraphic continuity between both trenches is possible. Sediment accumulation under the present surface of the middle trench makes it possible to infer the existence of older sedimentary and archaeological deposits at depth before reaching the Qt5 fluvial terrace or bedrock. At present, the lower trench does not provide enough data to link it with the other trenches.
Chronology of Neanderthal occupation of the RSM site in Pre-Pyrenean and Iberian Peninsula contexts
The chronology presented in this study allows us to accurately fit the RSM site units A and C into the paleoenvironmental evolution of the Middle–Upper Pleistocene. This time period corresponds to the end of the early Middle Paleolithic phase, of which few sites have been dated in the Iberian Peninsula. Sites with similar chronological occupations (MIS 6 to MIS 5 transition) from other Iberian regions include the Arlanpe Cave (units SQ2 and SQ1, Ríos-Garaizar et al., Reference Ríos-Garaizar, Gárate Maidagan, Gómez-Olivencia, Iriarte, Arceredillo-Alonso, Iriarte-Chiapusso and Garcia-Ibaibarriaga2015) in the Cantabrian area; the San Quirce open-air site (level III, Terradillos-Bernal et al., Reference Terradillos-Bernal, Díez Fernández-Lomana, Jordá Pardo, Benito-Calvo, Clemente, Hilgers and Sala Ramos2014) in the North Meseta; and Bolomor Cave (phase IV, Fernández Peris et al., Reference Fernández Peris, Barciela, Blasco, Cuartero, Hortelano, Sañudo Die and Sala Ramos2014) in the Mediterranean area. Our results from RSM provide the first and earliest accurately dated sites from the Pyrenean area.
It is not easy to match the archaeological occupations of the RSM site with those of neighboring sites, although we have highlighted the concentration of Mousterian locations in the Cinca-Segre Basin (Fig. 1). According to the available dates for these sites, only the Middle Unit of Estret de Tragó (Martínez-Moreno et al., Reference Martínez-Moreno, Mora and Casanova2004) and the Lower Unit of Gabasa Cave (Utrilla et al., Reference Utrilla, Montes, Blasco, Torres and Ortiz2010), respectively dated by TL and AAR methods, can be related to the habitation levels of the RSM site, and not very precisely (Fig 10). The remaining Mousterian dated layers fall within later periods of the MIS, and indeed, varying degrees of information—still preliminary in most cases—recovered from these sites make a complete interpretative framework a difficult task.
The further back we go in prehistoric times, the greater the bias of the archaeological register grows. A few challenges arise when identifying and excavating ancient sites, and factors that drive the conservation and finding of ancient sites include geological and geomorphological evolution, past and present human interventions, and multiple elements related to research (Alday et al., Reference Alday, Domingo, Sebastián, Soto, Aranbarri, González-Sampériz, Sampietro-Vattuone, Utrilla, Montes and Peña-Monné2018). Bearing this in mind, if we compare the spatial distribution of the above-mentioned sites and their chronological occupancy levels, no clear pattern emerges. There are not more ancient (or recent) sites in the specific area either to the north, the south, or in any of the basins. Therefore, it seems that the favorable conditions in the Pyrenean Range area made it especially desirable for Neanderthals over an extended period. It is a typical Mediterranean low/mid-mountain landscape, where the lithological environment (limestone and sandstone) leads to formation of caves and to their subsequent use as rock shelters. This is an ecotone with rapid access to varied biotic and abiotic resources from the mountain and the plains, easily accessible throughout the river network, with transverse corridors interconnecting the river basins. Considering the Neanderthal's modern thinking abilities, in forthcoming studies we will focus on a detailed analysis of the lithic techno-complexes and economic activities.
CONCLUSIONS
The archaeological, stratigraphic, and chronological information obtained from the excavations made since 2014 at the Roca San Miguel (RSM) site offer a very complete view of occupational process and site formation during Middle Paleolithic times. In addition, a geomorphological study and dating of the main evolutionary records of the site surroundings, linked with the archaeological site, support the geoarchaeological reconstruction of the area.
The Mousterian occupation started in a rock shelter created by rock weathering and fluvial erosion before the oldest OSL age (169.6 ± 9.1 ka) obtained in Unit A (level MLP2) of the middle trench. The upper section of this unit (level MLP) was dated to 151.9 ± 11.1 ka. Between this age and the base of Unit C (level SLN), dated to 118.9 ± 11.5 ka, is the unexcavated Unit B. Units A and B developed during the PGP (MIS 6d to MIS 6b stages), coinciding with the aggradation phase of the Qt5 terrace, dated to 130.7 ± 7.0 ka at the top. This terrace was related to the glacial advance in the Central Pyrenees. Thus, paleoenvironmental conditions were cold during these times.
In Unit C (level SLN), with estimated ages between 118.9 ± 11.5 ka and 103.4 ± 6.9 ka, hearth areas diminish and the quantity of sediments coming from the slopes increases. Chronologically, the unit corresponds to the Eemian (MIS 5e) and part of the MIS 5d, and is contemporary with abandonment of the site.
The age of Unit D (level SAN) was estimated to 81.2 ± 4.7 ka (MIS 5a), which means it developed in the last glacial period. Unit D is composed of sediments eroded from the slope and is almost without anthropic remains because the site had been already abandoned by Neanderthals. Over these deposits at RSM lies an undated detrital cover (Unit E, level SC). However, Unit E could be related to the sandy deposits of Arén, dated to 19.8 ± 1.1 ka and 19.4 ± 0.8 ka (LGM, MIS 2), or with nearby debris slope deposits. The archaeological site was partially eroded during the end of the Pleistocene and the Holocene.
The paleoenvironmental and site evolutionary data provided by the Middle Paleolithic site of RSM represents a major step forward in our understanding of the Middle–Upper Pleistocene transitional period and the end of the early Middle Paleolithic in in the South Pyrenean area of Iberia. This important step has been made possible by complementary geomorphology and archaeology work, as well as the use of suitable dating methods for the chronology (such as OSL and U/Th). In addition, the geophysical results enable us to infer that future fieldwork may extend this Middle Paleolithic sequence to even older ages.
Acknowledgments
We wish to thank the editors and reviewers of Quaternary Research for their observations and comments to improve this work.
Financial Support
This research was supported by the Gaps and Sites (HAR2017-85023-P) and Gaps and Dates (PID2020-116598GB-I00) projects, funded by the MINECO/MICIN-AEI/FEDER, Spain/EU; and by the Research Group P3A from the Aragón Government (H14_20R). We warmly thank the village and municipality of Arén and the Diputación Provincial de Huesca for funding all the archaeological fieldwork between 2013 and 2019.