Introduction
Attention-deficit/hyperactivity disorder (ADHD) is one of the most prevalent childhood-onset neuropsychiatric disorders (Greenhill et al. Reference Greenhill, Posner, Vaughan and Kratochvil2008; Kieling & Rohde, Reference Kieling and Rohde2012; Thomas et al. Reference Thomas, Sanders, Doust, Beller and Glasziou2015). Depending on symptomatology, patients can be classified as belonging to the inattentive, the hyperactive/impulsive or the combined ADHD (ADHD-C) subtype. In addition to the three core ADHD symptoms, various executive functions are deficient (Durston et al. Reference Durston, van Belle and de Zeeuw2011; Arnsten & Rubia, Reference Arnsten and Rubia2012; Ahmadi et al. Reference Ahmadi, Mohammadi, Araghi and Zarafshan2014; Stroux et al. Reference Stroux, Shushakova, Geburek-Höfer, Ohrmann, Rist and Pedersen2016). Such dysfunctions have detrimental effects on everyday life and quality of life (Diamond, Reference Diamond2013). Despite the high prevalence of ADHD and a substantial number of research efforts, the neuronal mechanisms underlying executive dysfunctions in ADHD that lead to problems in behavioural regulation are still not well understood. A central executive control function is the ability to suppress impulsive response tendencies (Miyake, Reference Miyake2000; Diamond, Reference Diamond2013). This behavioural inhibition is also affected in ADHD (Albrecht et al. Reference Albrecht, Brandeis, Uebel, Valko, Heinrich, Drechsler, Heise, Müller, Steinhausen, Rothenberger and Banaschewski2013; Coghill et al. Reference Coghill, Hayward, Rhodes, Grimmer and Matthews2014a , Reference Coghill, Seth and Matthews b ). Here, particularly the most prevalent ADHD-C (Kenemans et al. Reference Kenemans, Bekker, Lijffijt, Overtoom, Jonkman and Verbaten2005) is of interest, as patients in this subgroup present with more executive function deficits than the other two ADHD subtypes (Houghton et al. Reference Houghton, Douglas, West, Whiting, Wall, Langsford, Powell and Carroll1999; Ahmadi et al. Reference Ahmadi, Mohammadi, Araghi and Zarafshan2014).
However, based upon the mixed symptomatology, it is likely that dysfunctions are evident in a variety of cognitive and neurophysiological subprocesses subserving executive control. This is most probably due to the fact that both perceptual processes (e.g. deficient attention) and response-related mechanisms (e.g. deficient inhibition) are crucial for impulse control. Specifically, impulsive behaviour can emerge due to dysfunctions in a number of processing stages, i.e. from the perceptual and attentional selection stage (Ocklenburg et al. Reference Ocklenburg, Güntürkün and Beste2011; Lackner et al. Reference Lackner, Santesso, Dywan, Wade and Segalowitz2013; Grunewald et al. Reference Grunewald, Stadelmann, Brandeis, Jaeger, Matuschek, Weis, Kalex, Hiemisch, von Klitzing and Döhnert2015) to the response selection stage (for a review, see Bari & Robbins, Reference Bari and Robbins2013). Research examining the peculiarities of ADHD-C (Barkley, Reference Barkley1997; Houghton et al. Reference Houghton, Douglas, West, Whiting, Wall, Langsford, Powell and Carroll1999; Nikolas & Nigg, Reference Nikolas and Nigg2013) has suggested that deficits exist on a number of these stages of the action cascade. However, it is unclear whether there are differences in the degree of dysfunction between processing stages and which out of a multitude of potentially altered subprocesses is most important and may even predict impulsive behaviour in ADHD-C.
Therefore, the aim of the current study was to examine changes in dissociable neurophysiological subprocesses reflecting a cascade ranging from perceptual to response selection stages in a system-level approach, combining high-density electroencephalography (EEG) recordings with source localization analyses. Using this approach it will be possible to connect functional neuroanatomical structures to cognitive subprocesses involved in response inhibition mechanisms that are altered in childhood ADHD-C. It will also be possible to examine the relative importance of processes such as perceptual gating, attentional selection, allocation of processing resources and response selection mechanisms for the emergence of impulsive behaviour in ADHD-C.
All of the subprocesses mentioned above can be examined using event-related potentials (ERPs): perceptual and attentional selection processes are known to be reflected by the P1 and N1 ERPs (Herrmann & Knight, Reference Herrmann and Knight2001). Further along the processing cascade, mechanisms representing the allocation of processing resources, such as the P2 component (Bonnefond et al. Reference Bonnefond, Doignon-Camus, Touzalin-Chretien and Dufour2010; Campbell & Sharma, Reference Campbell and Sharma2013; Sugimoto & Katayama, Reference Sugimoto and Katayama2013; Staub et al. Reference Staub, Doignon-Camus, Bacon and Bonnefond2014), may also be important for response inhibition processes. Patients with ADHD may show problems in allocating attention to relevant stimuli and may also show inefficient resource allocation processes. Both of these processes may well contribute to response inhibition deficits in patients with ADHD-C in addition to deficits at the response selection level. This response selection is reflected by two distinct neurophysiological subprocesses: (i) a frontal–midline N2 ERP component representing pre-motor processes like conflict monitoring or updating of the response program; and (ii) a P3 ERP component probably reflecting evaluative processing of the successful outcome of inhibition (e.g. Falkenstein et al. Reference Falkenstein, Hoormann and Hohnsbein1999; Nieuwenhuis et al. Reference Nieuwenhuis, Yeung, van den Wildenberg and Ridderinkhof2003; Ramautar et al. Reference Ramautar, Kok and Ridderinkhof2004; Beste et al. Reference Beste, Dziobek, Hielscher, Willemssen and Falkenstein2009, Reference Beste, Willemssen, Saft and Falkenstein2010, 2011; for a review, see Huster et al. Reference Huster, Enriquez-Geppert, Lavallee, Falkenstein and Herrmann2013). From a functional neuroanatomical perspective, we assume that possible changes in perceptual and attentional selection processes as well as resource allocation processes are related to occipito-parietal structures (Herrmann & Knight, Reference Herrmann and Knight2001). Possible changes in upstream processes of response selection and control are related to medial prefrontal structures (Bari & Robbins, Reference Bari and Robbins2013). If there are specific changes, information about the precise subprocesses involved may help to refine treatment algorithms focusing on impulsive behaviour in ADHD-C.
Method
Patients and controls
A total of 20 paediatric patients diagnosed with ADHD-C [two female, 11.1 (s.d. = 1.9) years] according to International Classification of Diseases (ICD)-10 criteria were recruited consecutively into the study from the out-patient clinic. Of the patients, 50% were taking ADHD medication (immediate or extended release methylphenidate or atomoxetine). General intelligence was estimated using a short form of the Wechsler Intelligence Scale for Children (WISC-IV) [intelligence quotient (IQ) 102 (s.d. = 10.0)] (Waldmann, Reference Waldmann2008). ADHD diagnoses had been determined according to standard clinical procedures (including parent and child interview, teacher report, symptom questionnaires, IQ testing, exclusion of potential underlying somatic disorders via EEG, electrocardiography, audiometry and vision testing). Children were only included in the study if they fulfilled diagnostic criteria for ADHD-C. In the ADHD Symptom Checklist (Döpfner et al. Reference Döpfner, Görtz-Dorten and Lehmkuhl2008) parents rated (0: no problems, 3: severe problems) their children in regards to inattention [average raw score 2.3 (s.d. = 0.6)], hyperactivity [average raw score 2.0 (s.d. = 0.6)] and impulsivity [average raw score 2.2 (s.d. = 0.6)], thus confirming ADHD-C symptomatology. Further, Conners’ Parent Rating Scale (Conners et al. Reference Conners, Sitarenios, Parker and Epstein1998) revealed significant problems on all subscales (all T-scores > 62). The same was the case for the Child Behaviour Checklist (Achenbach, Reference Achenbach1991): all T-scores were > 61 apart from subscale ‘thought problems’ (T = 58). Patients fulfilled criteria of ADHD-C according to the ICD-10 criteria (F90.2).
A total of 20 children without ADHD were included in the control group [six female, 13.4 (s.d. = 2.5) years, IQ 107 (s.d. = 10)]. Two of these were excluded because of low EEG data quality. None of them was taking medication and none had a psychiatric diagnosis as confirmed by clinical interview. All subjects and their parents or legal guardians provided informed written consent according to the Declaration of Helsinki and the study was approved by the local ethics committee of the Medical Faculty of the Technical University Dresden.
Task
A standard Go/No-go task was used to examine response inhibition performance (Beste et al. Reference Beste, Ness, Falkenstein and Saft2011, Reference Beste, Dziobek, Hielscher, Willemssen and Falkenstein2009; Chmielewski et al. Reference Chmielewski, Mückschel, Stock and Beste2015) where one out of two words was presented on a monitor: ‘DRÜCK’ (German for ‘PRESS’; Go stimulus) and ‘STOP’ (German for ‘STOP’; No-go stimulus) were presented for 300 ms. Participants were asked to respond fast (i.e. within 500 ms) on the ‘DRÜCK’ stimulus and refrain from responding on the ‘STOP’ stimulus. The subjects had to react with the right index finger. The inter-trial interval was jittered between 1600 and 1800 ms. The experiment consisted of 248 Go trials and 112 No-go trials presented in a pseudo-randomized order to avoid consecutive identical trial conditions. The task lasted approximately 20 min.
EEG recording, analysis and source reconstruction
The EEG was recorded from 60 Ag/AgCl electrodes using an equidistant electrode setup with a sampling rate of 500 Hz. The reference electrode was located at Fpz and the ground electrode was located at θ = 58, ф = 78. Electrode impedances were kept below 5 kΩ. During off-line data processing, the recorded data were first down-sampled to 256 Hz. Afterwards, a band-pass filter from 0.5 to 20 Hz with a slope of 48 db/oct each was applied. A raw data inspection was conducted to remove technical artifacts. Periodically occurring artifacts (pulse artifacts, horizontal and vertical eye movements) were subsequently detected and corrected for by means of an independent component analysis. Afterwards, the EEG was segmented to the onset of the Go and No-go stimuli. Only trials with correct responses on Go and without responses on No-go trials were used. Segments started 200 ms before and ended 1500 ms after stimulus onset. Subsequently, an automated artefact rejection procedure was applied containing an amplitude criterion (maximal amplitude: 200 µV, minimal amplitude: −200 µV) and using a maximal value difference of 200 µV in a 200 ms interval as well as an activity below 0.5 µV in a 100 ms period as rejection criteria. Next, a current source density (CSD) transformation was run to obtain a reference-free evaluation of the EEG data which helps to find the electrodes showing the strongest effects (Nunez & Pilgreen, Reference Nunez and Pilgreen1991). A baseline correction was then set to a time interval from −200 to 0 ms before the segments were averaged for each condition. For ERP quantification the following electrodes were chosen on the basis of the scalp topography. Single-subject ERP amplitudes were quantified as the mean amplitude in a defined time interval: The P1 component was measured over P9 and P10 (90–125 ms). The N1 component was measured over electrodes P9 (160–205 ms) and P10 (165–205 ms). P2 amplitudes were exported from electrodes Iz and Oz (180–230 ms). Electrodes FCz and Cz were used to measure the N2 (240–310 ms) and P3 components (380–460 ms). This choice of electrodes and time windows was validated using a statistical procedure described in Mückschel et al. (Reference Mückschel, Stock and Beste2014). This validation procedure revealed the same electrodes and time windows as identified by visual inspection. Peak latencies were quantified as the maximal positive or negative amplitude for each individual subject.
Source localization was conducted using standardized low resolution brain electromagnetic tomography (sLORETA; Pascual-Marqui, Reference Pascual-Marqui2002), providing a single solution to the inverse problem (Pascual-Marqui, Reference Pascual-Marqui2002; Marco-Pallarés et al. Reference Marco-Pallarés, Grau and Ruffini2005; Sekihara et al. Reference Sekihara, Sahani and Nagarajan2005). For sLORETA, the intracerebral volume is partitioned into 6239 voxels at 5 mm spatial resolution. Then, the standardized current density at each voxel is calculated in a realistic head model (Fuchs et al. Reference Fuchs, Kastner, Wagner, Hawes and Ebersole2002) based on the Montreal Neurological Institute (MNI) 152 template (Mazziotta et al. Reference Mazziotta, Toga, Evans, Fox, Lancaster, Zilles, Woods, Paus, Simpson, Pike, Holmes, Collins, Thompson, MacDonald, Iacoboni, Schormann, Amunts, Palomero-Gallagher, Geyer, Parsons, Narr, Kabani, Le Goualher, Boomsma, Cannon, Kawashima and Mazoyer2001). It has been mathematically proven that sLORETA provides reliable results without a localization bias (Sekihara et al. Reference Sekihara, Sahani and Nagarajan2005). Moreover, there is evidence from EEG/functional magnetic resonance imaging and neuronavigated EEG/transcranial magnetic stimulation studies underlining the validity of the sources estimated using sLORETA (Sekihara et al. Reference Sekihara, Sahani and Nagarajan2005; Dippel & Beste, Reference Dippel and Beste2015). In this study, the voxel-based sLORETA images were compared across groups (ADHD-C v. controls) using the sLORETA-built-in voxel-wise randomization tests with 2000 permutations, based on statistical non-parametric mapping. Voxels with significant differences (p < 0.01, corrected for multiple comparisons) between contrasted conditions were located in the MNI brain (www.unizh.ch/keyinst/NewLORETA/sLORETA/sLORETA.htm).
Statistics
Behavioural data were analysed using univariate analyses of variance (ANOVAs) and t tests. The neurophysiological data were analysed by means of mixed-effects ANOVAs using the within-subject factors ‘condition’ (Go v. No-go) and ‘group’ (ADHD-C v. controls). When necessary, the factor ‘electrode’ was used as an additional within-subject factor. Greenhouse–Geisser correction was applied and post-hoc tests were Bonferroni-corrected when necessary. All variables were normally distributed as indicated by Kolmogorov–Smirnov tests (all z < 1.05, p > 0.2).
Ethical standards
All procedures contributing to this work comply with the ethical standards of the relevant national and institutional committees on human experimentation and with the Helsinki Declaration of 1975, as revised in 2008.
Results
Behavioural data
Patients with ADHD-C committed significantly more false alarms [50.0 (s.d. = 6.3)] in No-go trials than healthy controls [30.1 (s.d. = 3.6)] (F 1,36 = 8.1, p = 0.007, η p 2 = 0.18), indicating increased impulsivity in the ADHD-C group. Patients with ADHD-C also missed significantly more responses to Go signals [11.3 (s.d. = 5.7)] than healthy controls [4.2 (s.d. = 1.2)] (F 1,36 = 5.3, p = 0.03, η p 2 = 0.13). The two groups did not differ significantly in regards to Go reaction times [controls: 454 (s.d. = 95) ms; ADHD: 412 (s.d. = 82) ms] (F 1,36 = 2.06, p = 0.16, η p 2 = 0.05). Controlling for age, IQ and gender in analyses of covariance (ANCOVAs) did not reveal any significant effects of these variables (all F < 0.5, p > 0.5). Thus, these variables do not confound the results.
Neurophysiological data
Perceptual gating (P1) and attentional selection (N1)
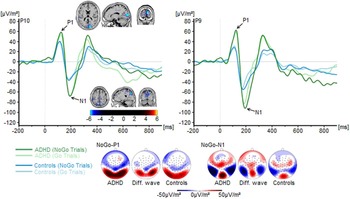
P1 components for both groups and for Go and No-go trials are shown in Fig. 1.
Stimulus-locked waveforms (current source density) and topographic maps for P1 and N1 components, depicted for Go and No-go trials and for both experimental groups at electrodes P9 and P10. Point 0 denotes Go/No-go stimulus onset. In the topographic maps [shown for controls, patients with attention-deficit/hyperactivity disorder (ADHD) combined subtype (ADHD-C) and the difference (Diff.) between them], blue denotes negative deflections whereas red reflects positive ones. The standardized low-resolution brain electromagnetic tomography (sLORETA) plots show the difference in P1 and N1 amplitudes between groups. Colours denote t values corrected using randomization tests.

The repeated-measures ANOVA using the between-subject factor group (controls v. ADHD-C) and the within-subject factors electrode (P9 v. P10 v. O9 v. O10) and condition (Go v. No-go) revealed a main effect of group (F 1,36 = 8.36, p = 0.006, η p 2 = 0.19) on P1 amplitude. Patients with ADHD-C [57.3 (s.d. = 6.7) µV/m2] had more positive P1 amplitudes than healthy controls [30.5 (s.d. = 6.4) µV/m2]. There were no other main effects or interactions (all F < 1.2, all p > 0.3). The sLORETA analysis revealed that group differences in the P1 were due to activation differences in the cuneus [Brodmann area (BA) 18] (controls < ADHD-C). There were no effects in amplitude latencies (all F < 1.2, all p > 0.3).
N1 components for both groups and for Go and No-go trials are shown in Fig. 1. A repeated-measures ANOVA containing the between-subject factor group (controls v. ADHD-C) and the within-subject factors electrode (P9 v. P10) and condition (Go v. No-go) revealed a main effect of electrode (F 1,36 = 9.6, p = 0.004, η p 2 = 0.21) with more negative amplitudes over the left- [P9: −63.0 (s.d. = 8.8) µV/m2] compared with the right-sided electrode [P10: −49.7 (s.d. = 6.4) µV/m2]. Furthermore, it also showed a main effect of group (F 1,36 = 5.6, p = 0.024, η p 2 = 0.14). Patients with ADHD-C had more negative N1 amplitudes [−75.6 (s.d. = 10.3) µV/m2] than healthy controls [−42.2 (s.d. = 9.73) µV/m2]. There were no other main effects or interactions (all F < 3.3, all p > 0.08, all η 2 < 0.08). The sLORETA analysis revealed that N1 amplitude differences between patients with ADHD-C and controls were based on activation differences in the precuneus (BA7). There were no effects in amplitude latencies (all F < 0.9, all p > 0.3).
Controlling for age, IQ and gender in ANCOVAs did not reveal any significant effects on P1 and N1 parameters (all F < 0.9, p > 0.3). Thus, these variables do not confound the results.
Resource allocation (P2)
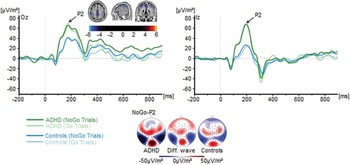
P2 components for both groups and for Go and No-go trials are shown in Fig. 2.
Stimulus-locked waveforms (current source density) and topographic maps for the P2 component, depicted for Go and No-go trials and for both experimental groups at electrodes Iz and Oz. Point 0 denotes Go/No-go stimulus onset. In the topographic maps [shown for controls, patients with attention-deficit/hyperactivity disorder (ADHD) combined subtype (ADHD-C) and the difference (Diff.) between them], blue denotes negative deflections whereas red reflects positive ones. The standardized low- resolution brain electromagnetic tomography (sLORETA) plots show the difference in P2 amplitudes between groups. Colours denote t values corrected using randomization tests.

A repeated-measures ANOVA containing group (controls v. ADHD) as the between-subjects factor and electrode (Iz v. Oz) and condition (Go v. No-go) as the within-subject factors revealed a main effect of group (F 1,36 = 10.1, p = 0.003, η p 2 = 0.22). Patients with ADHD [62.9 (s.d. = 30.83) µV/m2] had higher P2 amplitudes than healthy controls [30.8 (s.d. = 6.93) µV/m2]. There were no other main effects or interactions (all F < 2.4, all p > 0.13, all η p 2 < 0.06). The sLORETA analysis reveals that group differences in the P2 were due to activation differences in the left inferior parietal lobe (BA40) (controls < ADHD-C) (all F < 1.0, all p > 0.3). Controlling for age, IQ and gender in ANCOVAs did not reveal any significant effects on the P2 (all F < 1, p > 0.2). Thus, these variables do not confound the results.
Response selection processes (N2 and P3)
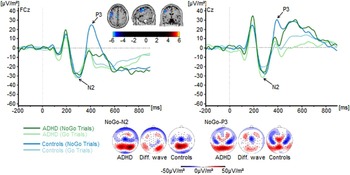
N2 components for both groups and for Go and No-go trials are shown in Fig. 3.
Stimulus-locked waveforms (current source density) and topographic maps for the N2 and P3 component, depicted for Go and No-go trials and for both experimental groups at electrodes Cz and FCz. Point 0 denotes Go/No-go stimulus onset. In the topographic maps [shown for controls, patients with attention-deficit/hyperactivity disorder (ADHD) combined subtype (ADHD-C) and the difference (Diff.) between them], blue denotes negative deflections whereas red reflects positive ones. The standardized low resolution brain electromagnetic tomography (sLORETA) plots show the difference in No-go-P3 amplitudes between groups. Colours denote t values corrected using randomization tests.

A repeated-measures ANOVA containing group (controls v. ADHD-C) as the between-subjects factor and electrode (Cz v. FCz) and condition (Go v. No-go) as the within-subject factors was performed. Analyses revealed no main effects or interactions (all F < 2.1, all p > 0.16, all η p 2 < 0.06). P3 components for both experimental groups and for Go and No-go trials are shown in Fig. 3. The repeated-measures ANOVA using the between-subject factor group (controls v. ADHD-C) and the within-subject factors electrode (Cz v. FCz) and condition (Go v. No-go) revealed a main effect of condition (F 1,36 = 16.4, p < 0.001, η p 2 = 0.31). P3 amplitudes were generally more positive in No-go [13.6 (s.d. = 5.1) µV/m2] compared with Go trials [−0.7 (s.d. = 3.1) µV/m2]. Further, a group × condition interaction was found (F 1,36 = 12.1, p = 0.001, η p 2 = 0.25). In the Go trials, P3 amplitudes were not different between patients with ADHD [−1.4 (s.d. = 4.5) µV/m2] and controls [0.01 (s.d. = 4.3) µV/m2] (F 1,36 = 0.5, p = 0.83, η p 2 = 0.001). In the No-go trials, however, there was a main effect of group (F 1,36 = 6.4, p = 0.016, η p 2 = 0.15). Patients with ADHD-C [0.7 (s.d. = 7.4) µV/m2] had significantly lower P3 amplitudes than healthy controls [26.5 (s.d. = 7.0) µV/m2]. There were no other main effects or interactions (all F < 3.6, all p > 0.07, all η p 2 < 0.09). The sLORETA analysis reveals activation differences in the anterior cingulate cortex (ACC) and the left middle frontal gyrus (BA9). There were no latency effects for the N2 and P3 potentials (all F < 1.3, all p > 0.2).
Controlling for age, IQ and gender in ANCOVAs did not reveal any significant effects on the N2 and P3 (all F < 1.1, p > 0.2). Thus, these variables do not confound the results.
Regression analysis
We performed a multiple regression analysis to examine if and to what degree the frequency of false alarms in the No-go trials could be predicted by the amplitude of the examined ERP components in the No-go trials (P1, N1, P2, N2 and P3) in the ADHD-C group. We used a ‘stepwise regression’ method where the predictors were consecutively fed into the model to test whether these explained a significant amount of additional variance. The regression model was significant (F 1,15 = 9.69, p = 0.007). However, only the amplitude of the No-go-N2 predicted test performance (β = 0.627, t = 3.11, p = 0.007). All other variables did not explain variance in the false-alarm data (all β < 0.259, t < 1.27, p > 0.2). To control for the robustness of the effects obtained we also used the ‘forward method’ in which the regression entries are constrained according to the temporal location. We thus started with the P1 and consecutively added the subsequent variables (i.e. N1, P2, N2 and P3). This method revealed identical results, as only the N2 was shown to be significant in this model (β = 0.627, t = 3.11, p = 0.007) (F 1,15 = 9.69, p = 0.007).
Discussion
In the current study we examined what neuronal mechanisms are related to impulsive behaviour in paediatric patients with ADHD-C. We used a system neurophysiological approach combining ERPs with source localization techniques (sLORETA). Using a response inhibition paradigm (Go/No-go task), we examined which cognitive–neurophysiological mechanisms of the processing cascade are most affected in ADHD-C. Results indicate that children with ADHD-C show a higher rate of inhibition errors (No-go false alarms), suggesting deficits in controlling impulsive behaviour. The neurophysiological data suggest that a number of dissociable cognitive–neurophysiological subprocesses are altered in ADHD-C. Yet, only response selection processes seem to be directly relevant for impulsive behaviour.
In particular, there are changes at the level of perceptual gating (indicated by the P1 ERP) and attentional selection processes (indicated by the N1 ERP) (Herrmann & Knight, Reference Herrmann and Knight2001). Both the P1 and the N1 were stronger in the ADHD-C patients compared with controls. This was the case independent of trial type. However, together with the findings that the P1 and the N1 did not explain variance in impulsive behaviour, this suggests that even though children with ADHD-C show altered (i.e. increased) perceptual gating and bottom-up (stimulus-driven) attentional selection processes (Gomez Gonzalez et al. Reference Gomez Gonzalez, Clark, Fan, Luck and Hillyard1994; Hillyard et al. Reference Hillyard, Vogel and Luck1998; Herrmann & Knight, Reference Herrmann and Knight2001; Wascher & Beste, Reference Wascher and Beste2010), this does not functionally contribute to the observed response inhibition deficits. Source localization results suggest that this is due to dysfunctions in the cuneus in the occipital cortex (BA18) for the P1 and the precuneus in the medial parietal cortex (BA7). The direction of modulation of the P1 and N1 in patients with ADHD-C suggests that ADHD-C patients are more prone to bottom-up sensory information, indicating filtering deficits in patients compared with controls. Such deficits in the filtering and selection of information are well-known in ADHD (Kenemans et al. Reference Kenemans, Bekker, Lijffijt, Overtoom, Jonkman and Verbaten2005). However, as a natural consequence more capacity then also needs to be allocated to processing this information. In line with this, the results show that the P2 was also enlarged in the ADHD-C compared with controls. These processes are associated with the left inferior parietal lobe (BA40) encompassing the temporo-parietal junction (TPJ). The TPJ has been suggested to be involved in post-perceptual processes needed for top-down control (Geng & Vossel, Reference Geng and Vossel2013). This corroborates the above interpretation of the P2 reflecting processing resource allocation mechanisms and them being altered in ADHD-C. However, processes of resource allocation were again not predictive of behavioural performance. This shows that although several early processing steps in the cascade of mechanisms involved in response inhibition are altered in ADHD-C, they are not necessarily relevant for overt behavioural changes.
Rather, the data show that only processes at the response-selection level are important for impulsive behaviour in ADHD-C. Even though the clinical picture is diverse, only very specific subprocesses are thus important for impulsive behaviour. In particular, the amplitude modulations of the No-go-N2 were predictive of behavioural performance in response inhibition and the P3 was differentially modulated between groups across Go and No-go trials. The smaller the No-go-N2 amplitude was, the more frequently false alarms occurred. Similar correlations have been reported previously (Sehlmeyer et al. Reference Sehlmeyer, Konrad, Zwitserlood, Arolt, Falkenstein and Beste2010; Beste et al. Reference Beste, Konrad, Uhlmann, Arolt, Zwanzger and Domschke2013; Quetscher et al. Reference Quetscher, Yildiz, Dharmadhikari, Glaubitz, Schmidt-Wilcke, Dydak and Beste2015). Regarding the P3, only in No-go trials was its amplitude smaller in the ADHD-C compared with controls. This modulation was due to alterations in the ACC (BA24) and the left middle frontal gyrus (BA9). Such reductions in No-go-P3 amplitudes have previously been shown to occur in ADHD (Pliszka et al. Reference Pliszka, Liotti, Bailey, Perez, Glahn and Semrud-Clikeman2007; Liotti et al. Reference Liotti, Pliszka, Higgins, Perez and Semrud-Clikeman2010; Albrecht et al. Reference Albrecht, Brandeis, Uebel, Valko, Heinrich, Drechsler, Heise, Müller, Steinhausen, Rothenberger and Banaschewski2013; Tye et al. Reference Tye, Asherson, Ashwood, Azadi, Bolton and McLoughlin2014; Cheung et al. Reference Cheung, Rijsdijk, McLoughlin, Brandeis, Banaschewski, Asherson and Kuntsi2015) and are in line with source localization results on the No-go-P3 (Fallgatter et al. Reference Fallgatter, Ehlis, Seifert, Strik, Scheuerpflug, Zillessen, Herrmann and Warnke2004). Both the No-go-N2 and the No-go-P3 are known to be modulated by the dopaminergic system (Beste et al. Reference Beste, Willemssen, Saft and Falkenstein2010), which is probably due to fact that they are mediated by the medial frontal cortex, known to be strongly modulated by dopaminergic projections (Nieoullon, Reference Nieoullon2002). Parieto-occipital areas that are relevant for group differences in early processing stages are well known to be less modulated by dopaminergic projections (Nieoullon, Reference Nieoullon2002), though some effects may still exist (Shuler & Bear, Reference Shuler and Bear2006). It may be speculated that the relevance of response selection subprocesses – but not upstream processes of stimulus encoding – for impulsive behaviour emerges because response selection subprocesses tap into neurobiological systems (i.e. dopamine system) that play a major role in ADHD (Faraone et al. Reference Faraone, Bonvicini and Scassellati2014; Gold et al. Reference Gold, Blum, Oscar-Berman and Braverman2014; Kollins & Adcock, Reference Kollins and Adcock2014).
From a clinical perspective, the results are important concerning pharmacological treatment approaches to ADHD, where methylphenidate is commonly the first choice (Harpin, Reference Harpin2008; Bukstein, Reference Bukstein2010; Rabito-Alcón & Correas-Lauffer, Reference Rabito-Alcón and Correas-Lauffer2014). Since the functionally relevant components in the current study are known to be largely dopamine-modulated (Nieoullon, Reference Nieoullon2002; Beste et al. Reference Beste, Willemssen, Saft and Falkenstein2010), this could explain the positive effects that ADHD medication has on impulsive behaviours (Crunelle et al. Reference Crunelle, van den Brink, Dom and Booij2014; Slezak et al. Reference Slezak, Ricaurte, Tallarida and Katz2014; Shang et al. Reference Shang, Pan, Lin, Huang and Gau2015) and inhibition abilities (Nandam et al. Reference Nandam, Hester and Bellgrove2014; Rosch et al. Reference Rosch, Fosco, Pelham, Waxmonsky, Bubnik and Hawk2015; Slama et al. Reference Slama, Fery, Verheulpen, Vanzeveren and Van Bogaert2015). Moreover, the finding that perceptual and bottom-up attentional processes do not modulate impulsive behaviour may explain why purely perceptual training approaches have only limited effects on behavioural control in ADHD (Tucha et al. Reference Tucha, Tucha, Kaumann, König, Lange, Stasik, Streather, Engelschalk and Lange2011). The results suggest that any training to improve impulsive behaviour should target response selection and executive control processes, e.g. by modulating higher-order (top-down) cognitive control skills, which have also been reported to yield strong effects on ADHD symptomatology (Lloyd et al. Reference Lloyd, Brett and Wesnes2010; Tucha et al. Reference Tucha, Tucha, Kaumann, König, Lange, Stasik, Streather, Engelschalk and Lange2011; Amonn et al. Reference Amonn, Frölich and Döpfner2013; Clark et al. Reference Clark, Schumann and Mostofsky2015). A further enhancement of this effect may be achieved through neurofeedback training. This may be particularly relevant since response selection processes that were found to affect impulsive behaviour in the current study have previously been shown to be mediated via neuronal oscillations in the theta frequency band (e.g. Beste et al. Reference Beste, Ness, Falkenstein and Saft2011; Huster et al. Reference Huster, Enriquez-Geppert, Lavallee, Falkenstein and Herrmann2013; Quetscher et al. Reference Quetscher, Yildiz, Dharmadhikari, Glaubitz, Schmidt-Wilcke, Dydak and Beste2015). These are commonly targeted in neurofeedback approaches in ADHD (Arns et al. Reference Arns, Conners and Kraemer2013; Meisel et al. Reference Meisel, Servera, Garcia-Banda, Cardo and Moreno2013; Gevensleben et al. Reference Gevensleben, Kleemeyer, Rothenberger, Studer, Flaig-Röhr, Moll, Rothenberger and Heinrich2014).
A limitation of the study is the relatively limited sample size and that the medication status within the ADHD-C group was very heterogeneous. However, the results obtained show strong effects and are unbiased with respect to age, IQ and gender, suggesting that the potential impact of the above-mentioned limitation factors is low. Also, any medication acting on the dopaminergic system in ADHD should normalize ERPs related to response inhibition (e.g. Beste et al. Reference Beste, Willemssen, Saft and Falkenstein2010). As the effects are still evident despite the medication heterogeneity, this suggests that the medication profile has little effect on the results obtained.
In summary, in the current study we examined which cognitive processing stages in the processing cascade from perceptual and attentional selection to response monitoring contribute to impulsive behaviour in paediatric patients with ADHD-C. Perceptual gating, stimulus-driven attention selection and resource allocation processes were more pronounced in the patient group and were related to activation differences in parieto-occipital networks. However, only response selection processes, associated with medial prefrontal networks, predicted impulsive errors in patients with ADHD-C. The results show that even though the clinical picture of ADHD-C is complex and a multitude of processing steps are altered, only a subset of processes directly modulates impulsive behaviour. This is in line with clinical observations in daily clinical care with impulsivity in patients with ADHD-C and may help to refine treatment algorithms focusing on impulsivity.
Acknowledgements
We thank all participants and are grateful to Benjamin Teufert for his help with the figures. This work was supported by a grant from the Else-Kröner Fresenius Stiftung (2014_A46).
Declaration of Interest
A.B. declares no competing or potential conflicts of interest. V.R. has received payment for consulting and writing activities from Lilly, Novartis and Shire Pharmaceuticals, lecture honoraria from Lilly, Novartis, Shire Pharmaceuticals and Medice Pharma, and support for research from Shire and Novartis. He has carried out (and is currently carrying out) clinical trials in cooperation with the Novartis, Shire and Otsuka companies. C.B. has received payment for consulting from GlaxoSmithKline and Teva.