INTRODUCTION
Protected areas on land and in the oceans are one approach to restricting hunting or harvest that has been shown to be effective in promoting the recovery of predatory species (see Linnell et al. Reference Linnell, Swenson and Anderson2001; Wabakken et al. Reference Wabakken, Sand, Liberg and Bjärvall2001; Gerber et al. Reference Gerber, Keller and DeMaster2007). However, conflict can arise for managers when the prey of those high-trophic level species are also of conservation (for example endangered species) or economic (for example livestock) value (Roemer & Wayne Reference Roemer and Wayne2003; Treves & Karanth Reference Treves and Karanth2003). For coastal marine ecosystems no-take marine reserves are touted as a valuable tool for ecosystem-based management, as they directly promote the recovery of populations of exploited species and can indirectly restore habitats through the recovery of lost trophic interactions (Leslie & McLeod Reference Leslie and McLeod2007; Salomon et al. Reference Salomon, Gaichas, Shears, Smith, Madin and Gaines2010). These expectations have been advanced in marine systems as fishing disproportionately targets top-level predators (Pauly et al. Reference Pauly, Christensen, Dalsgaard, Froese and Torres1998) and recoveries of such species provide the best examples of the direct effects of marine reserve protection (Babcock et al. Reference Babcock, Shears, Alcala, Barrett, Edgar, Lafferty, McClanahan and Russ2010). This increase in predators is expected to indirectly result in declines in lower trophic level species (Graham et al. Reference Graham, Evans and Russ2003; Willis & Anderson Reference Willis and Anderson2003; Micheli et al. Reference Micheli, Halpern, Botsford and Warner2004). However, in many coastal systems fishing is not restricted to the highest trophic levels (Dayton et al. Reference Dayton, Tegner, Edwards and Riser1998) and occurs on multiple trophic levels, including species that may be expected to decline inside reserves as an indirect response to increased predators. One of the main goals of reserve networks is to protect populations of harvested species that can potentially seed adjacent fished populations and counteract the effects of reduced available fishing areas (Halpern et al. Reference Halpern, Gaines and Warner2004). Clearly, if the build up of predators within reserves has indirect negative effects on harvested prey species within their boundaries (see Barrett et al. Reference Barrett, Buxton and Edgar2009), the potential benefits for populations outside of the reserve (through export of adults and/or larvae) are unlikely to exist. This poses a challenge to ecosystem-based management and questions the fisheries enhancement value of no-take marine reserves in situations where fishing occurs on multiple and interacting species.
Sea urchins are important herbivores on temperate reefs around the world (Steneck et al. Reference Steneck, Graham, Bourque, Corbett, Erlandson, Estes and Tegner2002) and support large fisheries in many regions (Andrew et al. Reference Andrew, Agatsuma, Ballesteros, Bazhin, Creaser, Barnes, Botsford, Bradbury, Campbell, Dixon, Einarsson, Gerring, Hebert, Hunter, Hur, Johnson, Juinio-Menez, Kalvass, Miller, Moreno, Palleiro, Rivas, Robinson, Schroeter, Steneck, Vadas, Woodby and Xiaoqi2002). Numerous studies have shown a decline in urchin populations in marine reserves following the recovery of their predators (see McClanahan Reference McClanahan2000; Shears & Babcock Reference Shears and Babcock2003; Guidetti Reference Guidetti2006; Barrett et al. Reference Barrett, Buxton and Edgar2009) and, in some cases, this has resulted in an indirect increase in macroalgae within reserves (Babcock et al. Reference Babcock, Shears, Alcala, Barrett, Edgar, Lafferty, McClanahan and Russ2010). Although these indirect benefits to macroalgae, and all the associated species that use them as habitat, are commonly touted as benefits of reserve protection, the expected decline in urchin populations are of potential concern if reserves are expected to supplement adjacent urchin fisheries. A number of theoretical and empirical studies suggest that no-take reserves can be effective as refugia for harvested urchins to maintain healthy populations and sustainable levels of harvest (Smith et al. Reference Smith, Botsford and Wing1998; Botsford et al. Reference Botsford, Morgan, Lockwood and Wilen1999; Tuya et al. Reference Tuya, Soboil and Kido2000; Guidetti et al. Reference Guidetti, Terlizzi and Boero2004; Pais et al. Reference Pais, Chessa, Serra, Ruiu, Meloni and Donno2007; Lau et al. Reference Lau, Dumont, Lui and Qiu2011), but these studies have not considered the potential effects of increased predation on urchin populations within reserves. Given the rapid growth in deployment of marine protected areas worldwide (Gaines et al. Reference Gaines, White, Carr and Palumbi2010), understanding the balance between direct and indirect effects of reserve protection on economically important mid-trophic level species is critical. If situations arose where no-take reserves had negative indirect effects on commercially important mid-trophic level species, alternatives such as ‘special purpose’ protected areas, where predator numbers are carefully controlled, could be considered to specifically protect these species. For example, the California Marine Life Protection Act is establishing a state-wide network of marine reserves (CDFG [California Department of Fish and Game] 2008); understanding how this network will affect the red urchin (Strongylocentrotus franciscanus) fishery, one of the highest-valued fisheries in California, is an important consideration for management and marine protected area design in this region.
The northern Channel Islands in Southern California are extremely important fishing grounds for red sea urchins, typically contributing more than half of California's annual catch (66% [5087 tonnes] in 2005; CDFG 2006). Long-term kelp forest monitoring data at the Channel Islands has shown that urchin abundances are consistently lower at sites inside a long-term no-take marine reserve compared to unprotected sites (Lafferty Reference Lafferty2004; Behrens & Lafferty Reference Behrens and Lafferty2004; Babcock et al. Reference Babcock, Shears, Alcala, Barrett, Edgar, Lafferty, McClanahan and Russ2010). This lower abundance of urchins has been attributed to an indirect effect of protection, as urchin predators (lobster Panulirus interruptus and sheephead wrasse Semicossyphus pulcher) are more numerous and larger at the reserve sites (Lafferty Reference Lafferty2004; Tetreault & Ambrose Reference Tetreault and Ambrose2007) and urchin size distributions are typically bimodal indicating higher predation on urchins at reserve sites compared to nearby unprotected sites (Behrens & Lafferty Reference Behrens and Lafferty2004). These patterns are consistent with the expectation that reserves will have a negative indirect impact on mid-trophic level species and imply that urchin populations, including those of commercially-harvested species, will decline in marine reserves. However, these comparisons of urchin densities between reserve and unprotected sites were based on total urchin densities and combined both harvested red urchins S. franciscanus and the smaller unharvested purple urchin S. purpuratus. Given the contrasting levels of fishing pressure on red and purple urchins, these two species may be expected to respond differently to marine reserve protection. Furthermore, the red urchin fishery targets large individuals (minimum size limit is 83 mm), and size structure data indicate that larger red urchins occur at reserve sites (Behrens & Lafferty Reference Behrens and Lafferty2004). Given that large red urchins produce disproportionately more larvae (Tegner & Levin Reference Tegner and Levin1983), the overall reproductive output from reserves may be similar to or even greater than unprotected populations, even if overall densities are lower in reserves. Differences in the vulnerability of the two sea urchin species to predators may also influence the potential indirect effects of protection. For example, a number of predators prey on both red and purple urchins, but they generally prefer purple urchins due to their smaller size or small red urchins (for example lobster [Tegner & Levin Reference Tegner and Levin1983], sheephead wrasse [Hamilton et al. Reference Hamilton, Caselle, Lantz, Egglof and Kondo2011; Tegner & Dayton Reference Tegner and Dayton1981] and the sunflower starfish Pycnopodia helianthoides [Freeman Reference Freeman2006]). Further analysis of these long-term data is therefore necessary to provide insights into how the effects of protection might differ between a commercially harvested and an unharvested species of urchin, and inform management and stakeholders in both California and worldwide.
The aim of this study was to compare the ecological consequences of reserve protection for both a harvested and an unharvested species of sea urchin. To address this and explore the relative importance of direct and indirect effects of reserve protection, we compared population characteristics of harvested red urchins and unharvested purple urchins between a long-term reserve and unprotected sites across the northern Channel Islands. Based on density-mediated indirect interactions, we predicted that the unharvested purple urchin would have lower abundances at reserve sites where predators are more abundant. However, for harvested red urchins predicting how density differed between reserve and unprotected sites was more difficult because of the opposing indirect effects of predators inside reserves and direct effects of harvesting outside reserves. Consequently, we hypothesized that predators inside reserves and harvesting outside reserves would have a similar regulatory effect on red urchins, and there would be no a priori expectation of population differences between reserve and unprotected sites. In addition to analysing densities, we also compared size, biomass, and reproductive potential between the reserve and unprotected sites, as these variables provide more biologically relevant information to assess reserve efficacy than density alone.
METHODS
Sampling locations and field methods
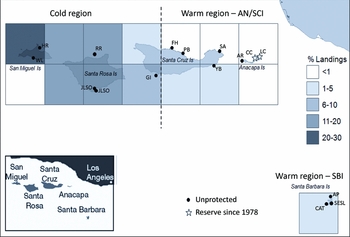
California's northern Channel Islands span a large biogeographic gradient, due to the intersection of ocean currents that differ in temperature (colder in the west; warmer in the east), which leads to distinct ecological communities between the eastern and western islands (Hamilton et al. Reference Hamilton, Caselle, Malone and Carr2010). The two most common sea urchin species, S. franciscanus and S. purpuratus, span the archipelago, but the majority of S. franciscanus harvesting (c. 90% of landings) occurs in the cold western region (Fig. 1). While little is known about interactions between these two species, both species are important grazers in southern California kelp forests and they compete for similar resources (reviewed in Rogers-Bennett Reference Rogers-Bennett and Lawrence2007).
Map of long-term kelp forest monitoring sites at the northern Channel Islands, showing the regional grouping of sites, and the long-term spatial distribution of red sea urchin Strongylocentrotus franciscanus harvest. The percentage of red sea urchin landings (1985–2003) within each of the management blocks is indicated by shading (data source: California Department of Fish and Game, unpublished data).

We analysed long-term data that has been collected by the US National Park Service Kelp-Forest Monitoring Program from 16 permanent rocky reef monitoring sites at the Channel Islands (Fig. 1, Table 1) since 1982 (Davis et al. Reference Davis, Kushner, Mondragon, Mondragon, Lerma and Richards1997). Two of these sites have had no-take protected status since 1978 in the Anacapa Island Ecological Reserve (c. 1 km2). The remaining unprotected sites span each of the five main islands. Previous studies have generally classified these as either being located in a ‘warm’ eastern or ‘cold’ western biogeographic region, with a transition near the western end of Santa Cruz Island (Behrens & Lafferty Reference Behrens and Lafferty2004; Lafferty Reference Lafferty2004; Fig. 1). However, Santa Barbara Island is located more than 60 km to the south-east of the main island chain and, due to its isolation, is likely exposed to differing oceanographic conditions than the other ‘warm’ region sites. Therefore, for our analyses we classified the unprotected sites into three regions: Santa Barbara Island (SBI), Anacapa/Santa Cruz Island (AN/SCI) and Cold (remaining sites from San Miguel and Santa Rosa Islands, and Gull Island, the westernmost site at Santa Cruz Island) (Fig. 1). Due to their close proximity and biogeographic similarity, the Anacapa Reserve sites would be expected to be most comparable to the AN/SCI sites.
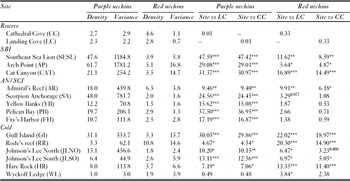
Long-term mean and variance of purple (S. purpuratus) and red (S. franciscanus) urchin densities at the Channel Islands (1982–2003). Results from Levene's tests are shown (test statistic F and significance: *p < 0.05, **p < 0.01, ***p < 0.001) comparing the long-term variability between each site and the two reserve sites (Cathedral Cove [CC] and Landing Cove [LC]).

Analyses were carried out on data from annual sampling at all 16 sites from 1982 to 2003 (except for two sites, Cat Canyon and Yellowbanks, which were not established until 1986). Data collected after 2003 were excluded, as the management regime changed at four sites when the Channel Islands Marine Protected Areas Network was established in 2003 (see URL http://www.dfg.ca.gov/marine/channel_islands/).
The characteristics of the reef at each of the monitoring sites are described in Reed et al. (Reference Reed, Raimondi, Carr and Goldwasser2000). An assessment of potential differences in reef characteristics among sites found no clear difference in environmental variables that might confound comparisons between reserve and unprotected sites (analysis of similarity [ANOSIM procedure in PRIMER v6]: Global R = 0.15, sample statistic = 10.4%). However, pair-wise tests revealed a statistically significant difference in reef habitat characteristics between the reserve sites and Cold sites in the western region (Global R = 0.854, sample statistic = 3.6%). Reserve sites had a higher cover of cobble (c. 19%), but the overall cover of rock was similar to unprotected sites in the warm region. In contrast, Cold sites tended to be deeper and have higher rock cover. Given these differences in reef characteristics, and the differing biogeographic regions, comparisons between the reserve sites and Cold sites need to be treated with caution. Previous studies have only compared the reserve sites with sites in the warm biogeographic region (Behrens & Lafferty Reference Behrens and Lafferty2004; Lafferty Reference Lafferty2004) or with nearby sites at Anacapa and Santa Cruz Island (Babcock et al. Reference Babcock, Shears, Alcala, Barrett, Edgar, Lafferty, McClanahan and Russ2010) to avoid this potential source of variation. While we recognize this limitation in the data set, we consider that the long-term data on protected populations of urchins at Anacapa Island provide an important reference point, and inclusion of all unprotected sites in the analyses provides important information on regional variation in urchin populations at the Channel Islands. In combination, this information was expected to provide insights into how urchins might respond to protection across the islands.
The density of red and purple urchins was recorded at each site annually using 2 m2 quadrats (n = 12–20) that were positioned at intervals along a 100 m permanent transect (note that each 2 m2 quadrat was sampled using two 1m2 quadrats placed on either side of the transect line; this technique is described as ‘1m Quadrat’ sampling in Davis et al. Reference Davis, Kushner, Mondragon, Mondragon, Lerma and Richards1997). Size frequency measurements were made for 100–200 urchins of both species collected or measured in situ from a series of 2 m by 5–10 m swaths that were perpendicular to the main transect at each site. Test diameter was measured to the nearest mm using Vernier callipers. The number of swaths depends on density, and care was taken to collect all urchins within each swath to ensure that the sample was representative of the population. No invasive sampling was conducted, but accessible urchins were removed for measurement and all conspecifics found under their spine canopy were also measured.
Area-based estimates of urchin biomass and reproductive potential
To investigate the effects of reserve protection on urchin biomass and reproductive potential, we combined annual density estimates and size frequency information using biomass- and gonad weight-urchin test diameter relationships. We used gonad weight as a proxy for reproductive potential, as the number of eggs produced by urchins is proportional to gonad size (Levitan Reference Levitan1991), which is strongly related to body size. This approach does not, however, take into account either the effects of body size and population density on fertilization success (Levitan Reference Levitan1991) or the effects of differences in food availability among sites or over time (Rogers-Bennett et al. Reference Rogers-Bennett, Bennett, Fastenau and Dewees1995).
We derived estimated biomass- and gonad weight-test diameter relationships based on a collection of purple urchins S. purpuratus (n = 68; size range: 6–63 mm test diameter [TD]) and red urchins S. franciscanus (n = 63; size range: 12–125 mm) from Anacapa Island in March 2008. Urchins were collected from a site with high kelp abundance to ensure that food limitation did not influence gonad yield, and therefore gonad weight was more likely to resemble reproductive potential.
S. purpuratus:
-
Wet weight (g) = 0.0005 TD 2.9641 (R2 = 0.999)
-
Gonad weight (g) = 0.1 × 10⁻⁶ TD 4.4326 (R2 = 0.899)
S. franciscanus:
-
Wet weight = 0.0005 TD 2.9628 (R2 = 0.998)
-
Gonad weight = 0.1 × 10⁻⁷ TD 4.7809 (R2 = 0.915)
The gonad weight to test diameter relationships for both species were comparable to that of Tegner and Levin (Reference Tegner and Levin1983). Using these relationships, we calculated the average biomass and gonad weight of red and purple urchins > 15 mm TD for each site and year based on the available size frequency data. We then multiplied these average values by the mean density of urchins to estimate biomass and gonad weight on an areal basis (namely biomass (g) or gonad weight (g) m−2 of reef). Urchins < 15mm test diameter were excluded from size frequency data for calculation of mean biomass and gonad weight, because the abundance of urchins below this size cannot be reliably assessed using 2 m2 quadrats; smaller urchins may hide in crevices and under the adult spine canopy.
Statistical analyses
Regional variation in urchin populations
We investigated regional variation in size, density, biomass and reproductive potential (gonad weight) of red and purple urchins using linear mixed models. Region was treated as a fixed factor (levels: SBI, AN/SCI and Cold), and Site (Region) was modelled as a random factor. Covariance parameter estimates were calculated for the random factor Site (Region) and also for the auto-regressive error structure (AR[1]) to account for repeated measures. Density, biomass and gonad weight data were natural log transformed to remove heterogeneity of variance, and fitted using residual (restricted) maximum likelihood in SAS v.9.2 (URL http://www.sas.com/index.html). All statistical analyses were carried out on annual site means from 1982 for density data, and 1985 for size, biomass and gonad weight data, through until 2003.
Quantifying differences between reserve and unprotected sites
To compare the variability in purple and red urchin abundances between reserve and unprotected sites, we used a Levene's test; this tests the null hypothesis of equal variances and does not require normality of the underlying data. The variance in mean abundance across years (1982–2003) at each of the two reserve sites was compared against the variance for each unprotected site.
We compared differences in size, density, biomass and reproductive potential (gonad weight) of red and purple urchins between reserve and unprotected sites using linear mixed models. A full factorial analysis of reserve status and region (SBI, AN/SCI and Cold) was not possible as both reserve sites were located in the AN/SCI region. Therefore, we conducted separate analyses that compared the reserves sites to unprotected sites from each of the three regions, and all unprotected sites combined. The same statistical approach was used as for the regional analysis (above), but with the fixed factor Status (levels: reserve and unprotected) and random factor Site (Status). Parameter estimates from the model were used to quantify effect sizes (with 95% confidence limits) for the factor Status (namely the magnitude of difference between reserve and unprotected sites) within each region.
RESULTS
Variation in purple and red urchin size structure
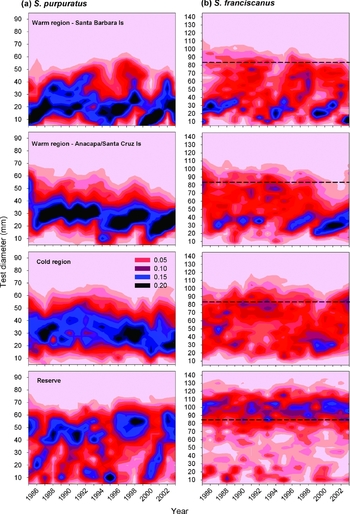
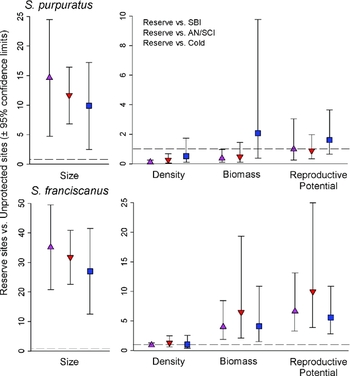
Purple urchins Strongylocentrotus purpuratus typically had a unimodal size distribution at unprotected sites with a modal size between approximately 20 and 40 mm test diameter (Fig. 2 a). Purple urchins tended to be larger in the Cold region, but there was no statistically significant difference in mean size between the three regions (Table 2). Large recruitment events for purple urchins were evident in the size frequency data in the warm regions c. 1985, 1994 and 1999, followed by growth of these cohorts to larger sizes. At reserve sites, purple urchins were on average 11.6 ± 6.6 mm (95% confidence interval) larger than at unprotected sites (Table 3, Fig. 4), and typically had a bimodal size distribution with a juvenile modal size-class (< 20 mm) and an adult modal size-class of c. 40–60 mm (Fig. 2 a).
Long-term variation in size structure of (a) purple urchins (S. purpuratus) and (b) red urchins (S. franciscanus) between unprotected sites in the SBI, AN/SCI and Cold regions and long-term reserve sites at the Channel Islands (Fig. 1). Shading represents percentage frequency interpolated across size bins and years. Dashed line indicates minimum legal test diameter for S. franciscanus (83 mm).

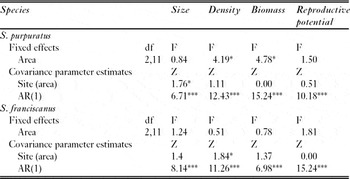
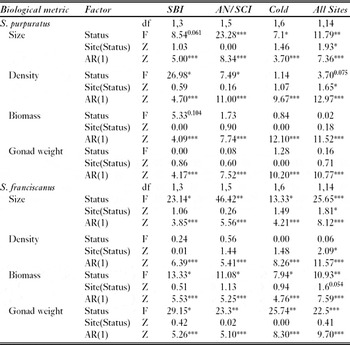
Mixed model analysis of the effect of region (SBI, AN/SCI and Cold) on the density, biomass and reproductive potential of purple (S. purpuratus) and red (S. franciscanus) urchins at long-term monitoring sites (note: the long-term reserve sites are not included in this analysis). Significance: *p < 0.05, **p < 0.01, ***p < 0.001. AR(1) is the auto-regressive error structure used to account for repeated measures.

Mixed model analysis of the effect of reserve status on the density, biomass and reproductive potential of purple (S. purpuratus) and red (S. franciscanus) urchins at long-term monitoring sites. Reserve sites are compared in separate analyses with unprotected sites from each of the three regions (SBI, AN/SCI and Cold), and then compared to all unprotected sites. Significance: *p < 0.05, **p < 0.01, ***p < 0.001. (Effect sizes for the factor status are shown in Fig. 4.) AR(1) is the auto-regressive error structure used to account for repeated measures.

There was no significant difference in the mean size of the harvested species S. franciscanus among the three regions (Table 2). S. franciscanus populations at unprotected sites in all regions were dominated by urchins below the minimum legal size (83 mm test diameter) and the proportion of urchins above the legal size limit tended to decline over time in the warm regions (Fig. 2 b). In contrast, populations of S. franciscanus at the two reserve sites were consistently dominated by individuals greater than the minimum legal size. The mean size of S. franciscanus at reserve sites was on average 30.4 ± 11.8 mm (95% confidence interval) larger than at unprotected sites (Table 3, Fig. 4).
Abundance, biomass and reproductive potential of purple and red urchins
Regional variation
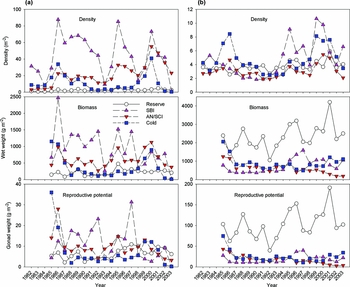
Purple urchins were considerably more abundant and also more variable over time than red urchin populations (Table 1, Fig. 3). The temporal pattern in purple urchin abundance was generally consistent across all three regions, with peaks in abundance apparent in 1986, 1995 and 2000, and a general decline in abundance from 2001–2003 (Fig. 3 a). Despite these large fluctuations, persistent regional variation was evident in overall densities (Table 2) with highest densities at SBI sites and lowest densities occurring in the Cold region. On average, purple urchins were 4.3 (CL95%: 1.6–11.7) times more abundant at SBI sites, and 2.1 (CL95%: 0.9–4.9) times more abundant at AN/SCI sites, compared to Cold region sites (Fig. 3 a, Table 2). Biomass also varied among regions (Table 2) and was significantly higher at sites in the two warmer regions compared to sites in the Cold region. Despite large regional differences in density, there was no overall difference in reproductive potential among regions (Table 2), as purple urchins in the Cold region tended to be larger (Fig 2 a).
Mean density, biomass and reproductive potential of (a) purple urchins (S. purpuratus) and (b) red urchins (S. franciscanus) at long-term monitoring sites at the northern Channel Islands.

Strongylocentrotus franciscanus exhibited less extreme fluctuations in density, but had similar peaks across the three regions in 1986, 1995 and 1999/2000 (Fig. 3 b). However, in contrast to purple urchins, there were no overall difference in red urchin density, biomass or reproductive potential among regions (Fig. 3 b, Table 2).
Reserve versus unprotected sites
Purple urchin densities were lower and less variable over time at the reserve sites compared to all of the unprotected sites (Fig. 3 a, Table 1), except for Wyckoff Ledge on the south side of San Miguel Island. Initially, densities at the two reserve sites were comparable with nearby unprotected sites at Anacapa and Santa Cruz Islands (Fig. 3 a), but while the densities in the reserve have remained consistently low since 1982, densities at these unprotected sites have exhibited a diverging and increasing trend.
Overall purple urchin densities were 3.4 (CL95%: 1.0–12.0) times higher at unprotected sites compared to reserve sites, but this effect was marginally significant and varied regionally (Table 3, Fig. 4). Purple urchin density was consistently lower at reserve sites compared to unprotected sites in the two warm regions; densities at SBI sites were 8.3 (CL95%: 2.4–28.7) times higher than the reserve sites, and 4.0 (CL95%: 1.3–12.5) times higher at AN/SCI sites compared to reserve sites. Densities at Cold region sites were highly variable (Table 1, Fig. 3 a) and not statistically different from reserve sites (Table 3, Fig. 4). While not evident (Fig. 3 a), densities at all of the Cold region sites except Gull Island were generally lower than the reserve sites between 1990 and 1998. Due to the larger size of urchins found in the reserve, there was no overall statistical difference in the biomass or reproductive potential of purple urchins between reserve and unprotected sites (Table 3, Figs 3 a and 4). However, biomass tended to be higher at SBI sites (CL95%: 1.0–6.4) and AN/SCI sites (CL95%: 0.7–6.5) when compared to reserve sites (Fig. 4).
The relative effect of reserve protection on the size, density, biomass and reproductive potential of purple (S. purpuratus) and red urchins (S. franciscanus). Effect sizes with 95% confidence limits are derived from mixed model analysis by comparing metrics between the long-term reserve sites and the unprotected sites in each of the three regions. Effect sizes are additive for size (mm) and multiplicative (ratios) for density, biomass and reproductive potential (error bars that do not overlap the dashed line indicate a statistically significant difference between reserve and unprotected sites).

The density of S. franciscanus at the reserve sites was comparable to unprotected sites and, while the two reserve sites had the lowest variance across years compared to other sites, there was no significant difference between the variance at reserve sites and the nearby unprotected sites at Santa Cruz Island (Fig. 3 b, Table 1). Red urchin densities at unprotected sites at SBI and Cold region sites were generally more variable than at both reserve sites. There was no difference in the density of S. franciscanus between reserve sites when compared against all unprotected sites, or unprotected sites in each of the three regions (Figs 3 b and 4, Table 3). In contrast, due to the larger size of urchins at reserve sites, biomass and reproductive potential were significantly higher compared to unprotected sites for all regions (Table 3, Fig. 4). Overall, biomass was 4.8 (CL95%: 1.8–12.4) times higher in the reserve compared to all unprotected sites and reproductive potential was 7.0 (CL95%: 3.1–15.7) times higher at reserve sites.
DISCUSSION
Expectations based on density-mediated indirect interactions suggest that prey species will decline in reserves due to an accumulation of predators following protection (Micheli et al. Reference Micheli, Halpern, Botsford and Warner2004, Babcock et al. Reference Babcock, Shears, Alcala, Barrett, Edgar, Lafferty, McClanahan and Russ2010). Consequently reserves are not expected to have equal conservation benefits for all species, particularly those at lower trophic levels. Our analysis of the density of unharvested purple urchins (S. purpuratus) is broadly consistent with this premise, as densities were lower at reserve sites when compared to unprotected sites in the two warmer regions. However, there was no evidence of a decline in purple urchin densities at reserve sites throughout the time series, and densities of purple urchins were similar when compared between reserve sites and unprotected sites in the Cold region. For the harvested red urchin (S. franciscanus), densities were comparable between reserve sites and unprotected sites in all regions. These data from a long-term reserve clearly demonstrate the difficulties in generalizing as to the effect of reserves on sea urchin densities and urchin populations in general. While the overall level of inference from this study is somewhat limited, due to there being only two protected sites in a relatively small no-take reserve (discussed below), the findings have a number of important messages for conservation management and predicting the indirect effects of marine reserves on prey species.
Densities of sea urchins have been shown to decline in numerous marine reserves worldwide following the recovery of predators (Barrett et al. Reference Barrett, Buxton and Edgar2009; Babcock et al. Reference Babcock, Shears, Alcala, Barrett, Edgar, Lafferty, McClanahan and Russ2010). Such declines were not evident for both species of urchins in the Anacapa reserve, according to the data available since monitoring began in 1982. Instead, as noted in Babcock et al. (Reference Babcock, Shears, Alcala, Barrett, Edgar, Lafferty, McClanahan and Russ2010), the current contrasting states between reserve and nearby unprotected sites (AN/SCI) have resulted from an increase in purple urchins at the unprotected sites over time, whereas densities have remained low at reserve sites. Large recruitment events are evident in the size frequency data across all sites (Fig. 2 a) and these translate into large peaks in abundance at the unprotected sites in all three regions (Fig. 3 a). While these recruitment events are also apparent in the size frequency data at reserve sites, they do not translate into large increases in abundance as seen at all other sites, including those in the Cold region where densities are on average comparable to the reserve sites but considerably more variable (Table 1, Fig. 3 a). The persistence of larger purple urchins in the reserve and a more bimodal population structure at reserve sites is consistent with high predation on juvenile size-classes as they move from cryptic (sheltering under adult spine canopy or in crevices) to more exposed behaviour (Tegner & Dayton Reference Tegner and Dayton1981; Cole & Keuskamp Reference Cole and Keuskamp1998). Therefore, at reserve sites predators may play a role in preventing the large increases in purple urchins seen at the unprotected sites, yet there is sufficient recruitment in the reserve to maintain low densities even in the presence of unfished predator populations.
The observed patterns demonstrate the importance of using biological metrics that incorporate individual properties such as size, biomass and reproductive potential to investigate reserve efficacy on particular species, rather than analysis of population-level properties (such as density) alone. This was particularly evident for harvested red urchins, which were consistently larger at reserve sites. Despite occurring at similar densities inside and outside the marine reserve, the larger size meant that the biomass and reproductive potential of red urchins was considerably higher at reserve sites compared to unprotected sites. This pattern persisted throughout the time series, with reserve and unprotected sites tending to diverge over time, particularly for the AN/SCI sites where red urchin biomass and reproductive potential declined over time (Fig. 3 b). This change may be related to continued red urchin harvesting over this period or associated with increased interspecific competition with purple urchins, which increased at these sites (Fig. 3 a).
The observed differences in urchin size-structure between reserve and unprotected sites have clear implications for understanding the overall efficacy of reserves for urchin populations that would not be predicted by simple density-based predator-prey models. The differences in size distributions can most likely be explained by differences in the size-selectivity of humans, which target large individuals due to commercial size limits, and urchin predators, which prefer smaller urchins (Tegner & Dayton Reference Tegner and Dayton1981; Tegner & Levin Reference Tegner and Levin1983; Freeman Reference Freeman2006; Hamilton et al. Reference Hamilton, Caselle, Lantz, Egglof and Kondo2011). The size-selective harvesting by humans of larger more fecund individuals likely has a strong regulatory effect on overall biomass and reproductive potential of red urchins outside reserves. In contrast, reserve populations are dominated by large individuals that appear to have reached a size where they are less vulnerable to predators (Tegner & Dayton Reference Tegner and Dayton1981; Tegner & Levin Reference Tegner and Levin1983; Freeman Reference Freeman2006; Hamilton et al. Reference Hamilton, Caselle, Lantz, Egglof and Kondo2011). A stable population of large individuals has persisted at the two reserve sites examined in this study at least since urchin size monitoring began in 1985. Given the exponential increase in egg production with test size, the lack of senescence in red urchins (Ebert Reference Ebert2008), and persistence of kelp at these reserve sites (Lafferty & Behrens Reference Lafferty and Behrens2005), these individuals are likely to produce a disproportionately large number of larvae compared to populations at unprotected sites. This potential benefit of reserves on reproductive output is however reliant on persistence of adult populations above a critical density necessary for successful fertilization (Levitan et al. Reference Levitan, Sewell and Chia1992). The long-term mean density of red urchins at reserve sites (3.8 ± 0.2 m−2) appears sufficient to support fertilization given that Levitan et al. (Reference Levitan, Sewell and Chia1992) recorded up to 82% fertilization success at densities of 4 m−2. Additionally, while red urchin densities were similar at reserve and unprotected sites, the larger size of urchins at reserve sites (with concomitant higher per urchin gamete production) may in fact result in higher fertilization success compared to unprotected sites.
The long-term data suggest that there are conservation benefits of protecting large urchins from harvesting in no-take reserves, despite the presence of predators. However, in situations where predators are less size-selective (such as sea otters; Estes & Duggins Reference Estes and Duggins1995) or when urchin species are smaller and less likely to reach a size refuge (for example purple urchins; Tegner & Levin Reference Tegner and Levin1983), these benefits may not occur. In this study, purple urchins occurred at lower densities in reserve sites, consistent with the top-down density-mediated model. However, despite not being harvested outside reserves, purple urchins were also larger at reserve sites and there were no net differences in estimated biomass or reproductive potential between reserve and unprotected sites. The larger size of purple urchins in reserves is likely due to reduced intraspecific competition and more persistent kelp abundance in the reserve compared to unprotected sites (Lafferty & Behrens Reference Lafferty and Behrens2005). Both urchin size and gonad quality are closely related to food availability (Rogers-Bennett et al. Reference Rogers-Bennett, Bennett, Fastenau and Dewees1995; Wing Reference Wing2009), and this suggests a potential compensatory mechanism that can potentially mitigate the negative effects of predators on prey populations in reserves. Other mechanisms such as behavioural modification may also provide a mechanism to facilitate prey species population persistence in the presence of abundant predators. For example, in marine reserves in Tasmania, juvenile abalone remain cryptic to larger sizes in the presence of predators (Pederson et al. Reference Pederson, Barrett, Frusher and Buxton2008). Similarly, small red urchins have been shown to alter feeding rates in the presence of predators (Freeman Reference Freeman2006). Such behavioural modifications have been proposed to explain why the total density of sea urchins can be similar between macroalgal habitats in reserves and barren areas at unprotected sites (Shears & Ross Reference Shears and Ross2010). Variations in food supply may also alter sea urchin behaviour (Harrold & Reed Reference Harrold and Reed1985), so in order to better understand these interactions further research is needed on the relative role of predators and food availability in controlling urchin behaviour.
The differences in urchin populations between reserve and unprotected sites are consistent with both direct and indirect effects of protection. However, understanding how the distribution of species vary across environmental gradients is key when predicting the ecological effects of reserve protection based on spatial contrasts between reserve and unprotected sites (Shears et al. Reference Shears, Babcock and Salomon2008). This is particularly important at the Channel Islands, which span a large environmental gradient (Hamilton et al. Reference Hamilton, Caselle, Malone and Carr2010). A limitation of this long-term monitoring programme is that there are only two reserve sites in one long-term reserve at Anacapa Island, and no long-term reserves exist in other parts of the island chain. While this limits broader extrapolation of these data to some extent, understanding how urchin harvesting, and urchin and kelp abundance, vary across the islands provides necessary context within which to interpret the observed patterns and also allows prediction of how urchins will respond to protection in the more recently established network of reserves that span the Channel Islands. The majority of red sea urchin landings come from the Cold region (Fig. 1) where kelp is typically more persistent (Lafferty & Behrens Reference Lafferty and Behrens2005). The abundance of purple urchins is inversely related to this, being considerably more abundant in the warmer regions (Fig. 3 a). In contrast, red urchin abundance did not exhibit clear regional variation among unprotected sites. Given that the Anacapa reserve is located in the warm region, the low density of purple urchins, larger red urchins and more persistent kelp at reserve sites is counter to what would be expected based on the biogeographic differences between the warm and cold regions. Furthermore, the considerably larger size and higher reproductive potential of red urchins at both reserve sites compared to all of the unprotected sites is unlikely to be due to unknown site-level characteristics, and strongly suggests a conservation benefit of protecting commercially harvested urchins in no-take reserves. Nevertheless, continued monitoring is needed to assess whether similar effects will transpire in the more recently established reserves at the Channel Islands, and in particular how the ecological consequences of protection might vary between the warm and cold regions.
This study demonstrates that predicting the response of prey species such as sea urchins to protection is complex due to conflicting direct and indirect effects, and this is further complicated in systems where harvested species have unharvested competitors. For unharvested prey species such as purple urchins, while densities may decline in reserves, the population-level consequences may be counteracted by larger individual size in reserves. While the mechanisms responsible for these differences are less well understood, they suggest other compensatory effects of predators (reduced intraspecific competition), and potentially behavioural modification in prey species, allow viable populations to persist in the presence of predators. Altered behaviour of prey species has been shown to ameliorate the population-level effects of predators in terrestrial reserves (Ripple & Beschta Reference Ripple and Beschta2004), but these mechanisms deserve further exploration in the investigation of marine reserve effects. In the case of harvested prey species, differences in size-selectivity between humans and predators can result in higher biomass and reproductive potential in reserves despite similar densities. On coral reefs, prey fish species have also been shown reach a size refuge and persist in reserves despite high predator biomasses (Mumby et al. Reference Mumby, Dahlgren, Harborne, Kappel, Micheli, Brumbaugh, Holmes, Mendes, Broad and Sanchirico2006). For harvested prey species the response to protection is also likely to vary depending on the presence of competitors. In the absence of abundant competitors, harvesting is likely to be one of the main factors limiting prey populations and the direct effects of protection are likely to be rapid; this may be the case for red urchins in the Cold region at the Channel Islands. In contrast, when unharvested competitors are abundant (as is the case for purple urchins in the warm region of the Channel Islands) the recovery of harvested prey species in reserves may be limited by interspecific competition. Perhaps, the recovery of harvested species will only be possible when and if predators are able to control the abundance of unharvested competitors; the time-frame for such indirect effects can take decades (Babcock et al. Reference Babcock, Shears, Alcala, Barrett, Edgar, Lafferty, McClanahan and Russ2010).
CONCLUSION
Understanding the complexities of how species interact with each other, their environment and humans is essential when predicting how predator and prey species will respond to protection. We have demonstrated that, owing to some of these complexities, prey species can benefit from protection in no-take reserves and simple density-mediated models may not provide accurate predictions to inform management or stakeholder groups as to how prey populations might be affected by reserves. Furthermore, incorporating individual properties such as size into ecological models is essential to predicting both the ecological consequences and conservation outcomes of reserve protection for mid-trophic level species.
ACKNOWLEDGEMENTS
We are extremely grateful to the US National Park Service for providing the Kelp Forest Monitoring Program data and to the many divers that collected it. This study was initiated following discussions at the MPA monitoring workshops held at NCEAS in 2008 as part of the five-year review of the Channel Islands Marine Reserve Network. K. Lafferty, A. Larsen and three anonymous reviewers provided valuable comments on earlier versions of the manuscript. Postdoctoral support was provided to NTS by the New Zealand Foundation of Research Science and Technology and the Partnership for Interdisciplinary Studies of Coastal Oceans. Thanks also to J. Maassen for providing valuable discussion and insights into the red urchin fishery.