Introduction
In the current world, engineers face many kinds of design problems and propose multiple solutions for each of these (Jonassen et al., Reference Jonassen, Strobel and Lee2006). These design problems could involve the development of a complete product or modification of an existing product (Siddharth and Sarkar, Reference Siddharth and Sarkar2018). In both cases, a number of solution alternatives are generated, evaluated, modified, and selected (Srinivasan and Chakrabarti, Reference Srinivasan and Chakrabarti2010a). Only creative products have the potential to sustain competition in the market (Hart and Christensen, Reference Hart and Christensen2002). Assessing “creativity” is vital for selecting a solution; it provides a justification as to which aspects of the product are less creative; as a result, assessing creativity aids in exploration and development of more creative solutions (Jordanous, Reference Jordanous2012).
The overall aim of this research is to develop a creativity assessment method that could be applied to ideas and concepts as these evolve during the entire design process. To systematically address the issue of how to influence creativity of design solutions, the following questions have been framed. (1) Which factors should be used as indicators of creativity consistently across different phases of the engineering design process? (2) How can creativity be assessed in terms of these factors during the engineering design process? The second question required a couple of sub-research questions as given below to be answered.
(a) Explore literature to find whether existing creativity assessment methods can be and whether these have been explored to be used in assessing creativity during the design process, and if these are either insufficient or have not been explored for the same, how to develop a creativity assessment method to assess creativity during the design process.
(b) Evaluate the proposed creativity assessment method for correctness; whether the proposed method can be used by designers during the design process (usability); and what is the impact of creativity assessment when used during the design process?
The concept of creativity is discussed in the section ‘Understanding creativity’, which reviews several major indicators proposed in the literature. In the section ‘Creativity assessment methods’ various methods proposed for assessing creativity are reviewed; their shortcomings are identified in the sub-section ‘Major findings'. By integrating some of these methods and addressing their limitations, a creativity assessment method is proposed; using an example, it is explained as to how the method can be applied during the design process. In the section ‘Evaluation of the proposed creativity assessment method’, evaluation of the proposed creativity assessment method is presented. The section ‘Example of a design session’ explains application of the method in guiding the effort during the design process using a case study. The evaluation is carried out for correctness (the section ‘Correctness evaluation of the proposed method’), and partially for usability and impact (the section ‘Usability and impact evaluation of the proposed method’). The section ‘Discussion’ discusses as to how the method is intended to overcome the limitations of earlier methods. The section ‘Limitations’ discusses the various limitations of the proposed method. The sections ‘Conclusions’ and ‘Future work’ present the major conclusions and directions for further research.
Background
Understanding creativity
Creativity is seen to have four facets: process, product, person, and situation (MacKinnon, Reference MacKinnon1970). In this section, we provide an overview of the literature on creativity, exploring specifically its product facet; this is because “product” or outcome-characteristics-based definitions and indicators have been considered by many to be the most direct indicators of creativity (Howard et al., Reference Howard, Culley and Dekoninck2008). Research on creativity evolved over the years, and many factors, including novelty, variety, fluency, surprise etc. have been proposed as its potential indicators. Over 200 definitions for creativity exist in the literature (Sarkar and Chakrabarti, Reference Sarkar and Chakrabarti2011, Reference Sarkar and Chakrabarti2015). Using the factors that they considered as crucial indicators of creativity, researchers proposed various metrics to assess creativity.
Newell et al. (Reference Newell, Shaw and Simon1959) associate creative thinking primarily to Novelty and value. Novelty (new or original) has been considered the primary indicator for creativity (Fox, Reference Fox1963; Jackson and Messick, Reference Jackson and Messick1965). Moss (Reference Moss1966) considers creativity to be the product of two factors: usefulness and unusualness. Later, creativity has been characterized by appropriateness alongside novelty (Brown, Reference Brown, Glover, Ronning and Reynolds1989). Brown (Reference Brown, Glover, Ronning and Reynolds1989) further states that a product must meet the demands that arise from a situation and it must satisfy the needs specified by the creator. This factor was termed technical quality in (Christiaans, Reference Christiaans2002) and later as quality by Shah et al. (Reference Shah, Smith and Vargas-Hernandez2003), who also considered unusualness (as a measure of novelty) to be an important indicator of creativity.
Further unusualness, unexpectedness, and surprise are also used as indicators of creativity (Bruner, Reference Bruner1962; Dorst and Cross, Reference Dorst and Cross2001; Ludden et al., Reference Ludden, Schifferstein and Hekkert2008, Grace and Maher, Reference Grace and Maher2015; Grace et al., Reference Grace, Maher, Fisher and Brady2015). Ludden et al. (Reference Ludden, Schifferstein and Hekkert2008) observed that surprise arose due to the presence of different levels of novelty in the product. Bruner used “effective surprise” as an indicator of creativity. Surprise can also be created when a very familiar solution works much better than expected for a requirement. Surprise can be due to both novelty and value (Sarkar and Chakrabarti, Reference Sarkar and Chakrabarti2015).
According to Chakrabarti (Reference Chakrabarti2006), main indicators of creativity are novelty, purposefulness, and resourcefulness. In a review conducted by Howard et al. (Reference Howard, Culley and Dekoninck2008), these indicators, which have taken different forms in literature, have been variously grouped under originality (novel, original, new, unusual), appropriateness (appropriate, useful, purposeful, valuable, meaningful, tenable, satisfying), and other elements (unobvious, adaptive, leap, change, unexpected, resourceful, etc.). In another review, Sarkar and Chakrabarti (Reference Sarkar and Chakrabarti2015) stated that creativity is indicated mainly by novelty (new, original) and usefulness (appropriate, realizability, requirement-satisfaction); the other elements, it is argued by them, are covered by the above two umbrella indicators (Sarkar and Chakrabarti, Reference Sarkar and Chakrabarti2015).
As has been found from the reviews of Howard et al. (Reference Howard, Culley and Dekoninck2008) and Sarkar and Chakrabarti (Reference Sarkar and Chakrabarti2015), creativity is indicated mainly by novelty and value/usefulness. This has also been empirically validated by Sarkar and Chakrabarti (Reference Sarkar and Chakrabarti2011). Therefore, this work considers novelty and usefulness as the overarching indicators of creativity.
Creativity assessment methods
Creativity assessment methods are broadly classified as process-based and outcome-based (Shah et al., Reference Shah, Smith and Vargas-Hernandez2003). As mentioned earlier in Section ‘Understanding creativity', review in this paper focuses on outcome-based methods to understand in depth as to how these methods are used to assess novelty and usefulness.
Moss (Reference Moss1966)
This is one of the earliest methods for creativity assessment. It considers creativity to be the product of two factors: usefulness and unusualness. Unusualness is measured on a scale of 0–3, indicating how distinct the solution is, compared with products that satisfy similar requirements from the past.
Usefulness was rated on a scale of 0–3 by comparing the solution with a “teacher's solution ”, which is considered to have solved all requirements. The requirements satisfied by the teacher's solution are taken as the complete set of requirements that are necessary to represent the problem. However, if we consider the example of a stapler, which has evolved over years, the basic design remained the same. The latest design of stapler according to Stapleless (2017) does not require a staple pin for attaching sheets of paper; instead a mechanism cuts and folds a small portion of the sheets so that these are attached together. It is difficult to compare this new design with the teacher's solution, where the requirement of eliminating staple pins was not considered. Therefore, measurement of usefulness would be more reasonable if the solution were evaluated directly against a set of requirements that represent the current needs.
Chakrabarti and Khadilkar (Reference Chakrabarti and Khadilkar2003)
In this method, novelty of a product was assessed by comparing it against a reference product, using certain “horizontal” and “vertical” criteria. The vertical criteria are need, working principle, technology, and implementation. At each vertical criterion, horizontal criteria such as main, supplementary, and additional functions are used. For each difference observed between the product and the reference, the weights for the corresponding criteria were multiplied and then added across all the differences observed.
Shah et al. (Reference Shah, Smith and Vargas-Hernandez2003)
In this method, ideation-effectiveness was measured using novelty, variety, quality, and quantity. Novelty measurement is carried out as shown in Eq. (1). The novelty (M 1) is measured across m functions that a solution needs to satisfy and at n stages of design in which the designs are created. For each function (j), a weight f i is assigned and for each stage (k) of design, a weight p k is assigned.
 $$M_1 = \mathop \sum \limits_{\,j = 1}^m f_i\mathop \sum \limits_{k = 1}^n S_{1jk}p_k\; $$
 $$S_{1jk} = \displaystyle{{T_{\,jk} - C_{\,jk}} \over {T_{\,jk}}} \times 10\; $$
For a design stage (k) and a function (j), a novelty score is given by S 1jk.
There are two approaches for calculating S 1jk . One approach requires comparison with the universe of ideas to identify the degree of unusualness or unexpectedness.
The second approach uses Eq. (2), where T jk is the total number of ideas that are generated within a set of parallel design sessions that solve the same problem in multiple groups, for a given function (j) during a design stage (k). C jk is the number of similar solutions within a session, for a given function or attribute (j) at a given design stage (k). The novelty score is evaluated for the ideas that are generated during the design sessions in parallel.
Nelson et al. (Reference Nelson, Wilson, Rosen and Yen2009)
Variety measurement is carried out as shown in Eq. (3). However, this measure has two flaws, which were demonstrated and addressed in Nelson et al. (Reference Nelson, Wilson, Rosen and Yen2009). The two flaws are as follows: (i) lower scores for higher variety and (ii) normalizing a group score. The first flaw is that the level of abstractions were imbalanced, that is, the idea set with higher number of ideas at physical principle level was rated lower compared with the idea set with lower number of ideas at physical principle level. Thus, Eq. (4) was proposed to measure variety. The second flaw identified was that the normalization carried out in Eqs (3) and (4) provides an individual variety score for each idea, which is meaningless without the list of ideas it is compared against. Therefore, the variety metric was refined, and the modified metric for variety without normalization for a group of ideas is proposed using Eq. (5). Further, a new metric named quality of design space exploration was proposed by Nelson et al. (Reference Nelson, Wilson, Rosen and Yen2009), as given by Eq. (6).
 $$V = \mathop \sum \limits_{\,j - 1}^m f_i\mathop \sum \limits_{k = 1}^n S_kb_k/N\; \; $$
 $$V = \mathop \sum \limits_{\,j - 1}^m f_i\left( {S_1\lpar {b_1 - 1} \rpar + \mathop \sum \limits_{k = 1}^n S_K\mathop \sum \limits_{l = 1}^{b_k - 1} d_l/\lpar {N - 1} \rpar } \right)\; $$
 $$V = \mathop \sum \limits_{\,j - 1}^m f_i\left( {S_1\lpar {b_1 - 1} \rpar + \mathop \sum \limits_{k = 1}^n S_K\mathop \sum \limits_{l = 1}^{b_k - 1} d_l} \right)\; \; $$
 $$DSQ = \mathop \sum \limits_{\,j - 1}^m f_i\bar n_j\mathop \sum \limits_{k = 1}^n S_k\lpar {b_k - 1} \rpar \; \; $$
Peeters et al. (Reference Peeters, Verhaegen, Vandevenne and Duflou2010)
In this method, a modified novelty measure has been developed by Peeters et al. (Reference Peeters, Verhaegen, Vandevenne and Duflou2010). They found that in Shah et al. (Reference Shah, Smith and Vargas-Hernandez2003) to calculate S 1jk, novel variations on a concept will be ignored when only taking the conceptual stage into account. This is true at the embodiment stage as well. This is addressed by two modifications: (1) the novelty calculation to include the genealogy tree as proposed in Nelson et al. (Reference Nelson, Wilson, Rosen and Yen2009) along with different set of weights assigned for the design stages; and (2) assigning a novelty score for each idea on a scale of 0–10 within the stages.
Oman et al. (Reference Oman, Tumer, Wood and Seepersad2013)
Oman et al. (Reference Oman, Tumer, Wood and Seepersad2013) developed Comparative Creativity Assessment (CCA) method to evaluate the creativity of a solution using the metrics of novelty and quality proposed by Shah et al. (Reference Shah, Smith and Vargas-Hernandez2003). It is given by Eq. (7), where W N and W Q are the weights of importance of novelty and quality respectively, and f j is the weight of importance of function j. $\; S_{N_j}$ and
 $S_{Q_j}$ scores of novelty and quality for function f j, is given by Eqs (8) and (9), where R j is the number of similar solutions in T j to function j being evaluated in Novelty; A j is the maximum value for criteria j in set of results; B j is the minimum value for criteria j in a set of results; and x j is the value for criteria j of design being evaluated.
 $$C = W_N\left( {\mathop \sum \limits_{\,j = 1}^m f_jS_{N_j}} \right) + W_Q\left( {\mathop \sum \limits_{\,j = 1}^m f_jS_{Q_j}} \right)$$
 $$S_{N_j} = \displaystyle{{T_j - R_j} \over {R_j}} \times 10\; $$
 $$S_{N_j} = 1 + \lpar {A_j - x_j} \rpar \lpar {10 - 1} \rpar /\lpar {A_j - B_j} \rpar \; $$
Sarkar and Chakrabarti (Reference Sarkar and Chakrabarti2007, Reference Sarkar and Chakrabarti2011)
Novelty
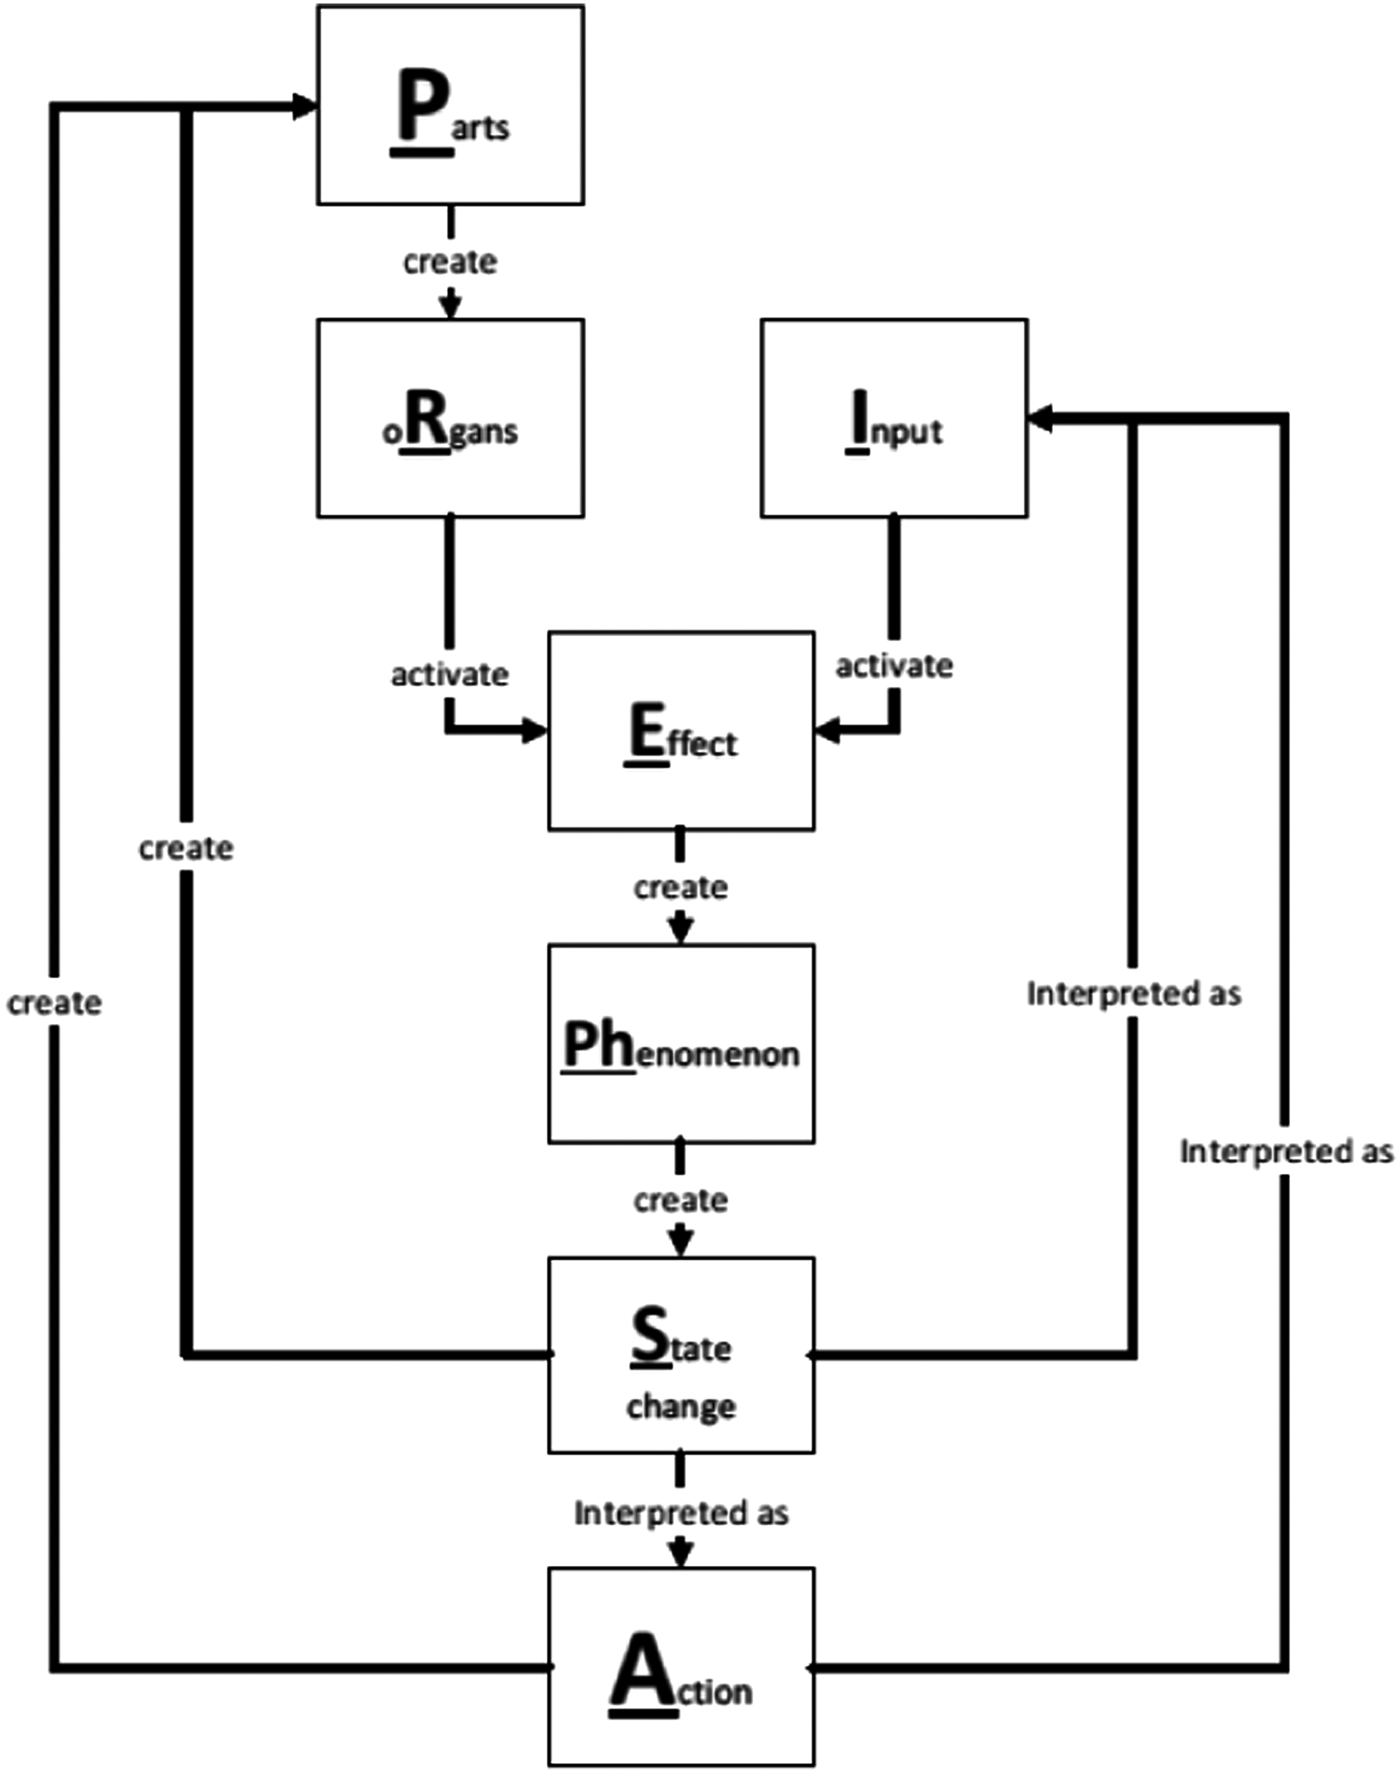
This method combines novelty and usefulness as a proposed measure of creativity. In order to assess novelty, a product is compared with other existing products at different levels of abstraction using FBS (Qian and Gero, Reference Qian and Gero1996) and SAPPhIRE (Chakrabarti et al., Reference Chakrabarti, Sarkar, Leelavathamma and Nataraju2005), as shown in Figure 1, explains the behavior of a system using seven constructs: State changes, Actions, Parts, Phenomena, Inputs, oRgans, and Effects. The level of abstraction ranges from Parts (low) to Actions (high).
SAPPhIRE model (Chakrabarti et al., Reference Chakrabarti, Sarkar, Leelavathamma and Nataraju2005).

In the FBS model-based comparison, a distinction at the function level denotes that the product is “highly novel” and if not, the comparison is to be made at the structure level. The product has some novelty if the structure is found to be different. If either of these is true, the comparison is made using SAPPhIRE model by a one-to-one match of each entity. Difference at each entity denote the following: (1) oRgans OR Parts → “low novelty product”; (2) (Phenomena OR Effects) AND (oRgans OR Parts) → “medium novelty product” (3) (State changes OR Inputs) AND (Phenomena OR Effects) AND (oRgans OR Parts) → “high novelty product’.”
There are two issues related to novelty assessment explained in Sarkar and Chakrabarti (Reference Sarkar and Chakrabarti2007, Reference Sarkar and Chakrabarti2011) as discussed below.
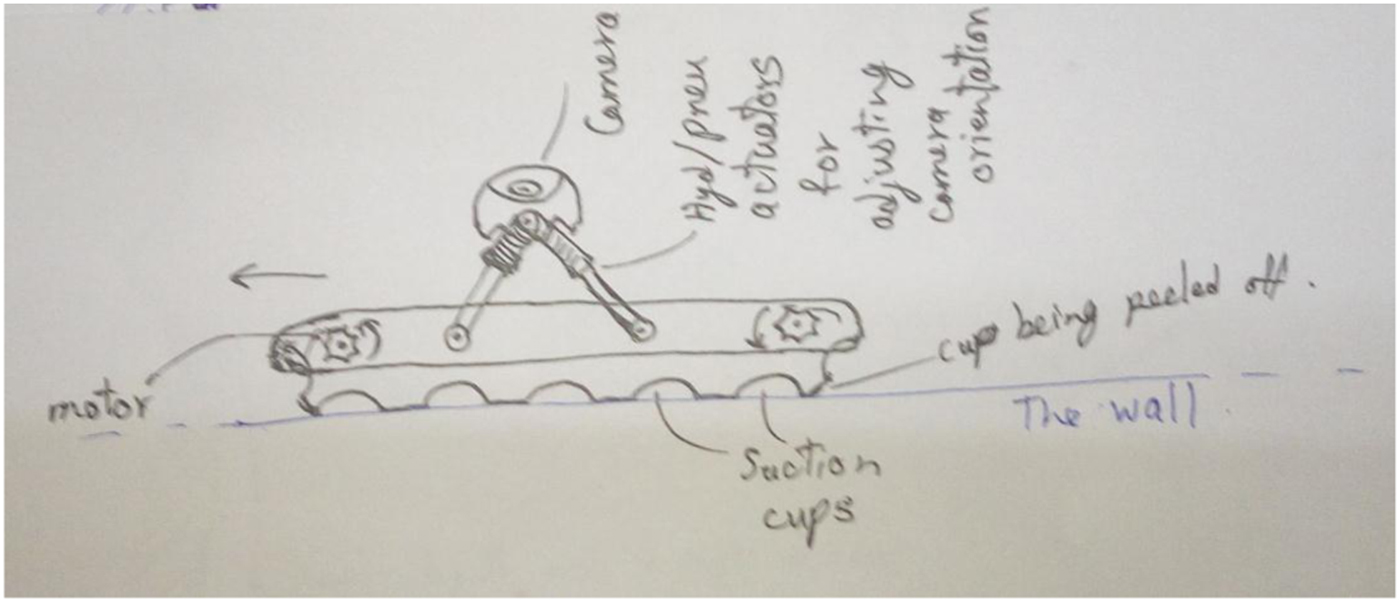
1. Applying this method to compare an idea or a concept against a product is difficult. For instance, let us consider the concept of a wall-climbing robot in Figure 2, which was generated during an earlier design experiment in our studies. If the novelty of this concept is to be assessed, it is necessary to search for this concept in the existing product space (e.g. Google patent search). The search results from such product spaces are usually detailed. If the SAPPhIRE model is to be used to compare these two concepts, the first concept that is, the solution would require one model, but the second that is, an existing product would require a combination of models as shown in Chakrabarti et al. (Reference Chakrabarti, Siddharth, Dinakar, Panda, Palegar and Keshwani2017). Hence, it becomes an issue to compare a concept against a product using the proposed method.
2. This method does not seem to examine the novelty of subsystems in a product. Let us consider the example of a wall-climbing robot (Provancher, Reference Provancher2009), which uses a pendulum as one of its subsystems to balance the angular momentum while climbing. If a search is carried out to find similar products, one may not find a robot using this pendulum mechanism and may declare that the product is novel. However, the pendulum is present in most of the old-fashioned clocks as a subsystem, which was not considered in the search space. Therefore, the method needs to be extended by evaluating novelty of individual subsystems of a product.
A concept of a wall climbing robot.

Usefulness and creativity
Usefulness is measured by Sarkar and Chakrabarti (Reference Sarkar and Chakrabarti2007, Reference Sarkar and Chakrabarti2011) as a product of the following factors: (L) evel of importance, (R) ate of the popularity of use, (F) requency of usage, and (D) uration of use or duration of benefit per usage. The Level of Importance (LoI) is assigned on a scale of 1 − 5 according to the purpose of the product being designed. A score of 5 is given for life-saving products like drugs and a score of 1 is given for entertainment products such as video games.
Let us consider a smartphone, which has the following features that have different LoI: Calling – 4, Messaging – 4, Camera (Self and rear) – 1, Flashlight – 3, Music player – 1, Internet browser – 4, Email – 4, and Games – 1. In the current world, the smartphone is a daily need, which accounts for a LoI of 4. However, a smartphone has multiple subsystems that perform different functions that carry their individual LoI. This example shows that LoI assigned for the whole product does not completely reflect the LoI of each of its subsystems.
The other factors R, F, and D are applicable only to those products that are already out in the market. Overall, the proposed measurement of usefulness does not inform as to how a solution could be improved during the design process. For that to occur, the solution must be compared against the set of requirements rather than some factors that depend on consumer usage.
Creativity is then assessed as a product of both novelty and usefulness; the creativity score, therefore, is computed by multiplying the novelty and usefulness scores.
Lozano (Reference Lozano2009)
Here, creativity was proposed to be a combination of two factors: innovation degree (novelty) and requirement-accomplishment (usefulness). Innovation degree, originally taken from Garcia and Calantone (Reference Garcia and Calantone2002) was scored according to non-innovative (0), moderate (1, 2), and radical (3) solutions. The requirement weight of 9 is given for over-satisfaction, where it was not necessary, but when provided, users are delighted; 3 for one-dimensional, where user satisfaction increases as the functionality of a product improves; 0 for basic functions, where the requirement is a must. These weights are generally unknown until the product is out in the market and cannot be applied during the design process.
The requirement-accomplishment was scored as follows, 1: weak, 3: intermediary, 9: complete. An issue with this method is that when a score of 3 is given for a solution, which denotes intermediary accomplishment, it does not mention as to which requirements were satisfied. For instance, for “tightening a screw” as the overall requirement, a score of 3 might be given to a proposed screwdriver that denotes intermediary accomplished; however, this information alone does not clarify the reasons, for example, the screwdriver cannot be used with moist hands and low light conditions. Lozano (Reference Lozano2009) has assessed usefulness by evaluating against requirements, which was not considered in Moss Jr (Reference Moss1966) or Sarkar and Chakrabarti (Reference Sarkar and Chakrabarti2011) due to requirements being an intermediary construction by designers that are intended to capture usefulness; further, the method needs to be extended to sub-requirements when there are weak or intermediary accomplishments.
Srinivasan and Chakrabarti (Reference Srinivasan and Chakrabarti2010b)
In this method, novelty is computed by comparing an idea with those in the Idea Space (IS), similar to the technique that was introduced in Sarkar and Chakrabarti (Reference Sarkar and Chakrabarti2007), but the difference here is that scores of n a = 7, n s = 6, n i = 5, n ph = 4, n e = 3, n r = 2, n p = 1 according to different abstraction levels in the SAPPhIRE model; if there is no difference at any of those abstraction levels, n = 0. The issues pointed out in Sarkar and Chakrabarti (Reference Sarkar and Chakrabarti2007) are applicable for this novelty assessment as well.
Lopez-Mesa et al. (Reference Lopez-Mesa, Mulet, Vidal and Thompson2011)
This work measures quantity, variety, novelty, and feasibility of solutions produced within a design session. Novelty is measured with respect to non-obviousness, by comparing at different abstraction levels such as Function (F), conceptual Structure (S), and Detailed structure (D). If a similarity is observed at all three levels, then the solution is considered to be “obvious”; if otherwise, it is considered “non-obvious’. The critiques that were identified for Shah et al. (Reference Shah, Smith and Vargas-Hernandez2003) are applicable for this method as well.”
Maher and Fisher (Reference Maher and Fisher2012)
This work measures novelty, value, and surprise to compare products that belong to the same domain. If a product (X) contains attributes {x i}, each of these attributes carry some values {n i}. In the Euclidean space, the product X could be represented as a vector, that is, a linear combination of {x i} and {n i}. If products belong to the same domain, it is possible that the set of attributes {x i} could be identical for most of them. Maher and Fisher (Reference Maher and Fisher2012) use this to calculate novelty (N) as the Euclidean distance between two products (X 1 and X 2) as in Eq. (10).
 $$N ={2} \root \of {\mathop \sum \limits_i {\lpar {X_i^1 - X_i^2} \rpar }^2} \; \; $$
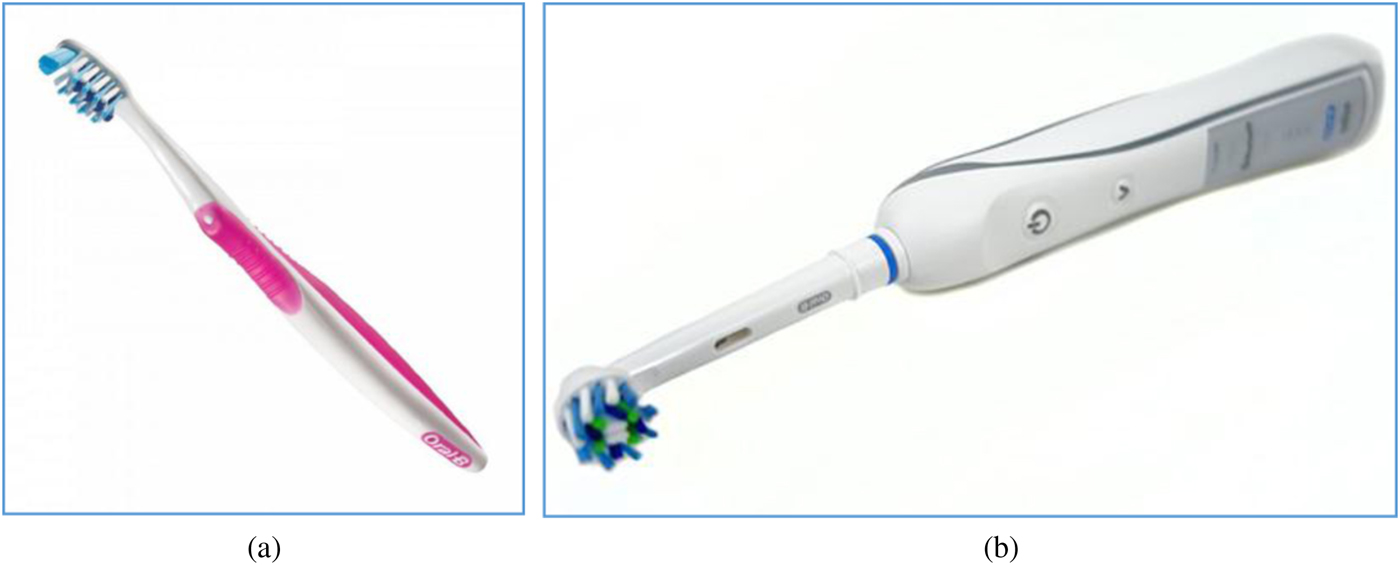
There could be cases where the two products fall in the same domain but the set of attributes are different. For instance, Figure 3a shows a normal toothbrush and 3b shows an electric toothbrush, both manufactured by a toothbrush company called Oral-B. These products do not have a set of common attributes that could be compared but only common requirements. Further, the evaluation uses K-means clustering algorithm to evaluate novelty, which is expressed as a distance in the Euclidean space. When there is lack of common attributes, the method creates a cluster that is at a distance from the existing clusters. Whether this distance is because of novelty or simply because of lack of values associated with the attributes would not be clear. The method does not identify the reasons for the substantial difference between products in terms of structure, input-output relations, and behavior. However, SAPPhIRE model-based comparisons (Srinivasan and Chakrabarti, Reference Srinivasan and Chakrabarti2010a; Sarkar and Chakrabarti, Reference Sarkar and Chakrabarti2011) could still be applicable in such cases.

Grace et al. (Reference Grace, Maher, Fisher and Brady2015)
Grace et al. (Reference Grace, Maher, Fisher and Brady2015) describe three characteristics of a creative design: novelty, value, and surprise. They assess novelty by the distance of the design from the other designs in a conceptual space. The devices need to be introduced in a temporal order and K-means clustering algorithm has to be performed at each step for the purpose of determining the novelty of each device. The Euclidean distance of each new device to the nearest cluster is calculated and divided by the average of the distance between each pair of members of that cluster. This normalized Euclidean distance is then returned as the novelty, with values over 1 indicating that the design is of an above-average novelty for the niche of the conceptual space in which it is placed.
The value of a design is assessed by the performance or utility compared with similar designs. The procedure to calculate the value of a device involves the retrieval of the (approximate) total Google results for each device, queried as “manufacturer, model name.” (with quotes). An issue with this approach is that it gives only an approximation of popularity, which in turn is an approximation of value. This data is used as it is readily available, although unreliable and only a first-order approximation of the value of a device to the society.
Surprise of a design is assessed by a comparison of a new design to the expectations developed from previous designs in the same conceptual space. In their approach, the surprise is measured by building expectations of how the attributes of a design relate.
This approach to calculate creativity and its various factors is further used for discovery of unexpected elements, which leads to a surprise. This surprise element is used to trigger reformulation of three kinds: combination, feature, and context-based reformulations of goals (Grace and Maher, Reference Grace and Maher2015; Grace and Maher, Reference Grace and Maher2016).
Major findings
We reviewed several methods for creativity assessment and identified a number of issues, as summarized below.
1. The foremost requirement of assessing novelty is to search for similar solutions in the product space. In order to do so, literature does not explain as to what the search elements to be used should be for identifying similar, existing products for comparison. In other words, it is unclear as to what aspects of the solution need to be used for this search. This limitation was not specifically identified for a particular method in the earlier sections; however, it commonly observed in every method that we have reviewed.
2. Shah et al. (Reference Shah, Smith and Vargas-Hernandez2003) use the number of unusual ideas in the idea-space developed in a design session as a measure of novelty. However, what is unusual is left to the assessor.
3. Other methods rely on comparison of a solution against existing solutions to assess historic novelty (Moss, Reference Moss1966; Chakrabarti and Khadilkar, Reference Chakrabarti and Khadilkar2003; Lozano, Reference Lozano2009; Srinivasan and Chakrabarti, Reference Srinivasan and Chakrabarti2010b; Sarkar and Chakrabarti, Reference Sarkar and Chakrabarti2011; Maher and Fisher, Reference Maher and Fisher2012). Even though this approach is more reasonable, modeling every solution in a product space (including conceptual modeling of product space) is a tedious process and the effort involved in implementing these methods needs to be reduced.
4. Current literature does not explain as to how solutions with varying levels of detail could be compared with one another for assessing novelty. In addition, assessment of novelty of subsystems in a solution is not explained in many methods (Sarkar and Chakrabarti, Reference Sarkar and Chakrabarti2007, Reference Sarkar and Chakrabarti2011); with the exception of Chakrabarti and Khadilkar (Reference Chakrabarti and Khadilkar2003).
5. Assessing usefulness, whether using an existing solution as a benchmark (Moss, Reference Moss1966) or using post-development factors (Sarkar and Chakrabarti, Reference Sarkar and Chakrabarti2011), is difficult to apply to products that are in the process of being developed.
6. Lozano (Reference Lozano2009) proposed an approach to assessing usefulness as solutions are evaluated against a set of requirements. However, these requirements must be those considered during the design process (and not the consumer-based, i.e. post-development). In addition, the evaluation of solutions against these requirements in weak and intermediary satisfaction cases must be possible to be explained in terms of their sub-requirements.
7. Only a few studies, for example, Grace and Maher (Reference Grace and Maher2015), explain as to how the creativity assessment can be used to impact the reformulation of goals in the design process. This shows that there is scope for using these metrics to help improve designing. However, there have been only some efforts towards the same.
Proposed creativity assessment method
In this section, we propose a creativity assessment method that is intended to be used during the design process in order to guide the designer in the areas of development that requires creative inputs. With this aim, we provide an assessment method for two significant indicators of creativity. First, we introduce the term “Degree of Requirement-Satisfaction (DRS)” that is derived from the measures for usefulness proposed by Moss (Reference Moss1966) and Lozano (Reference Lozano2009). A systematic approach for assessment of DRS is explained in the section ‘DRS assessment’. Next, following up on Srinivasan and Chakrabarti (Reference Srinivasan and Chakrabarti2010b) and Sarkar and Chakrabarti (Reference Sarkar and Chakrabarti2011), we explain a novelty assessment method in the section ‘Novelty assessment’.
We are proposing a creativity assessment method using requirement–solution pairs as the unit of assessment. Many conventional approaches focus on the novelty of the solution only, thereby missing out on the novelty of the requirement or that of the relationship between a specific requirement and a specific solution, both of which might be existing and yet allowing the pair to be novel.
DRS assessment
Weighted requirements tree
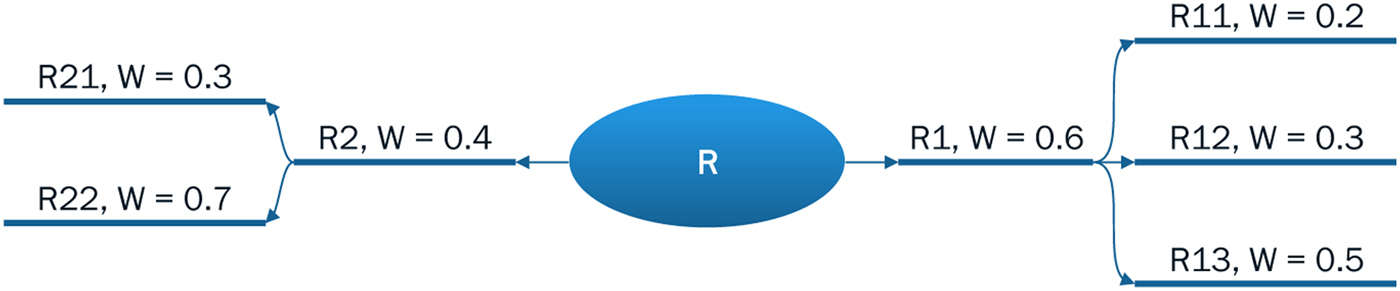
At the task clarification stage, a problem is decomposed into a set of requirements, which are further divided to sub-requirements. Figure 4 shows an example of a requirements tree, which is also similar to an objective tree (Pahl and Beitz, Reference Pahl and Beitz1988) where the central node (R) denotes the overall requirement. It is divided into sub-requirements R1 and R2 that are further divided into R11, R12, R13, R21, and R22. A weight (w) is assigned to each sub-requirement. For instance, R1 and R2 have been assigned weights 0.6 and 0.4, respectively. If we add the weights at the same level, the sum would be 1. For instance, weights of R1 and R2 add up to 1 (0.4 + 0.6 = 1). Similarly, the sum of weights R21 and R22 is also 1 (0.3 + 0.7 = 1). Hence, the weights assigned to requirements are normalized.
Requirements tree.

Requirement-solution (RS) tree
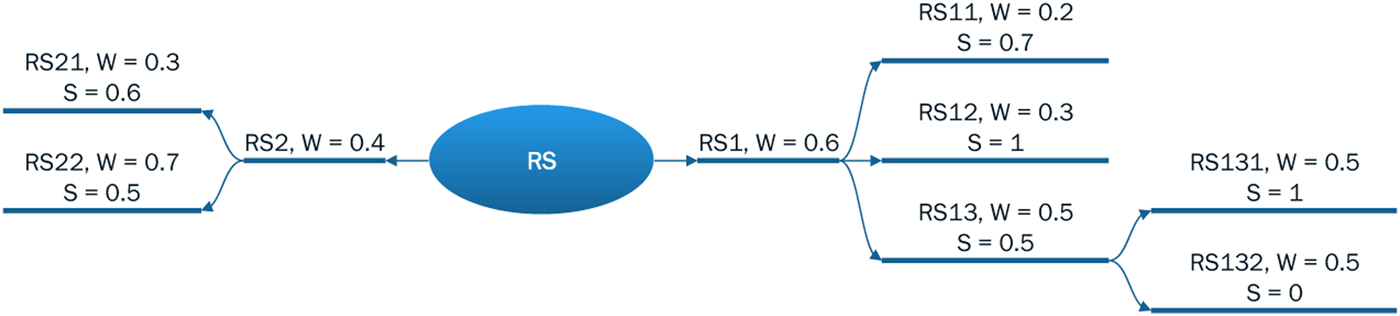
Now, when a solution is proposed for each requirement in the tree, it can be represented as a RS tree as in Figure 5. In practical cases, a solution typically satisfies a requirement only to some extent. Hence, it is important to assign a satisfaction score (S) between 0 and 1 that represent as to how well the solution satisfies the requirement.
RS tree.

Refined RS tree
The creativity assessment Method proposed is intended to be used by designers during their design process. Further, it should also be possible to use the proposed method for the final products. Therefore, two scenarios exist for use of this method: (1) A designer evaluates his/her solutions during his/her design process; and (2) a different assessor evaluates a given set of solutions. The refinement of RS tree proposed in this section refers to when a designer would assess the solutions, and therefore can modify the RS tree. However, in the case of a different assessor using the method, the assessor is restricted to the information provided by the designer.
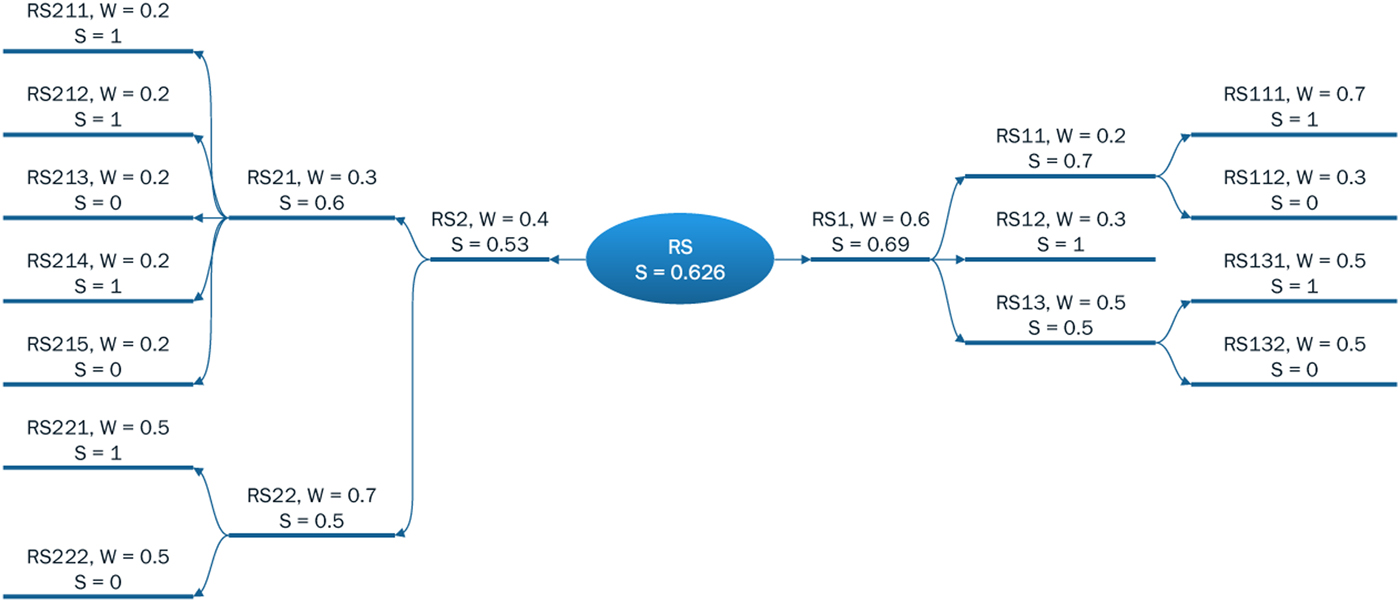
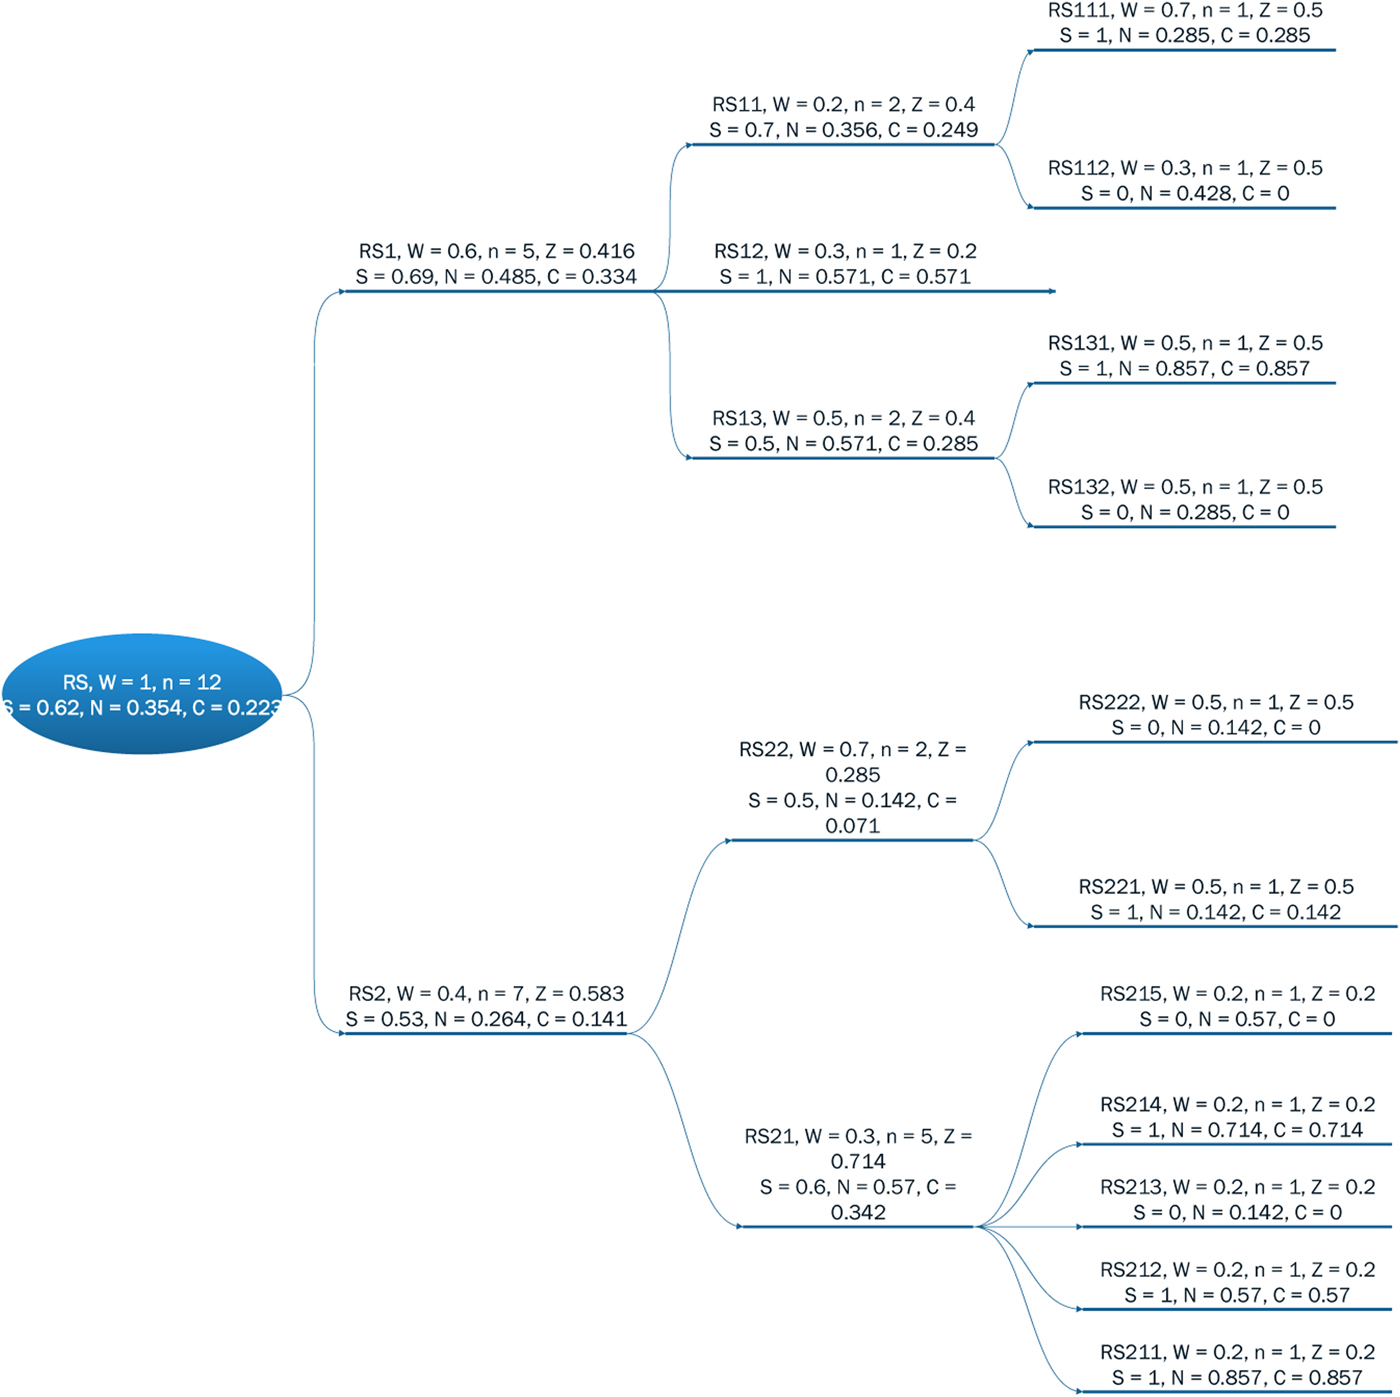
For a given RS-pair, let us say RS13 has a score of S = 0.5. Here, one can question why a score of 0.5 was given and why not another value? A justification needs to be provided by decomposing the partially satisfied requirements into its sub-requirements and mentioning as to which of those sub-requirements were satisfied and which ones were not. In Figure 6, RS13 is decomposed into RS131 and RS132, and satisfaction scores of S = 1 and S = 0 are given respectively, to these. Upon decomposition of each partially satisfied RS-pair (0 < S < 1), a consistent, refined RS tree is formed. As a result, at the lowermost level, each RS-pair has a satisfaction score of either S = 0 (not satisfied) or S = 1 (completely satisfied).
A refined RS tree.

Computing DRS
The satisfaction scores are assigned manually (0 or 1) only to the lowest level RS-pairs. Now, a weighted mean [Eq. (11)] of these scores are used to compute the scores for higher level RS-pairs. Let us compute the satisfaction (S) for RS22, whose i = 2, j = 2. According to Eq. (11), score S 22 is the weighted mean of scores given to its two lower level RS-pairs. Here, the weights are w 221 = 0.5 and w 222 = 0.5. The satisfaction scores for the pairs are S 221 = 1 and S 222 = 0. The weighted mean is calculated according to Eq. (11): S 22 = (0.5 × 1) + (0.5 × 0) = 0.5, which is taken as the score (S) for RS22, see Figure 6. Similarly, weighted means of scores given to all lowest level RS-pairs are computed.
 $$ {S_{ij}} \vert _{i = i_1\comma \,\; j = j_1} = \sum w_{i_1j_1k}S_{i_1j_1k}\; $$
In general, the satisfaction score of any requirement at a particular level in the RS tree is proposed to be computed as a weighted mean of the scores of its lower level RS-pairs, using Eq. (12).
 $$S = \sum w_iS_i$$
Summary
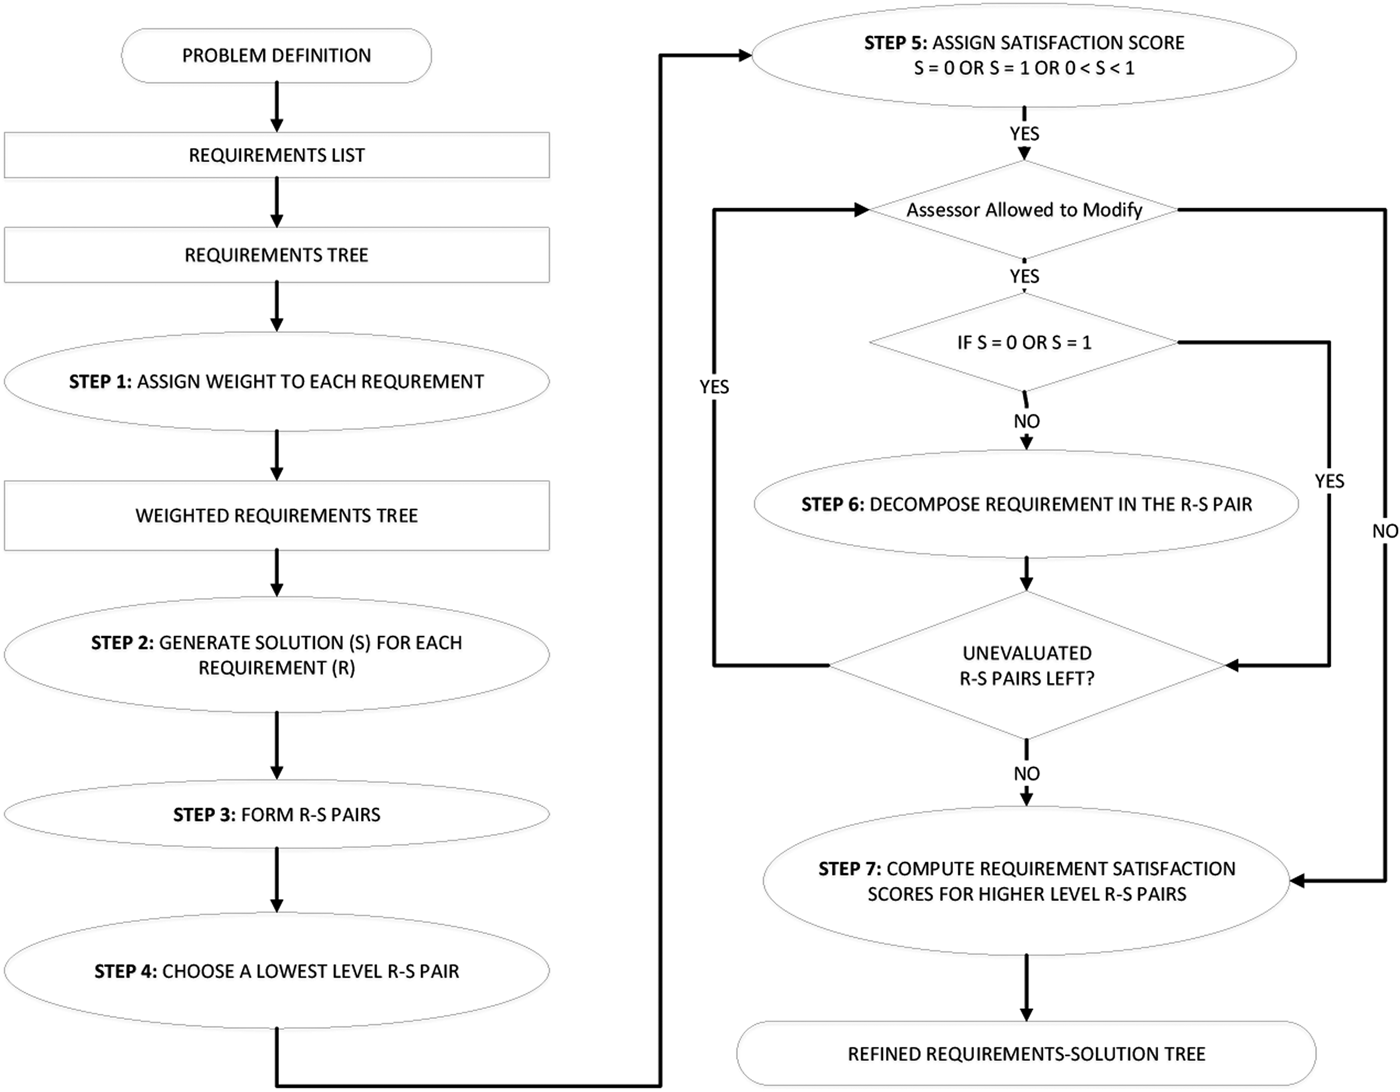
As a summary of the section ‘DRS assessment’, the steps involved in the assessment of DRS are formulated in Figure 7. The starting point of the assessment is to have a clearly defined problem from which requirements are identified and the tree is formed. Step 1 is to assign weights to each requirement, which forms a weighted requirements tree as in Figure 4. Step 2 is to propose solutions for each requirement and to form RS-pairs as in Figure 5. Step 4 is to choose each lowest level RS-pair and next Step 5 is to assign a satisfaction score. Here if the designer is the assessor, then the modifications can be made; therefore the designer can proceed to decompose the requirements. If the assessor is not the designer and is restricted to the available information, the final step 7 can be directly carried out (See Fig. 7).
Steps for assessing DRS.

If the satisfaction score S is 0 < S < 1, the RS-pair should be decomposed further to identify the solved and the unsolved requirements. If S = 0 or S = 1, further decomposition step would not be necessary. Either ways, the following step is carried out for unevaluated RS-pairs and assign satisfaction scores. Once there is no lowest level RS-pairs left in the tree, the next step would be to compute weighted means of lower level RS-pairs to obtain satisfaction scores for their higher-level RS-pairs, using Eq. (12). This would lead to a final outcome of a refined RS tree, such as the one shown in Figure 6. The level of granularity defined for identifying RS pair depends on whether the designer decomposed the solution to design individual components of a system or just selects a system. If the individual components of the system are designed, then the RS of each individual component needs to be paired, assessed, and combined. If not, the RS-pair for the system must be assessed directly. Sometimes, it is possible that multiple components together solve a requirement. In these cases, a single node can be used to represent the same, however, each component (solution) needs to be paired with that requirement and assessed separately. The proposed method does not currently consider “over satisfaction” of requirements in the assessment.
Please note that the numerical calculations involved in the assessment of DRS have been used in the past by quite a number of researchers. The novelty of this part lies in the following: (1) Pairing of requirements and solutions, (2) development of RS tree to connect the lower level requirements to higher level requirements and (3) the proposal to use this assessment method in order to assess creativity, during the design process instead of post-design process.
Novelty assessment
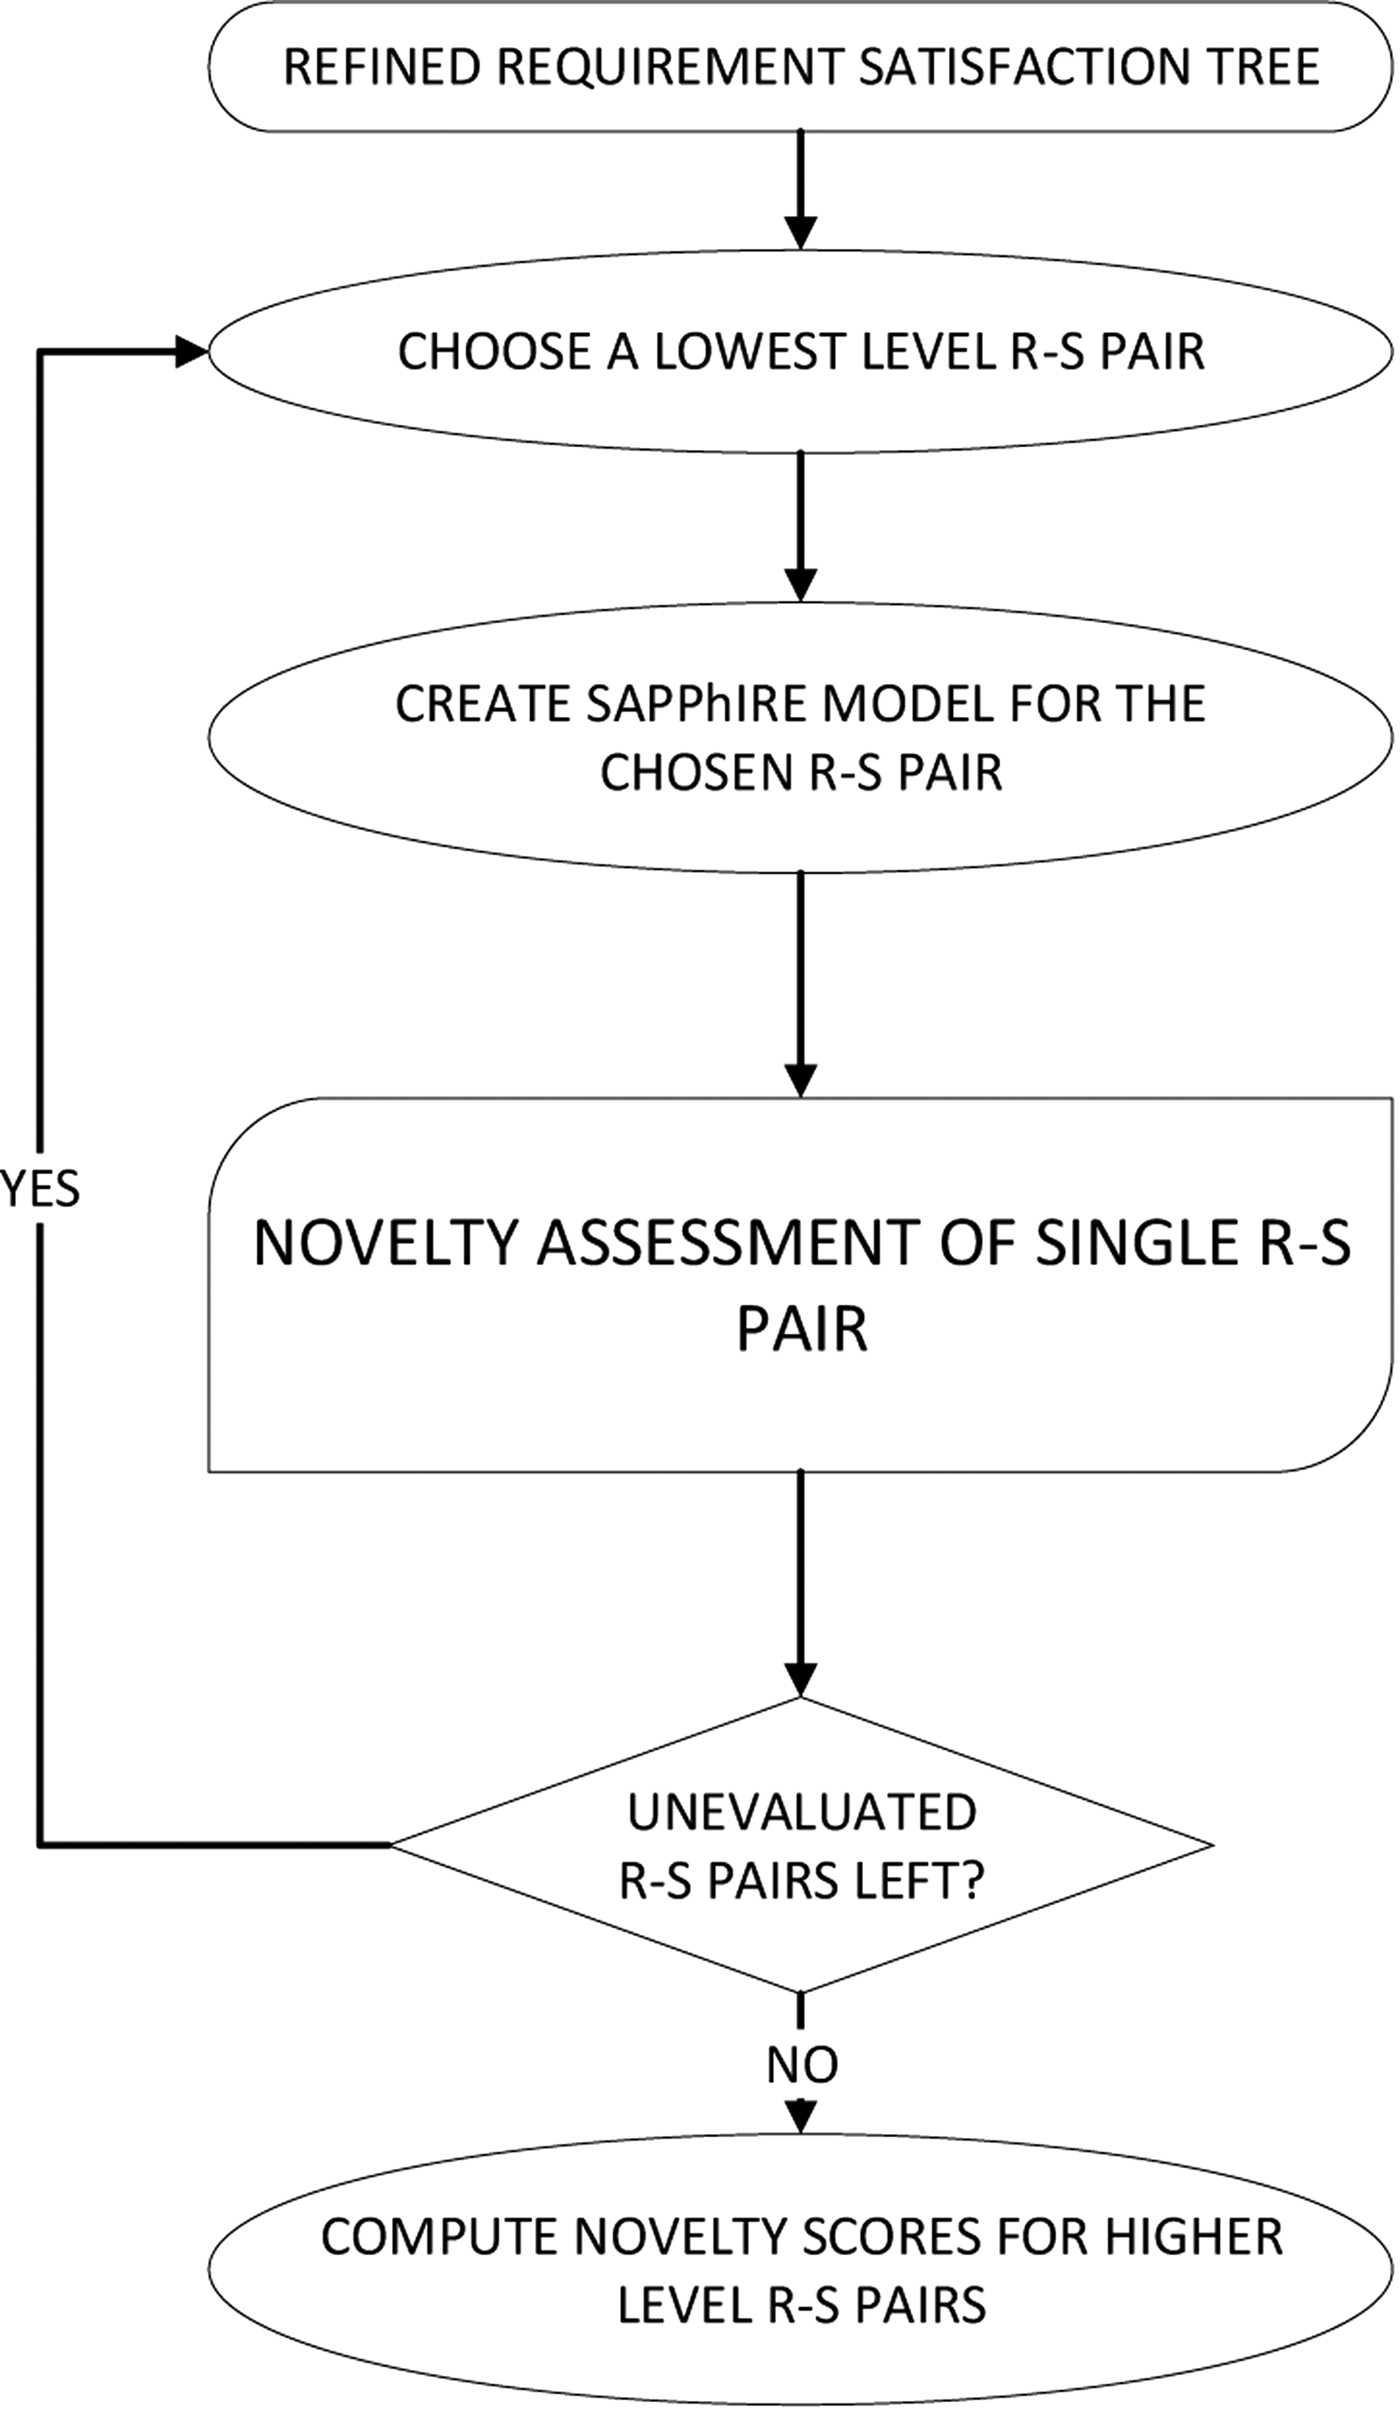
In this section, we introduce how the novelty assessment to be carried out. We propose that novelty assessment has to be carried out with the refined RS tree (or requirement satisfaction tree). There are five major steps in the novelty assessment proposed. These steps are represented in Figure 8. First three steps are shown in the section ‘Assigning novelty for the lowest level RS-pair’ and remaining steps are explained in the section ‘Computing novelty for higher level RS-pairs’.
1. Choose a lowest level RS.
2. Create SAPPhIRE Model for the Chosen RS-pair.
3. Assess the novelty of lowest level RS-pair.
4. Check if any of the lowest level RS-pairs are left, if Yes go back to Step 2 and if none of the lowest level RS-pairs are left, then go to Step 5.
5. Compute overall novelty of higher level RS-pairs by aggregating the novelty scores of lowest level RS-pairs.
Summary of novelty assessment.

Assigning novelty for the lowest level RS-pair
In this section, we assign novelty scores for the lowest level RS-pairs in the RS tree (Fig. 6). This part of our work builds upon Srinivasan and Chakrabarti (Reference Srinivasan and Chakrabarti2010b), where a concept is compared with a reference concept and similarity identified at the following abstraction levels: Actions, States, Phenomena, Effects, Inputs, oRgans, and Parts. If there is a distinction at the Action level, a novelty score of N = 7 would be given, and at the Parts level, a score of N = 1 would be given. In our work, we do not compare a solution against a reference. Instead, we directly search for entities in the SAPPhIRE in product space (e.g. Google patent search) and assign novelty scores (1 − 7) based on whether matches are found. The operationalization of the process of search and assigning of novelty score is given in the following set of steps. Which keywords to be used for searching the product space are explained with the help of an example. Further, what steps to follow either when there is a match or no match is also clearly explained in these steps.
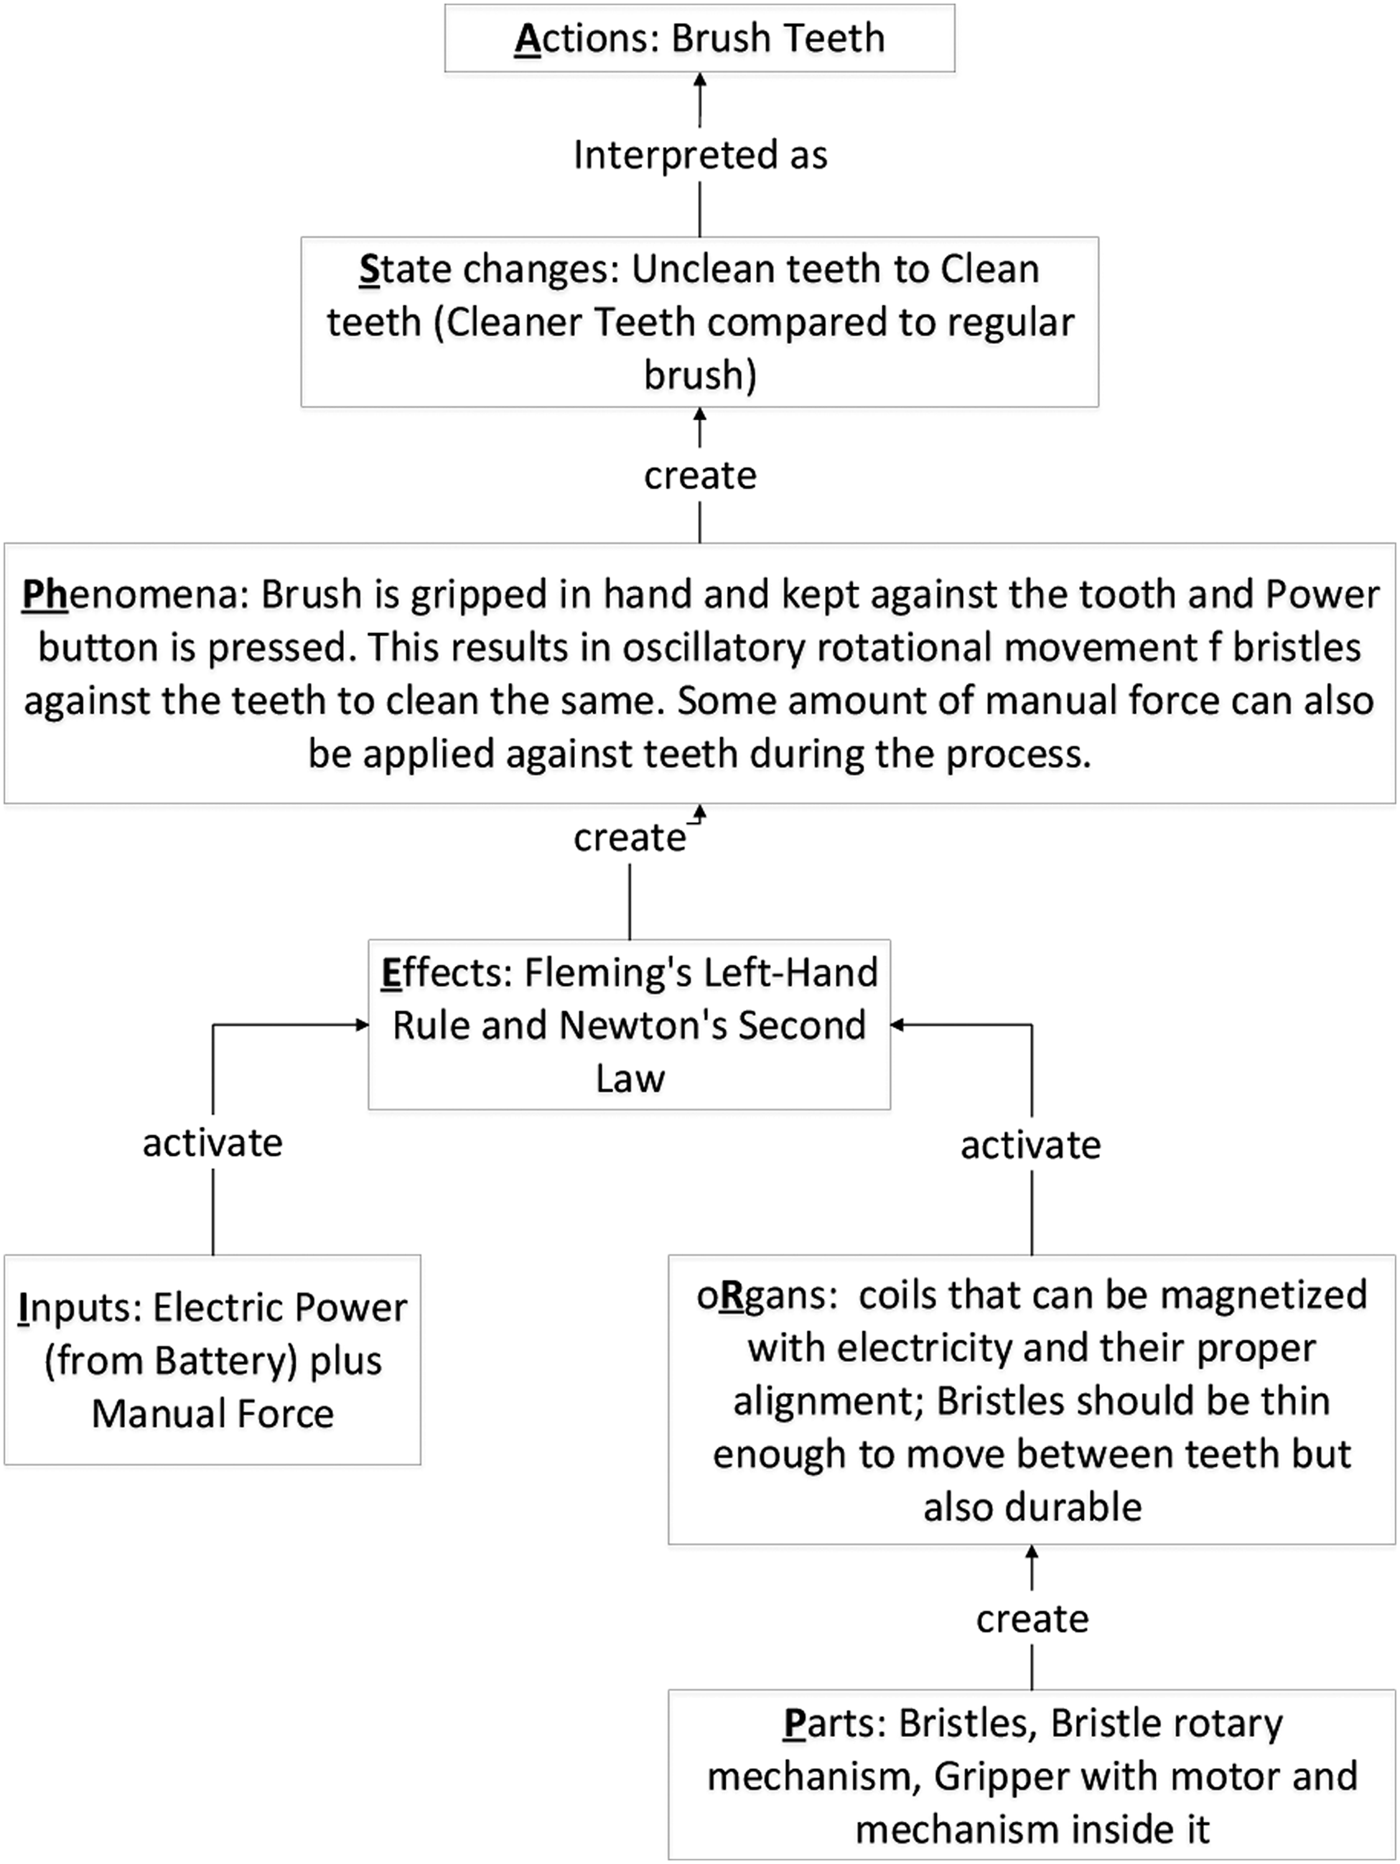
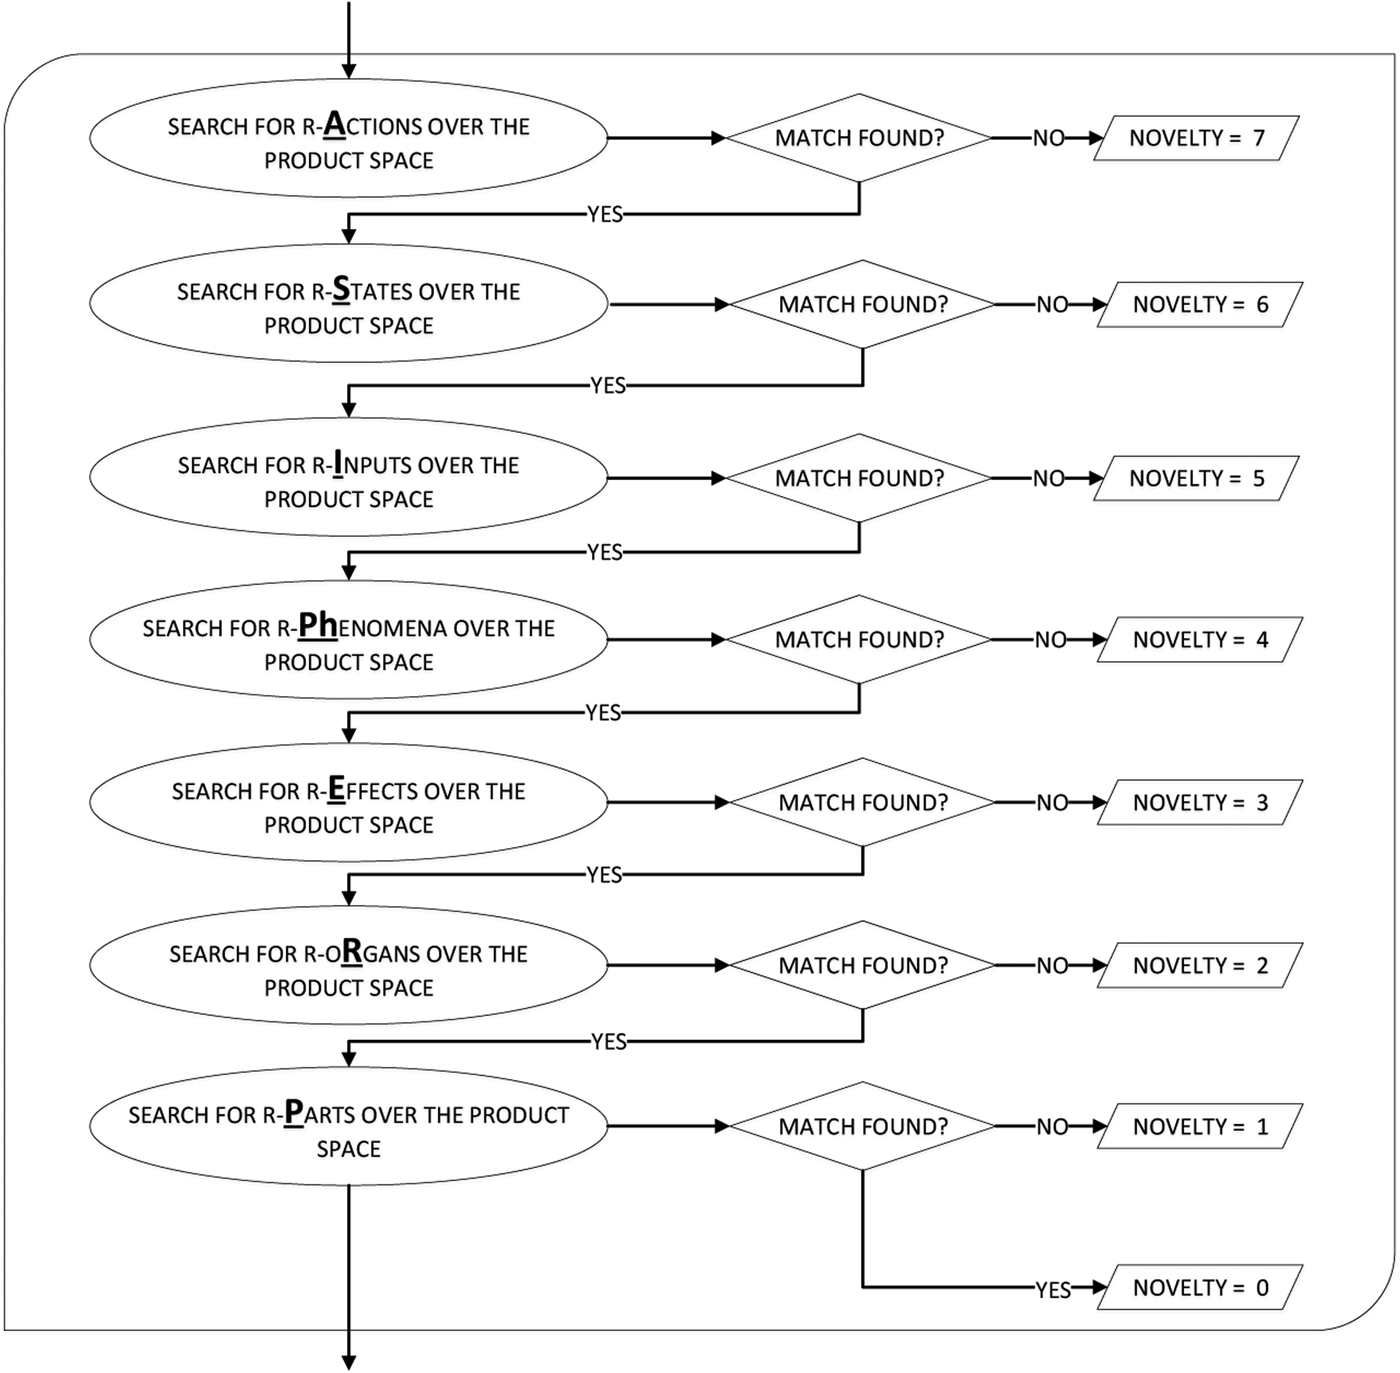
Let us consider the following RS-pair: Requirement: Clean teeth automatically, Solution: Electric toothbrush (Fig. 2b). In order to assess novelty for this RS-pair, it is necessary to search for similar solutions in the product space. The question arises as to what keywords need to be used to search in order to find a similar solution. The answer lies in the different level of SAPPHIRE abstractions of the solution, which is shown in Figure 9. This SAPPhIRE model provides the keywords to search for similar solutions along with the main requirement in each of the steps formulated and presented in the flowchart shown in Figure 10. These steps are independent but sequential, that is, the order of search must be followed.
1. Search for Actions that represents the highest-level function that is performed by the product in order to satisfy the requirement. According to the SAPPhIRE model shown in Figure 9, the Action is mentioned as “brush teeth” that could be searched along with “clean teeth automatically’. Action and the main requirement should be the keywords to search for similar solutions. If there are no results of that sort, a novelty score of 7 needs to be given and the assessment terminates here. If there are one or more matches, we continue to the next step.
2. Search for State changes that are observed changes in the product while working, one or more of which are interpreted as the function (Actions). In this case, the observed change is “Unclean teeth to clean teeth”. If there are products that match with this State change, we proceed to next step. Else, we assign a novelty score of 6 and terminate.
3. Search for Inputs that are generally material, energy, or information that enters the system and initiates the functioning of the product. Here, Electric Power (from Battery) plus Manual Force is supplied to the product. This input could be combined with the requirement to search for similar products. Here, we stop the assessment by giving a novelty score of 5 if there are no matches. If otherwise, the next step is carried out.
4. Search for Phenomena that explain some processes that are responsible for producing some State changes. The Phenomena is written as “Brush is gripped…during the process”. As we can see, the Phenomena are explained using long sentences that cannot be directly used as search queries. However, words such as “gripped”, “button pressed”, “rotational movement”, and so on could be combined along with the requirement to find matching cases. If there are no matches, we assign a novelty score of 4 and terminate and continue to the next step if otherwise.
5. Search for Effects that are laws governing the function that satisfies the requirement. In this case, those laws are found to be Fleming's Left-Hand Rule and Newton's Second Law. An issue here is that these laws could be common in most of the devices and products. It is necessary to carefully identify only those products serve the requirement of cleaning teeth and also work according to these laws. If in the product database like google patents, the physical effects are not mentioned explicitly, the search query should use physical phenomena and physical effects together for the search. When they are searched together, it would be possible to find if the proposed solution uses existing physical phenomena with same physical effect or different physical effect. If no products are found, a novelty score of 3 needs to be given and assessment terminates here. Otherwise, the next step must be carried out.
6. Search for oRgans that are properties, state variables, and constraints that are imposed upon the components of a system in such a way that they function intended. In this case, if a match is found, we proceed to the next step. Else, a novelty score of 2 needs to be assigned and terminated.
7. Search for Parts that are used to satisfy the requirement. Parts take into account the components, interfaces between components, positioning, and orientation of components as in this case, Bristles, Bristle rotary mechanism, and so on. The search keywords could be “bristles + clean/brush + teeth”, “gripper + clean + teeth”, and so on. If such combinations are found in one of the products, a novelty score of 0 needs to be given and the assessment terminated at this point. If no match is found, a novelty score of 1 needs to be given and the assessment terminated at that point.
SAPPhIRE model for an electric toothbrush shown in Figure 3b.

Novelty assessment method for particular RS-pair.

Justification
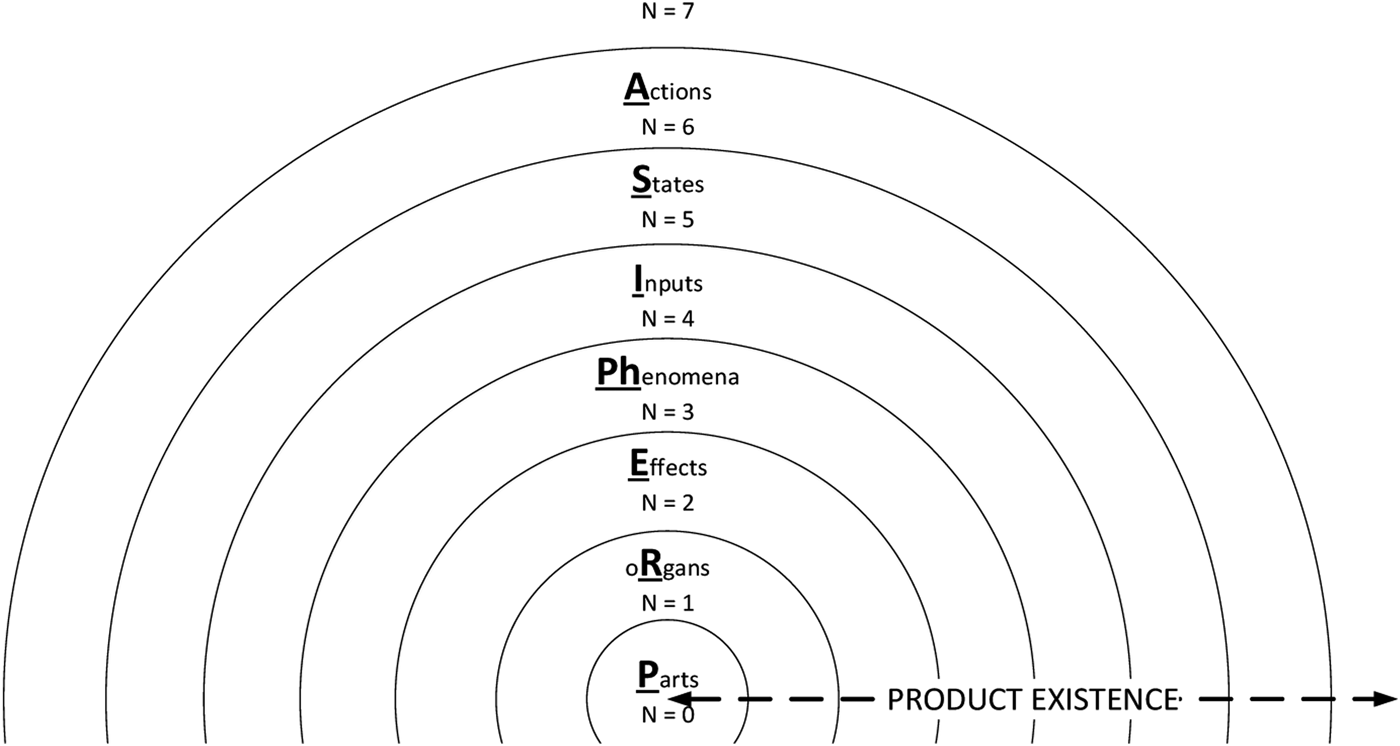
In the section ‘Assigning novelty for the lowest level RS-pair’, seven steps were carried for assessing the novelty of an RS-pair. In these steps, we searched for similar products in the product space and as the search progresses, the product space converges into smaller spaces as illustrated in Figure 10. In the first step, we search for products performing Actions that are same as clean teeth or brush teeth. This search might result in products such as toothbrush, mouthwash, and surgical cleaners, and so on, that perform the same function. For products falling outside this search space, N = 7 is assigned. For products within this space (N ≤ 6), it is possible that they may lie in anyone of the inner spaces such as States space (N = 5), Inputs space (N = 4), and so on. In other words, they may perform the same function (Actions) as “clean teeth”, however, their behavior (Inputs, States, Phenomena, and Effects) or structure (Parts, oRgans) could be different. Hence, the inner spaces are explored in the following steps.
In the second step, we search according to State changes that would converge the space by some margin. For instance, in an electric circuit, the Action is a flow of current, which could be indicated by a State change in the reading given by ammeter or galvanometer. Another possibility is that flow of current could be detected by a LED connected in a circuit getting switched ON. If we fix that flowing current is detected by the LED light getting switched ON, we would get a fewer number of results. For product within States space, it can be argued that N ≤ 5 but in order to know the exact value of novelty, it is necessary to explore even further inner spaces. Similarly, as each of the following entities of SAPPhIRE model is searched, the product space converges. The search at Action level is so abstract and there could be multiple products that perform the same function exhibiting different behaviors and composed of even more different components. As we search for States, Inputs… Parts, the level of abstraction reduces and the detail increases. Srinivasan and Chakrabarti (Reference Srinivasan and Chakrabarti2010b; Table 10) found that s(a, sc, i) > s(ph, e) > s(r, p), where s(a, sc, i) is size of idea groups at action, state change, and input abstraction levels, s(ph, e) is size of idea groups at phenomena, effect levels, and s(r, p) is the size of idea groups at organ and part levels. This is the reason for the order of the hierarchy in Figure 11.
The product space classified according to SAPPhIRE entities.

Computing novelty for higher level RS-pairs
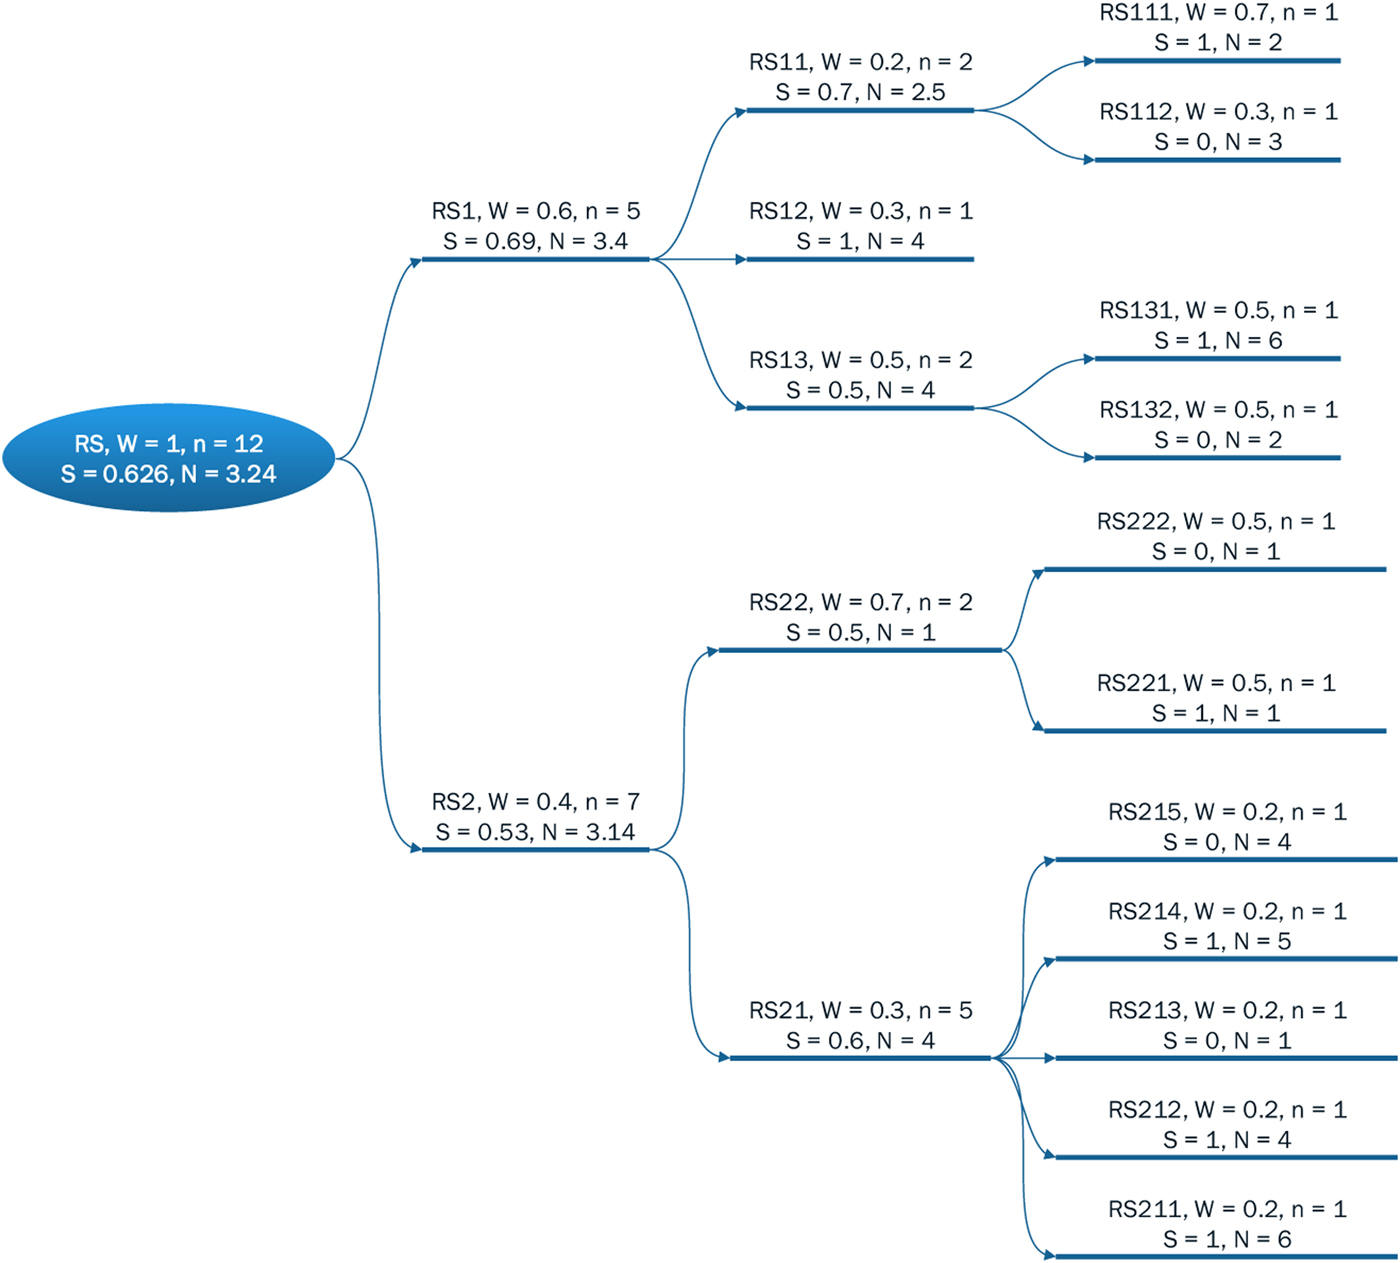
The steps shown in the section ‘Assigning novelty for the lowest level RS-pair’ are to be used for calculating novelty scores for lowest level RS-pairs in the requirements in an RS tree (Fig. 12). Now, from the novelty scores calculated for RS11 and RS12, the novelty for higher level RS-pair – RS1 could be calculated using the weighted mean formula shown in Eq. (13).
 $$\left. {N_i} \right\vert_{i = i_1} = \displaystyle{{\sum z_{i_1j}N_{i_1j}} \over {\sum z_{i_1j}}}\; \; \; \; \; \quad \; \forall \; \; N_{i_1j}\; \in \left\{ {\matrix{ {{\rm 0:none;}} \cr {{\rm 1:Parts,\; }} \cr {{\rm 2:oRgans,\; }} \cr {{\rm 3:Effects,\; }} \cr {{\rm 4:Phenomena,}} \cr {{\rm \; 5:Inputs,\; }} \cr {{\rm 6:States,\; }} \cr {{\rm 7:Actions}} \cr } } \right\}$$
It is understood that the solutions S11 and S12 that satisfy R11 and R12 respectively, combine to form a higher-level system S1, which is expected to satisfy the higher-level requirement R1. Hence, S11 and S12 are subsystems of S1. The novelty of S1 is calculated as the weighted mean of novelty scores of S11 and S12 according to Eq. (13).
Novelty assessment on a solutions tree.

Here, the weights  $(z_{i_1j})$ are calculated using Eq. (14), based on a number of RS pairs shared by a subsystem. There is no empirical evidence as to why a subsystem having a higher number of RS pairs must carry higher weight for novelty; at least the answer is not found from our review. Let us consider a system with two subsystems: A – four RS pairs, B – one RS pair.
1. The function performed by A is shared by four RS pairs that are interconnected to each other. Hence, more effort was put in the development of A than in the case of B. It is possible that sub-functions performed by each RS pair in A could individually contribute to the novelty of A.
2. If the novelty of A and B were to be improved, there are higher chances for A than that of B. It is possible to change one or two RS-pairs of A such that overall function of A is still retained. In the case of B, if there was any change to be done on the only RS-pair there are more chances that function of B could be altered.
Based on the points stated above, we use a ratio of RS pairs in a subsystem as the weight for novelty as explained below.
 $$ {z_{ij}} \vert _{i = i_1} = \displaystyle{{n_{i_{1j}}} \over {n_{i_1}}} = \hbox{ratio of RS Pairs}\; $$
 $$n_{i_{1j}} = \hbox{number of RS pairs}$$
 $$n_{i_1} = \hbox{number of RS pairs in next higher level RS pair}$$
 $$1 \le n_{i_{1j}} \le n_{i_1}$$
The ratio of RS pair – z is the ratio of the number of RS pairs in the current subsystem  $(n_{i_{1j}})$ and the number of RS pairs under the higher-level (sub) system
 $(n_{i_1})$. Let us assume that S1 has n 1 = 4 RS pairs. One of its subsystems S11 has n 11 = 2 RS pairs. The ratio of RS pair for the subsystem S11 would then be z 11 = (2/4) = 0.5 according to Eq. (14) and also indicated in Figure 12. Similarly, the ratio of RS pair for S12 would be z 12 = 0.5, which is also indicated in Figure 12. z 11 and z 12 act as weights for N 11 = 6 and N 12 = 3 that are novelty scores for subsystems S11 and S12 respectively. Upon calculating the weighted mean according to Eq. (14), the novelty of S1 could be found out as N 1 = ((0.5 × 6) + (0.5 × 3)/(0.5 + 0.5)) = 4.5, which could be seen in Figure 12, as the Novelty (N) of RS1 is 4.5. Upon following this approach, it is possible to compute novelty for all higher-level RS-pairs in the refined RS tree (Fig. 13).
Refined RS tree where novelty is assessed at every RS-pair.

Summary of novelty assessment
The novelty assessment method has five steps, as shown in the flow chart in Figure 8. Further sections ‘Assigning novelty for the lowest level RS-pair’ and ‘Computing novelty for higher level RS-pairs’ explain in detail how these steps can be operationalized. The novelty assessment starts with a refined RS tree, whose lowest level RS-pairs have satisfaction scores of either S = 1 or S = 0. Any one of the lowest level RS-pairs needs to be chosen and must be assessed for novelty according to Figure 10. Then, it is necessary to check if any lowest RS-pairs are left. If not, novelty scores of higher level RS-pairs need to be calculated using Eq. (13).
Steps given in the section ‘Assigning novelty for the lowest level RS-pair’ involve guided internet search followed by a comparison of search results (providing existing solutions) with the new solutions proposed during design. The section ‘Computing novelty for higher level RS-pairs’ explains as to how the novelty scores of the lower level RS pairs are aggregated, using the RS tree, to assess the novelty of the higher level RS pairs. Although it is possible to use these steps manually, there are many steps which take a long time to carry out. An automated computer program would be ideal to aid the assessor in carrying out these tasks and reduce time. However, this has not been implemented yet.
Creativity assessment
As found from literature, novelty and usefulness are the necessary indicators of creativity. Therefore, we take creativity as the product of these two indicators with requirement satisfaction as a proxy to usefulness. Creativity is indicated primarily by novelty and DRS, as followed throughout our method. According to Eq. (15), creativity (C) is the product of satisfaction (S) and novelty (N). This multiplication is applied for every RS-pair in the novelty assessed refined RS tree (Fig. 12).
 $$\hbox{Creativity (C)} = \hbox{Satisfaction(S)} \times \hbox{Novelty(N)}$$
Before applying Eq. (15), novelty values at each RS-pair are normalized by dividing by 7. Upon normalizing, the maximum novelty value would be N max = (7/7) = 1 and minimum would be N min = (0/7) = 0. Once the novelty values are changed, they are multiplied by the corresponding DRS values so that creativity assessment of the RS tree is complete (Fig. 14).
Creativity assessment.

Satisfaction score is a weighted average of percentage requirement satisfaction scores. The lower level requirement is linked all the way up to the higher level requirement of the product along with weights distributed based on the significance of requirements. Thus, if a single subsystem does not fulfill the requirement, its score percolates from the lowest level to highest level (Siddharth and Sarkar, Reference Siddharth and Sarkar2017) and reflects in the satisfaction score of final requirement.
Unlike DRS score, Novelty score does not depend on the weights assigned to functions. Novelty score of lowermost RS pair is based on the newness of the solution for its paired requirement. Novelty scores of higher levels (subsystems/systems) depend on the number of RS pairs under them. The z-value here is calculated as the ratio of number of RS-pairs in the lower level to the number of RS-pairs in the higher level. However, at the same time, our measure ensures that the lesser novelty score is also reflected in the final score for the design solution.
Application of the method in a design process
Application during design stages
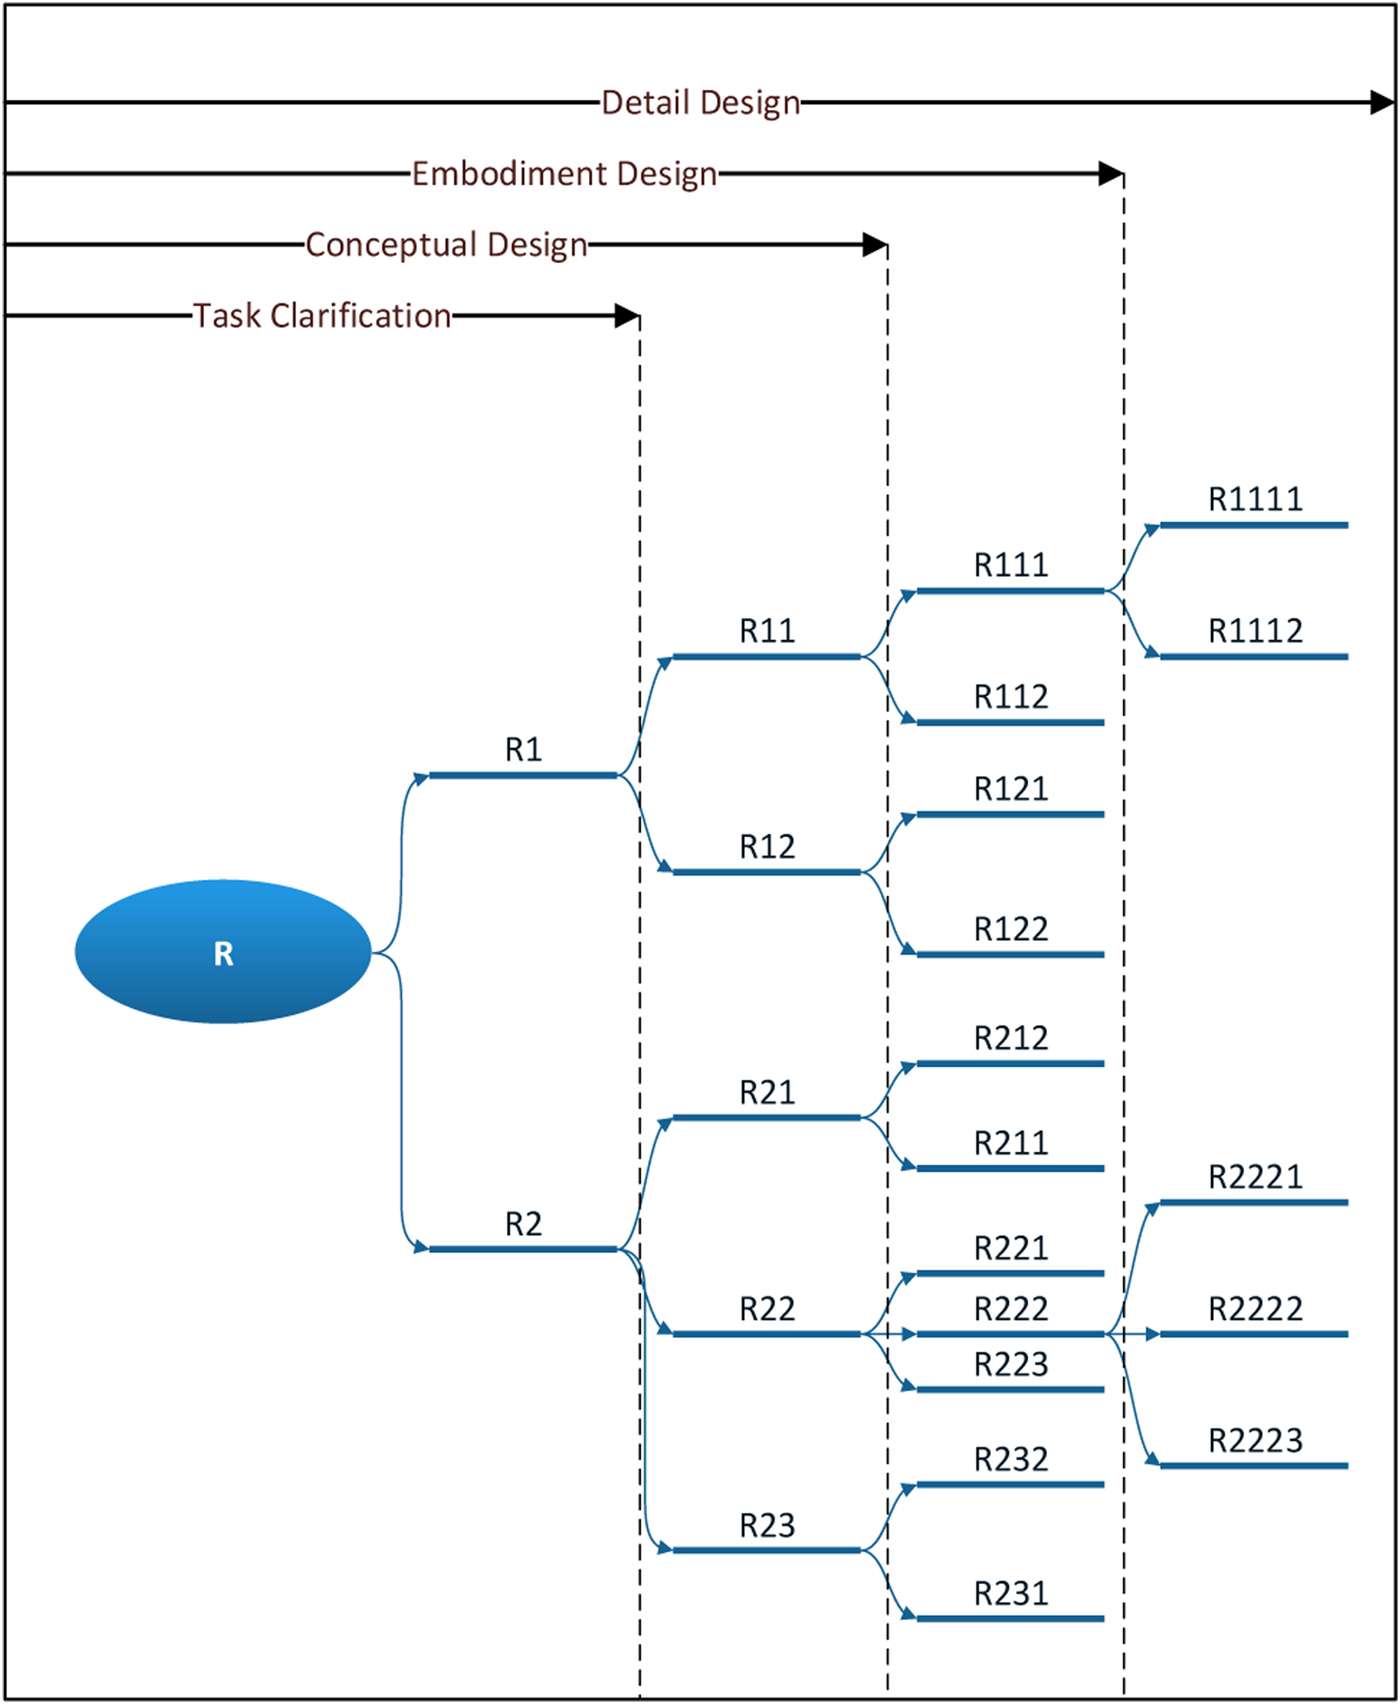
We have explained the creativity assessment method in the sections ‘DRS assessment, Novelty assessment and Creativity assessment. As shown in Figure 15, the design process is typically segmented into the following stages: task clarification, conceptual design, embodiment design, and detailed design (Pahl and Beitz, Reference Pahl and Beitz1988).
1. At the task clarification stage, only the problem is clarified and the higher-level, abstract requirements are derived and then formulated into a tree.
2. At the conceptual design stage, designers explore solutions for which, it is possible to compute satisfaction, which when lies between 0 and 1, and requirements are decomposed to identify unsolved sub-requirements.
3. At the embodiment and detailed design stages, the requirements need to be decomposed even further in order to understand the specific form, material, and orientation requirements.
As the ideas develop into concepts, embodiments, and products, the detailing of the design increases and the RS tree matures (Lee and Suh, Reference Lee and Suh2005). At each of these stages, the creativity assessment could be carried out separately by assigning DRS and novelty for lowest level RS-pairs and then using weighted mean formulae to compute the same for higher-level RS-pairs. This assessment is independent of at what stage of design the solution is developed. In addition, the assessment is not being influenced by the detailing of the product and RS tree that varies across the design stages.
Growth of requirement tree as design stages develop.

Evaluation of the proposed creativity assessment method
The eventual aim of the proposed creativity assessment method is to help designers’ self-assess creativity of the evolving solutions and their elements during the design process itself so that corrective steps could be taken to tune the degree of creativity of the solutions appropriately. The evaluation of a design support involves three aspects: (1) correctness of the creativity assessment, (2) usability of the method during the design, and (3) impact of using the proposed method during the design process (Blessing and Chakrabarti, Reference Blessing and Chakrabarti2009). Therefore, to integrate the proposed creativity method into the design process to achieve the aforementioned aim, the method needs to be tested for both external validities of creativity assessment and also if it is useful to do the same.
Three case studies were carried out for this purpose: the section ‘Correctness evaluation of the proposed method’, presents the case studies 1 and 2, to evaluate the correctness of creativity assessment and the section ‘Usability and impact evaluation of the proposed method’, presents the case study 3 for usability and impact evaluation of DRS assessment, a part of the proposed creativity assessment method. A real-time novelty assessment during the design process required a computational support which is not available, as pointed out in the section ‘Overview of novelty assessment’. Thus, novelty assessment was not carried out by the designers during the design process. The section ‘Example of a design session’ explains, with a detailed example, how the proposed creativity assessment method could be used at different stages of the design process.
Correctness evaluation of the proposed method
Case studies 1 and 2
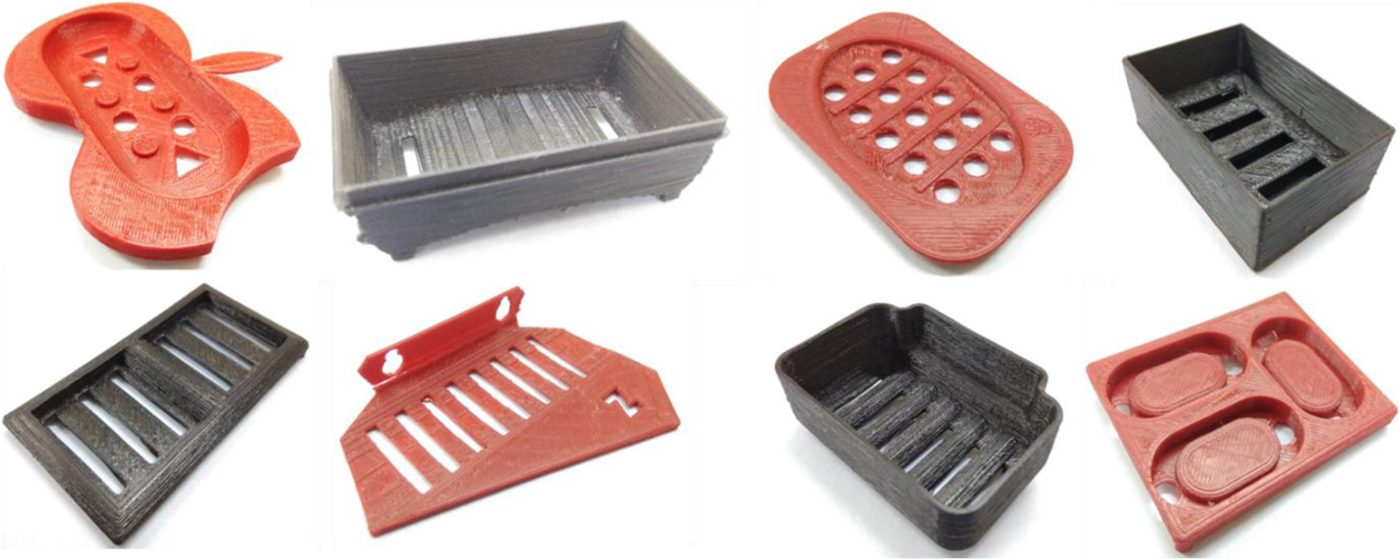
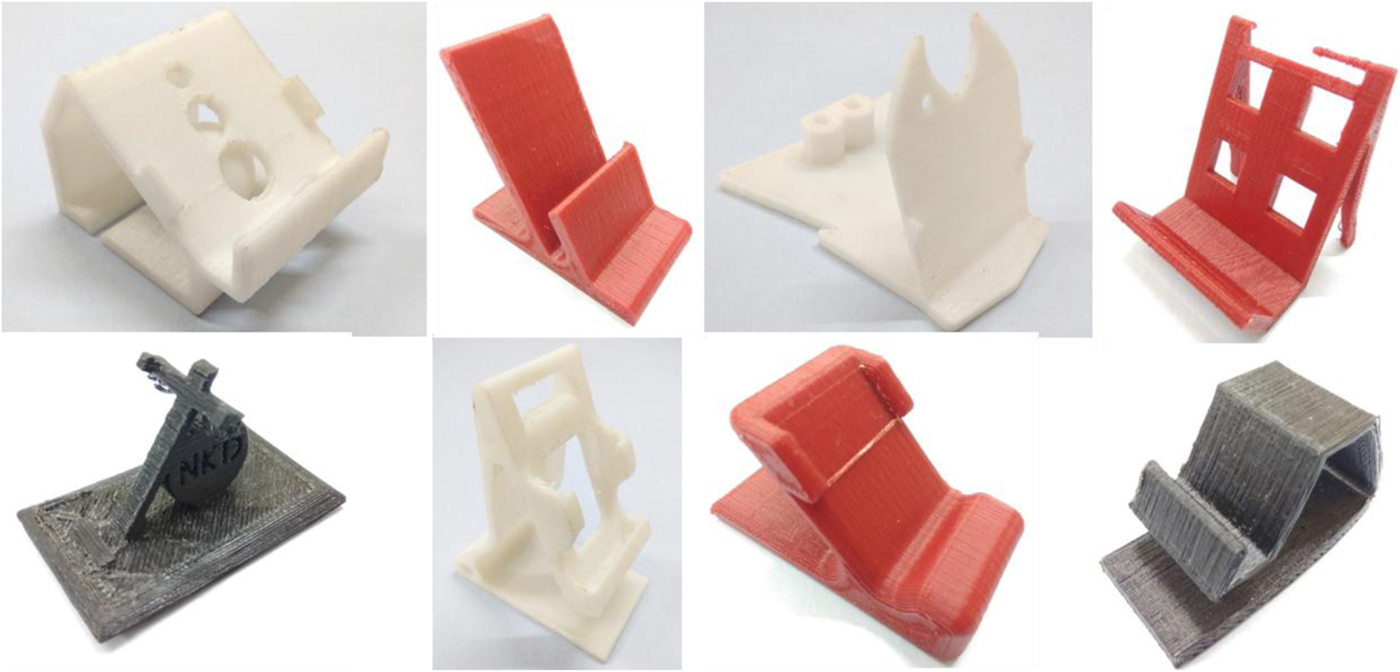
A 12-day workshop was organized in an engineering institute to educate its students on CAD and 3D printing technologies. Multiple batches of students were organized into groups. All students were in their 3rd year of a 4-year bachelor's programme in either mechanical or civil engineering. During the workshop, as an exercise, each student group was asked to develop either a mobile phone stand (P1) or a soap boxFootnote 1 (P2). The students in eight of the groups were asked to carry out P1 and the remaining eight groups were given P2. The data was collected from these 16 groups, where 14 groups had four students each and remaining two groups had three students each. The groups were given 3 days to develop their designs. These design sessions happened in class-room settings with access to computer, internet, and a CAD modeling tool, either Solidworks or Onshape, depending on the preference of the group. Participation was voluntary and the participants were not given any compensation for their participation. For all groups, the following steps were carried out in common.
Step 1: Formulate the requirement list (Task clarification)
Step 2: Develop a principle solution sketch (Conceptual design)
Step 3: Develop a CAD model out of the sketch (Embodiment design)
Step 4: 3D-print the CAD model into a scaled down prototype (Embodiment design)
The final outcomes of the design sessions from two case studies are shown in Figures 16 and 17.
Soap box ideas.

Mobile phone stand ideas.

Results of correctness evaluation
To evaluate the creativity assessment method, the creativity scores from the method was compared with those given by set of judges (i.e., people with considerable experience in the domain); this is similar to what earlier researchers such as Sarkar and Chakrabarti (Reference Sarkar and Chakrabarti2011), Chulvi et al. (Reference Chulvi, Mulet, Chakrabarti, López-Mesa and González-Cruz2012), Mulet et al. (Reference Mulet, Royo, Chulvi and Galán2017), and others, have carried out.
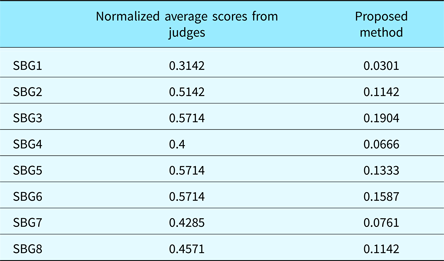
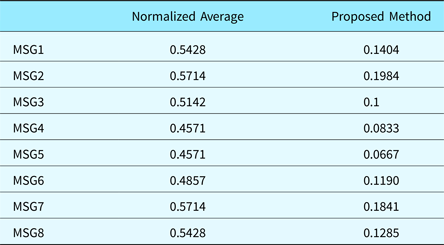
The final designs collected from the case studies 1 and 2 of mobile phone stand and soap box, were given to five judges to rate these for creativity on a scale of 0–7, which was then normalized to a scale of 0–1. A standard set of requirements were generated using the problem brief before the judges were asked to assess the student designs. To ensure that the judges evaluated the designs against the same criteria, each judge was asked to assess each solution, for a given case study, against the same, given set of requirements. Each design was also independently assessed by the authors using the proposed method for creativity, using the same set of requirements given to judges. The average of the scores given by the judges and the score obtained from the proposed method, for the two case studies, are given in Tables 1 and 2.
Soap Box Ideas (SBG1, SBG2, etc. stand for the designs from the eight groups)

Mobile Phone Stand Ideas (MSG1, MSG2, etc. stand for the designs from the eight groups)

The Spearman correlation for the above two sets of scores is as follows: for mobile phone stand study, the correlation is 0.96 for n = 8 with p < 0.001 with an RMS error of 0.39; for Soap Box study, the correlation is 0.93 for n = 8 with p < 0.001 with an RMS error value of 0.37. Both the values indicate very strong associative correlation, with a confidence of 99%. The RMS error represents how far the data points are spread apart from the best fit; a value below 0.5 is considered acceptable.
The above correlations indicate that the assessment provided by the proposed method can be used as an indicator for the creativity of designs as assessed by independent external domain experts. This means that the method has some external validity; the order of creativity as assessed by the method would indicate the order of creativity among designs as would be assessed externally.
Example of a design session
Every group carried out all four steps and the outcomes of each step are evaluated using the creativity assessment method proposed in this paper. Below, we demonstrate one of such assessments that is explain the creativity assessment using one of these 16 responses. The response chosen was the solution developed for P1 – mobile stand.
Step 1 – task clarification
The purpose of this step was to understand the problem and formulate a set of requirements. The response was as follows.
1. To hold or support a mobile stand
2. To withstand the weight
3. To provide a charging point
From problem P1 given to the group, they proposed that a mobile stand needs to satisfy the above three requirements. Since there is no solution proposed, assessment of DRS or novelty is not applicable. Please note that the designers only provided the requirements 1–3 listed above. The further refinement of the RS tree is carried out by the authors to present here how the proposed method can be used at various stages of the design process.
Step 2 – conceptual design
DRS
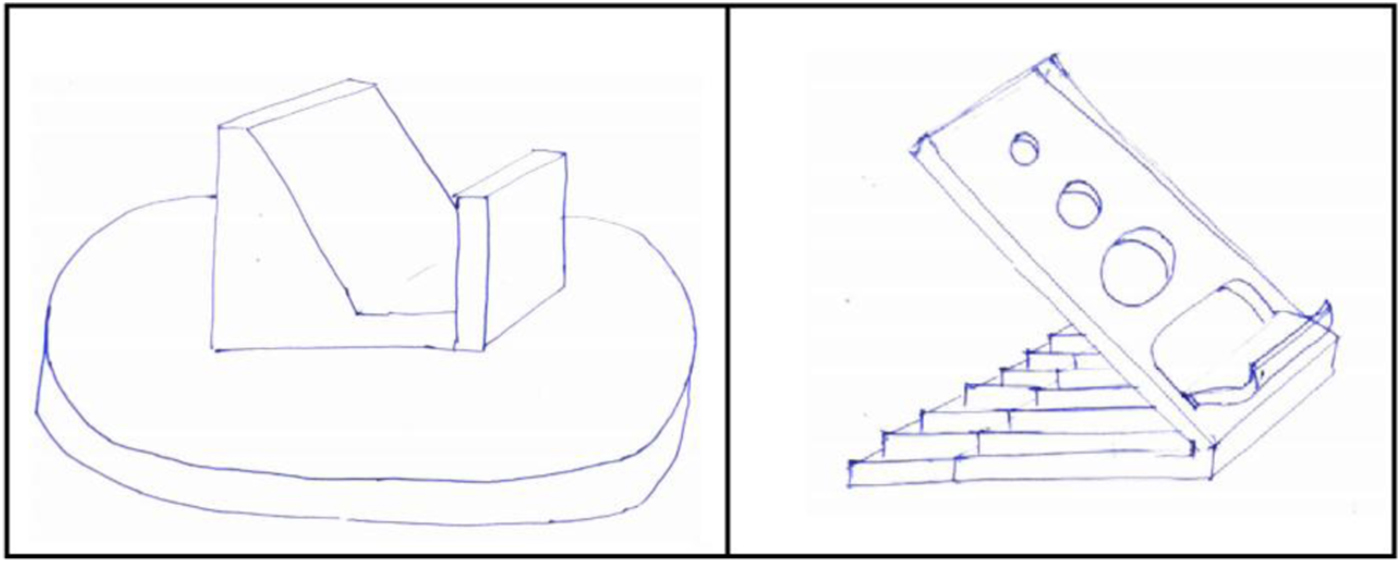
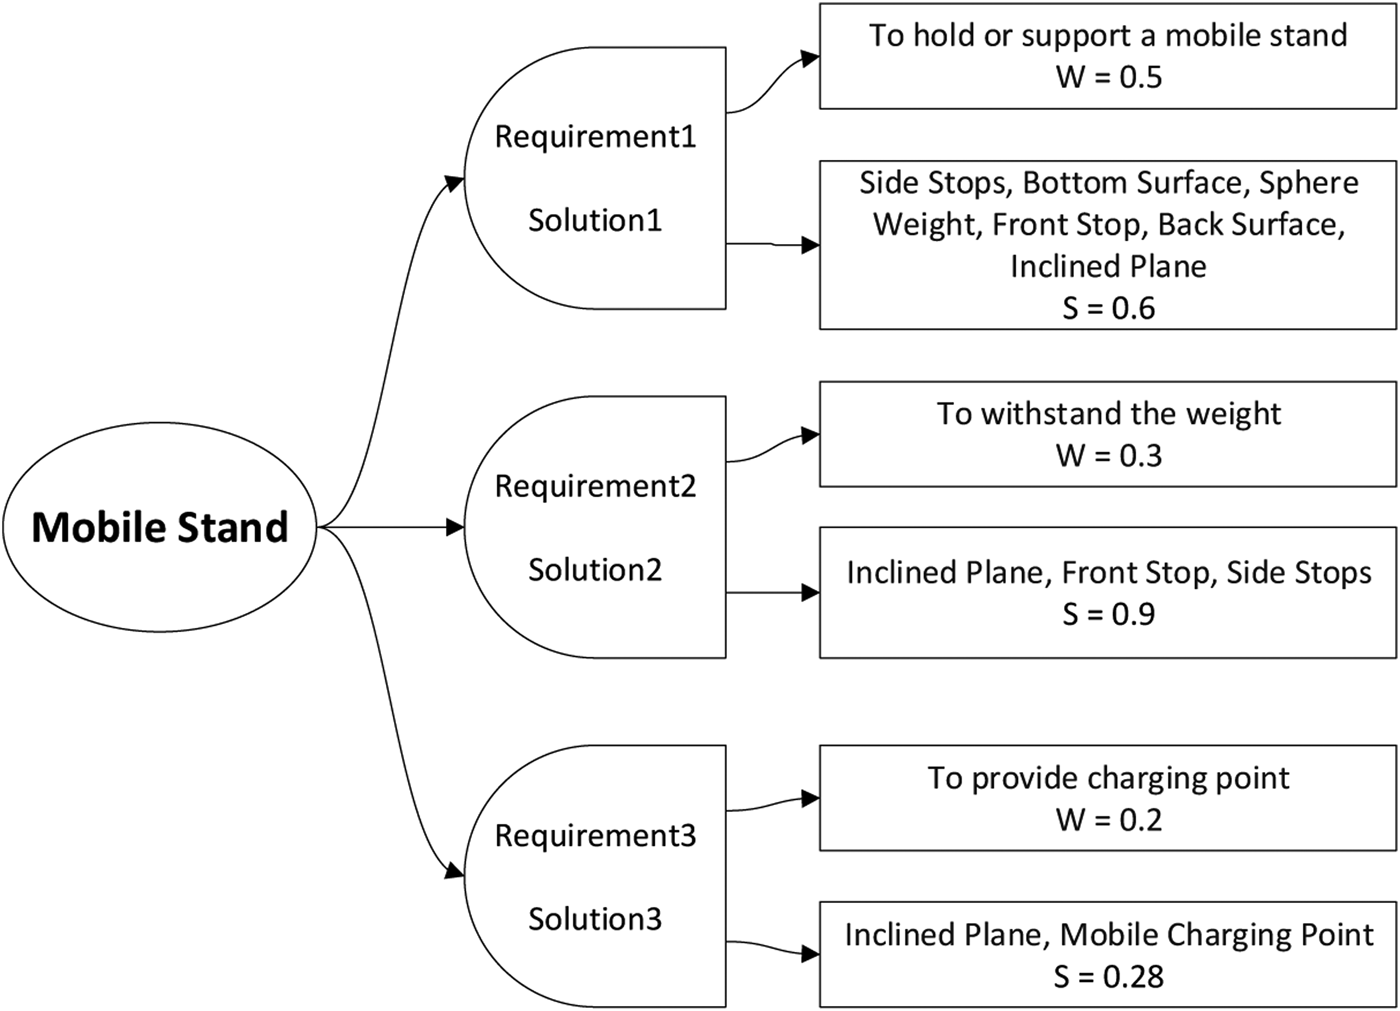
A concept shown in Figure 18 represents the surfaces, interfaces, and form of the mobile stand that the group intended to develop. In order to assess DRS, each requirement is paired with the corresponding solution (Fig. 19). For instance, R2 – “withstand the weight of a mobile phone” is partially by the inclined plane, front stop, and side stop that are present in the sketch (not labeled by the subjects). For this requirement, we assigned a satisfaction score of S = 0.9, which is justified by exploring the requirement further, in the next step (the section ‘Steps 3 and 4 – embodiment design’). Using the satisfaction scores assigned for R1–R3, the weighted mean formula explained in Eq. (12) was applied to compute an overall satisfaction of S = 0.252.
Concept of a mobile stand.

DRS assessment of the concept of mobile stand.

Novelty
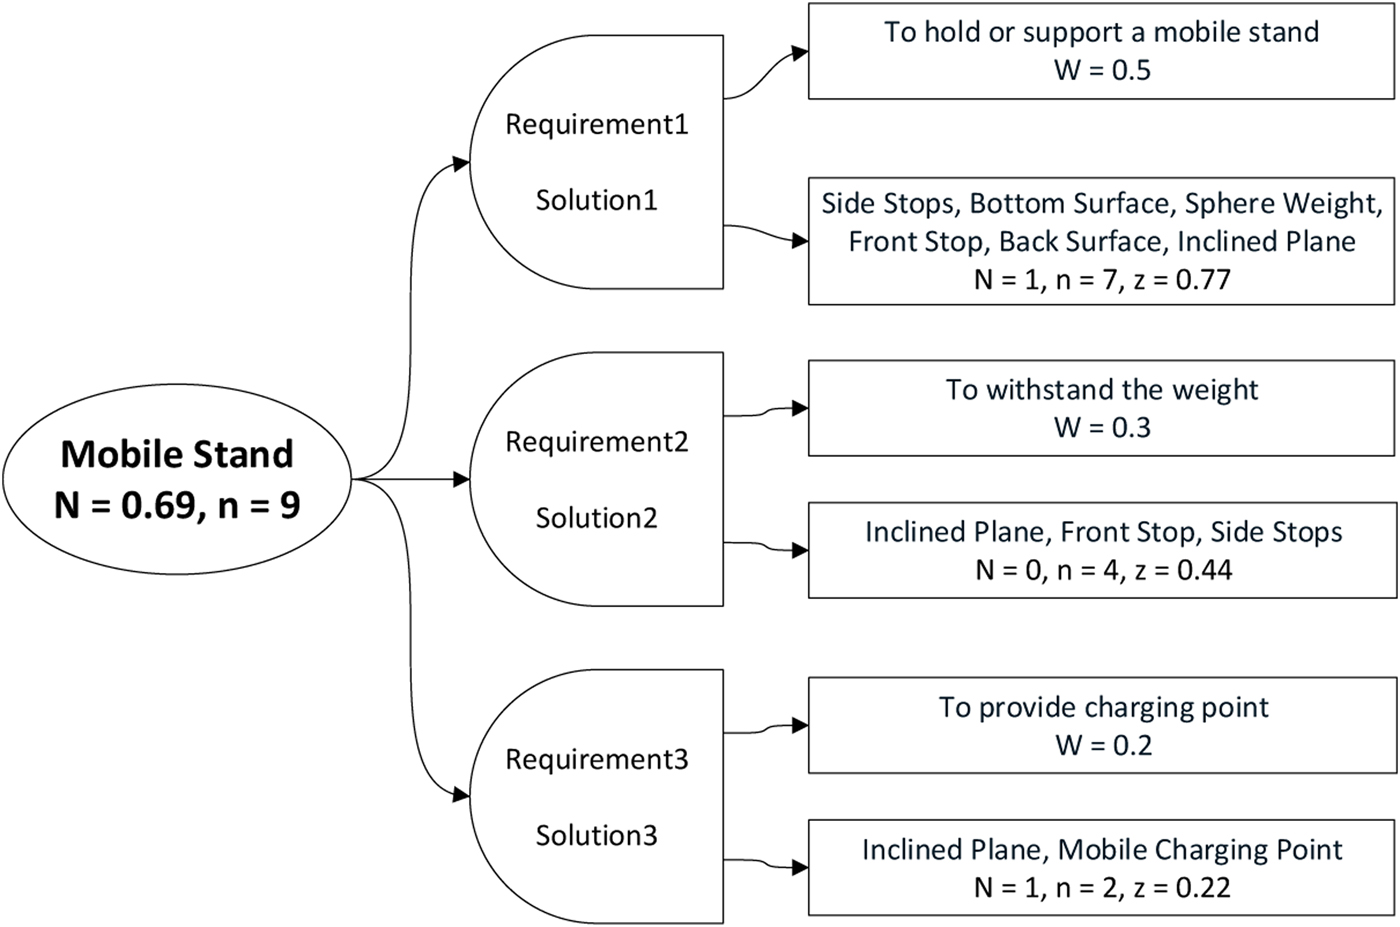
Each RS-pair was assessed for novelty as shown in Figure 20. For instance, considering R3, charging point is provided by the inclined plane and another small hole in the bottom. When the mobile phone is kept on the inclined surface, these interfaces do not actually exhibit any Phenomena since there is no external energy, material, or information (Inputs) entering from outside the system boundary in order to activate any physical Effect. Since the solution is only described at the Parts level, we do not need to construct the SAPPhIRE model for the solution. Therefore, from the list of steps given in the section ‘Assigning novelty for the lowest level RS-pair’, we can skip to Step 7, where requirements are searched along with Parts in order to find similar solutions. In this case, since the combination of inclined plane and mobile charging point was not found in our search through the internet, we assigned a novelty score of N = 1. Similarly, novelty scores were calculated for R1–R3.
Novelty assessment for a concept of mobile stand.

For computing the overall novelty, we applied the weighted mean formula proposed in Eq. (13). In R3-S3, the number of RS pairs n = 2 and in the mobile stand (RS) is n = 9. Therefore, the RS pairs ratio is calculated as z = (2/9) = 0.22. Similarly, RS pair ratios were calculated for R1-S1 and R2-S2. Upon applying the weighted mean formula [Eq. (13)] in this case, the overall novelty was found to be N = 0.69. In order to compute creativity values, the novelty scores in this tree need to be normalized and then multiplied to corresponding satisfaction scores.
Steps 3 and 4 – embodiment design
DRS
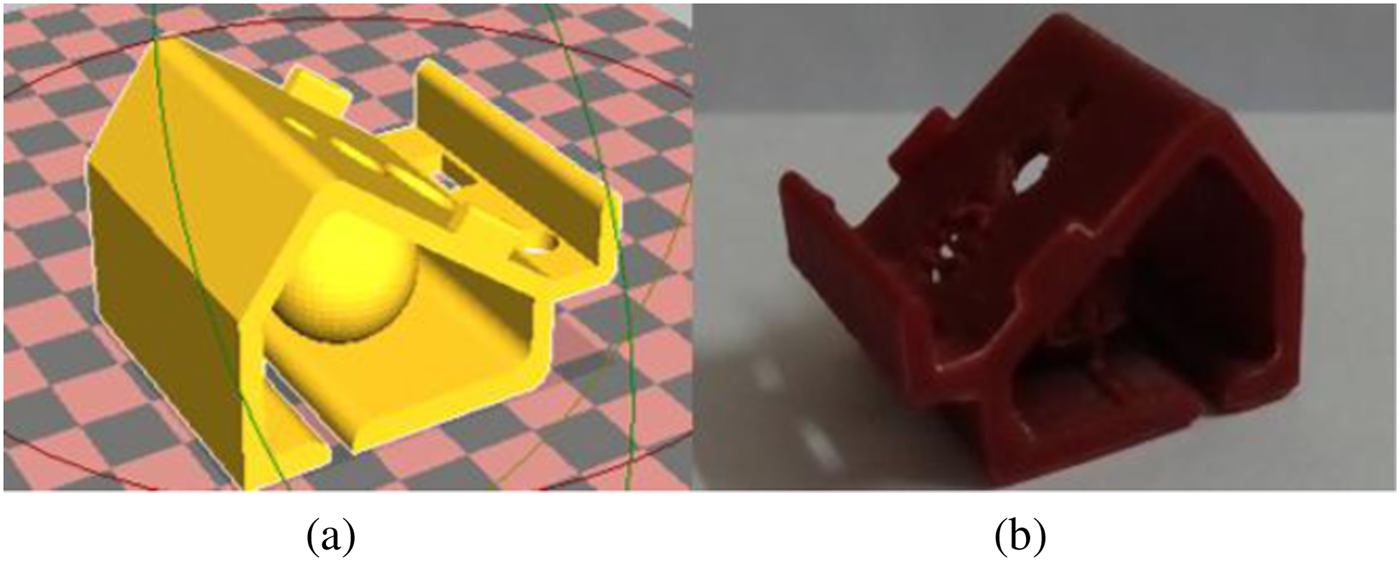
As shown in Figure 21, the outcome of Steps 3 and 4 was a CAD model and a 3D print, which represent the embodiment. Pointing to the R3-S3 pair in Figure 21, the satisfaction score is assigned as S = 0.28, which does not explain how this score was given. For this justification, we decomposed R3 into “charging point on top” and “charging point on bottom”. Most mobile phones today have charging point in the bottom and hence, it was given a weight of 0.9.
(a) CAD model of a mobile stand on the left. (b) 3D printed model on the right.

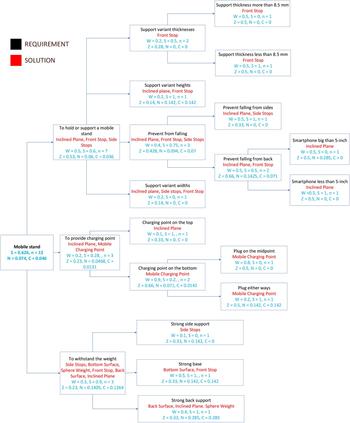
The mobile stand is open at the top and supports any phone with a charging point on the top (S = 1). It has a hole in the bottom and supports charging through bottom with a satisfaction of S = 0.2. Using these lower level satisfaction scores, the score for R3-S3 is justified by 0.2 × 0.9 + 1 × 0.1 = 0.28. The satisfaction score S = 0.2 given to one of the sub-requirements is justified by decomposing the requirements further. As we can see in Figure 22, every lowest level RS-pair has satisfaction score of either S = 0 or S = 1.
Creativity assessment for an embodiment of a mobile stand.

Novelty
For assessing novelty, we employed the approach explained in the section ‘Assigning novelty for the lowest level RS-pair’, and each score is divided by 7 in order to normalize the scores. The normalized novelty (N) scores are shown in Figure 22. At each RS-pair, novelty (N) is multiplied by satisfaction (S) to get creativity (C). The overall solution at the embodiment stage is 62.6% satisfactory and 7.4% novel, and therefore, 4.6% creative.
Analysis
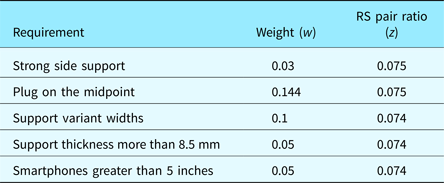
From creativity assessment shown in Figure 22, what one could learn is that a number of requirements are unsatisfied (S = 0) as formulated in Table 3. There are five such requirements whose weights (w) and RS-pairs ratio (z) are shown alongside. The second requirement – plug on the midpoint carries the most weight (w = 0.144) out of five other requirements. The solution proposed for the same requirement has the lowest RS-pair ratio (z = 0.075).
The list of unsatisfied requirements in the mobile stand

The z value denotes the percentage of RS pairs shared with higher level systems. For instance, in the requirement – plug on the midpoint – the satisfaction of S = 0, was given because the position of the charging point is not in the midpoint (See Fig. 21). For addressing this unsolved requirement, a hole should be drilled in the midpoint with an appropriate diameter. In this case, only one RS pair (z = 0.075) out of total nine RS pairs in the mobile stand needs to be changed.
Consider the other requirement – support variant widths, the solution proposed is a combination of inclined plane, side stops, and front stop (n = 1, z = 0.14). Here, satisfaction score of S = 0 was given because the width of inclined plane and separation between the side stops would only support a certain width. In order to support smartphones having a width greater than the width of the inclined plane, it is necessary to increase the width of the inclined plane and the separation between side stops. Due to adjacency, the width of front stop also needs to be increased. Basically, these alterations need to be done in the CAD model (Fig. 21a) and then 3D printing needs to be done again using the changed CAD model, which amounts to a significant loss of time, effort, and material used in 3D printing. With other manufacturing processes, this would result in higher loss compared with 3D the printing process (Siddharth and Sarkar, Reference Siddharth and Sarkar2017).
The above analysis of two unsatisfied requirements with RS-pair ratios (z = 0.075, 0.074) shows that the requirement with lower RS pair ratio (z = 0.074) could be resolved easier compared with the other (z = 0.075). Hence, highest weight (w) and lowest RS-pair ratio (z) would be considered as the priority by which the unsatisfied requirements need to be addressed one-by-one.
Usability and impact evaluation of the proposed method
Case study 3
To evaluate the impact of the proposed creativity assessment method when used during the design process by designers, eight design sessions were conducted. All student designers (D1–D8) were in 2nd and 3rd year of a 4-year bachelor's programme in mechanical engineering. Again in this study as well, the participation was voluntary and the participants were not given any compensation for their participation. A short product design training was given beforehand apart from the training given for carrying out Steps 2b and 5, during design sessions. The following steps were to be carried out by the designers during design sessions:
1. Training (2 h)
2. Task Clarification
a. Prepare Requirements List (1 h)
b. Construct Requirements Tree (1 h)
c. Assign Weights (30 min)
3. Ideation and Conceptual Design
a. Search and Develop Ideas for each requirement (3 h)
b. Combine Ideas to develop concept (2 h)
c. Select an Idea for Development (1 h)
4. Early Embodiment Design
a. Develop detailed sketches (4 h)
b. Develop CAD Models (4 h)
5. DRS Satisfaction assessment with assistance from researchers (2 h)
6. Modifications based on DRS Assessment (2 h)
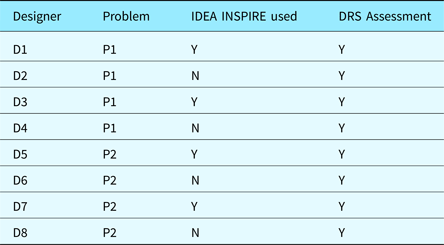
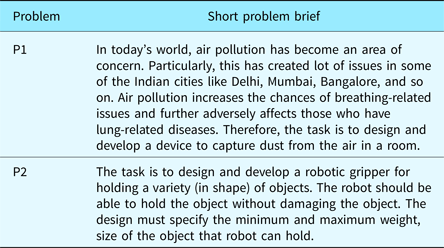
Four designers solved one problem (P1) and remaining four solving another problem (P2). Until Step 2b, designers were paired in teams to come up with requirements tree. After Step 2b, designers carried out the remaining steps individually. Although designers were requested to follow a time line (given with steps), it was not strictly adhered to.
It should be noted that this study had two objectives: (1) to evaluate the usability and impact of the proposed DRS assessment method and (2) to evaluate newer version of IDEA INSPIRE (Chakrabarti et al., Reference Chakrabarti, Siddharth, Dinakar, Panda, Palegar and Keshwani2017) for its effect on Novelty. The details of the study are given in Tables 4 and 5. The focus in this paper is on only the first objective of the study.
Details of the design experiment

Problem statements

Results
In this section, we present the results of Case Study 3 in which eight design sessions were carried out to understand the usability and impact evaluation of the DRS assessment, a part of the proposed creativity assessment method. Novelty assessment was not carried out as it required a longer time to carry out the assessment and the computational support for novelty assessment is not yet implemented. Novelty and Creativity assessments were carried out post-design sessions.
Each of the design sessions took nearly 20–25 h spread over 3 days. Designers took nearly 8–10 h to carry out Step 1 to Step 3c, 9–10 h to carry out Steps 4a and 4b, and nearly 2 h to carry out DRS assessment, and another 2–3 h to carry out the modifications.
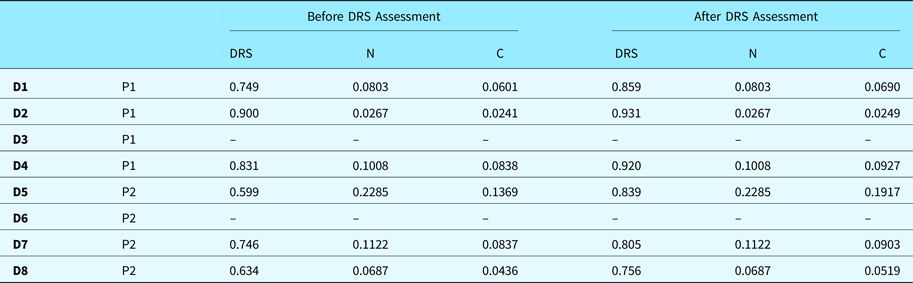
It was found from the evaluation carried out that the construction of the requirements tree (e.g. from D2-P1 in Fig. 23) was possible by the designers themselves. It was also possible to carry out the DRS assessment in each of the design sessions. DRS assessment was carried out by the designer with the assistance of researcher. The sub-solutions and overall solution were self-assessed by the designers. It was observed during the assessment procedure that the requirements tree was modified by (a) adding more sub-requirements, (b) removal of sub-requirements, and (c) modifying weightages of the requirements. After the assessment, the designers were asked to update/modify their solutions. Except for two designers, six designers accepted that the modifications were required and accordingly modified the solutions based on DRS assessment. From Table 6, it can be found that the DRS improved after assessment (Fig. 24).
Weighted requirements tree by D1-P1.

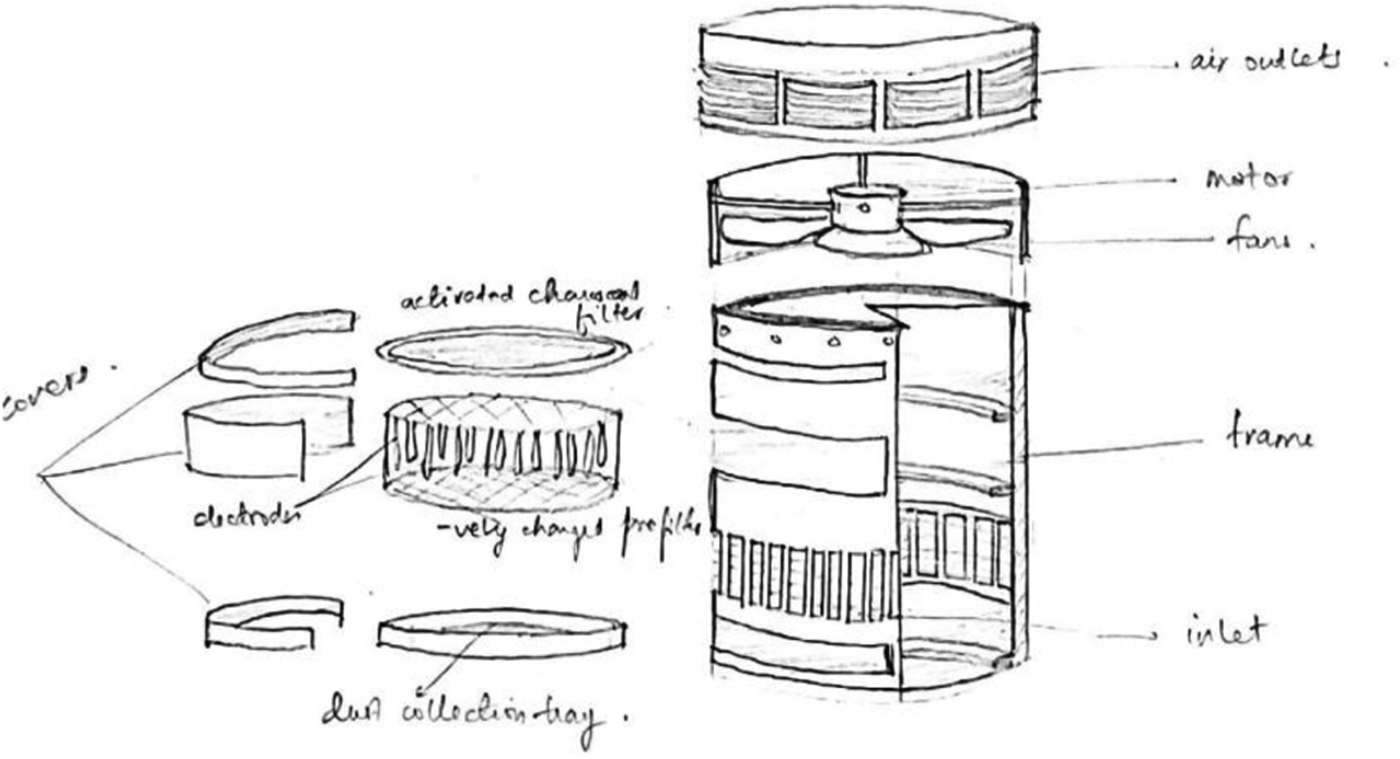
Concept by D1-P1.

Results

Summary
To summarize, it was observed that the construction of the requirements tree and requirement satisfaction assessment could be carried out during the process. Also, that it helps improve the requirement satisfaction of the solutions. Carrying out the above two major steps of creativity assessment indicate that, with a computer-based support for novelty assessment, it would be possible for designers to carry out the novelty and creativity assessment during the process.
Discussion
The overall aim of this research is to develop a creativity assessment method that could be applied to ideas and concepts as these evolve during the entire design process. To achieve this objective, we initially raised two questions. (1) Which factors should be used as indicators of creativity consistently across different phases of engineering design process? (2) How can creativity be assessed in terms of these factors during the design process?
The first question was answered by the review of various indicators of creativity in literature; it has been found that creativity is indicated by two major factors: novelty and usefulness. To answer the second question, multiple sub-research questions had to be answered (question numbers in brackets refer to sub-research questions in the Introduction Section). To address research question (2a), we reviewed several methods for creativity assessment, identified their limitations in the section ‘Srinivasan and Chakrabarti (Reference Srinivasan and Chakrabarti2010b)’, and an extended creativity assessment method based on the work of Srinivasan and Chakrabarti (Reference Srinivasan and Chakrabarti2010b) was proposed in the section ‘Proposed creativity assessment method’ to overcome the limitations. To address (2b), two evaluations involving three case studies are presented in the section ‘evaluation of the proposed creativity assessment method’. In the section ‘Correctness evaluation of the proposed method’, correctness evaluation of the proposed method was carried out by benchmarking it with judge's scores for creativity. The results show that the collective assessment of the judges has good correlation with the assessment from proposed method. In the section ‘Usability and impact evaluation of the proposed method’, usability and impact evaluation of the DRS assessment, a part of creativity assessment, during the design process is presented. It was found that the requirement tree could be constructed by the designers themselves, and DRS assessment could be carried out currently with the assistance of the researchers. In six out of eight design sessions, designers made modifications in the solutions based on the results of assessments, which improved DRS and eventually creativity.
The following points explain as to how the method is intended to overcome the limitations of creativity assessment methods, as identified from the literature.
1. Search method: The method proposed, as explained in the section ‘Assigning novelty for the lowest level RS-pair’ for assessing the novelty of an RS-pair, has seven levels of search queries: R-Actions; R-States, R-Inputs, R-Phenomena, R-Effects; R-oRgans, and R-Parts. These are the specific aspects of a solution to be generated during the design process, which can be searched in the given order. The search starts with the highest level function (Actions), where product space is limited to those that perform the same function. As the further entities are used in the search, space converges to those products performing the same function (Actions) and having a similar set of components (Parts).
2. Using a number of similar solutions: The novelty measure proposed in the section ‘Novelty assessment’, which is extended from Sarkar and Chakrabarti (Reference Sarkar and Chakrabarti2011), does not depend on (similarity with) the number of elements in the current solution space, but on the abstraction level at which the solution is found to be different from existing, reference products.
3. Tediousness in modeling products: In the proposed method, we propose the search to be carried out on a computational database, (e.g. Google patents), using the entities of SAPPhIRE model with which the solution is modeled, as explained in the section ‘Novelty assessment’. This search, when carried out, would provide a set of matches against corresponding entities of existing products. Therefore, constructing SAPPhIRE models for every product in the space would not be necessary. However, methods for automation of the steps involved, such as searching for existing solutions, developing their SAPPhIRE models and comparing new solution with existing solutions, are yet to be developed.
4. Comparing solutions at different levels of detail and finding similar subsystems: The proposed method improves upon the method of Srinivasan and Chakrabarti (Reference Srinivasan and Chakrabarti2010b) by starting novelty assessment from an RS pair at the lowest level, which represents a subsystem of an idea, a concept, or even a product. Using the steps in the section ‘Novelty assessment’, it should also be possible to search through similar subsystems of different products.
5. Use of post-development factors: The proposed method (the section ‘DRS assessment’) examines usefulness in terms of Degree of Requirement Satisfaction (DRS), which is applicable at any stage of design, as demonstrated using a case study, where we assessed the DRS for a concept (the section ‘Step 2 – conceptual design’) and an embodiment (the section ’ Steps 3 and 4 – embodiment design’).
6. Justifying weak or intermediary satisfaction: The subjectivity in assigning satisfaction scores is arguably reduced by decomposing a partially satisfied requirement (0 < S < 1) into sub-requirements that are either completely satisfied (S = 1) or completely unsatisfied (S = 0). This also gives a justification as to why the satisfaction is weak or intermediary.
7. Impact in the design process: At the end of Case Studies 1 & 2 (the section ‘Example of a design session’), several unsatisfied requirements (S = 0) were identified, which could be addressed one-by-one using the priority given by the weights (w) and RS-pair ratio (z). As argued in Section ‘Analysis', these satisfaction (S) and novelty (N) scores should act as part of the reasons as to why a solution should be accepted or rejected. Since the assessment provides S and N scores even for a subsystem, it provides a possibility to improve upon even minute aspects of a complex product.
Automation of the steps for novelty assessment method has not been implemented in this work, and could not be evaluated for usability and impact during the design process. An example procedure is given below to indicate as to how the steps (see Fig. 8) for novelty assessment method proposed could be automated:
Step 1: Select one of the lowest level RS-pairs.
Step 2: Model the new solution in SAPPhIRE form (an example of how this can be done is given in Keshwani and Chakrabarti, Reference Keshwani and Chakrabarti2017).
Step 3: Collect and record as many existing solutions as possible using guided internet search as for example, in Figure 10; Convert all existing solutions (in Step 2) to SAPPhIRE form (as in Keshwani and Chakrabarti, Reference Keshwani and Chakrabarti2017); To compare the first six of the seven constructs, use text similarity algorithms (as e.g. in Gomaa and Fahmy, Reference Gomaa and Fahmy2013) to identify similarity. To compare “parts”, use both text similarity algorithms (as e.g. in Gomaa and Fahmy, Reference Gomaa and Fahmy2013) and comparison of CAD models (as e.g. in Ip et al., Reference Ip, Lapadat, Sieger and Regli2002). However, the efficiency of the text similarity algorithms varies across procedure proposed in the current literature. To decide on the level of novelty, a threshold for similarity needs to be used; if a new solution is similar at all levels of abstraction to an existing solution, a novelty score of 0 is given and if a new solution is dissimilar at one or more levels of abstraction, an appropriate novelty score can be assigned.
Step 4–5: The steps in Figure 8 can be computed using Eqs 13 and 14.
Limitations
A major limitation of the method proposed is the potential subjectivity involved in assigning weights to the requirements in the DRS assessment (the section ‘Weighted requirements tree’); however, this is a common issue for methods that involve requirement-satisfaction analyses. Another limitation is that, in its current form, the proposed method does not consider “over satisfaction” of requirements.
Yet another limitation is that the proposed novelty assessment method contains a large number of steps, which requires significant amounts of time to be spent by the user. Also, the user needs to have knowledge of SAPPhIRE model, which is the basis for evaluation in this method. These make it difficult for the method to be used easily in its current form during the design process. Further, if the information available about a design solution is incomplete, developing a complete SAPPhIRE model would not be possible, which would be reflected in terms of greater imprecision in the creativity score obtained using the method.
Conclusions
The overall aim of this research is to develop a creativity assessment method that can be used by designers during and through the entire design process, this is not currently available. The proposed method explains as to how creativity assessment could be carried out and how its results could be used for improvements in the designs being developed. As to how the proposed method is envisaged to be used during the design process is also explained using a detailed example of the application of the method in the sections ‘Example of a design session’ and ‘Analysis’.
The main contributions of the work reported are as follows:
1. Creativity assessment has traditionally been used retrospectively and seen primarily as a research tool. The recent work by Grace and Maher (Reference Grace and Maher2015) which discusses the use of the creativity assessment during the design process for problem-reformulation for improving creativity is among the very few that explore the possibility of using creativity assessment as a design method. The work proposed in this paper extends this idea substantially, where creativity assessment is proposed as a proactive instrument for direct and immediate feedback to the designer for relevant action during design, for supporting both problem-finding and problem-solving, including relationships between the problems and the solutions explored. This expansion of the idea of creativity assessment as a pro-active, comprehensive design method is a major contribution of this paper, which opens up new and exciting opportunities for further research.
2. A creativity assessment method has been proposed that is intended to be used during and throughout the design process, in order to guide the designer in the areas of development that requires creative input. The method uses novelty and requirement satisfaction as its two indicators. The work explains in detail as to how the proposed method is intended to be used during the design process. The novelty of the method lies in its use of RS pairs as the unit of assessment. This is a departure from many traditional approaches that focus only on the novelty of the solution, thereby missing out on the possible novelty of the requirement, or the relationship between the requirement and the solution, both of which might be existing and yet the pair could be novel as never connected before.
3. The proposed method for creativity assessment has been corroborated, using two case studies, using collective assessment of experts as a benchmark. The evaluation shows a high degree of correlation, indicating its potential.
4. A detailed example of one design session from the case study has been used to illustrate as to how the proposed method can be implemented during the process. Further, evaluation of a part of the method (i.e. DRS evaluation) for its usability and impact of use during the design process has been carried out. The evaluation indicates that it is possible, by the designers, to develop the requirements tree and (with support from researchers) carry out DRS assessment, both during the process. It further indicates that such evaluation improves the requirement satisfaction of the designs developed during the process.
As discussed earlier, the method proposed a novelty assessment approach that can be operationalized as given in the sections ‘Novelty assessment’. Evaluation of the usability and impact of proposed method of novelty assessment are yet to be carried during the design process, as novelty assessment requires substantial effort; the work reported points to both the amount of work required and the steps that have to be automated or supported to support novelty assessment during the design process. Further, it points to the amount of research still remaining, before the goal of the proposed creativity assessment method is achieved, to help designers” self-assess creativity of evolving solutions and their elements during and through the design process, so that corrective steps could be taken to tune the degree of creativity of the solutions appropriately.
Future work
The proposed method needs to be implemented in a software tool for supporting the design process, for two reasons: (1) it takes substantial effort and time to manually carry out the assessment; (2) the need for the user to have knowledge of SAPPhIRE model needs to be eliminated, for example, with a database of SAPPhIRE models of existing devices or patents that could be automatically queried and used.
While substantial effort has already been spent to address the second point above, with the development of multiple versions of IDEA INSPIRE (Chakrabarti et al., Reference Chakrabarti, Sarkar, Leelavathamma and Nataraju2005, Reference Chakrabarti, Siddharth, Dinakar, Panda, Palegar and Keshwani2017), the first point is yet to be addressed. This requires developing a robust tool with which requirement-satisfaction, novelty, and creativity could be assessed and supported during the design process.
Acknowledgments
The authors wish to thank all the students for their participation in the workshop and domain experts for their inputs in the evaluation of the designs.
B.S.C. Ranjan is a PhD student in the Innovation, Design Study and Sustainability Laboratory, Centre for Product Design and Manufacturing, Indian Institute of Science. He received his masters in engineering design from the Indian Institute of Science in 2012 and his bachelors in mechanical engineering from Visvesvaraya Technological University in 2007. His research interests include design creativity, creativity evaluation, design methodologies, embodiment design, product design, machine tools, robotics, automotive engineering, and biomimetics.
L. Siddharth is a researcher at the Centre for Product Design and Manufacturing, Indian Institute of Science. He was awarded Bachelor of Technology (B.Tech) Degree in Mechanical Engineering from the Indian Institute of Technology Ropar. He leads several projects that span over broad research areas such as engineering changes, failure analysis, function modelling, systems theory, novelty assessment, behavioural modelling of manufacturing systems, LCA etc. He has been the sole researcher and end-to-end developer of three design support tools: Idea-Inspire 4.0 (analogical design), CRIS4P (knowledge base of past failures), and Vatram (change propagation).
Amaresh Chakrabarti is a Senior Professor and current Chairman for Centre for Product Design & Manufacturing, Indian Institute of Science (IISc), Bangalore. He has BE (Mech Engineering, IIEST Shibpur), ME (Mech Design, IISc) and PhD (Engineering Design, University of Cambridge UK). He led for 10 years the Design Synthesis group at EPSRC CoE Engg Design Centre at University of Cambridge. His interests are in synthesis, creativity, sustainability, and informatics. He published 13 books, over 290 peer-reviewed articles, and has 10 patents granted/pending. He co-authored DRM, a methodology used widely as framework for design research.