Natural and synthetic layered structures may serve as supports for the intercalation of various organic molecules. The functionalities of the hybrid nanomaterials prepared depend on the type of inorganic host as well as the chemical properties of the molecules introduced (Takahashi & Kuroda, Reference Takahashi and Kuroda2011). The new materials may be used as adsorbents, catalysts or fillers in the production of nanocomposites (Sanchez et al., Reference Sanchez, Belleville, Popall and Nicole2011; Araújo et al., Reference Araújo, Baptista, Marçal, Ciuffi, Nassar, Calefi, Vicente, Trujillano, Rives, Gil, Korili and de Faria2014; Fan et al., Reference Fan, Li, Evans and Duan2014; Chen et al., Reference Chen, Zhou, Fiore, Tong, Zhang, Li, Ji and Yu2016; Struijk et al., Reference Struijk, Rocha and Detellier2017). The intercalation of photoresponsive molecules (e.g. azobenzene (Az) and its derivatives) enables the design of layered materials showing photoactive behaviour when exposed to UV–Vis radiation (Klajn, Reference Klajn2010; Klajn et al., Reference Klajn, Stoddart and Grzybowski2010). The isomerization of intercalated Az-type species triggered by UV light may lead to changes in the interlayer space of the host. This is due to a trans to cis conformational change accompanied by a change of molecular dimensions (Bandara & Burdette, Reference Bandara and Burdette2012). Subsequently, the interplanar distances in the structures of intercalation compounds may be controlled at an atomic level, giving rise to new materials (Russew & Hecht, Reference Russew and Hecht2010; García-Amorós & Velasco, Reference García-Amorós and Velasco2012; Mahimwalla et al., Reference Mahimwalla, Yager, Mamiya, Shishido, Priimagi and Barrett2012). Selected layered minerals and synthetic phases have been reported as hosts in such applications (Ogawa & Kuroda, Reference Ogawa and Kuroda1995). Among others, these include smectite minerals, synthetic micas, transition metal oxides, zirconium phosphates, perovskites and layered double hydroxides (Sasai & Shinomura, Reference Sasai and Shinomura2013; Yan & Wei, Reference Yan and Wei2015). The intercalation of a cationic form of Az into montmorillonite has been reported previously (Ogawa, Reference Ogawa1996). The intercalated molecule showed reversible trans–cis conformation change, which was not accompanied by changes to the interlayer distance, however. This was later explained as resulting from rearrangement of molecules due to their flexible organic chains. The co-intercalation of quaternary ammonium salts and Az has been described for synthetic tetrasilicic micas (Fujita et al., Reference Fujita, Iyi and Klapyta1998, Reference Fujita, Iyi and Klapyta2001, Reference Fujita, Iyi, Klapyta, Fujii, Kaneko and Kitamura2003). Reversible changes in basal spacing values induced by UV radiation were observed, and these were influenced by the type and content of pre-intercalated organic cations. Similarly, two smectite minerals, montmorillonite and beidellite, were co-intercalated with alkylammonium salts and Az. These complexes also exhibited basal spacing shifts upon UV radiation (Koteja et al., Reference Koteja, Szczerba and Matusik2017).
Kaolinite is a 1:1 layered aluminium silicate that exhibits an asymmetrical interlayer environment. On one side, surface oxygens of the tetrahedral sheet are present, while the other side contains exposed inner-surface hydroxyls. The latter are susceptible to grafting reactions with, for example, alcohols (Matusik et al., Reference Matusik, Scholtzová and Tunega2012; Cheng et al., Reference Cheng, Hou, Liu, Li and Frost2015), diols (Gardolinski & Lagaly, Reference Gardolinski and Lagaly2005a), aminoalcohols (Letaief & Detellier, Reference Letaief and Detellier2007; Koteja & Matusik, Reference Koteja and Matusik2015) and organic acids (da Silva et al., Reference da Silva, Ciuffi, Reis, Calefi and de Faria2016). These grafted compounds have been tested in a wide variety of applications (Dedzo & Detellier, Reference Dedzo and Detellier2016). Moreover, earlier work has indicated that the use of a hydrophobic methoxy derivative of kaolinite enables the preparation of intercalates with alkylammonium surfactants in analogy to smectites (Kuroda et al., Reference Kuroda, Ito, Itabashi and Kuroda2011; Matusik & Kłapyta, Reference Matusik and Kłapyta2013; Matusik et al., Reference Matusik, Kłapyta and Olejniczak2013; Cheng et al., Reference Cheng, Xu, Wang and Frost2016). Subsequently, the resultant hydrophobic interlayer environment opens up the possibility of intercalating other apolar organic species into kaolinite. To our knowledge, there is no information on the use of 1:1 layered minerals for the preparation of photoresponsive materials via intercalation of photoactive molecules including Az.
Therefore, the objective of this research was to intercalate photoactive Az molecules into the structure of natural, pre-intercalated kaolinite. The structure of the new hybrid organo-mineral derivative was investigated and its behaviour towards UV radiation was examined.
Materials and methods
Starting mineral and the modification procedure
Kaolinite (M) of high structural order (Hinckley index = 1.31) from the Maria III deposit (Nowogrodziec, Poland) was used in the experiments. The sample contained ~80% kaolinite with additional admixtures of quartz and illite (Matusik et al., Reference Matusik, Wisła-Walsh, Gaweł, Bielańska and Bahranowski2011). The separated fraction was <40 µm with an average particle size of 7 µm. The standard clay fraction of <2 µm was not separated, as preliminary experiments showed much lower intercalation efficiency in the case of finer fractions.
The kaolinite was firstly pre-intercalated with dimethyl sulfoxide (DMSO), by mixing 3 g of the mineral with 50 mL of DMSO containing 3% double-distilled water. The presence of water increased the intercalation degree by reducing the attraction forces between highly polar DMSO molecules. The suspension was also sonicated and stirred for 3 days at room temperature. Afterwards, the intercalation compound (MDS) formed was centrifuged, dried at 70°C for 48 h and ground for further use.
Subsequently, the MDS intercalate was mixed with 50 mL of methanol for 24 h at room temperature. Then, the suspension was centrifuged and the solid was washed repeatedly with fresh 50 mL portions of methanol, until Fourier-transform infrared (FTIR) spectroscopy showed a lack of vibrational bands attributed solely to DMSO molecules. The final methoxy-kaolinite grafted compound (MM) was dried at 70°C for 24 h and powdered.
The MM sample was used for the intercalation of benzyldimethylalkylammonium chlorides (BCn, n = 12, 14 or 16) dissolved in methanol. The concentration of organic salts was set to 0.5 mol/L. High surfactant loading was necessary to induce the intercalation (e.g. Matusik & Kłapyta, Reference Matusik and Kłapyta2013). The MM-to-solution ratio was constant for all of the experiments and equal to 200 mg/5 mL. After 72 h of stirring at room temperature, the suspension was centrifuged, dried at 70°C for 24 h and powdered.
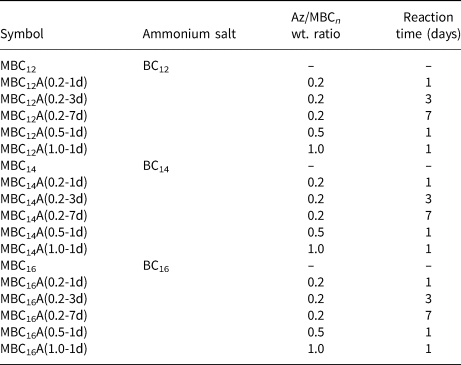
Azobenzene reacted with the MBCn samples in a closed Teflon vessel at 110°C; thus, the Az intercalation was carried out in vapour form. The Az:MBCn wt. ratio was set to 0.2, 0.5 and 1.0 and the reaction was carried out for 1, 3 and 7 days. All samples with their abbreviations and experimental procedure information are listed in Table 1.
Ammonium salt and Az intercalates: symbols, salt type, Az/MBCn wt. ratio and time of reaction with Az.

Material characterization methods
The X-ray diffraction (XRD) patterns were recorded for powdered and random samples using a Rigaku MiniFlex diffractometer (Cu-Kα radiation) in the 1–30°2θ range with a 0.05°2θ step. The FTIR analysis was done using the transmission mode (1 wt.% sample/KBr) in the 4000–400 cm–1 spectral range at 4 cm–1 resolution with 64 scans (Thermo Scientific Nicolet 6700 spectrometer). UV–Vis spectra of powdered samples were recorded with a ThermoEvolution 600 spectrophotometer in the 200–700 nm range with a 2 nm data interval. The CHN elemental analysis was performed through the combustion of samples and the measurement of purified and separated gaseous products (VarioEL III Elementar analyser). Thermogravimetric (thermogravimetry (TG), differential TG (DTG)) and differential thermal analysis (DTA) were carried out in the 20–1000°C temperature range with a 10°C/min heating rate in an air atmosphere (Netzsch STA 449F3 Jupiter instrument). Simultaneously, the evolved gaseous products were analysed with an Aeolos QMS 403 C mass spectrometer.
Photoinduced reactions
The photoinduced activity of the obtained Az intercalated materials was tested with a custom-made UV lamp (Optister Company, Krakow, Poland). The UV light source emits 365 nm radiation wavelength. The source was equipped with an IR cut-off filter to prevent the sample from overheating. The UV power was set to 10 mW/cm2.
Before the procedure and after irradiation, the UV–Vis, FTIR spectra and the XRD patterns were recorded in order to monitor the Az isomerization and the d 001 value shifts. For the UV–Vis analysis, powdered samples were irradiated directly in the UV–Vis dedicated holder. In the case of FTIR analysis, the KBr pressed disks were used directly for the UV exposure, and the number of scans was lowered from 64 to 20 in order to shorten the analysis time. For the XRD analysis, the powdered samples were placed on glass slides for UV exposure.
Results and discussion
Characterization of kaolinite precursors
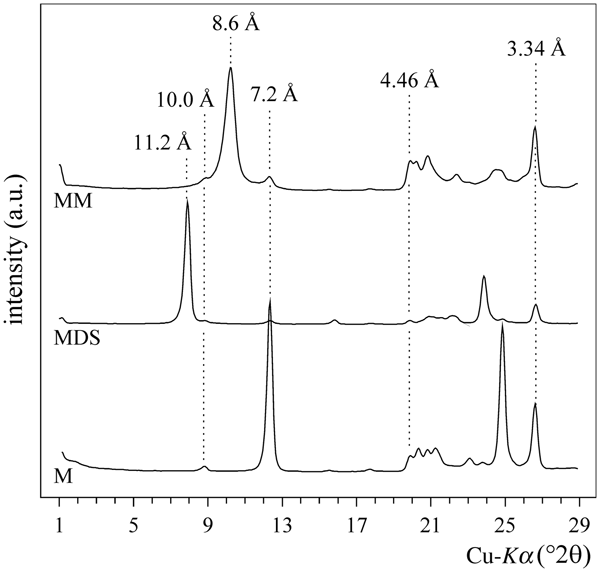
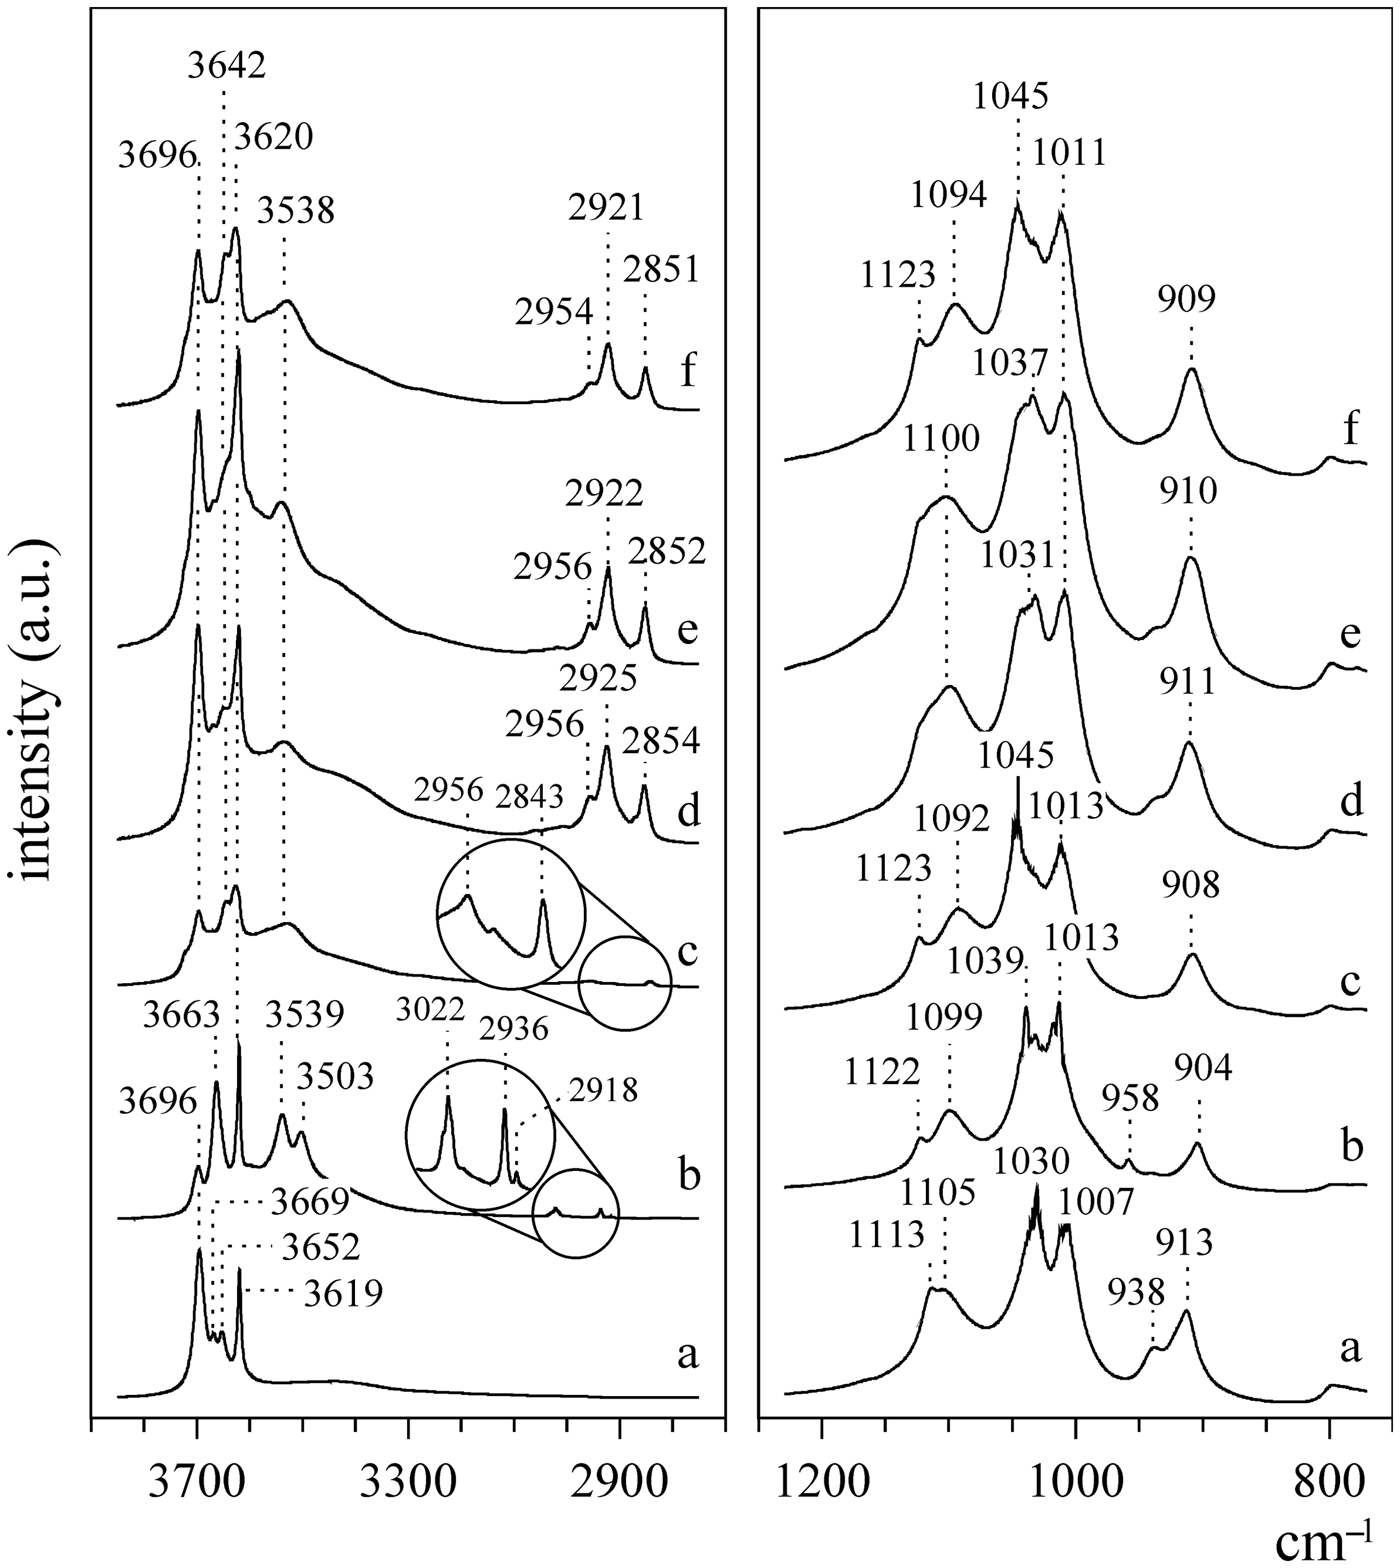
After intercalation of DMSO, the initial basal spacing of kaolinite (7.2 Å) was shifted to 11.2 Å (Fig. 1) due to the formation of the intercalation compound (MDS sample), in agreement with previous reports (Koteja & Matusik, Reference Koteja and Matusik2015). The formation of hydrogen bonds between DMSO and the octahedral sheet significantly affected the IR bands in the O–H stretching region (4000–3600 cm–1) (Fig. 2). The intensity of the 3696 cm–1 band decreased, and new bands at 3539, 3503 and 958 cm–1 appeared due to –O–H···O = S hydrogen bonding (Scholtzová & Smrčok, Reference Scholtzová and Smrčok2009). The vibrations within the DMSO structure yielded IR bands at 3022, 2936 and 2918 cm–1. The intercalation of DMSO, which is a highly polar molecule, also affected the aluminosilicate framework, as is shown by the shift of the Si–O stretching bands from 1030 and 1007 cm–1 to 1039 and 1013 cm–1, respectively.
XRD patterns of pure kaolinite (M), MDS intercalate and MM-grafted kaolinite.

FTIR spectra of a = kaolinite, b = MDS, c = MM, d = MBC12, e = MBC14 and f = MBC16.

The XRD pattern of the MM sample recorded in a dry state had a basal spacing equal to 8.6 Å, corresponding to a methoxy-modified kaolinite layer (Matusik et al., Reference Matusik, Scholtzová and Tunega2012). A 7.2 Å reflection of low intensity indicated that a small fraction of the kaolinite layers was not intercalated. In all of the intercalated samples, peaks at 3.34 and 10.00 Å are visible, indicating the presence of quartz and minor admixtures of illite. The IR spectra confirmed that, during methanol washing, the DMSO was de-intercalated. This was supported by the disappearance of bands at 3539, 3503, 3022 (CH3–S bond) and 958 cm–1 described in previous reports (Matusik et al., Reference Matusik, Scholtzová and Tunega2012). In addition, a further shift of Si–O bands to 1045 cm–1 was noticed.
The contribution of methoxy groups grafted to the aluminol surface was calculated from the CHN elemental analysis, according to previous work (Matusik & Kłapyta, Reference Matusik and Kłapyta2013), and indicated the following chemical composition of the intercalate: Al2Si2O5(OH)3.78(OCH3)0.22.
Characterization of the benzylalkylammonium-intercalated kaolinite
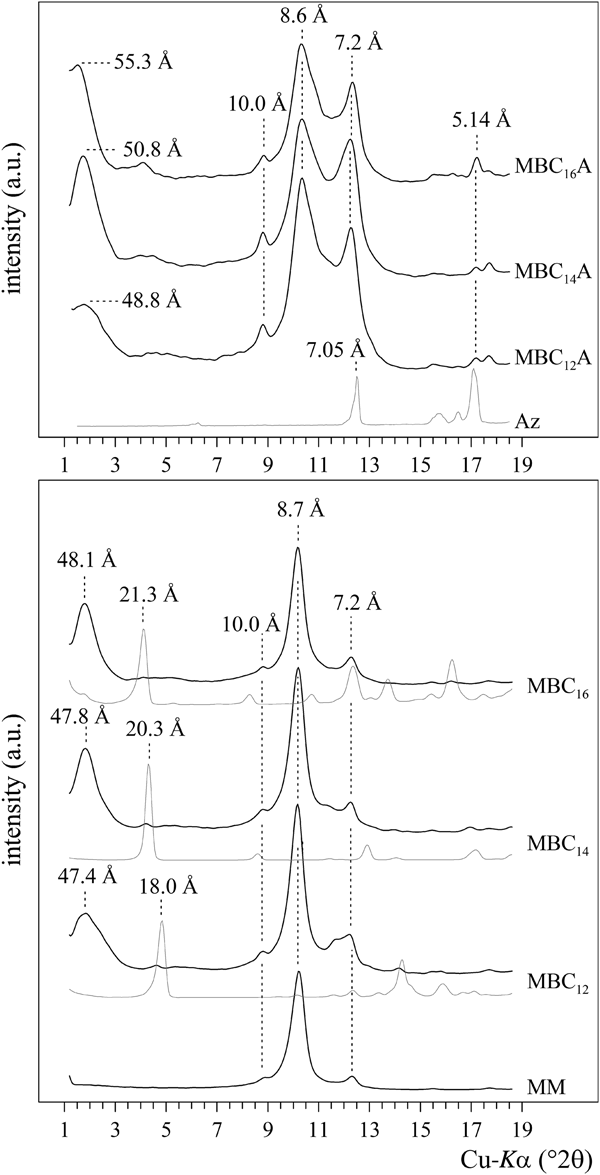
The XRD patterns revealed a significant increase in the basal spacing from 8.6 Å (initial MM sample) to 47.4, 47.8 and 48.1 Å after intercalation of BC12, BC14 and BC16 salts, respectively (Fig. 3). Intercalation of the BCn salt was possible due to the hydrophobic character of the MM sample having octahedral sheets grafted with –OCH3 groups. Taking into account the large d 001 value, it was proposed that the ammonium salt arrangement is perpendicular to the kaolinite layer, in agreement with previous results (Cheng et al., Reference Cheng, Xu, Wang and Frost2016). The hydrophobic alkyl chain interacted with the –OCH3-grafted octahedral sheet, while the ammonium head of the molecule was located close to the oxygens of the tetrahedral sheet (Matusik & Kłapyta, Reference Matusik and Kłapyta2013). The intense 8.6 Å and 7.2 Å reflections are related to the methoxy-kaolinite and pure kaolinite layers, respectively, which were not intercalated. Thus, the sample consisted of three phases: the unreacted kaolinite, methoxy-kaolinite and surfactant-modified kaolinite. There was no indication of pure salts in the XRD patterns, suggesting that the amount of non-intercalated surfactant molecules was below the detection limit of the XRD method. The peaks derived from quartz and illite remained unaltered, indicating that those minerals were not affected by the modification process.
XRD patterns of MBCn intercalates and MBCnA(0.2-3d) samples. Thin lines correspond to pure surfactants or Az.

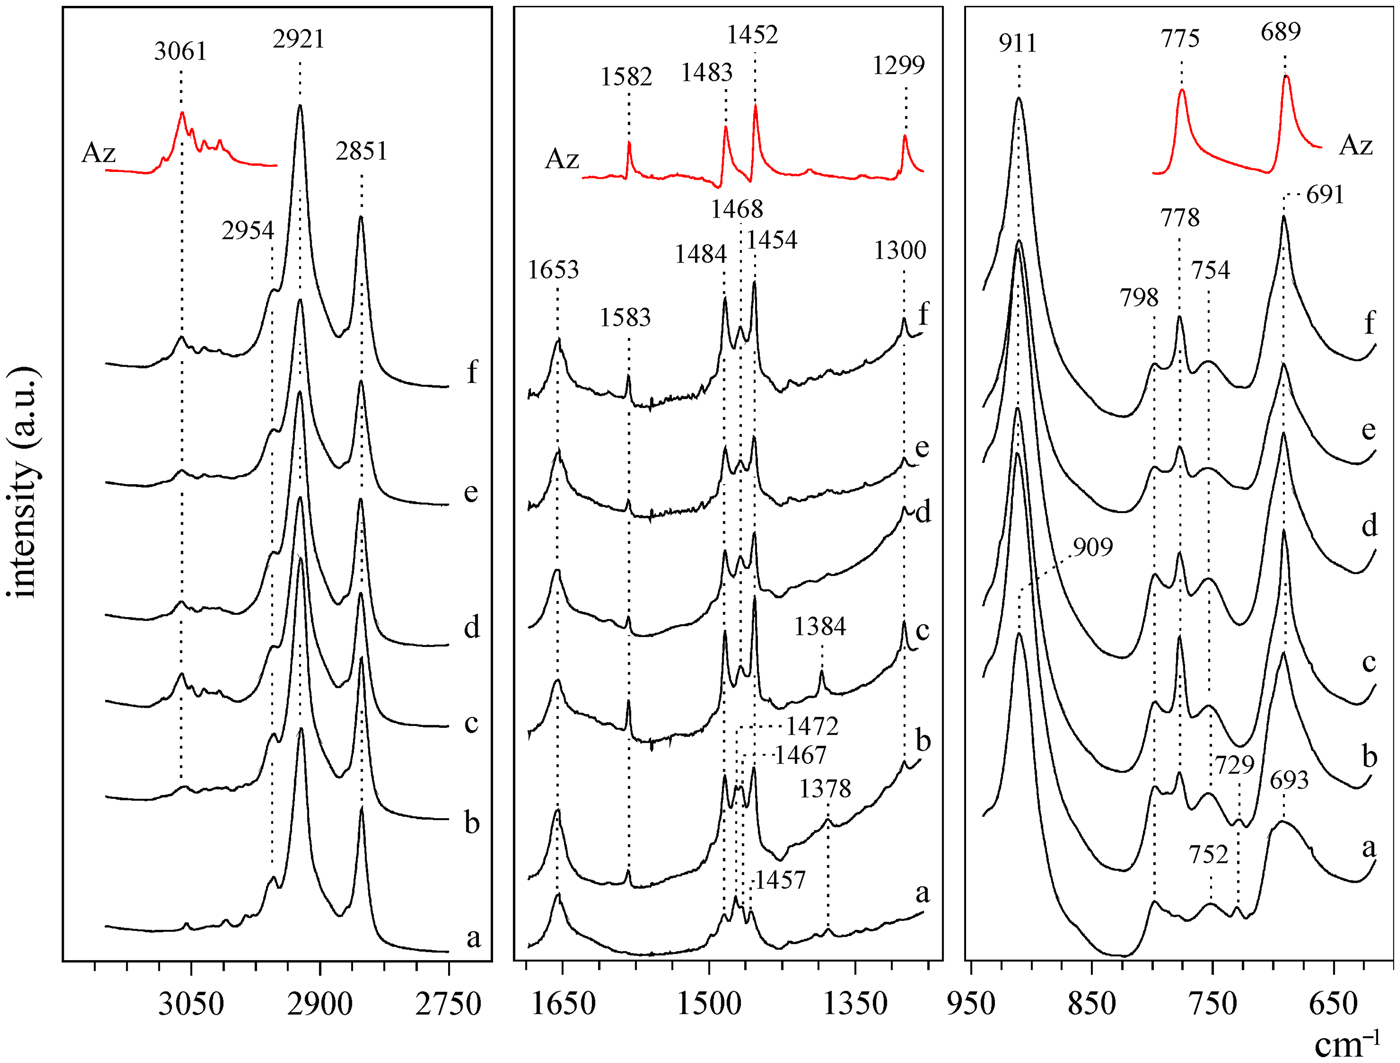
The FTIR spectra (Figs 2, 4) showed new bands characteristic of the organic compounds. Bands in the 3000–2800 cm–1 and 1480–1460 cm–1 regions are derived from the stretching νCH2 and bending δCH2 vibrations in the alkyl chain, respectively (Yariv & Cross, Reference Yariv and Cross2001). The ~2954 cm–1 band was attributed to the terminal CH3 groups of alkyl chains. Vibrations of the aromatic C–C and C–H bonds within the benzyl group yielded new bands mainly in the 3100–3000 cm–1 region. Both the symmetric and asymmetric CH2 stretching bands slightly shifted towards lower energies with increasing alkyl chain length. This was due to the change in the alkyl chain conformation. The contribution of disordered gauche conformers decreased in favour of the ordered all-trans conformers. Fully disordered gauche alkyl chains are present in a more liquid-like environment, and the νasCH2 vibration band is present at ~2928 cm–1. In turn, the fully stretched all-trans alkyl chains are typical of the dense and solid-like environment, and the νasCH2 band is present at ~2917 cm–1 (Vaia et al., Reference Vaia, Teukolsky and Giannelis1994; Madejová et al., Reference Madejová, Sekeráková, Bizovská, Slaný and Jankovič2016). The inner surface hydroxyls bands (3700–3620 cm–1), the δ(Al-OH) band (911–909 cm–1) and the aluminosilicate framework vibration bands (1200–1000 cm–1) were modified due to the interaction of intercalated ammonium salts with the MM layer.
FTIR spectra of: a = MBC16, b = MBC16A(0.2-1d), c = MBC16A(0.2-3d), d = MBC16A(0.2-7d), e = MBC16A(0.5-1d), f = MBC16A(1.0-1d) and pure Az.

According to the CHN elemental analysis, the contents of BC12, BC14 and BC16 compounds were 12.55, 15.99 and 15.54 wt.%, respectively. This corresponds to a molar amount of BCn equal to ~100 mmol per 1 mole of methoxy-kaolinite. These calculated BCn molar amounts were much lower than the theoretical maximal amount of the BCn of 0.46 (Matusik & Kłapyta, Reference Matusik and Kłapyta2013). This indicated that there was no excess of the BCn, which was also confirmed by the lack of XRD reflections attributed to the pure salts within the ~1 wt.% detection limit of XRD analysis.
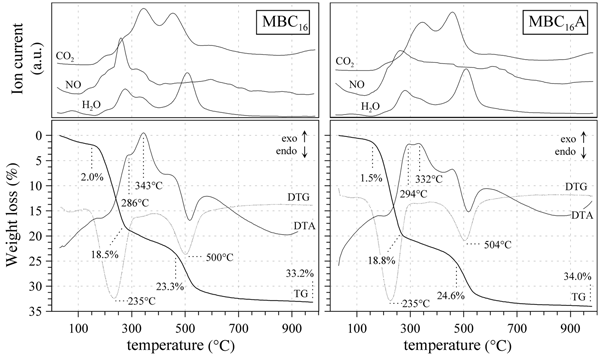
The thermal decomposition of MBCn and MBCnA intercalates was shown using MBC16 and MBC16A(0.2-1d) samples as examples (Fig. 5). Due to the intercalation of mostly hydrophobic organic molecules, the MBC16 sample contained only a small portion of water equal to 2.0 wt.%. The mass decrease associated with removal of the organic salts started at ~180°C and continued up to ~400°C. The evolved gas analysis first indicated the release of H2O and NO, associated with dehydration of the ammonium part of the BCn and disruption of N–C bonds, as was confirmed by exothermic DTA peaks with maxima in the 280–350°C range. Secondly, the CO2 release was associated with combustion of fragmented organics formed after BCn N–C bond disruption.
TG, DTG and DTA curves and the evolved gas analysis (QMS) of MBC16 and MBC16A(0.2-1d) samples.

Effect of the azobenzene intercalation
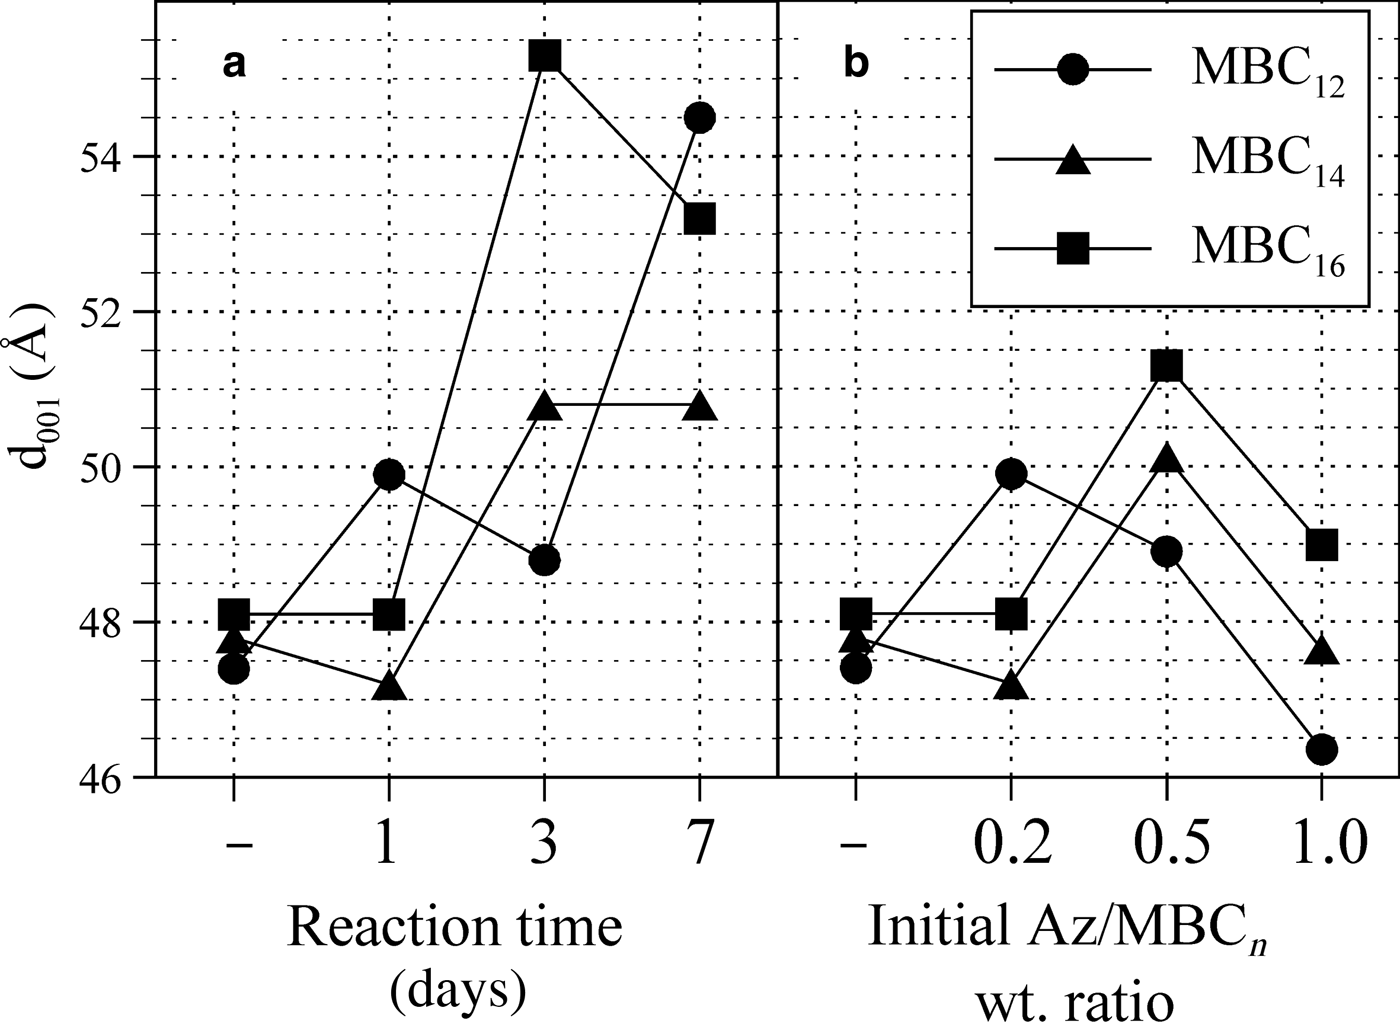
The co-intercalation of Az in vapour form resulted in the orange colouration of the sample and caused further changes to the basal spacing. For most of the Az intercalation conditions (reaction time and Az loading), the basal spacing increased, which suggests that the intercalation process was successful. The relationship between the reaction time with Az and the basal spacing of the resultant material is presented in Fig. 6a. After 1 day of reaction, the basal spacing of the samples did not change, or increased only slightly in the case of the MBC12 sample. After 3 and 7 days of reaction, greater d 001 values were observed as compared to the initial ammonium salt intercalates. The largest d spacing values were obtained for the MBC16A(0.2-3d), MBC16A(0.2-7d) and MBC12(0.2-7d) samples and were equal to 55.3, 53.2 and 54.5 Å, respectively. On the other hand, the initial Az loading had a lower impact on the basal spacing values than the reaction time (Fig. 6b). Increasing the Az/MBCn wt. ratio from 0.2 to 0.5 caused an increase of d 001 values of the MBC16 and MBC14 samples by ~3.0 Å, whereas for the MBC12 sample, the d 001 value decreased. When the Az/MBCn wt. ratio was set to 1.0, the basal spacing values of all of the samples decreased.
Basal spacing values (d 001) of MBCn samples versus time of reaction with Az (a) and initial Az loading (b). The samples marked with ‘–’ are before the reaction with Az.

In all of the samples, only one clear maximum was observed, suggesting homogenous distribution of organic molecules in the interlayer space (Fig. 3). This regular arrangement might be induced by the π–π interactions between rings of BCn salts and Az. Such behaviour was not observed when Az was co-intercalated with alkyltrimethylammonium salts, which do not contain aromatic rings with π electrons (data not shown). The recorded d spacings of basal reflections showed an approximately seven-fold increase of the initial kaolinite d 001 value. These are examples of the largest d values reported for kaolinite. To our knowledge, the only value that was larger, equalling 64.2 Å, was reported in 2005 after intercalation of docosanamine into methoxy-kaolinite (Gardolinski & Lagaly, Reference Gardolinski and Lagaly2005b).
In the FTIR spectra (Fig. 4), the co-intercalated Az led to the appearance of new bands derived from vibrations of the Az molecule. Bands in the 3100–3000 cm–1 region, with the most intense band at 3061 cm–1, correspond to the C–H ring stretching modes. The bands at 778 and 691 cm–1 are due to the C–H ring out-of-plane bending modes, and the C–H ring in-plane bending vibrations were visible at 1299 cm–1. The C–C ring stretching bands appeared at 1583 cm–1 as well as at 1484 and 1454 cm–1 (Webb et al., Reference Webb, Neidlinger and Connoly1986; Tecklenburg et al., Reference Tecklenburg, Kosnak, Bhatnagar and Mohanty1997; Duarte et al., Reference Duarte, Fausto and Reva2014). The positions of these bands were slightly shifted in comparison with bands recorded for the pure Az. This was due to interactions with co-intercalated ammonium salts, which affected the local environment of Az in the interlayer space of methoxy-kaolinite.
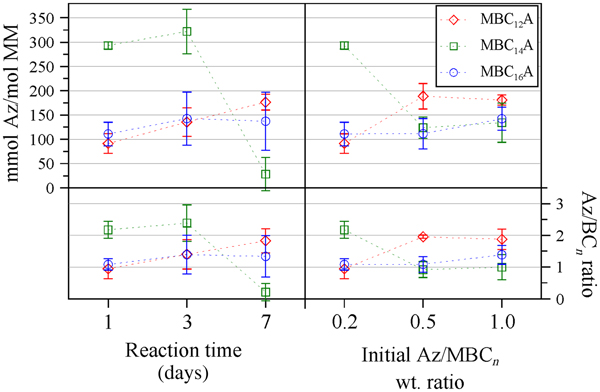
The molar amount of Az, calculated from CHN analysis, differed slightly for samples obtained in various experimental conditions (Fig. 7). For the MBC12 sample, the amount of Az was in the range of 100–200 mmol/mol MM, and it slightly increased both with increasing reaction time and with increasing initial Az loading. Accordingly, the Az/BC12 molar ratio in these samples varied between 1.0 and 2.0. For the MBC14A after 1 and 3 days of reaction, the Az amount was ~300 mmol/mol MM, but after 7 days of reaction, it was much lower, equalling ~50 mmol/mol MM. Similarly, the higher initial Az loading resulted in samples with lower Az molar amounts, equalling ~150 mmol/mol. The Az/BC14 molar ratio varied between 0.3 and 2.7. For the MBC16A samples, the Az amount was roughly constant in various reaction times, equalling ~150 mmol/mol MM. Similar values were obtained for MBC16A samples with higher initial Az loading. The Az/BC16 molar ratio was between 1.1 and 1.7. No clear correlation was observed between the amount of Az in the intercalated samples and their basal spacing values.
Molar amount of Az calculated per 1 mol of MM (upper diagram) and Az/BCn molar ratio (lower diagram) in MBCnA samples obtained in various experimental conditions. Error bars are equal to two standard deviations.

According to the TG analysis (Fig. 5), the water content in the Az-intercalated sample (MBC16A) decreased to only 1.5%. The decomposition of the sample containing co-intercalated Az did not show significant differences as compared to the BC16 intercalate. A change in the profile of the exothermic peaks was observed, with simultaneous broadening of the signal related to NO release. This was due to the higher nitrogen content of the Az. The mass loss associated with organics removal (~17.3%) for the MBC16A sample was less than the amount calculated from the CHN analysis, where the sum of BC16 (15.54%), Az (11.87%) and OCH3 from methoxy-kaolinite (~1.0%) was equal to 28.4%.
Photoinduced reactions
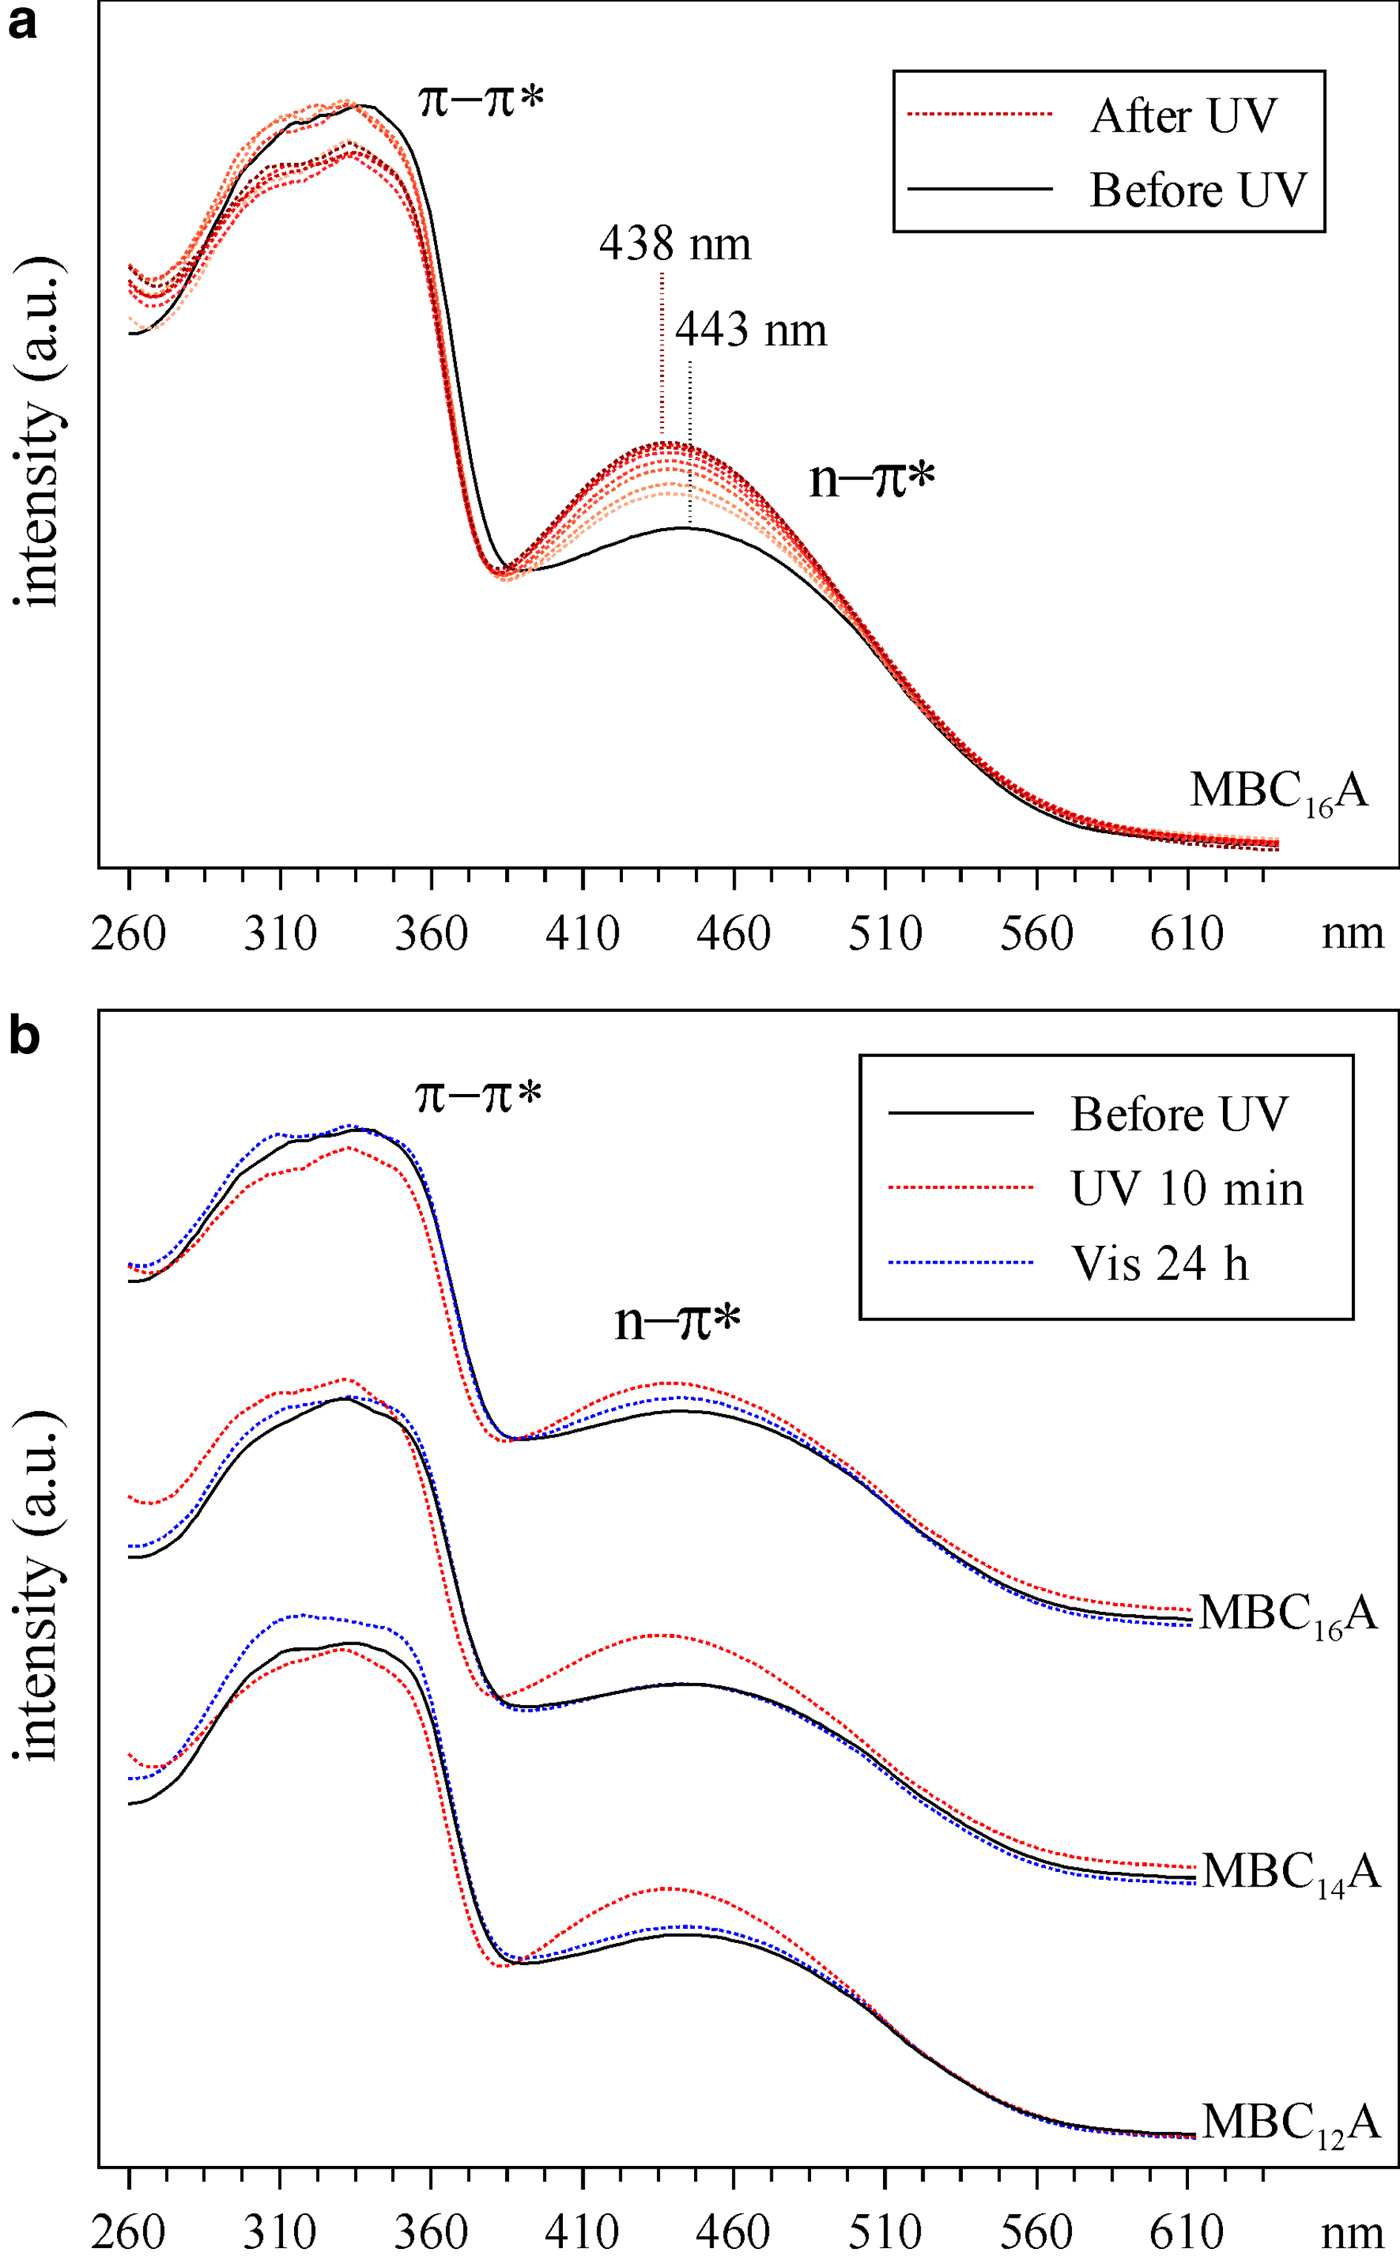
UV irradiation of Az-intercalated samples resulted in significant changes in the UV–Vis and FTIR spectra and the XRD patterns. The UV–Vis spectra of an untreated MBC16A(0.2-3d) sample (Fig. 8a) showed two bands at 337 and 443 nm, attributed to the trans and cis isomers of Az, respectively (Ogawa et al., Reference Ogawa, Hama and Kuroda1999). This suggests that both isomers were present in the tested sample. However, the second band showed very low intensity as compared to the first one; thus, the cis/trans ratio was relatively low. After only 10 minutes of UV irradiation, a significant increase of the cis-Az band was noticed. This indicated that the Az isomerization occurred in the tested samples. The intensity of the band increased gradually with UV irradiation time, and the process was terminated after 90 min of irradiation. This was accompanied by a slight blue shift of the cis-Az band. At the same time, the intensity of the trans-Az band decreased only slightly. Full isomerization of Az was not achieved, probably due to the restricted space in the interlayer. The UV–Vis spectra were recovered after 24 h of sample exposure to the Vis light (Fig. 8b).
UV–Vis spectra of: (a) MBC16A(0.2-3d) sample irradiated with UV in 10 min time intervals, starting from 10 min up to 90 min; (b) MBCnA(0.2-3d) samples irradiated with UV for 10 min and after 24 h of exposure to Vis light.

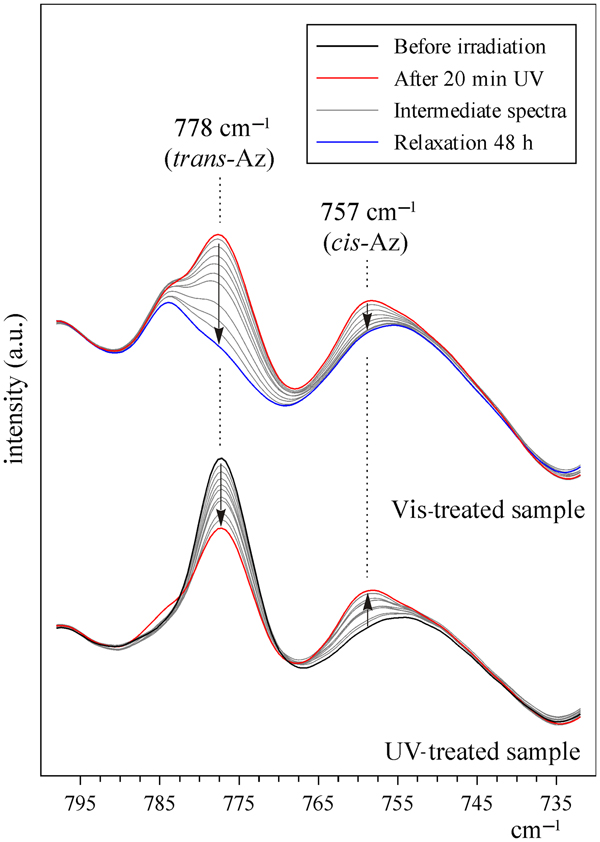
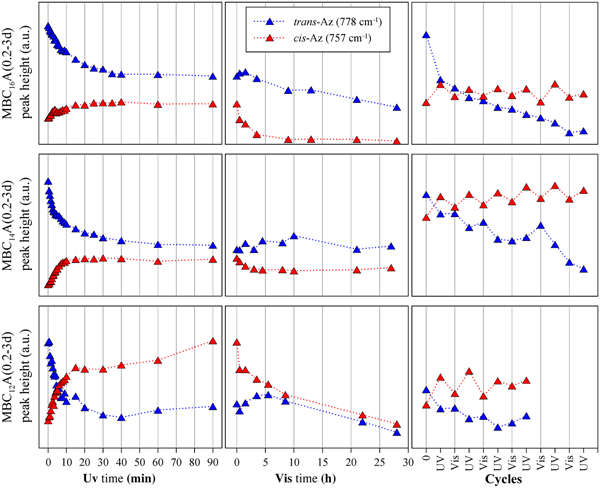
A detailed analysis of Az isomerization was performed with FTIR spectroscopy. A sharp band appeared at 757 cm–1 after UV irradiation (Fig. 9). The band is derived from the interactions between the C–H groups belonging to the opposite aromatic rings, which are closer to each other in the cis form of Az (Webb et al., Reference Webb, Neidlinger and Connoly1986). At the same time, the 778 cm–1 band, which is attributed to the trans-Az, decreased in intensity, but was still present even after a long exposure to the UV radiation. The FTIR spectra were collected over short time intervals (0.5, 1.0 and 5.0 min) during the UV irradiation in order to determine the rate of the Az isomerization. The intensities of the 778 and 757 cm–1 bands were determined after band decomposition using the Omnic software. The data obtained were plotted versus UV irradiation time and are presented in Fig. 10 (first column). After only 30 s, a simultaneous increase of the 757 cm–1 band and decrease of the 788 cm–1 band was visible for all of the samples. The process continued in time and was terminated after ~30–40 min. In addition, the reaction rate was higher for the materials intercalated with surfactant having shorter aliphatic chains (reaction rate: MBC16A < MBC14A < MBC12A). This suggests that the smaller surfactant molecule of lower molecular mass in the interlayer space allowed faster transformation of Az molecules from trans to cis forms. This might be related to the larger space available in the interlayer and thus the lower steric hindrance effect, as well as less pronounced hydrophobic attraction between Az and surfactant molecules.
FTIR spectra of MBC16A(0.2-3d) sample irradiated with UV in time intervals of 0.5, 1.0 and 5.0 min, starting from 0.5 min up to 20 min (lower spectra); and treated with Vis light in time intervals of 0.5–8.0 h, starting from 0.5 h up to 48 h (upper spectra).

Influence of UV irradiation, Vis irradiation and alternating UV and Vis treatment on the intensities of 788 and 757 cm–1 bands.

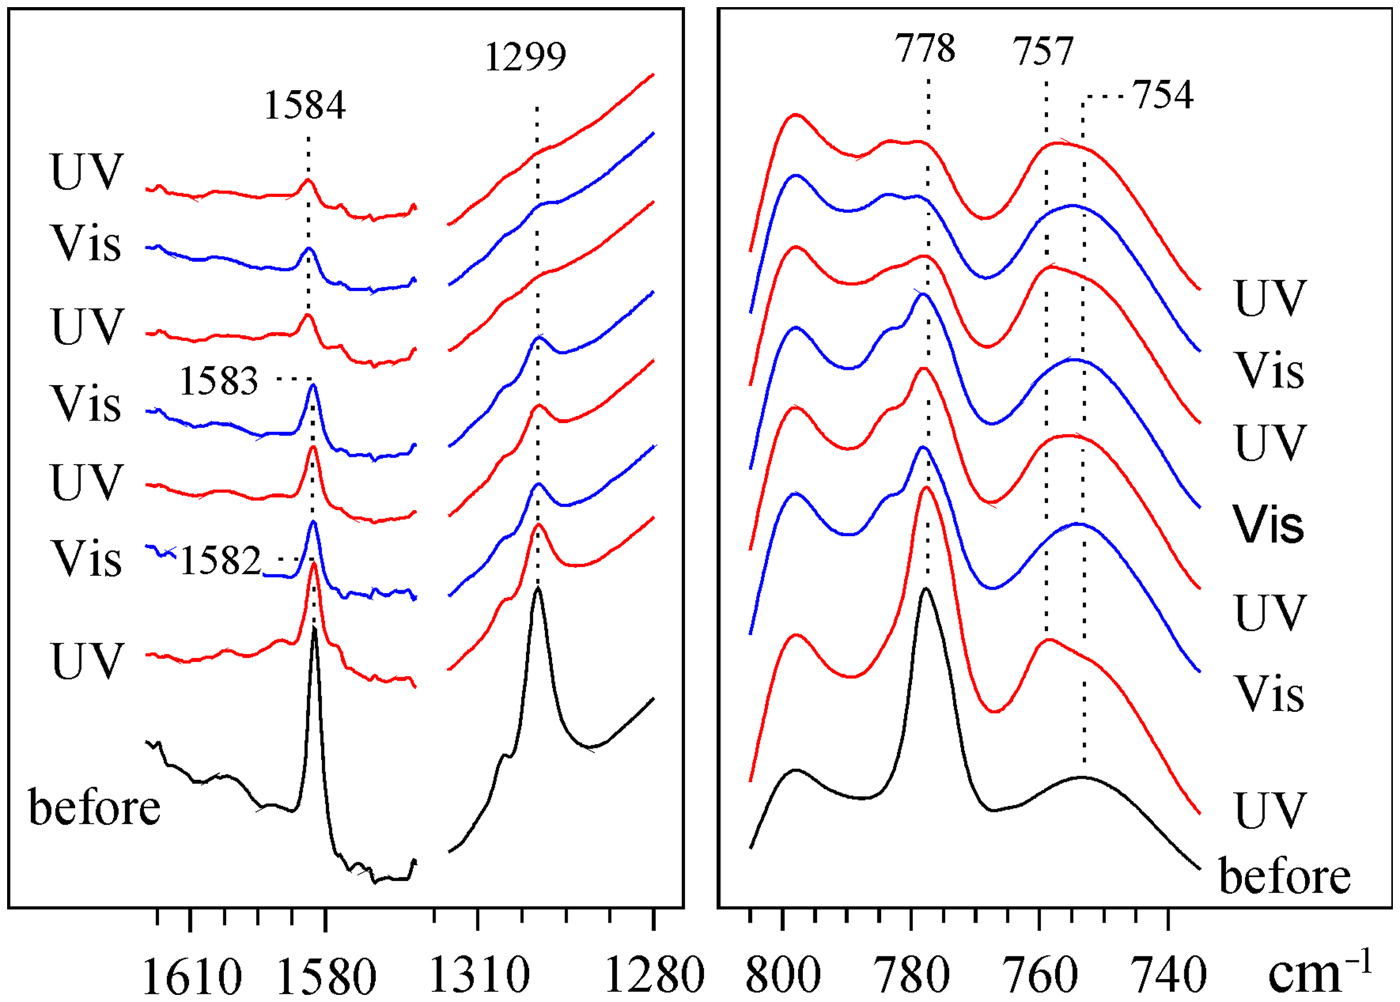
Similarly, the FTIR spectra were collected and analysed during sample relaxation with Vis light (Figs 9, 10 (middle column)). The time needed for cis to trans relaxation was much longer than for the trans to cis conversion. The decrease of the 757 cm–1 band was clearly visible; however, the intensity of the 788 cm–1 band increased only within the first 2–5 h. After that, both bands decreased gradually until they were no longer visible in the spectra after ~30 h. On the other hand, the FTIR investigation revealed that the Az isomerization occurred regularly and reversibly upon several cycles of alternating UV and Vis irradiation (Fig. 10, third column). This was particularly visible for the 757 cm–1 band, which appeared after each UV treatment and decreased again after subsequent Vis radiation. The 788 cm–1 band showed lower intensity after each cycle, and eventually both trans and cis bands were barely visible after the sixth cycle in the case of the BC14 and BC16 intercalates and after the fourth cycle in the case of the BC12 intercalate (Figs 10, 11). At the same time, a gradual intensity decrease of other Az bands (1583 and 1299 cm–1) was also observed, suggesting that the Az molecules undergo evaporation after a long exposure to Vis light, as well as under multiple trans–cis conversions. This is because they were loosely intercalated in the interlayer space and exclusively stabilized by hydrophobic interactions with the alkylammonium surfactants. Moreover, the type of accompanying surfactant influenced significantly the behaviour of Az-intercalated materials. The smaller BC12 molecules enabled faster and more efficient isomerization. However, in this case, the Az molecules evaporated more easily.
Influence of alternating UV and Vis irradiation on the FTIR spectra of the MBC16A(0.2-3d) sample.

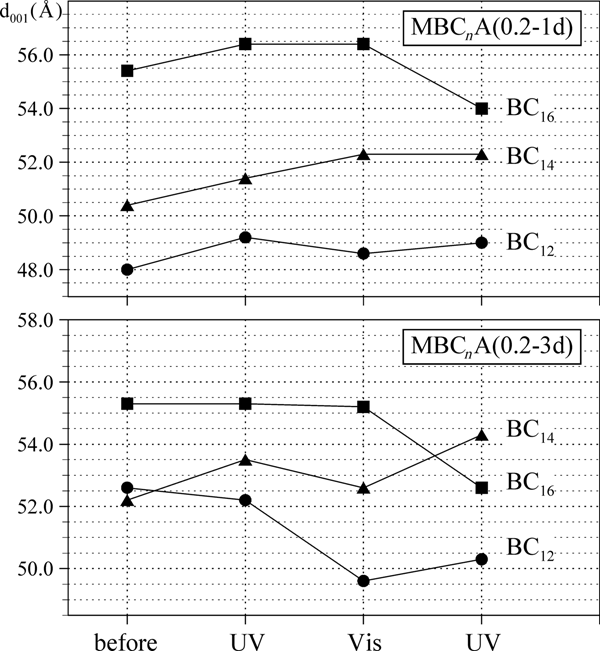
The alternating UV and Vis exposure resulted in very small and irregular basal spacing shifts of Az-intercalated kaolinite samples (Fig. 12). This was probably because the interlayer environment was highly disordered and liquid-like. The alkyl chains had a large number of gauche kinks and were arranged irregularly, as was confirmed by FTIR spectroscopy. The Az molecules were dissolved within the alkylammonium molecules, also in a disordered manner. As a consequence, the basal spacing was influenced by random movements of the alkyl chains, induced by the Az trans–cis shifts.
The d 001 value shifts upon alternating UV and Vis radiation.

Conclusions
For the first time, intercalates combining the kaolinite mineral with photoactive molecules were prepared, and the materials obtained showed photochromic behaviour. The modification procedure involved preparing a methoxy-kaolinite precursor, followed by pre-intercalation with benzylalkylammonium surfactants and then intercalation of Az. The obtained materials showed large d 001 values in the range 45–55 Å. The UV–Vis and FTIR spectra collected after alternating UV and Vis radiation indicated that the intercalated Az molecules underwent regular and reversible trans–cis conformational transitions. Multiple cycles of UV and Vis radiation, as well as a long exposure to the Vis radiation, caused gradual evaporation of Az molecules. The Az isomerization behaviour was dependent on the type of co-intercalated surfactant: the smaller surfactant molecules enabled faster trans to cis isomerization due to lower steric effects. Simultaneously, the basal spacing values of the materials were slightly modified. However, these structural shifts were very limited and irregular.
Author ORCIDs
Anna Koteja, 0000-0002-4959-2372.
Acknowledgements
The authors are grateful to A. Gaweł for performing the XRD analysis and for valuable comments on the results, and to L. Chmielarz and M. Radko for providing access to the UV–Vis spectrophotometer and for help with the analysis. This project was supported by the Polish National Science Centre under the research project awarded by the decision no. 2014/13/B/ST10/01326.