INTRODUCTION
Many studies have assessed the effectiveness of marine protected areas, including different management forms such as no-take zones and partial protection, generally finding that marine protected areas are effective in maintaining fish density and biomass (Sciberras et al., Reference Sciberras, Jenkins, Kaiser, Hawkins and Pullin2013). However, assessments rarely consider whether varying fish behaviours across the study area may bias the results of their survey techniques (Kulbicki, Reference Kulbicki1998, Feary et al., Reference Feary, Cinner, Graham and Januchowski-Hartley2011). Fish behaviour is known to be impacted by previous exposure to humans (Januchowski-Hartley et al., Reference Januchowski-Hartley, Graham, Cinner and Russ2015), yet locations with direct human interactions with the marine environment tend to be those reef managers are most interested in assessing. Even on a local scale, the exposure of fish communities to these effects can be highly variable along natural gradients such as depth. With much recent interest in the threats faced by mesophotic coral ecosystems (MCEs; reefs 30–150 m depth) (Andradi-Brown et al., Reference Andradi-Brown, Laverick, Bejarano, Bridge, Colin, Eyal, Jones, Kahng, Reed, Smith, Spalding, Weil, Wood, Baker, Puglise and Harris2016a), and whether they act as refuges from fishing (Bejarano et al., Reference Bejarano, Appeldoorn and Nemeth2014; Lindfield et al., Reference Lindfield, Harvey, Halford and McIlwain2016), gaining a better understanding of fish behavioural survey biases across depth gradients is crucial.
While bias in some form is an unavoidable symptom of all survey methods, stakeholders rely heavily on data pertaining to fish populations and their responses to management interventions to inform decision-making. On tropical coral reefs this tends to involve baseline fish community data collected using underwater visual census (UVC) by surveyors in the water (English et al., Reference English, Wilkinson and Baker1997; Sale, Reference Sale1997; Mapstone & Ayling, Reference Mapstone and Ayling1998). In many cases, to conduct UVC open-circuit (OC) scuba divers swim along a fixed-length transect recording individuals of all (or target) fish species, additionally estimating lengths in some cases (English et al., Reference English, Wilkinson and Baker1997). As a result of concerns about repeatability between surveyors because of observer bias (Thompson & Mapstone, Reference Thompson and Mapstone1997), video surveys have begun to replace in-water observations for many surveys (Mallet & Pelletier, Reference Mallet and Pelletier2014). While the use of video removes many errors associated with in-water data collection, the differing response behaviours of reef fish to diver presence raises new concerns (Chapman et al., Reference Chapman, Johnstone, Dunn and Creasey1974; Cole, Reference Cole1994; Watson & Harvey, Reference Watson and Harvey2007). The operation and bubble release of traditional OC scuba generates high levels of noise at the low frequencies fish are most sensitive to (Radford et al., Reference Radford, Jeffs, Tindle, Cole and Montgomery2005). This has led to the suggestion fish may be able to audibly detect diver presence before divers can visually identify fish (Radford et al., Reference Radford, Jeffs, Tindle, Cole and Montgomery2005). This potentially could allow fish to avoid areas of reef with divers present and so remain undetected, or aggregate around divers in the water from a larger reef area enhancing fish abundance and biomass estimates.
Despite these known effects, few UVC studies acknowledge the bias that OC scuba is likely to cause to their results (Dickens et al., Reference Dickens, Goatley, Tanner and Bellwood2011), instead most biases are assumed to be consistent across survey sites and thus mitigated. However, in areas with regular spearfishing, flight initiation distance (FID; the minimum distance a diver can approach a fish before it flees) of many fish families have repeatedly been found to be higher than in protected areas (Gotanda et al., Reference Gotanda, Turgeon and Kramer2009; Januchowski-Hartley et al., Reference Januchowski-Hartley, Graham, Feary, Morove and Cinner2011, Reference Januchowski-Hartley, Cinner and Graham2014). Therefore, despite standardized methodologies, varying fishing pressure may bias survey results and artificially inflate the apparent effectiveness of marine protected areas (Lindfield et al., Reference Lindfield, Harvey, McIlwain and Halford2014a). For example, Lindfield et al. (Reference Lindfield, Harvey, McIlwain and Halford2014a) used diver-operated stereo-video systems to assess how close they could approach fish when surveying using OC vs CCR. They observed that fish species targeted by spearfishers avoid OC divers, and this was significant enough to reduce abundance and biomass estimates compared with surveys conducted in the same location using CCR. Even within protected areas, other more subtle effects may significantly bias results, for example fish habituation to the presence of divers in areas with intensive dive tourism (Titus et al., Reference Titus, Daly and Exton2015), which can be enhanced when divers feed fish populations (Cole, Reference Cole1994), or the presence of fish ontogenetic migrations, with more mature and thus larger individuals found at greater depths (Grol et al., Reference Grol, Rypel and Nagelkerken2014). Many fish families exhibit greater FID in larger individuals than smaller individuals (Gotanda et al., Reference Gotanda, Turgeon and Kramer2009; Januchowski-Hartley et al., Reference Januchowski-Hartley, Graham, Feary, Morove and Cinner2011), suggesting for species with well-defined ontogenetic migrations, divers might be able to approach individuals more closely on shallow reefs than deeper reefs.
The effects of recreational dive tourism are highly depth biased, being typically limited to a maximum depth of 30 m, and in reality generally much shallower because of training limitations and no-decompression limits. This subsequently skews the opportunity for fish habituation to OC divers towards shallower reefs. Even when surveying across depth gradients, the increased distance for bubbles to travel to the surface when completing deeper transects is likely to produce greater total noise (Radford et al., Reference Radford, Jeffs, Tindle, Cole and Montgomery2005), and thus impacts on fish behaviour, than shallower transects, leading to unintended bias in the data. Recent advances have made technical diving more accessible, including the emergence of commercially available Closed-Circuit Rebreathers (CCR). CCR systems recycle gas rather than releasing bubbles into the water column, see Sieber & Pyle (Reference Sieber and Pyle2010) for a detailed system overview, and are therefore significantly quieter than their OC counterparts. When it comes to their impact on fish behaviour, fish can detect the sounds of OC divers >200 m away over a range of typical background noise levels, while CCR divers can only be detected between 0.3–15.9 m away depending on background underwater noise (Radford et al., Reference Radford, Jeffs, Tindle, Cole and Montgomery2005).
It therefore seems likely that some patterns detected in fish surveys using OC divers across depth gradients may be influenced by fish behavioural biases that change with depth. Yet no studies have directly investigated how detection bias in OC scuba changes across the depth gradient. To investigate this question we conducted fish community assessments across a shallow to upper-mesophotic reef gradient at three sites in the Bay Islands Marine Park, Utila, Honduras using OC scuba and CCR. By conducting surveys using CCR, fish disturbance effects caused by bubbles and sounds of OC scuba regulators were absent, reducing these biases on fish community assessment. We investigated whether depth interacted with the differences observed between the two methods. As the shallow reefs of Utila are heavily dived by recreational divers, mesophotic fish populations are likely to be less habituated to diver presence than shallow reef fish, suggesting that individuals could be more wary of OC divers on MCEs than shallow reefs.
MATERIALS AND METHODS
Study sites
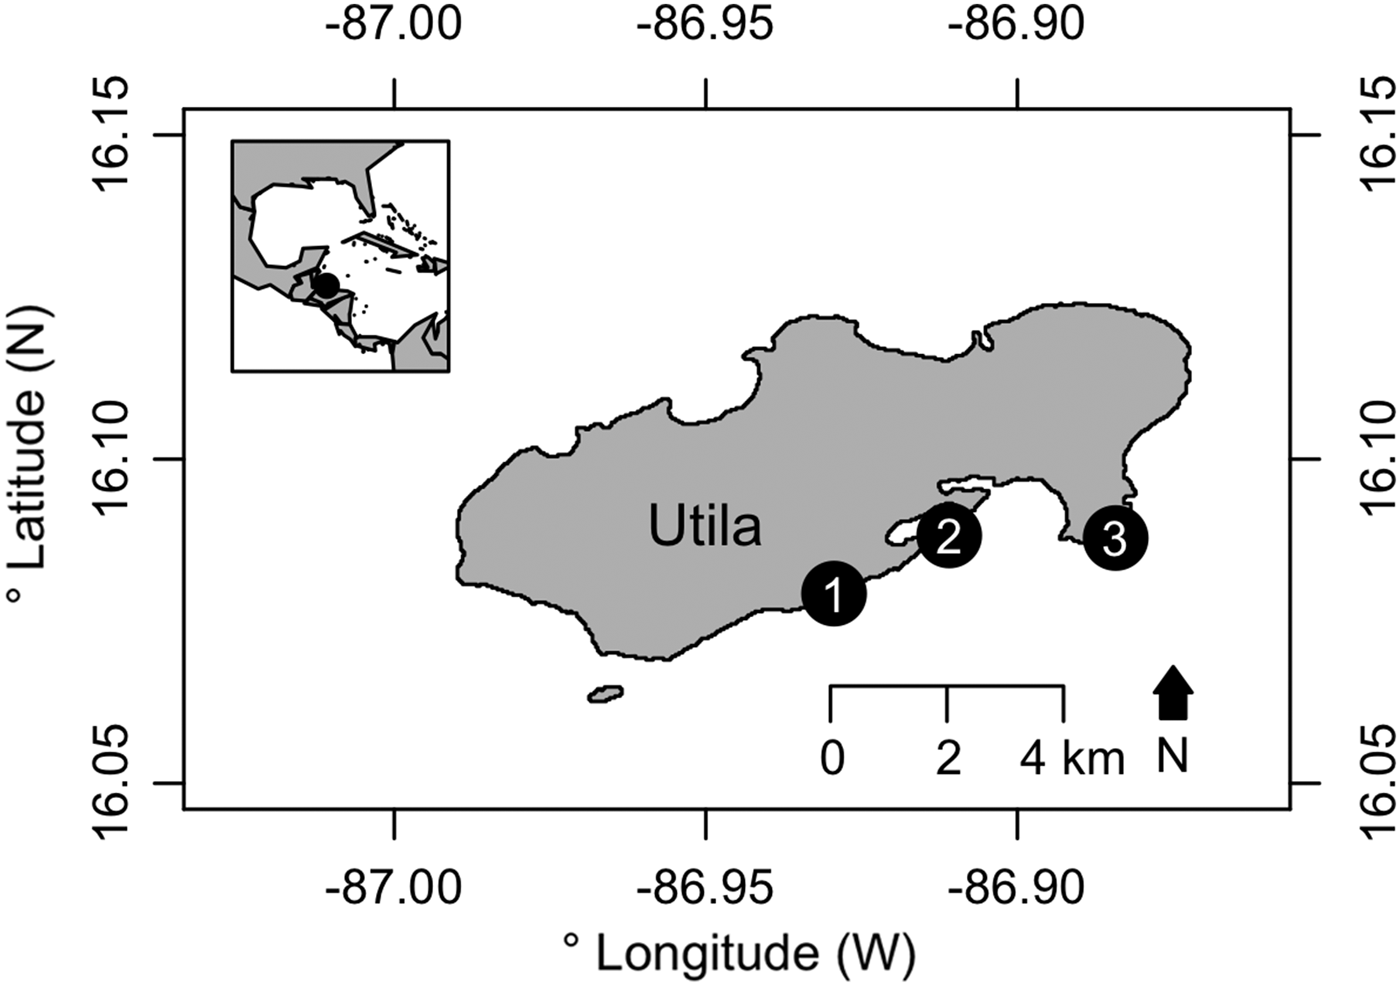
Surveys were conducted on the south shore of Utila, Bay Islands, Honduras (Figure 1). Utila is located ~29 km off the Caribbean coast of Honduras, forming the southern extent of the Mesoamerican Barrier Reef (Harborne et al., Reference Harborne, Afzal and Andrews2001). While Utila is within the Bay Islands Marine Park, fishing is allowed on the reefs, with the majority of fishing, including at our study sites, carried out by handlines targeting Lutjanidae and Serranidae (Gobert et al., Reference Gobert, Berthou, Lopez, Lespagnol, Turcios, Macabiau and Portillo2005; Box & Canty, Reference Box and Canty2011). Historically fishers carried spears to opportunistically shoot large fish they encountered, however, spearfishing has been banned from the island's fringing reefs since 2004 (Kramer et al., Reference Kramer, McField, Filip, Drysdale, Flores, Giró and Pott2015). Recently tourism has replaced fishing as the dominant source of income (Cronk & Steadman, Reference Cronk, Steadman, Cohen and Dannhaeuser2002; Doiron & Weissenberger, Reference Doiron and Weissenberger2014), primarily consisting of recreational diving (Doiron & Weissenberger, Reference Doiron and Weissenberger2014), with >10 dive centres operational on Utila and tens of thousands of recreational dives completed annually. Therefore, while our study sites are fished at a relatively low level, they are very heavily dived by recreational divers.
Map of Utila with the three survey sites marked. (1) Little Bight, (2) Coral View and (3) Rocky Point. Inset map indicates location of Utila relative to the western Atlantic region.

Shallow reefs on the south shore of Utila are a spur and groove system, which transition into a mesophotic patch reef system at ~30–40 m depth. Therefore shallow reefs exist as a continuous reef system with ~92% hard substratum cover, while MCEs are broken by areas of sand, so only have ~20% hard substratum cover (Andradi-Brown et al., Reference Andradi-Brown, Gress, Wright, Exton and Rogers2016b). Reef fish abundance and biomass patterns across this shallow to upper-MCE depth gradient on the south shore of Utila have previously been studied, finding that for the majority of species both abundance and biomass decline with increased depth (Andradi-Brown et al., Reference Andradi-Brown, Gress, Wright, Exton and Rogers2016b).
Video surveys of fish communities
Fish community surveys were conducted along 50 m long by 5 m wide transects using a diver operated stereo-video system (DOV), made up of two Canon HFS21 video cameras (see Andradi-Brown et al., Reference Andradi-Brown, Gress, Wright, Exton and Rogers2016b). Cameras were separated by 0.75 m with convergence angles of ~8°. By recording with two cameras simultaneously, DOV allows post-dive analysis of fish abundance and accurate measurements of body length and distance from camera, all within automatically defined transect boundaries (Harvey et al., Reference Harvey, Fletcher and Shortis2001, Reference Harvey, Fletcher, Shortis and Kendrick2004). Four replicate transects separated by 10 m were conducted following the reef contour at four depths (5, 15, 25, 40 m) at three sites, giving 48 unique transect locations across all sites and depths (Figure 1). Each transect was surveyed twice, with each survey taking place on different days, once using OC scuba equipment and once using CCR, giving 96 transect surveys conducted in total. The order of whether to survey a transect by CCR or OC first was randomized for each individual transect. In no cases were all four transects at the same depth at a site surveyed by the same dive gear type within the same day. All survey sites had fixed/marked start locations for each transect allowing the same area of reef to be surveyed by both methods. All transects were conducted during daytime between the hours of 8 am and 4 pm during July–September 2015. Transects were surveyed by a DOV operator using OC or CCR followed by a second diver laying a transect tape to measure distance. To minimize disturbance to the fish community prior to recording, a 60 m transect tape was used, with the cameras set recording and synchronized with a hand torch before swimming 10 m along the reef with the cameras filming directly downwards below the diver. After the DOV operator had swum 10 m, the transect diver signalled for them to lift the cameras and begin the transect proper, signalling again once the full 50 m had been swum. Cameras were held to film looking forward along the reef following the depth contour. Each transect took ~3 min to film. CCR surveys were conducted using a mixture of Hollis Prism 2 (Hollis, San Leandro, CA, USA), rEvo X micro (rEvo rebreathers, Bruges, Belgium), or Sentinel (Vobster Marine Systems, Somerset, UK) rebreathers.
Video analysis
Transect videos were blinded to survey method and analysed with EventMeasure software v3.51 (SeaGIS, Melbourne, Australia). Transect boundaries were defined as 2.5 m either side of the transect giving a 5 × 50 m survey area for each transect. All fish were identified to species level or the lowest taxonomic level possible if not identifiable to species. If visible on both cameras, fish length and distance from cameras was recorded using the built in measurement tools in EventMeasure. Measurements were taken when each individual fish was at its closest to the DOV system, thus recording the minimum approach distance (MAD; the minimum distance the DOV operator could approach the fish before it moved away). Where MADs were below the minimum distance needed to appear simultaneously on both cameras, we recorded the fish at the closest point while visible on both cameras. The exact minimum distance for a fish to appear on both cameras was variable based on how far from the centre of the transect the fish was located. For a fish central to the transect, the minimum MAD that could be recorded is ~50 cm. All visible fish in front of the cameras, regardless of distance away, and within the 5 m transect width were recorded at the point they were closest to the DOV. Fish lengths were converted to biomass using length-weight parameters for each species from Fishbase (Froese & Pauly, 2016). Where fish appeared on the transect but were never visible on both cameras simultaneously, fish lengths and MAD were unable to be recorded and thus these were only included in abundance and biomass analysis. To estimate biomass for these fish, they were first allocated the mean length recorded for that species from other individuals recorded on the transect and this estimate then converted to biomass. Raw data is available from figshare (http://dx.doi.org/10.6084/m9.figshare.5072329). Data analyses were conducted at the family level. However, because of the historical large bodied grouper fishery around Utila we split the family Serranidae into the two sub-families: Epinephelinae and Serraninae. In addition, because of the differing ecological roles on Caribbean reefs, we considered the Scaridae sub-family separately from all other members of the Labridae family during analysis.
Abundance and biomass analysis
As a result of the non-normal nature of fish abundance data we used permutational multivariate analyses of variance (PERMANOVA) because PERMANOVA has fewer assumptions about the distribution of the data (Anderson et al., Reference Anderson, Gorley and Clarke2008). A PERMANOVA was run for each fish family individually based on a Bray–Curtis dissimilarity matrix constructed with the square rooted abundance data or biomass data, testing for differences between sites, depth and the site:depth interaction. Bray–Curtis was used so common absences of fish families from transects do not influence the results (Clarke et al., Reference Clarke, Somerfield and Chapman2006), because we had many transects where a fish family was not recorded by either CCR or OC. However, Bray–Curtis dissimilarities are undefined when transects contain no individuals at all. To address this, we included an additional dummy family given an abundance or biomass of 1 for all transects alongside the family of interest in all PERMANOVAs (Clarke et al., Reference Clarke, Somerfield and Chapman2006). We restricted analysis to fish families that appeared on >50 transect surveys (out of 96 total) across all sites and depths. All PERMANOVAs were conducted in R (R Core Team, 2013) using the ‘adonis’ function in the package vegan (Oksanen et al., Reference Oksanen, Guillaume Blanchet, Kindt, Legendre, Minchin, O’Hara, Simpson, Solums, Stevens and Wagner2013) and run for 99,999 permutations.
Minimum Approach Distance (MAD) analysis
To investigate MAD for each fish family we used analysis of covariance (ANCOVA). Differences in MAD between methods are most likely to affect the detection of fish furthest away from the divers. To identify whether differences in MAD potentially could alter fish detection ability over the distances visually surveyed by DOV, we calculated the 90th quantile of MAD for each fish family by transect for families that were detected on >50 transects. To meet normality and homogeneity assumptions we natural log-transformed raw MAD data. We tested the effects of site (categorical), depth (continuous) and method (categorical) on MAD. For significant explanatory variables we used the model to generate predictions based on altering the significant explanatory variable, and then back-transformed log(MAD) predictions to see the effect on MAD.
As individual fish body size has been show to alter fish behavioural responses to divers, we also analysed our data using an ANCOVA without grouping fish family data by transect. This allowed four explanatory variables: site and survey method (categorical), and depth and fish length (continuous), and was done for all fish families with ≥30 individual MAD and fish length observations for both CCR and OC (giving a minimum total number of observations of 60). We also tested for interactions between survey method, depth and fish length on MAD. ANCOVA models were fitted in base R using the stats package (R Core Team, 2013). The function ‘step’ was used to simplify models starting with the full model with all interactions, and iteratively removing one variable or interaction at a time from the model starting with the most complex. If removing a variable or interaction resulted in a lower model Akaike information criterion (AIC) the variable or interaction was dropped, if not it was replaced and another variable or interaction tested. Where significant two-way interactions were identified we examined them while controlling for the other explanatory variables by following a partial correlation approach (Brown & Hendrix, Reference Brown and Hendrix2014). This involved plotting relationships between the centred residuals from linear models of the variables of interest with the other explanatory variables. During model checking two Lachnolaimus maximus records were removed as they had an undue influence on the fitted model. Lachnolaimus maximus is a large-bodied Labridae species and these two records, the only times we recorded this species, were both of individual fish substantially larger than any other Labridae in our dataset. With these two individuals removed the remaining 379 Labridae MAD and length measurements met the model assumptions.
RESULTS
Abundance
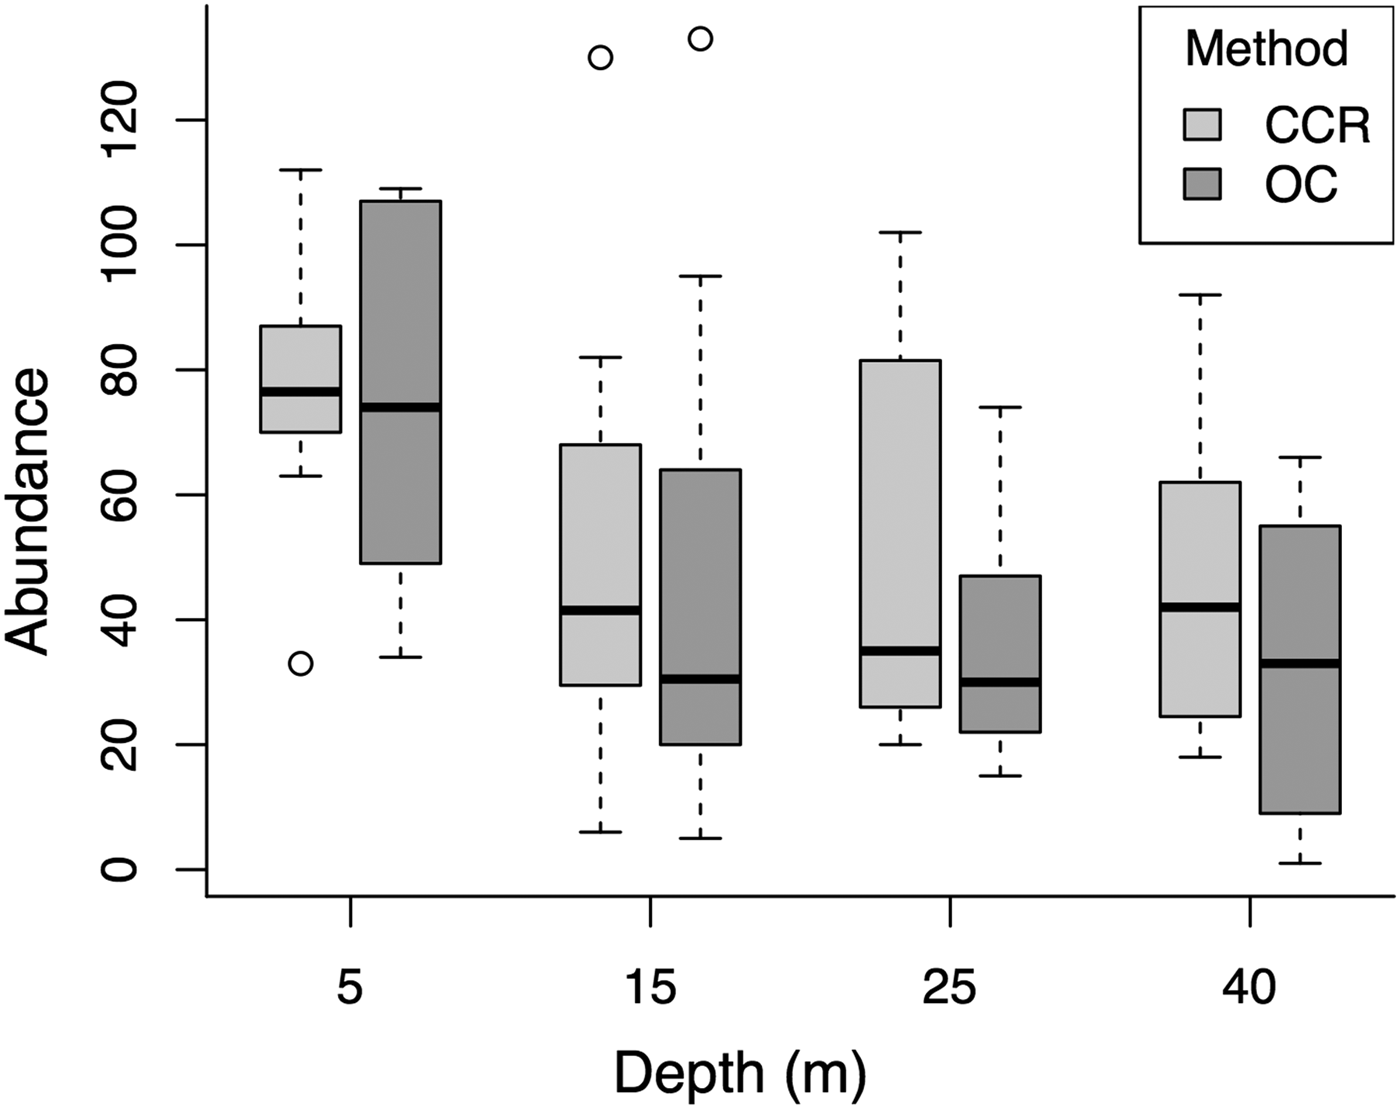
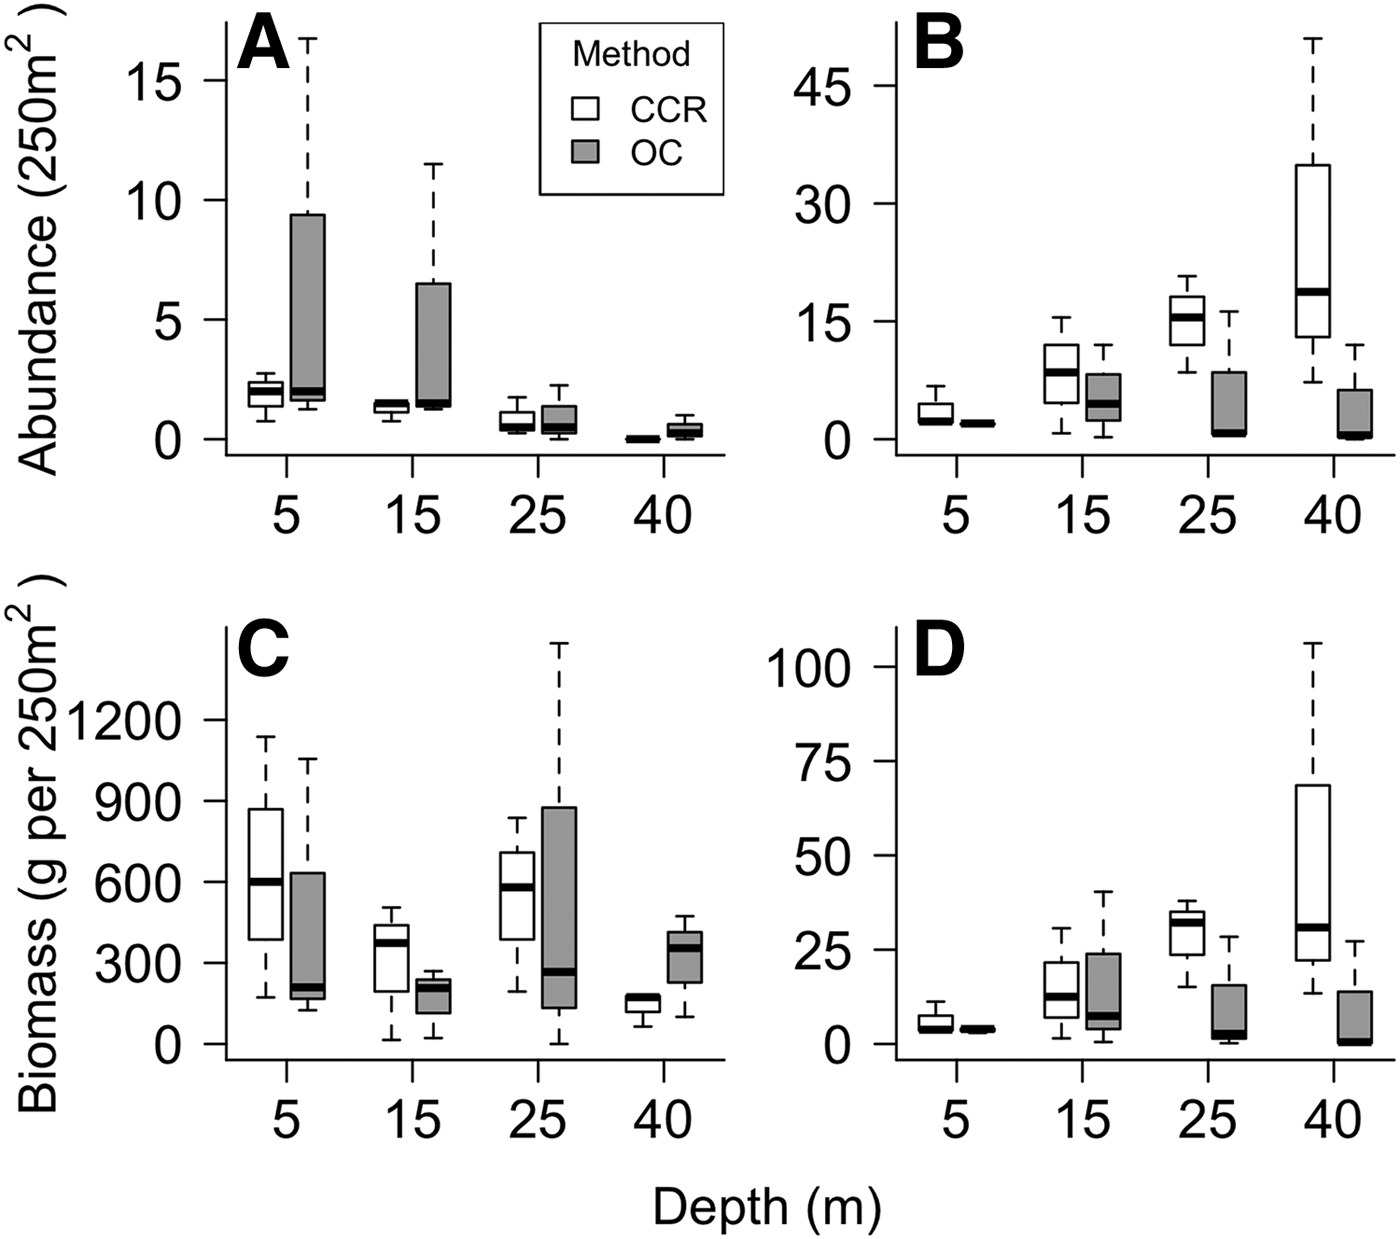
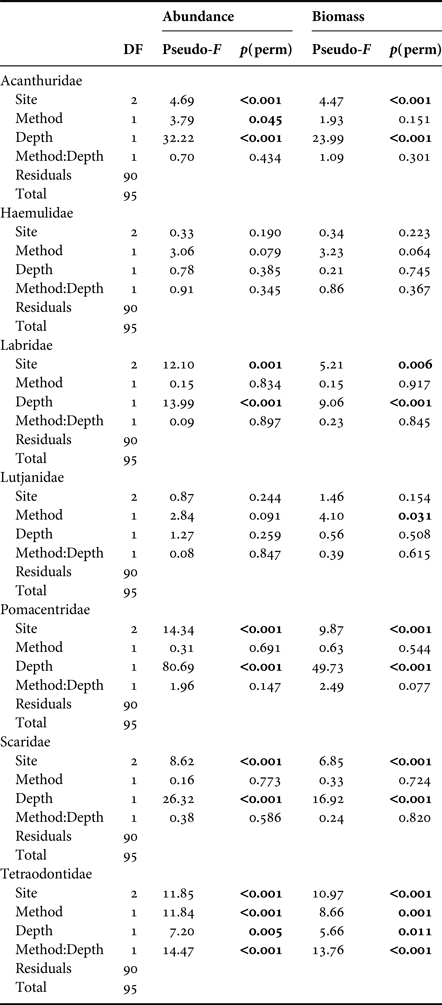
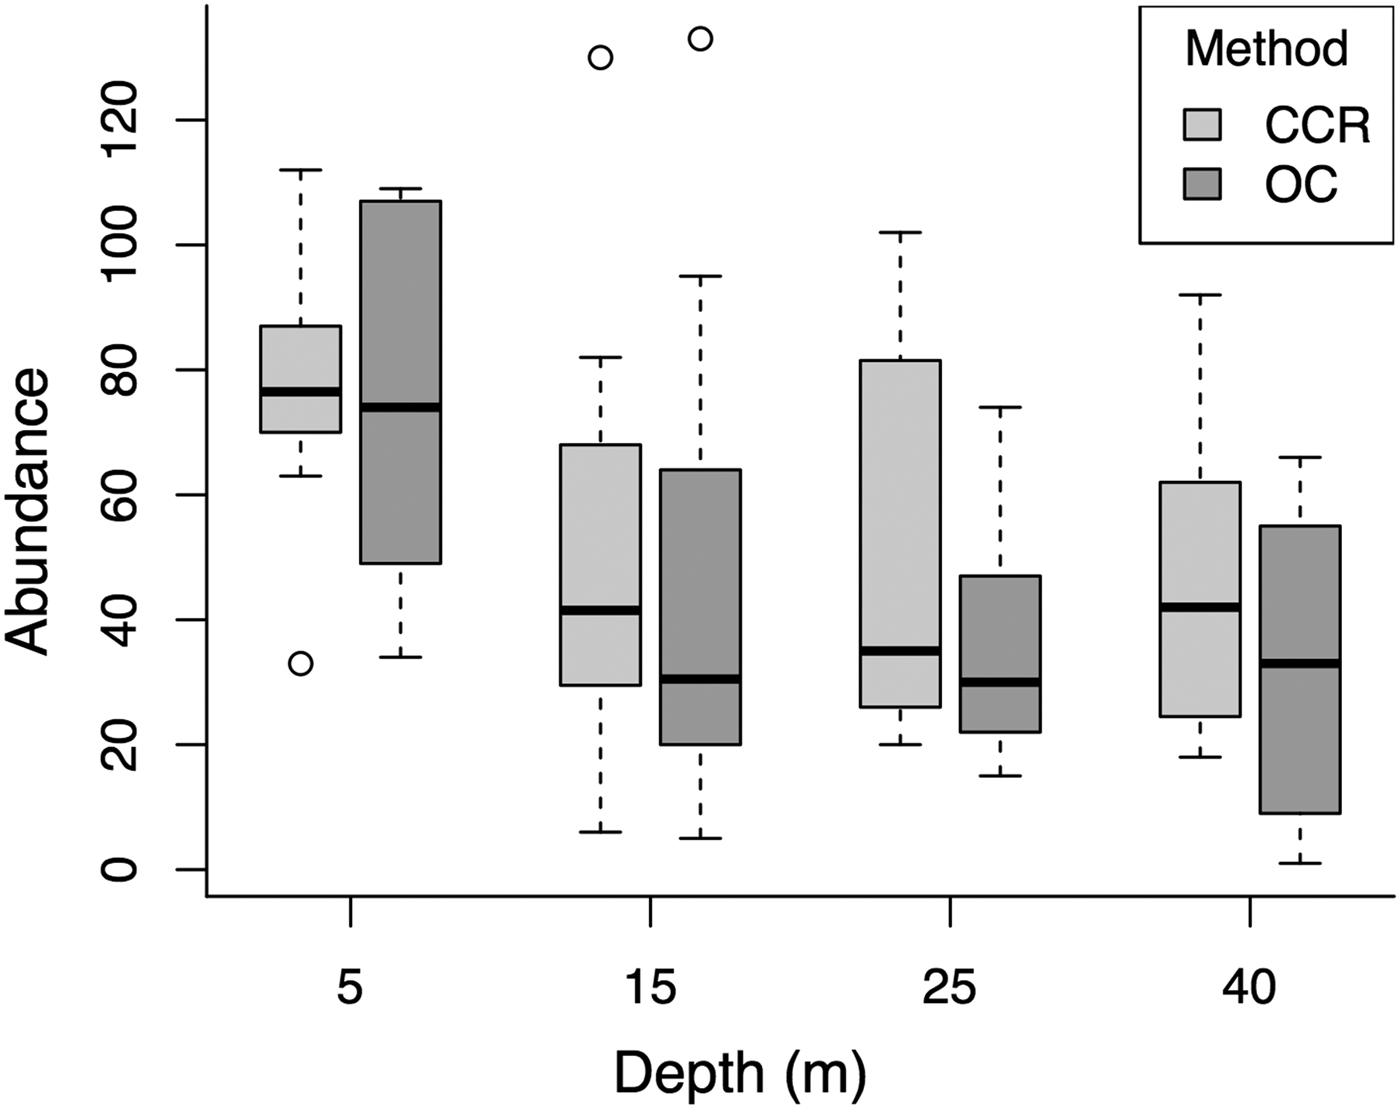
Median fish abundance was greater for CCR transects than OC at all surveyed depths (Figure 2), however there was no significant effect of survey method on total fish abundance per transect (PERMANOVA, Pseudo-F = 2.17, P = 0.09) or total fish biomass per transect (PERMANOVA, Pseudo-F = 0.01, P = 0.96). However, we found abundance differences between CCR and OC when considering specific fish families. Method effects were recorded based on abundance for Acanthuridae and Tetraodontidae, and based on biomass for Lutjanidae and Tetraodontidae. In addition we found significant method:depth interactions based on abundance and biomass for Tetraodontidae across the shallow to mesophotic depth gradient (Table 1). Acanthuridae median abundance per transect was similar between methods (Figure 3A), but shallow (5 m) OC transects detected several large schools of Acanthurus coeruleus increasing the mean abundance estimates from 1.83 ± 0.58 per 250 m2 for CCR to 6.67 ± 5.05 per 250 m2 for OC (mean ± SE). Tetraodontidae displayed similar abundance recorded by both methods in the shallows, but greater abundance recorded by CCR than OC at 25 (14.92 ± 3.55 vs 5.83 ± 5.21 per 250 m2) and 40 m (25.67 ± 13.09 vs 4.17 ± 3.92 per 250 m2) (Figure 3B). Tetraodontidae biomass also showed the same pattern (Figure 3D). Greater Lutjanidae biomass was recorded by CCR in the shallows than OC, with 637 ± 279 vs 463 ± 297 g per 250 m2 at 5 m while there was less difference between CCR and OC (139 ± 38 vs 309 ± 110 g per 250 m2) at 40 m (Figure 3C). The majority of fish families tested did not show any effect of survey method on abundance or biomass, though many exhibited effects of depth and survey site on abundance (Table 1). No difference in abundance or biomass between the two methods was detected for Haemulidae, Labridae, Lutjanidae, Pomacentridae or Scaridae (Table 1).
Comparison of the two survey methods across the depth gradient for total fish abundance per transect for all sites. The solid black line represents the median, with the box indicating the upper and lower quartiles, and whiskers representing the maximum or minimum observed value that is within 1.5 times the interquartile range of the upper or lower quartile, respectively. Open circles represent data points that fall outside the mean ± 1.5 times the interquartile range.
Fish family abundance or biomass recorded by CCR (light grey) and OC (dark grey) across the depth gradient. Fish families are (A) Acanthuridae abundance, (B) Tetraodontidae abundance, (C) Lutjanidae biomass and (D) Tetraodontidae biomass. The solid black line represents the median, with the box indicating the upper and lower quartiles and whiskers representing the maximum or minimum observed value that is within 1.5 times the interquartile range of the upper or lower quartile respectively.

PERMANOVA results based on Bray–Curtis dissimilarity matrix for difference in fish abundance and biomass recorded for each fish family by OC and CCR.
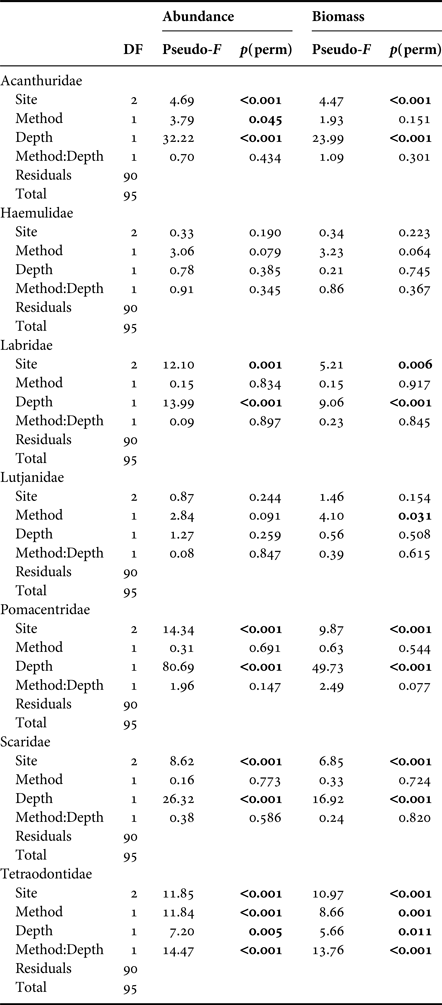
Only fish families recorded on >50 out of the 96 transect surveys are shown.
Minimum Approach Distance (MAD)
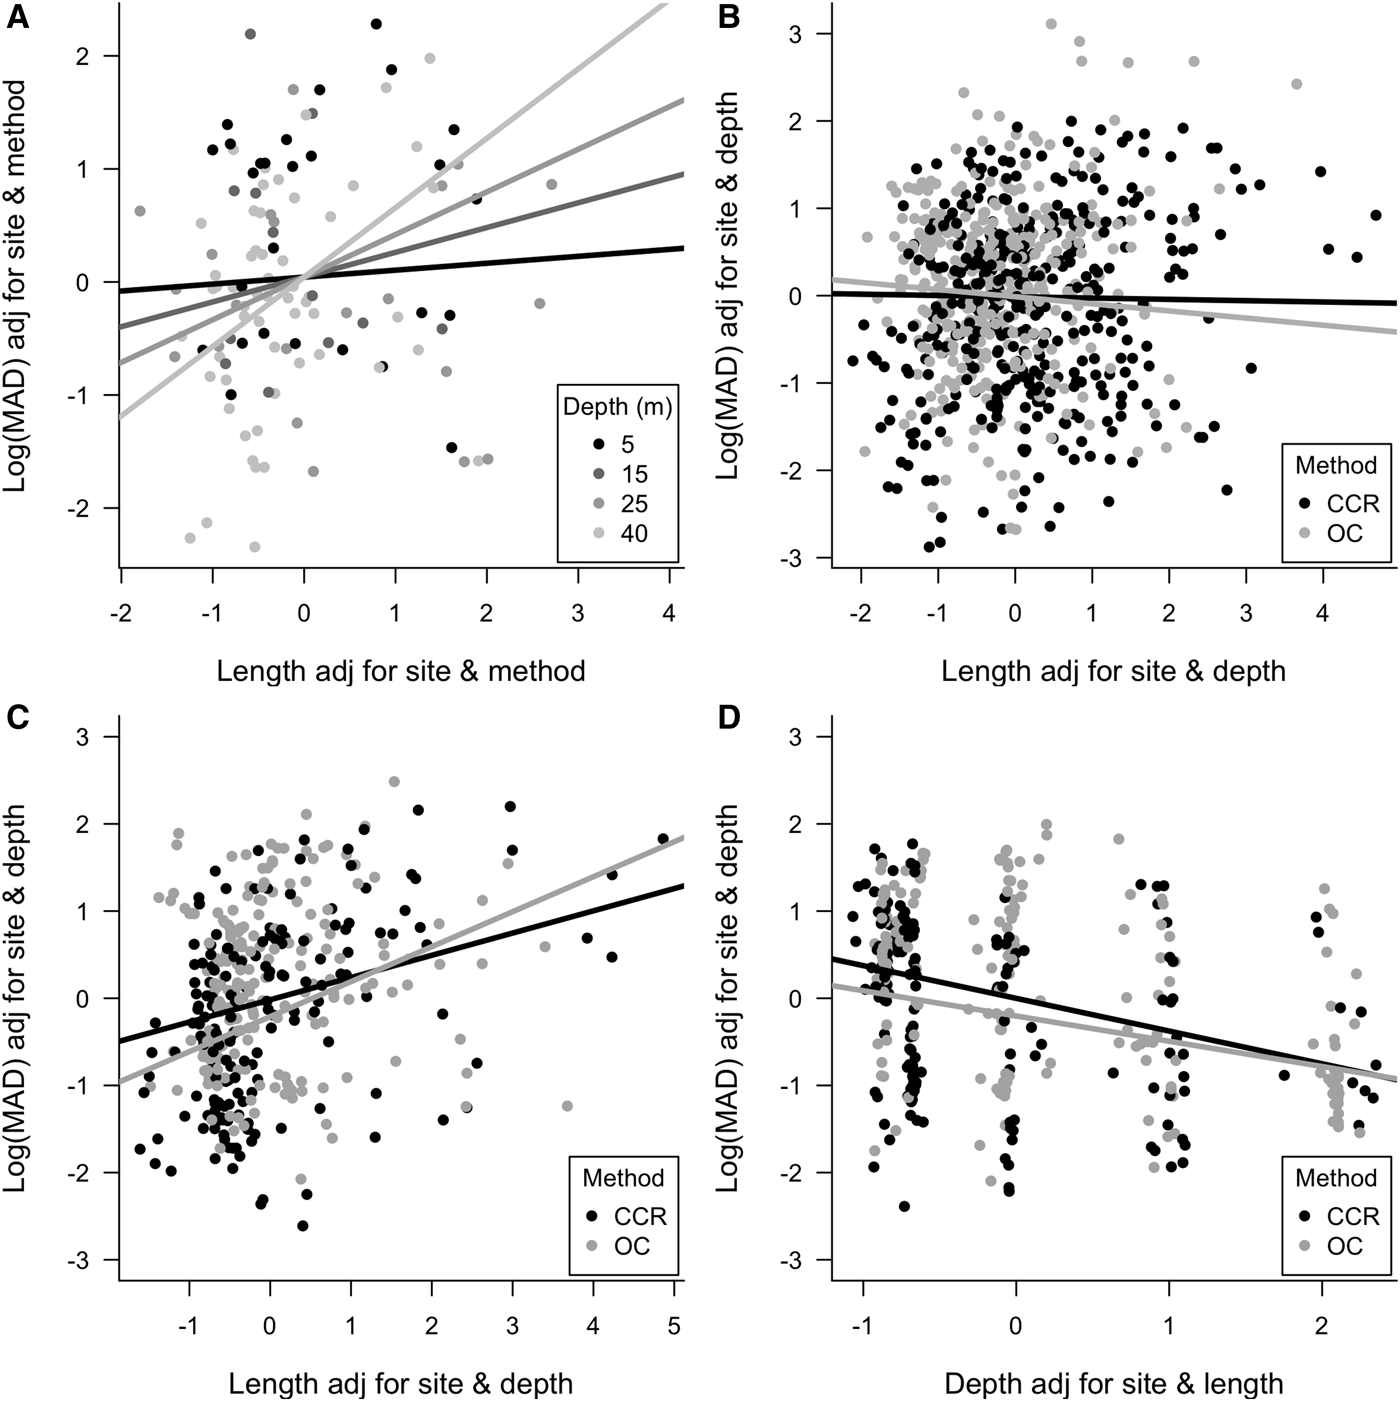
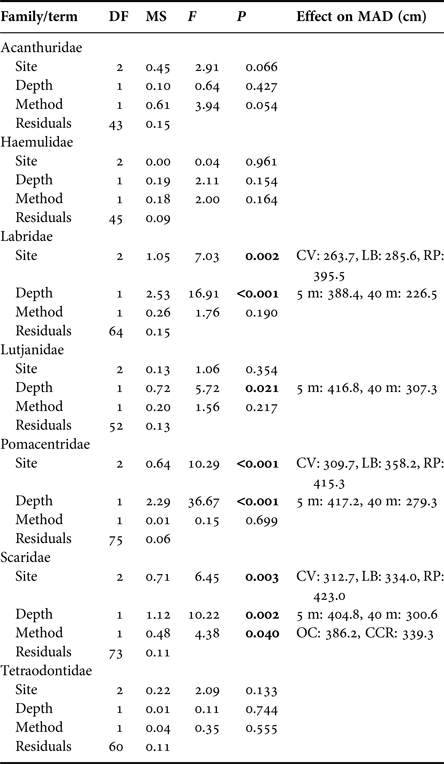
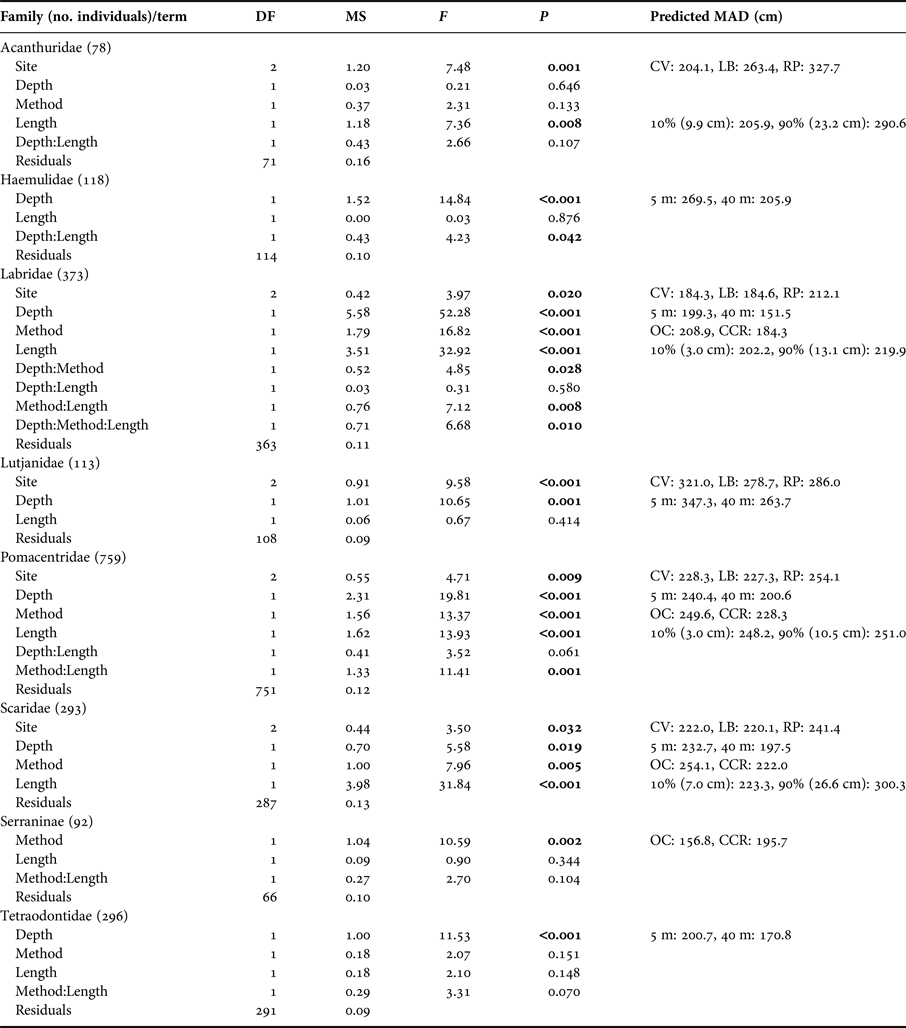
To evaluate whether fish are likely to be missed from transects we examined the 90th quantile of MAD for each fish family by transect. Only Scaridae showed any effect of method, with individuals fleeing more readily from OC than CCR divers (Table 2). However, Labridae, Lutjantidae, Pomacentridae and Scaridae all showed effects of depth on the 90th quantile of MAD, with fish allowing divers to more closely approach at 40 m compared with the shallows (Table 2). Despite these broad patterns when aggregating data across whole transects, when considering individual fish, differences in MAD in relation to survey method, depth and individual fish length were observed. Table 3 shows analysis results for individual fish, along with model predictions of MAD. MAD was greater for OC for Labridae, Pomacentridae and Scaridae, meaning individual fish could be more closely approached 23%, 6% and 14% respectively by divers when using CCR (Table 3). The sub-family Serraninae showed the opposite pattern, with divers able to approach 17% closer on OC than CCR (Table 3). Interactions between method and depth were also found for Labridae, with divers on average able to approach fish more closely on CCR (229.3 ± 48.2 cm) than OC (264.2 ± 34.9 cm) at 5 m. However, this difference decreased as depth increased, with little difference between CCR (194.9 ± 44.6 cm) and OC (168.0 ± 34.7 cm) at 40 m (Figure 4D). Many fish families did not show a difference in MAD between the two survey methods, including Acanthuridae, Hamulidae, Lutjanidae and Tetraodontidae (Table 3).
Visualization of MAD (A) Depth:Length interactions for Haemulidae, (B) Method:Length interaction for Pomacentridae, (C) Method:Length interaction for Labridae and (D) Depth:Method interaction for Labridae. Minimum approach distance and fish length and depth have been standardized for the effects of site and depth/fish length then centred.

ANCOVA model results for 90th quantile per transect of log Minimum Approach Distance (MAD) for fish families following simplification based on model AIC.

Only fish families that were recorded on >50 transects. Effect on MAD column shows the mean 90th quantile MAD value (in cm) across all transects within a category for variables that were found to be significant, allowing direction and approximate magnitude of effects to be seen. Sites were: Coral View (CV), Little Bight (LB) and Rocky Point (RP), while methods were: open circuit (OC) and closed-circuit rebreather (CCR).
ANCOVA model results for log Minimum Approach Distance (MAD) for fish families following simplification based on model AIC.
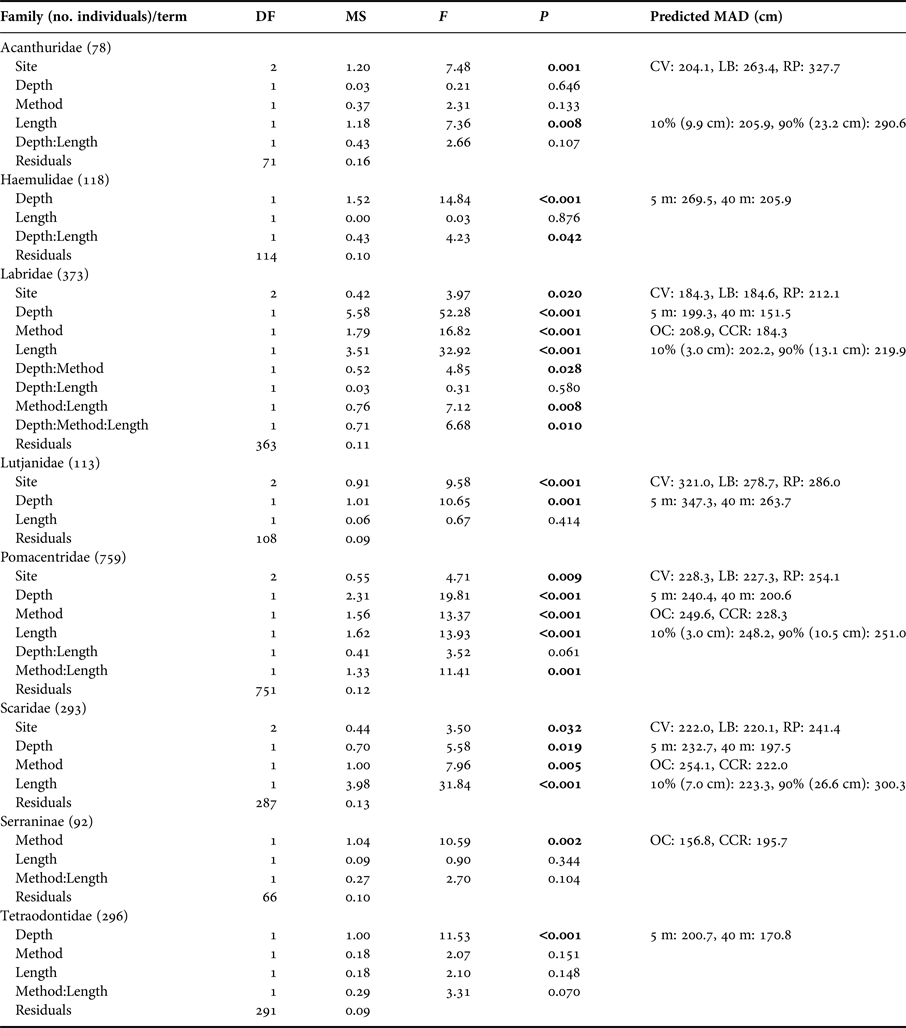
Only fish families that ≥30 individual fish MAD measurements were made for both open circuit and closed circuit are shown (therefore ≥60 MAD measurements per family). Predicted MAD shows the prediction from the fitted model for MAD when altering the variable of interest while holding all other variables constant. All MAD predictions are reported in cm. For site effects, the prediction was based on assuming 15 m depth, CCR surveys and the mean fish length for the family recorded within our dataset. Depth effect predictions used 5 and 40 m depths and are based on: Coral View, open-circuit diving and mean family fish length. Method effect predictions are based on: Coral View, 15 m depth and mean family fish length. Length predictions are based on Coral View, 15 m depth and open-circuit scuba, the presented length predictions represent the 10 and 90% quantiles of recorded fish lengths for the family (these fish body lengths are indicated in brackets below). Sites were Coral View (CV), Little Bight (LB) and Rocky Point (RP).
Many families were observed to have higher MADs for larger individuals, including Acanthuridae, Labridae, Pomacentridae and Scaridae, meaning larger fish allowed divers to approach them less closely than smaller fish (Table 3). In some cases these differences were large, for example, we predict on shallow reefs using OC a juvenile Acanthuridae 9.9 cm long would have a MAD of 205.9 cm, while a mature individual 23.2 cm long would have a MAD of 290.6 cm giving >0.8 m difference. Haemulidae also showed a significant depth and length interaction, with greater effects of fish length on MAD at mesophotic depths, and less effect in the shallows (Figure 4A), suggesting that larger individuals are more tolerant of allowing divers closer on shallow reefs than they are at mesophotic depths.
We also detected interactions between fish length and survey method for Labridae and Pomacentridae (Table 3), with smaller Labridae appearing more wary of CCR divers than OC divers which reversed for larger individuals, which were more wary of OC divers (Figure 4C). However, the opposite patterns was observed for Pomacentridae (Figure 4B). For Haemulidae we detected a Length:Depth interaction, with larger fish being more wary on deeper reefs than smaller fish, yet less difference based on body size in the shallows (Figure 4A).
DISCUSSION
Of the seven fish families encountered on more than 50 transect surveys, only three showed variations in overall abundance or biomass between OC and CCR, and we found no difference in total fish abundance or biomass between the two methods. While we did detect differences in fish behaviour between OC scuba and CCR techniques, particularly Minimum Approach Distance (MAD) for Labridae, Pomacentridae and Scaridae and Serraninae, only Scaridae showed differences between methods for 90th quantile of MAD (representing fish remaining furthest away from the cameras). Despite this, none of these differences in MAD appear to be of sufficient magnitude to affect detectability during typical reef monitoring programmes. This suggests generally OC scuba surveys are appropriate for reef fish community monitoring on Utila.
Detectability variation between OC and CCR
Of the differences in abundance and biomass we identified between techniques: Tetraodontidae abundance and biomass was similar on shallow reefs between techniques, but greater abundance and biomass was recorded by CCR than OC on MCEs. Lutjanidae biomass was higher when surveyed with CCR than OC. In contrast Acanthuridae abundance was similar between methods on MCEs, yet OC recorded more Acanthuridae individuals in the shallows. To our knowledge only two studies have previously compared fish abundance and biomass surveys conducted by OC and CCR, both of which were located in the Indo-Pacific region and focused on comparing fish surveys at the same depth between areas with differing levels of spearfishing (Lindfield et al., Reference Lindfield, Harvey, McIlwain and Halford2014a; Gray et al., Reference Gray, Williams, Stamoulis, Boland, Lino, Hauk, Leonard, Rooney, Asher, Lopes and Kosaki2016). One conducted in Micronesia demonstrated a clear negative effect of OC on recorded fish biomass in areas with spearfishing (Lindfield et al., Reference Lindfield, Harvey, McIlwain and Halford2014a). The other, conducted in Hawaii found no overall effect across a gradient in fishing pressure, but that at the most heavily spearfished site, fish biomass of key species was lower when surveyed by OC (Gray et al., Reference Gray, Williams, Stamoulis, Boland, Lino, Hauk, Leonard, Rooney, Asher, Lopes and Kosaki2016). Therefore we believe this study is the first identifying that differences in fish community surveys between OC and CCR can be depth specific.
We found few differences in abundance or biomass between OC and CCR for most fish families. This lack of major differences between survey methods for many fish families’ abundance and biomass was surprising, as it is in contrast to previous studies which demonstrate effects of diver presence in the water, e.g. Watson & Harvey (Reference Watson and Harvey2007). However, Watson & Harvey (Reference Watson and Harvey2007) used fish point counts from a static camera system with an OC diver either present or absent. Habituation to OC divers has been recorded in reef fish on Utilan fringing reefs, though habituated fish still exhibited diminished behaviours compared with surveys without divers present (Titus et al., Reference Titus, Daly and Exton2015). Previous studies have also found few differences when comparing fish communities surveyed by OC and semi-closed rebreathers (Cole et al., Reference Cole, Syms, Davey, Gust, Notman, Stewart, Radford, Carbines, Carr and Jevs2007), though unlike CCR semi-closed rebreathers produce bubbles. Our lack of differences in observed abundance or biomass between survey techniques for many fish families fits with results of Lindfield et al. (Reference Lindfield, Harvey, McIlwain and Halford2014a), who found that their non-spearfished family control, Chaetodontidae, did not show a significant difference in biomass between survey techniques, and also similar results between methods within protected areas. The lack of difference in abundance or biomass based on survey method is further supported by our analysis of the 90th quantile of MAD for seven fish families. We found only one family, Scaridae, which had a lower 90th quantile of MAD for CCR than OC. This suggests that regardless of technique, fish with the greatest MAD are still similar between methods, and within the detection range of both techniques.
While our abundance and biomass results and 90th quantile of MAD suggest that choice of dive technique has limited effect on broad fish community results, our MAD results show that some fish families did in fact exhibit differences in their responses to the two dive techniques. MADs were lower for CCR surveyed fish than OC for several families (Labridae, Pomacentridae, Scaridae). Only the sub-family Serraninae had smaller MAD for OC transects than CCR transects. This leads us to conclude that differences between OC and CCR do cause detectable effects on fish surveys, most likely through driving active avoidance or attraction behavioural responses in some key fish families. However, despite these differences being detectable, they are unlikely to undermine the data collection and the reliability of either dive gear when conducting surveys. Other studies, for example, Feary et al. (Reference Feary, Cinner, Graham and Januchowski-Hartley2011) have reached analogous conclusions when comparing FID in areas with fishing and those without. They found that while active spearfishing increases mean FID, this increased FID does not extend beyond the range at which the fish can be detected (Feary et al., Reference Feary, Cinner, Graham and Januchowski-Hartley2011).
Several possible explanations are likely for the fish families for which we did observe different abundances or biomass between techniques. However, caution is required in interpreting the results, as surveys were limited to three sites and reef structure changes across the shallow to upper-MCE depth gradient (Andradi-Brown et al., Reference Andradi-Brown, Gress, Wright, Exton and Rogers2016b), making interpreting Depth:Method interactions harder. Higher abundances recorded for Acanthuridae by OC are likely to be caused by shallow OC transects encountering several large schools of Atlantic blue tang (Acanthurus coeruleus) that were not encountered when the transects were conducted by CCR. While we cannot rule out attraction effects of OC divers to these schools, we did not observe any other fish families attracted to OC on shallow reefs.
Tetraodontidae abundance patterns are harder to explain, but most individuals recorded belonged to one species, the Caribbean sharp-nose pufferfish (Canthigaster rostrata). As these are a small-bodied species, habituation effects to the sounds of shallow OC divers could explain the observed differences in abundance and biomass between techniques. If this were the case, it is not clear why similar abundance patterns were not detected in many other reef fish families. For example, our Lutjanidae results suggest that in the shallows individuals are not habituated to diver presence, with higher biomass recorded by CCR than OC, with less difference at depth (Figure 3C). Tetraodontidae were, however, detected on the most transects of all fish families tested, and are one of the most abundant fish detected on Utila across both shallow reefs and upper-MCEs (Andradi-Brown et al., Reference Andradi-Brown, Gress, Wright, Exton and Rogers2016b). This high number of transects combined with large numbers of individuals recorded meant we had greater power to detect differences in abundance between techniques and across the depth gradient in Tetraodontidae than many other fish families we tested. However, our MAD results for Tetraodontidae run counter to this explanation, as we found no differences in MAD between OC and CCR, and MAD declined with increased depth, therefore MCE Tetraodontidae allowed divers to approach more closely than shallow reef ones. This is the reverse pattern expected if this species was habituated to the presence of OC divers on shallow reefs. MAD measurements with DOV are most effective for larger fish species that can be observed with both cameras in the stereo-video pair in order to measure distance. DOV has also been shown to be poorer compared with some other survey techniques at detecting smaller-bodied individuals such as Tetraodontidae (Andradi-Brown et al., Reference Andradi-Brown, Macaya-Solis, Exton, Gress, Wright and Rogers2016c). Therefore caution is required when interpreting MAD values for small-bodied species that do not respond to divers by swimming away, but instead hide in the reef structure. If the majority of disturbed fish hide before we observe them on both cameras then we are unable to record this high MAD distance, potentially biasing our comparison.
As many in-water diver surveys of shallow-reef communities are conducted by OC (English et al., Reference English, Wilkinson and Baker1997), while those on MCEs are generally conducted by CCR (Bejarano et al., Reference Bejarano, Appeldoorn and Nemeth2014; Pinheiro et al., Reference Pinheiro, Goodbody-Gringley, Jessup, Shepherd, Chequer and Rocha2016), many researchers have been cautious of making comparisons across the depth gradient between datasets collected with different techniques. While caution is required when analysing data that compounds depth and dive gear, our results suggest broad comparisons between shallow reef OC surveys and MCE CCR surveys on Utila are likely to still give informative patterns relating to biological changes in fish communities, rather than be primarily driven by differences between fish detectability caused by dive gear. Utila however does not have a reef fish spearfishery, and the MAD changes with depth we observed are unlikely to limit detectability of fish. However, our MAD results reinforce the need to account for differing fish behavioural responses before comparing fish data collected by different dive techniques in areas with spearfisheries. We anticipate that in other locations where depth-restricted spearfishing occurs (e.g. Lindfield et al., Reference Lindfield, McIlwain and Harvey2014b), comparisons between different dive gears will highlight greater dive gear choice effects across the depth gradient.
Changes in MAD with fish size and depth
We recorded greater MADs for larger individuals in the families Acanthuridae, Labridae, Lutjanidae, Pomacentridae, Scaridae and Serraninae. These results are consistent with previous FID studies, which have found larger Acanthuridae and Scaridae do not allow divers to approach as closely before fleeing in areas with spearfisheries (Gotanda et al., Reference Gotanda, Turgeon and Kramer2009; Januchowski-Hartley et al., Reference Januchowski-Hartley, Graham, Feary, Morove and Cinner2011). In addition, studies of lionfish around Utila (which are culled by spearfishers as part of an invasive species management programme) have found that larger lionfish react to diver presence at greater distances than smaller lionfish (Andradi-Brown et al., Reference Andradi-Brown, Grey, Hendrix, Hitchner, Hunt, Gress, Madej, Parry, Régnier-McKellar, Jones, Arteaga, Izaguirre, Rogers and Exton2017). However, spearfishing has been banned around Utila since 2004 for all species except lionfish (Kramer et al., Reference Kramer, McField, Filip, Drysdale, Flores, Giró and Pott2015), making it unlikely that historical fisheries are driving our observed patterns. Another explanation is proposed by Gotanda et al. (Reference Gotanda, Turgeon and Kramer2009) based on ecological processes unrelated to fishing pressure: Generally as reproductive value increases it is predicted that risk taking should decrease (Clark, Reference Clark1994). As mortality rates decline with increased size in marine fish (Sogard, Reference Sogard1997), larger individuals would therefore be predicted to reduce risk taking.
Changes in MAD were recorded for six out of eight families based on the survey depth (Haemulidae, Labridae, Lutjanidae, Pomacentridae, Scaridae and Tetraodontidae), with in all cases lower MAD at greater depths. The drivers of this pattern are not clear, and there could be several possible explanations. These results do not fit with previous work in the Bay Islands of Honduras, which suggest that reef fish can habituate to diver presence (Titus et al., Reference Titus, Daly and Exton2015), and (despite shallow reef culling) that lionfish show no difference in diver response distance between shallow reefs and MCEs (Andradi-Brown et al., Reference Andradi-Brown, Grey, Hendrix, Hitchner, Hunt, Gress, Madej, Parry, Régnier-McKellar, Jones, Arteaga, Izaguirre, Rogers and Exton2017). With the majority of diving on Utila limited to shallow reefs, habitation effects in the shallows would be expected to lead to increasing MAD with increasing depth. Other possible explanations include the changing reef structure across the depth gradient. While data on structural complexity of the reefs at each depth is not available, previous work at two of our sites, combined with wider surveys at other sites around Utila has indicated that hard substrata cover declines with increased depth (Andradi-Brown et al., Reference Andradi-Brown, Gress, Wright, Exton and Rogers2016b). This decline in hard substrata, partially caused as the reefs shift from a spur and groove shallow reef system to a MCE patch reef system, is also associated with a decline in structural complexity. Fish on MCE patch reefs may be less likely to flee from approaching divers, as this would require moving away from the reef over a large area of open sand, allowing divers to move closer to them than in the shallows where a continuous reef exists. Another explanation could be reduced light levels on deeper reefs make it harder for fish to identify diver approaches. However, a study of reef fish visual acuity across shallow to mesophotic reefs suggests high plastic adaptive ability of fish visual systems to compensate for lower light levels (Brokovich et al., Reference Brokovich, Ben-Ari, Kark, Kiflawi, Dishon, Iluz and Shashar2010). These adaptations were sufficient for a zooplanktivorous species from the family Pomacentridae to show little change in foraging behaviour across a shallow reef to upper-MCE gradient (Brokovich et al., Reference Brokovich, Ben-Ari, Kark, Kiflawi, Dishon, Iluz and Shashar2010). Natural changes in reef structure with depth combined with fish visual adaptive plasticity make it hard to disentangle effects of depth from those of changing reef structure and light levels, and require further research.
In addition to a general decline in MAD at increased depth, in Haemulidae we detected weak Depth:Length interactions. This suggests larger fish are more likely to flee on MCEs than shallow reefs than would be expected from their body size alone. Previous work has hypothesized that light levels may interact with fish length in affecting FIDs (Januchowski-Hartley et al., Reference Januchowski-Hartley, Graham, Feary, Morove and Cinner2011), as generally there is an improvement in fish vision with increasing body size (Fernald, Reference Fernald1985). This could explain these results, as fish of all body sizes are more likely to be able to detect divers approaching in shallow sites with high light availability, whereas at deeper depths with lower light levels it may be harder for small fish to identify divers approaching than large fish.
This study highlights the importance of considering changes in fish behaviour when conducting reef fish surveys across depth gradients. While for many fish families we did not detect differences in abundance between OC and CCR surveys, we did identify family level differences in how close divers could approach individual fish between the methods. Some differences in approach distance varied with depth, with the direction of response family specific. This study highlights the need for reef fish community studies making comparisons across natural gradients such as depth to be aware of changes in fish behaviour that may affect their fish detection results.
ACKNOWLEDGEMENTS
We wish to thank Faye-Marie Crooke, Sarah Laverty and Richard Astley (Coral View Research Center) and María Arteaga and Suriel Dueñas (Bay Islands Conservation Association) for fieldwork support. We also wish to thank Luke Shepherd, Edd Stockdale and Georgina Wright for assisting with transect filming. We thank Tom Letessier for advice on univariate PERMANOVA, and two anonymous reviewers who helped improve this manuscript.
FINANCIAL SUPPORT
All authors would like to express thanks to the fieldwork funders: Royal Geographical Society Ralph Brown Expedition Award, Zoological Society of London Erasmus Darwin Barlow Expedition Grants, Operation Wallacea and the University of Oxford Expeditions Council. DAAB is jointly funded by a Fisheries Society of the British Isles PhD studentship and by Operation Wallacea.