Implications
Knowledge of the development of adipose tissue (AT) and its regulatory processes can help increase the amount of intramuscular fat (IMF) in breeds, like the Pirenaica breed, with low IMF accumulation. Extending the finishing phase and modifying feed energy density did not significantly alter the IMF or expression of the main adipogenic markers, but certain results suggest that inclusion of fatty acids in the feed might assist adipocyte hyperplasia and hypertrophy by activating the expression of key adipogenic and lipogenic genes and downregulating genes that suppress adipogenesis. This might, therefore, be a strategy for increasing the IMF content meriting further study.
Introduction
The ability to accumulate IMF is highly variable in beef cattle. Breeds such as German Angus and Holstein produce carcasses with an IMF content of around 4.4% to 4.7% at 24 months of age, and Japanese Black accumulated up to 23.3%, while others such as Belgian Blue attained no more than 0.6% (Gotoh et al., Reference Gotoh, Albrecht, Teuscher, Kawabata, Sakashita, Iwamoto and Wegner2009). In addition, genetic selection in meat animals has favoured lean carcasses, leading to a reduction in the IMF content in beef. Generalized AT reduction could adversely affect meat quality, in that a certain amount of IMF is needed to assure such attributes as juiciness, tenderness and taste (Maltin et al., Reference Maltin, Balcerzak, Tilley and Delday2003; Hausman et al., Reference Hausman, Dodson, Ajuwon, Azain, Barnes, Guan, Jiang, Poulos, Sainz, Smith, Spurlock, Novakofski, Fernyhough and Bergen2009), but excess abdominal or subcutaneous (SC) fat is not desirable, because it decreases feed efficiency and depreciates the carcass. Thus, a balance in the amount of AT accumulated in the different anatomical depots would be beneficial, and this has been a goal viewed in recent years as a window of opportunity for improving both meat quality and feed efficiency in beef cattle.
The current emphasis of cattle selection programmes has, therefore, been on increasing the IMF without impacting the SC fat (Hausman et al., Reference Hausman, Dodson, Ajuwon, Azain, Barnes, Guan, Jiang, Poulos, Sainz, Smith, Spurlock, Novakofski, Fernyhough and Bergen2009), deriving knowledge regarding the molecular mechanisms involved in AT development being a complementary goal. Despite recent gains in our comprehension of AT regulation in meat animals, many issues still need to be explained before this process is fully understood. At the same time, metabolic differences have been shown to underlie the anatomical origin of AT (Miller et al., Reference Miller, Cross, Lunt and Smith1991), and adipose cells are known to differ in their ability to uptake lipids and in their functional attributes (Jo et al., Reference Jeong, Kim, Nguyen, Lee and Baik2012). Differences between intramuscular (IM) and SC ATs at the molecular level could be expected as well, and for instance Pickworth et al. (Reference Pickworth, Loerch, Velleman, Pate, Poole and Fluharty2011) observed higher levels of peroxisome proliferator-activated receptor γ (PPARG), fatty acid-binding protein 4 (FABP4), fatty acid synthase (FASN) and lipoprotein lipase (LPL), messenger RNA (mRNA) in SC than in IMF in feedlot cattle (Simmental-Angus crossbred). These findings were related to larger SC adipocyte size and to more pronounced differentiation and hypertrophy in SC tissue. Differences in gene expression could thus be used as markers to enhance meat quality under different management conditions, and great efforts have, therefore, been directed at elucidating the molecular mechanisms driving IMF accumulation.
The Pirenaica breed is the most important beef cattle breed raised in the region of the Pyrenees Mountains in northern Spain and is highly appreciated for its value as a genetic resource and for the production system that has developed around it in that region. Nevertheless, meat quality can be compromised by the breed’s poor ability to accumulate IMF, which does not usually exceed 2%. Accordingly, we hypothesized that gene expression of the key adipogenesis regulators and some of the main lipogenic enzymes could be differentially affected by management factors (e.g. age and diet) in the main ATs affecting carcass and meat quality. Consequently, this study was undertaken to examine whether age and diet energy density affected adiposity and gene expression of certain key adipogenic and lipogenic markers in the SC AT and in the longissimus thoracis muscle (LM) from native Pirenaica beef cattle and whether there were differences in adipogenesis and lipid metabolism between these tissues during the growth and finishing phases.
Material and methods
Animals and experimental design
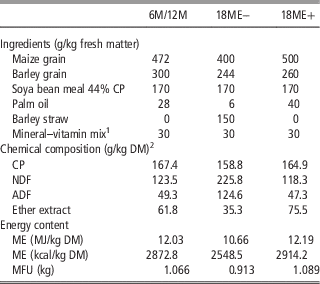
A total of 16 young Pirenaica bulls were divided into four groups (n=4) and slaughtered at 6 (6M), 12 (12M) and 18 (18ME− and 18ME+) months of age. Animal selection criteria were for the animals to share the same father and have half-sibling mothers. The bulls were kept with their mothers until 4 months of age and offered a standard growing diet and cereal straw, both ad libitum, up to 6 months. From 6 to 12 months, the commercial endpoint for cattle of this breed, the young bulls were fed the standard diet for the breed (12.3 MJ metabolizable energy (ME)/kg dry matter (DM)), and from 12 to 18 months the animals were assigned to two groups and fed different energy density diets (18ME−=10.66 MJ ME/kg DM and 18ME+ =12.19 MJ ME/kg DM). Table 1 gives the details of the experimental concentrates. The young bulls in the 12M and 18M groups had similar weights at 12 months of age (585, 582 and 589 kg live weight (LW) for 12M, 18ME− and 18ME+, respectively). Care and use of the animals was in compliance with European guidelines (EU, 2010).
Ingredients and chemical composition of the three experimental concentrates fed to Pirenaica bulls by age and diet: 6 months (6M), 12 months (12M) and 18 months (low (18ME−) or high (18ME+) energy diet)

DM=dry matter; ME=metabolizable energy; MFU=meat forage units.
1 Contained (g/kg): salts (CaCO3 (300.0), NaCl (166.6), CaHPO4 (66.6)), minerals and vitamins 0.4% (466.6).
2 Calculated values.
Carcass traits, marbling and adipocyte size
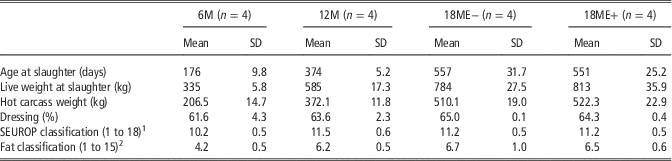
Animals were transported to a commercial abattoir at the corresponding slaughter endpoints and slaughtered according to EU regulations (EU, 2009). The bulls were weighed before slaughter (LW); carcasses were weighed after slaughter (hot carcass weight) and classified according to the official SEUROP grading system. Characteristics of animals at slaughter and the carcasses are shown in Table 2. Backfat thickness (BFT) was measured using a calliper at the 10th rib on the right carcass side. Immediately after slaughter samples from the LM at the 10th rib from the left carcass side and from SC AT from the same area were taken and stored either at 39°C or in ice depending on the planned analytical determinations.
Carcass characteristics of Pirenaica bulls by age and diet: 6 months (6M), 12 months (12M) and 18 months (low (18ME−) or high (18ME+) energy diet)

1 Scoring from 18 for S+ to 1 for P− (S, superior; E, excellent; U, very good; R, good; O, fair; P, poor).
2 Scoring from 15 for 5+, very high, to 1 for 1−, very low (5, very high; 4, high; 3, average; 2, slight; 1, low).
To measure adipocyte size 1 g of LM or 1 g of SC AT from the above locations was placed in a glass test tube containing 10 ml of Tyrode solution at 39°C (0.15 M NaCl, 6 mM KCl, 2 mM CaCl2, 6 mM glucose, 2 mM NaHCO3; pH: 7.62) and transported to the laboratory (20 min). Samples were minced in a Petri dish filled with Tyrode solution placed in a thermal block at 39°C. All visible connective tissue, blood and other debris were removed. The adipocytes were then isolated using the collagenase digestion technique (Rodbell, Reference Rodbell1964): samples were incubated at 39°C in 5 ml of M199 medium (Gibco 31150-022, Waltham, MA, USA) (pH: 7.0 to 7.4) containing 200 mg of bovine serum albumin (Sigma A7906, Sigma-Aldrich, Madrid, Spain) and 5 mg (SC AT) or 10 mg (LM) type 2 collagenase (Sigma C6885) in an incubator for 2 h. After digestion, the samples were filtered through a nylon sieve (850 μm mesh size). The adipocytes so isolated were recovered from the supernatant and examined on microscope slides. The microscope images obtained were digitized and saved on a computer. The diameters of >100 adipocytes from each tissue per animal were measured using an image analyser program (Image-Pro Plus 5.1) as described by Mendizabal et al. (Reference Mendizabal, Purroy, Indurain and Insausti1997). Another set of samples was kept on ice during transit and then stored at −40°C for lipid content determination (ISO 1443–1973, Soxhlet method). At 24 h after slaughter the 10th rib was removed from the right carcass side, weighed and stored at 4°C for determinations of marbling area and number of marbling flecks by computerized image analysis of the LM extracted from that same rib (Mendizabal et al., Reference Mendizabal, Soret, Purroy, Arana and Horcada2005).
Gene expression assays
Tissue samples (5 g) from the SC AT and LM from the above-mentioned regions were removed immediately after slaughter, sealed hermetically in bags, snap frozen in liquid nitrogen and stored at −80°C until use. Total RNA was extracted using commercial solutions, RNeasy Lipid Tissue Mini Kit (Qiagen, Hilden, Germany) for the SC AT and GenElute Mammalian Total RNA Miniprep Kit (Sigma-Aldrich Química) for the LM samples following the manufactures’ instructions. Concentration and purity of the total RNA were determined from the A260 : A280 ratio (Nanodrop 2000; Thermo Scientific, Madrid, Spain). The total RNA was treated with DNase (RQ1 RNase-Free DNase; Promega, Madison, WI, USA) to remove any traces of genomic DNA before complementary DNA (cDNA) synthesis from 1 μg of total RNA (SuperScript reverse transcriptase; Invitrogen, Carlsbad, CA, USA); both kits were used following the manufacturers’ instructions.
Gene expression of PPARG, CCAAT/enhancer-binding protein α (CEBPA), sterol regulatory element-binding transcription factor 1 (SREBF1), wingless-type MMTV integration site family 10B (WNT10B), FABP4, acetyl Co-A carboxylase α (ACACA), LPL and FASN was determined by relative quantitative real-time (RT)-PCR using SYBR Green probes (Applied Biosystems, Foster City, CA, USA). The β-actin gene was chosen as the reference gene. Oligonucleotides were designed using Primer Express, version 1.0 (Applied Biosystems), and sequences were obtained from the GeneBank database (Supplementary Table S1). The RT-PCR amplification mixtures (25 μl) contained 5 μl of diluted cDNA template, 6 μl SYBR Green PCR Master Mix (Applied Biosystems), 0.6 μl forward and reverse primers (5 μM each) and 12.8 μl diethylpyrocarbonate-treated water. Reactions were run in triplicate on an ABI PRISM 7900 sequence detector (Applied Biosystems), and analysis of mRNA expression was performed during the exponential phase of the amplification. Amplification cycle conditions were as follows: 2 min at 50°C and 10 min at 95°C followed by 45 cycles at 95°C for 15 s, 1 min at 60°C, followed by amplicon dissociation (15 s at 95°C, 15 s at 60°C and 15 s at 95°C).
Statistical analysis
Carcass adipose traits and marbling were analysed by one-way ANOVA considering the fixed effect of treatment (6M, 12M, 18ME−, 18ME+). Root mean square error was the residual error term. Adipocyte size distribution was first tested using the Dip test (Hartigan and Hartigan, Reference Hartigan and Hartigan1985) and the bimodality coefficient (SAS Institute Inc., Cary, NC, USA) to determine whether the distribution was unimodal or bimodal. Appropriate descriptive parameters for the distribution were then computed and confidence intervals considered to infer differences (Alfonso and Mendizabal, Reference Alfonso and Mendizabal2016). Pooled standard error was the residual error term.
Gene expression analysis was performed according to the method proposed by Steibel et al. (Reference Steibel, Poletto, Coussens and Rosa2009). To account for differences in amplification efficiencies (E) between the target and reference genes, Cq data were log2 transformed using the expression log2 (E −Cq). Certain Cq values (Supplementary Table S2) were excluded from the analysis because of non-specific amplification. Efficiency for each gene was computed as E=10(−1/S), S being the slope of the linear regression fit using 1 : 10 dilution series (from 100 to 106) (Supplementary Table S3).
Transformed data were analysed using a mixed model considering one fixed effect obtained by grouping the factors tissue, treatment and gene (16 levels: 2 tissues×4 treatments×2 genes – target and reference genes), taking the animal as the random effect. Plate effect was not taken into account because in most analyses only one plate was used for each gene from a single AT and all the treatment. Age and carcass weight were not included because they were not statistically significant (P>0.05). Different assumptions about the (co)variance structure of the animal and residual random effects were considered with and without the relationship matrix and heterogeneity per gene and tissue.
Models were analysed using the SAS MIXED procedure (SAS Institute Inc.) and compared using corrected Akaike’s and Schwarz’s Bayesian information criterion values. The model with heterogeneous variance for animal and residual effects for the different genes and tissues had the lowest values for both these criteria for most of the genes analysed and was, therefore, chosen. The additive numerator relationship matrix between animals yielded no relevant improvement in the goodness-of-fit and so was not included. Finally, different contrasts were defined to estimate differences (diff) between tissues, treatments or experimental groups, and treatments within tissue using the SAS MIXED procedure. Bonferroni’s correction was used to check the significance of the results. Estimates and their raw 95% confidence intervals have been expressed in the same scale used in the calculations, because back-transformation, though useful in terms of relevance, did not affect the statistical significance of the results.
Results
Carcass traits, marbling and adipocyte size
The results showed that BFT increased between 6 and 12 months (Table 3; P<0.05), after which variations in the values were not statistically significant. Percentage of chemical fat in the LM, marbling, fleck size and number of flecks did not vary significantly between the experimental groups.
Backfat thickness (BFT) and longissimus thoracis muscle adiposity values for Pirenaica bulls by age and diet: 6 months (6M), 12 months (12M) and 18 months (low (18ME−) or high (18ME+) energy diet)

RMSE=root mean square error; IM=intramuscular.
a,bDifferent superscript letters in the same row indicate significant differences (P<0.05).
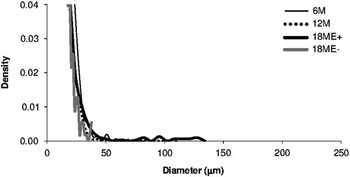
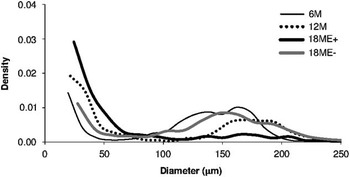
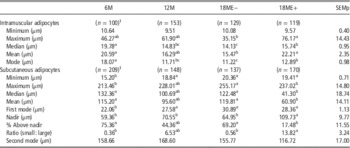
Figures 1 and 2 graphically represent the IM and SC adipocyte size distributions. The hypothesis of unimodal size distribution could not be clearly rejected for IM adipocytes but was definitely rejected for SC adipose cells (P<0.05). The results for IM adipocytes appear in Table 4. Modal IM adipocyte size in the 6M group was greater than in the others, as was the median size compared with the 18ME+ and 18ME− groups and the mean size compared with the 18ME− group (P<0.05). Other significant differences between the values for the 18ME+ and 18ME− groups were also estimated: the modal, median and maximum values were all greater in the 18ME+ group (P<0.05).
Intramuscular fat adipocyte size distribution in Pirenaica bulls by age and diet: 6 months (6M), 12 months (12M) and 18 months (low (18ME−) or high (18ME+) energy diet). The results shown are for the combined analysis of all adipocytes measured in all the animals in each group.

Subcutaneous fat adipocyte size distribution in Pirenaica bulls by age and diet: 6 months (6M), 12 months (12M) and 18 months (low (18ME−) or high (18ME+) energy diet). The results shown are for the combined analysis of all adipocytes measured in all the animals in each group.

Intramuscular and subcutaneous adipocyte size distribution parameters for Pirenaica bulls by age and diet: 6 months (6M), 12 months (12M) and 18 months (low (18ME−) or high (18ME+) energy diet)

SEMp=pooled standard error.
a,b,cDifferent superscript letters in the same row indicate significant differences (P<0.05).
1 Average number of adipocytes measured from each animal (n=4).
Table 4 likewise sets out the estimated parameters for the size distribution values for the SC adipocytes. The SC adipocyte size distribution was bimodal. In contrast to the result for the IM tissue, compared with the other groups adipocyte size in the 6M group was smaller at the first mode, as were minimum and maximum cell size (P<0.05). On the other hand, the mean and median values in the 6M and 18ME− groups were greater than in the 18ME+ group (P<0.05). The nadir, defined as the lowest point (in frequency) between the two-cell populations, was greater in the 18ME+ group than in the others (P<0.05). The percentage of adipocytes above the nadir was lower in the 18ME+ group than in the 6M and 18ME− groups, and, in agreement with this result, the ratio of small : large adipocytes was also greater than in those same two groups (P<0.05).
Gene expression
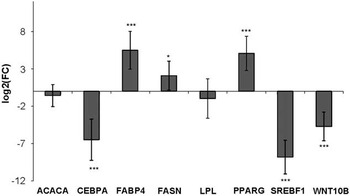
No clear significant differences for the markers analysed were observed between the experimental groups or within the tissues (Supplementary Tables S4, S5 and S6), but statistically significant differences in the expression of certain genes were observed for CEBPA, FABP4, PPARG, SREBF1, WNT10B (P<0.001) and FASN (P=0.034) between the SC AT and the LM (Supplementary Table S4). Analysis of the between-tissue differences revealed that gene expression of PPARG, FABP4 and FASN was upregulated in the SC AT, whereas gene expression of CEBPA, SREBF1 and WNT10B was upregulated in the LM (Figure 3); ACACA and LPL exhibited no differences between the tissues. The magnitude of all statistical significances was also sizeable, the minimum fold-change value being 4.3 for FASN (Supplementary Table S4, fold-change=2diff).
Fold-change (FC) estimates for the subcutaneous (SC) and longissimus thoracis muscle tissues in Pirenaica bulls for the expression of acetyl Co-A carboxylase α (ACACA), CCAAT/enhancer-binding protein α (CEBPA), fatty acid-binding protein 4 (FABP4), fatty acid synthase (FASN), lipoprotein lipase (LPL), peroxisome proliferator-activated receptor γ (PPARG), sterol regulatory element-binding transcription factor 1 (SREBF1) and wingless-type MMTV integration site family 10B (WNT10B). SC-intramuscular difference in log2 rescaled Cq values. Segments indicate the 95% confidence interval. *P<0.05; ***P<0.001.

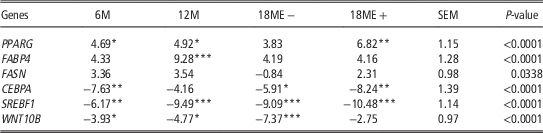
On analysing the differences within each treatment in more detail, gene expression of FABP4 at 12 months and of PPARG in the 6M, 12M (P<0.05) and 18ME+ (P<0.01) groups was observed to be significantly greater in the SC AT than in the LM (Table 5). Overall, gene expression of CEBPA, SREBF1 and WNT10B was significantly greater in the LM for most ages and treatments. The difference for SREBF1 was similar in magnitude in all groups (P<0.01 for the 6M group, P<0.001 for the 12M, 18ME− and 18M+ groups). However, CEBPA expression was greater in the LM than in the SC AT in the 6M (P<0.01), 18ME− (P<0.05) and 18M+ (P<0.01) groups but not in the 12M group, while WNT10B expression was greater in the LM than in the SC AT in the 6M and 12M (P<0.05) groups and, more noticeably, in the 18ME− group (P<0.001).
Estimated differences in gene expression for peroxisome proliferator-activated receptor γ (PPARG), fatty acid-binding protein 4 (FABP4), fatty acid synthase (FASN) CCAAT/enhancer-binding protein α (CEBPA), sterol regulatory element-binding transcription factor 1 (SREBF1) and wingless-type MMTV integration site family 10B (WNT10B) between the subcutaneous adipose tissue and the longissimus thoracis muscle in Pirenaica bulls by age and diet: 6 months (6M), 12 months (12M) and 18 months (low (18ME−) or high (18ME+) energy diet)

SEM and P-values for overall comparison of the longissimus muscle and subcutaneous adipose tissue.
*P<0.05, **P<0.01, ***P<0.001.
Discussion
The main object of this study was to examine adiposity and gene expression of some of the key markers involved in adipogenesis and lipid metabolism in the SC AT and LM during the growth and finishing phases of native beef cattle of the Pirenaica breed, which has a low tendency to accumulate IMF. The animals were reared for a longer period of time than under the usual production system conditions for this breed, and they were provided with diets having different energy densities to induce conditions that might bring about explicit differences in fat accumulation and hence in the key markers involved in the regulation of that process. The rationale was that AT development and gene expression of key adipogenic and lipogenic markers differ under differing management conditions and that an understanding of these differences could be used to define strategies aimed at improving meat quality.
A large body of data suggests that management factors can alter AT development in cattle. For instance, Chung et al. (Reference Chung, Lunt, Kawachi, Yano and Smith2007) observed that SC fat thickness and marbling scores increased over time in corn and hay-fed steers and showed that long-fed (16M), grain-fed cattle produced higher quality carcasses with softer fat than short-fed (8M), grain-fed cattle, while Moura et al. (Reference Moura, Jin, He, McAllister and Guan2013) reported that steers fed a high-fat diet (2.7% v. 7.1%) resulted in downregulation of proteins involved in preadipocyte growth arrest and concluded that preadipocyte proliferation was favoured over differentiation and may have been more intense in both the visceral and SC ATs in steers fed with high-fat diet.
Accordingly, the working hypothesis of this study was that AT development and therefore adiposity and expression of certain key adipogenic drivers (e.g. PPARG, CEBPA, SREBF1 and WNT10B) and enzymes involved in lipid metabolism (e.g. FABP4, ACACA, FASN and LPL) would be age and energy dependent and tissue specific in young, low-marbling Pirenaica bulls.
Marbling and adiposity
The fattening parameter values indicated that BFT was significantly lower (P<0.01) only in the youngest animals (8, 12, 13 and 15 mm for 6M, 12M, 18ME− and 18ME+, respectively). Confirming the feeble tendency of the Pirenaica breed to accumulate AT, even in the most favourable conditions for fat accumulation, that is, the oldest animals fed the higher-energy diet (18ME+ group), IM chemical fat was just 2.40%, well below the level considered organoleptically suitable (3% to 4%, Savell and Cross, Reference Savell and Cross1988).
Unlike typical adipocyte size distributions, which are bimodal (McLaughlin et al., Reference McLaughlin, Sherman, Tsao, Gonzalez, Yee, Lamendola, Reaven and Cushman2007; Soula et al., Reference Soula, Julienne, Soulage and Géloen2013), the IM adipocyte size distributions were unimodal, suggesting that the tissue could be in the early phases of fat accretion. By contrast, modal and median adipocyte size was greater in the 6M group (P<0.05) and similar in the 12M and both 18M groups, possibly indicating that in older animals proliferation and small cell growth are more intense in the IM AT. Modal, median and maximum size values were greater in the 18ME+ group than in the 18ME− group (P<0.05), suggesting higher fat accumulation capacity related to the higher energy density of the diet.
The SC adipocyte size distribution was bimodal, indicative of two-cell populations, one of smaller and another of larger cells (around 22 and 160 μm in diameter, respectively). In the 18ME+ group, the larger population of small adipocytes as indicated by the percentage of cells above the nadir (17.5) and the ratio of small : large cells (13.8) suggest a process of hyperplasia with recruitment of new adipocytes as the animals aged. Thus, the SC AT in the 18ME+ group fed the higher-energy diet (i.e. more non-structural carbohydrate and fatty acids) could have been undergoing adipocyte proliferation as indicated by the predominance of adipose cells below the nadir.
Interestingly, Moura et al. (Reference Moura, Jin, He, McAllister and Guan2013) concluded that visceral and SC ATs in steers fed a high-fat diet (7.1%) may have undergone more intense preadipocyte proliferation than steers fed the control diet (2.7%). Chung et al. (Reference Chung, Lunt, Kawachi, Yano and Smith2007) also observed greater adipocyte density (more adipocytes/100 g tissue) in SC and IM AT in corn-fed long-fed (from 8 to 24 months of age) Angus steers as compared with corn-fed short-fed (from 8 to 16 months of age) steers, suggesting the emergence of newly formed adipocytes or a population of small cells in the AT of steers fed non-structural carbohydrate for a longer period. Adipocyte proliferation could, as well, be related to mature adipocyte size, as suggested by studies showing that on reaching a critical volume rat adipocytes secrete factors that recruit new adipocytes (Marques et al., Reference Marques, Hausman and Martin1998), increasing tissue storage capacity. Adipose cell size could be dependent on lipid fluxes or the rates of lipogenesis and lipolysis (Soula et al., Reference Soula, Julienne, Soulage and Géloen2013), which in turn could be related to cell surface area, larger cells being less efficient at lipid absorption/release than small cells (Jo et al., Reference Jeong, Kim, Nguyen, Lee and Baik2012). It follows from the above-mentioned findings that the nadir could be a function of the size-dependent growth of adipose cells coupled with size fluctuations associated with lipid turnover. In this regard, it is interesting to note that the results observed in this study show that the nadir was greater in the 18ME+ group than in the other groups (109.7 for the 18ME+ group compared with 59.4, 70.6 and 65.0 μm for the 6M, 12M and 18ME− groups respectively, P<0.05), suggesting that the cell population in this group had a better chance of reaching the threshold size that triggers new cell recruitment.
Adipogenic and lipid metabolism gene expression
Analogous to the fattening parameter results, extending the finishing phase or modifying dietary energy density during that phase had very little effect on gene expression of the adipogenic and lipogenic markers considered, as neither age nor dietary energy density resulted in clear differences for the markers analysed within the tissues (Supplementary Table S5). Differences in AT molecular markers related to management factors have previously been reported in cattle. Thus, Key et al. (Reference Key, Perkins, Bratcher, Kriese-Anderson and Brandebourg2013) observed that PPARG expression was upregulated in the SC AT of crossbred heifers as a consequence of an increase in the days on feed or inclusion of grain in the diet, while expression of the genes involved in lipid metabolism (LPL, stearoyl coenzyme A desaturase and FASN) was unaffected by days on feed but was upregulated by dietary grain, while SREBF1 mRNA and expression of genes related to adipogenesis inhibition (such as preadipocyte factor 1) decreased with higher grain availability. The dietary roughage : concentrate ratio could also affect the expression of adipogenic transcription factors in AT, as reported by Yamada and Nakanishi (Reference Yamada and Nakanishi2012), who showed PPARG and CEBPA expression to be lower in the SC and IM ATs in Wagyu steers fed high proportions of roughage or concentrate (35% roughage to 65% concentrate compared with 10% roughage to 90% concentrate). On the contrary, the results for Pirenaica bulls revealed no clear differences in expression of the markers considered but such factors as age at sampling and length of the experimental phases, diet and breed could account for the discrepancies in the results.
There were nevertheless statistically significant differences in the expression of certain genes in the SC AT and the LM, that is, PPARG, FABP4 and FASN were upregulated in the SC AT, while CEBPA, SREBF1 and WNT10B were upregulated in the LM (Figure 3). The differences between the experimental groups were not homogeneous, and some differences could be related to tissue heterogeneity. Adipocytes are the main cell type present in AT and take up most of the tissue, but stromal vascular cells (stem cells, macrophages, endothelial cells, etc.) are present as well, and their proportions may vary depending on the physiological condition and location of the AT (Tchoukalova et al., Reference Tchoukalova, Sarr and Jensen2004). Skeletal muscle is particularly heterogeneous, being formed of muscular fibres, containing fat cells, preadipocytes and the remaining stromal vascular fraction (Hausman and Poulos, Reference Hausman and Poulos2004). Differences in the proportion of fat in the tissues in the different experimental groups might thus be misidentified as differences in gene expression, in particular for those genes most highly expressed in adipocytes. However, no differences in IMF content were observed between the age and dietary treatment groups in this study; and, though caution is called for, the estimated differences seem to be ascribable to gene expression. Adipogenic and lipid metabolism gene expression quantified from mRNA extracted from muscle has, for instance, previously been associated with regulation of these processes in IMF (Jeong et al., Reference Jo, Shreif and Periwal2013, Duarte et al., Reference Duarte, Gionbelli, Paulino, Serão, Nascimento, Botelho, Martins, Filho, Dodson, Guimarães and Du2014, Moisá et al., Reference Moisá, Shike, Faulkner, Meteer, Keisler and Loor2014).
Overexpression of PPARG in the SC AT, which occurred in all groups but 18ME−, could be consistent with greater nutrient partitioning towards this tissue related to high non-structural carbohydrate content in the diet (Vernon, Reference Vernon1986). More specifically, PPARG overexpression in the SC AT in the 18ME+ group is in agreement with the more intense tissue growth inferred from the higher rate of adipocyte hyperplasia that seems to be taking place as indicated by the adipocyte size distribution analysis. In contrast, the higher expression of PPARG in the SC AT compared with the LM was not observed in the 18ME− group. This is relevant, suggesting that lower energy intake by these animals contributed to the lack of any discernible effect on expression of this transcription factor.
PPARG plays a central role in the commonly accepted model of adipogenesis. The differentiation programme is triggered when this receptor is activated, with another two members of the CCAAT/enhancer-binding family (CEBPB and CEBPD) driving PPARG expression in the early stages of differentiation and CEBPA being responsible for maintaining PPARG expression later in the process. These two factors reciprocally regulate each other and activate terminal differentiation genes, and CEBPA plays an additional supporting role in maintaining specific aspects of the adipocyte phenotype, including insulin sensitivity (Rosen and Spiegelman, Reference Rosen and Spiegelman2006). According to this paradigmatic model, a positive relationship between PPARG and CEBPA expression is thus to be expected.
SREBF1 expression controls the expression of genes involved in lipid metabolism, for example, LPL, ACACA and FASN, and it is involved in the generation of natural ligands for PPARG and activation of the expression of this transcription factor (Fajas et al., Reference Fajas, Fruchart and Auwers1998; Kim et al., Reference Kim, Wright, Wright and Spiegleman1998). Results in this study show greater expression of PPARG in the SC AT in most of the groups but overexpression of CEBPA and SREBF1 in the LM, which seems puzzling and could perhaps be related to some tissue-specific trait, given, for instance, the greater contribution of glucose to fatty acid biosynthesis and the higher rates of this last-mentioned process in IM adipose cells embedded in muscle fibres than in the SC fat cells (Smith and Crouse, Reference Smith and Crouse1984).
Expression of FABP4 and FASN was greater in the SC AT than in the LM, and this is consistent with the greater expression of PPARG, as FABP4 is associated with the terminal differentiation of adipocytes and is responsible for intracellular transport of fatty acids and FASN is involved in intracellular fatty acid biosynthesis (Cristancho and Lazar, Reference Cristancho and Lazar2011). SC fat might be used more for energy storage while other ATs like visceral fat are used more for energy homoeostasis (Moura et al., Reference Moura, Jin, He, McAllister and Guan2013), the energy storage function might, then, account for the higher expression of enzymes related to lipogenesis like FASN and fatty acid intracellular transport like FABP4.
WNT10B plays a role in suppressing adipogenesis. This factor has been shown to repress adipogenesis by blocking PPARG and CEPBA induction by stabilizing β-catenin, which interacts transcriptionally to activate Wnt target gene expression (Bennet et al., Reference Bennet, Ross, Longo, Bajnok, Hemati, Johnson, Harrison and MacDougald2002), although the molecular mechanism by which Wnt/β-catenin signalling suppresses the expression of these two genes is poorly understood. The overexpression of WNT10B observed in the LM seems to agree with the low level of development of the IM AT as represented by the small amount of IM chemical fat and small adipocyte size. In agreement with these results, Jeong et al. (Reference Jo, Shreif and Periwal2013) suggested that downregulation of the Wnt/β-catenin signalling pathway genes contributed to increased IMF deposition in LM, in that the observed WNT10B expression had a strong negative correlation with the IMF content in Korean cattle.
The fact that the feeds of the bulls in the 18-month age groups differed not only in energy density but in the energy sources themselves could account for certain of the results observed, as some other studies have shown, for instance, that protected fat is more effective than protected starch in increasing adiposity in steers (Gilbert et al., Reference Gilbert, Lunt, Miller and Smith2003) and that cattle fed a diet high in roughage have lower levels of PPARG and CEBPA expression (Yamada and Nakanishi, Reference Yamada and Nakanishi2012). Diet and specific management conditions too can alter AT development, and Moisá et al. (Reference Moisá, Shike, Faulkner, Meteer, Keisler and Loor2014), for example, observed that expression of PPARG, CEBPA, SREBF1 and FASN, as well as other genes, increased in the LM of early-weaned (141 days of age) beef steers fed a high-starch diet between 96 and 167 days of age, triggering adipogenesis and resulting in greater marbling.
The bulls in the 18ME+ group received more non-structural carbohydrates, mainly maize grain, and more fat (palm oil, i.e., mainly saturated fatty acids), while the animals in the 18ME− group received more structural carbohydrates (barley straw). Overall, then, besides the level of energy density, the precursors of fatty acid and triacylglycerol (TGA) synthesis in the experimental groups were different. On the basis of the composition of the ingredients in the feeds, the 18ME− group received 24 g of long-chain fatty acids (between 14 and 20 carbons) per kg of feed, while the 18ME+ group received 61 g/kg, the differences in the palmitic and oleic acid contents being the most important (5 v. 20 g/kg for palmitic acid and 7 v. 21 g/kg for oleic acid in the 18ME− and 18ME+ groups, respectively). It can be inferred from this that more propionic acid and more long-chain fatty acids, mainly palmitic and oleic acids, were available to the bulls in the 18ME+ group and that the differing availabilities of fatty acid and TGA precursors could have affected development of the ATs. The adipose cell distribution suggested that the SC AT in the 18ME+ group underwent both hyperplasia and hypertrophy, whereas a tendency towards larger adipocytes was observed in the IM AT in that same group (Table 4). Then, in spite that in this study the animals did not show significant higher fat accretion due to age or diet energy density, some results suggest that including fatty acids in the diets of young bulls from weaning to 12 months of age (the commercial endpoint) could be a means of triggering AT development in the Pirenaica breed, therefore yielding meat with a higher degree of marbling and hence enhanced organoleptic quality. This possibility requires further research.
The results observed in this study demonstrate that adipocyte size distribution differed in the SC AT and the LM of young Pirenaica bulls, following a bimodal distribution in the former, as expected for this type of cells, and a unimodal distribution in the latter. The reason for this difference could be associated with a delay in the maturation of IMF tissue or with constriction sustained by IM adipose cells as a result of the muscle environment in which they develop. Age and diet did not have a significant effect on increasing the amount of IMF in the young Pirenaica bulls in this experiment, but based on the different size distributions of the cells and the expression patterns of some of the markers considered, these two factors could have influenced adipocyte development in the two tissues studied, indicating a relevant and differential role of PPARG and WNT10B in triggering adipocyte proliferation and fat accumulation capacity.
Acknowledgements
The authors would like to thank the Navarre Association of Pirenaica Cattlemen (ASPINA) for animal selection, the feed company Piensos San Cristobal for the diet formulations, the La Protectora and Vacuno de Navarra companies for their help in sampling and Mr J. M. Zabaleta for care of the young bulls. The work was funded by grant AGL2008_00492 from the Ministry of Education and Science of the Government of Spain.
Supplementary material
To view supplementary material for this article, please visit http://dx.doi.org/10.1017/S175173111600118X