


1. Introduction
In the dry-snow area of an ice sheet, seasonal and interannual changes in surface elevation are driven by the fluctuations of accumulation rate and by variations in the rate of firn densification (Reference Arthern and WinghamArthern and Wingham, 1998; Reference McConnell, Mosley-Thompson, Bromwich, Bales and KyneMcConnell and others, 2000; Reference Zwally and LiZwally and Li, 2002). A quantitative understanding of the causes of these short-term variations is necessary for interpretation of elevation changes derived from satellite altimetry and for relating observed elevation changes to ice-sheet mass balance. Independent mass-balance data from ground measurements such as global positioning system (GPS) surveys and/or numerical modeling of firn densification, with input of surface climate history derived from automatic weather station (AWS) and ice-core data, are required. A number of such studies have been conducted (e.g. Reference Arthern and WinghamArthern and Reference Wingham, Ridout, Scharroo, Arthern and ShumWingham,1998; Reference McConnell, Mosley-Thompson, Bromwich, Bales and KyneMcConnell and others, 2000; Reference WinghamWingham, 2000; Reference CuffeyCuffey, 2001). These studies were mainly performed at individual sites and focused on mean elevation changes (dh/dt) over a time period typically longer than decade-scale.
Reference Zwally and LiZwally and Li (2002) developed a physically based firn-densification model to examine the snow surface-elevation change at the summit of Greenland during the period 1992–99. The model was driven by accumulation rate and surface air temperature obtained from on-site AWS measurements over this time period. Comparison of modeled elevation changes, H(t), and those derived from satellite data showed good agreement in both seasonal amplitude and interannual variability. Recent comparison of time series of backscatter power and elevation change has shown that the previously derived elevation changes are affected by periodic variations in the measured radar-backscatter power. Therefore, we apply a backscatter-power-dependent correction similar to that applied by Wingham and others (1998). The correction reduced the deviations between the modeled and observed elevation time series at the summit.
In this study, we apply our densification model to the Greenland ice sheet over the area with annual mean temperature below –23°C, which covers much of the dry-snow zone of the ice sheet (Reference Zwally and GiovinettoZwally and Giovinetto, 2000), to investigate the spatial distribution of the magnitude of the modeled seasonal variation for comparison with European Remote-sensing Satellite (ERS-1/-2) data. The model is driven by the annual mean accumulation rate and by a seasonal surface air temperature that is determined from the annual mean temperature and from an empirical estimate of the seasonal amplitude derived from AWS data. The effect of diurnal temperature variations, discussed in Reference Zwally and LiZwally and Li (2002), is not included here for reasons discussed in section 3.2 below.
2. The Radar Altimetry Measurement
Using the crossover method described in Reference Zwally, Brenner and FuZwally and Brenner (2001), elevation-change time series for the Greenland ice sheet are derived from ERS-1 and -2 radar altimeter data for the period April 1992–April 2000. Elevation changes are derived from surface elevation differences, dH21 = H2 - H 1, measured at crossover locations where sub-satellite paths intersect at successive times t2 and t 1. Sets of N values of (dH21) i are averaged over selected areas to reduce the error of the mean. Time series of surface elevations, H(t), having sufficient resolution to show seasonal changes are created by the sequence of average crossover differences between the first 90 day interval and each of the successive 90 day intervals, combined with the sequence from the second interval crossed with each successive interval, and so forth for the sequences for the third and greater intervals. Crossovers within a 100 km radius and ±250 m elevation of the central point are included. The data are also corrected for an unexpected inter-satellite bias that was determined by Reference Brenner, Zwally, Cornejo, Saba and Sawaya-LacosteBrenner and others (2000) from analysis of crossover differences acquired during the 12 months of overlapping operation of ERS-1 and -2.
In their analysis of satellite radar altimeter data from ERS-1 for 1992–96, Wingham and others (1998) reported that the strongly correlated (correlation coefficient 4 0.7) changes between backscatter power and elevation existed almost everywhere over East Antarctica, causing spurious changes in elevation. They made the correction by subtracting the product of the corresponding gradient and the backscatter-power change. We recently carried out a more comprehensive investigation on the correlations over all Antarctica and Greenland. Our analysis demonstrated that the dH/dt and dAGC/dt is highly correlated (automatic gain control (AGC) is taken as a measure of the backscatter power here) over most areas of Antarctica and Greenland. Therefore, corrections made to the data used elevation-change time series according to the best fit of linear relationships between the 90 day changes in AGC and elevation at 50 km grid points over the 8 years.
3. Model-Derived Annual Amplitude
3.1. Key equations of the model
We use the numerical elevation–densification model developed by Reference Zwally and LiZwally and Li (2002) to derive the steady-state annual amplitudes. This model is based on a semi-empirical densification law for dry snow given by Reference Herron and LangwayHerron and Langway (1980):

Equation (1) indicates that the densification rate dp/dt is governed by accumulation rate A (representing the overburden pressure change) and firn temperature T. According to ice-crystal growth and deformation laboratory experiments (Reference JackaJacka and Li, 1994), Reference Zwally and LiZwally and Li (2002) made a modification by incorporating the temperature-dependent rate constant K0(T) for densification and activation energy E(T) for grain growth in the Arrhenius-type K{T) function:

Both parameters K0 and E are commonly taken as constants. An empirical parameter β is introduced to account for the difference between crystal growth and firn-densification processes as defined by

where K0G(T) are the rate constants for the crystal-growth process. β is an adjustable value to allow a modeled density profile in agreement with the field data.
The vertical velocity Vfc due to firn compaction from surface to a depth z is given by integral of densification rate,

At steady state, assuming constant accumulation rate and vertical ice-flow velocity, the surface-elevation change dh/dt in polar ice sheets is then determined by the vertical velocity Vfc due to firn compaction. The numerical treatment for the derivation of dh/dt is described in detail in Reference Zwally and LiZwally and Li(2002).
Incorporating the temperature-dependent rate constant and activation energy into the constitutive equation (Equation (1)) for firn densification significantly increased the sensitivity of the densification rate to temperature. As a result, the temperature-induced seasonal variation in firn densification, and thus the modeled amplitude of surface elevation change, increased to match more closely the observed seasonal amplitude at the summit location.
3.2. Model input
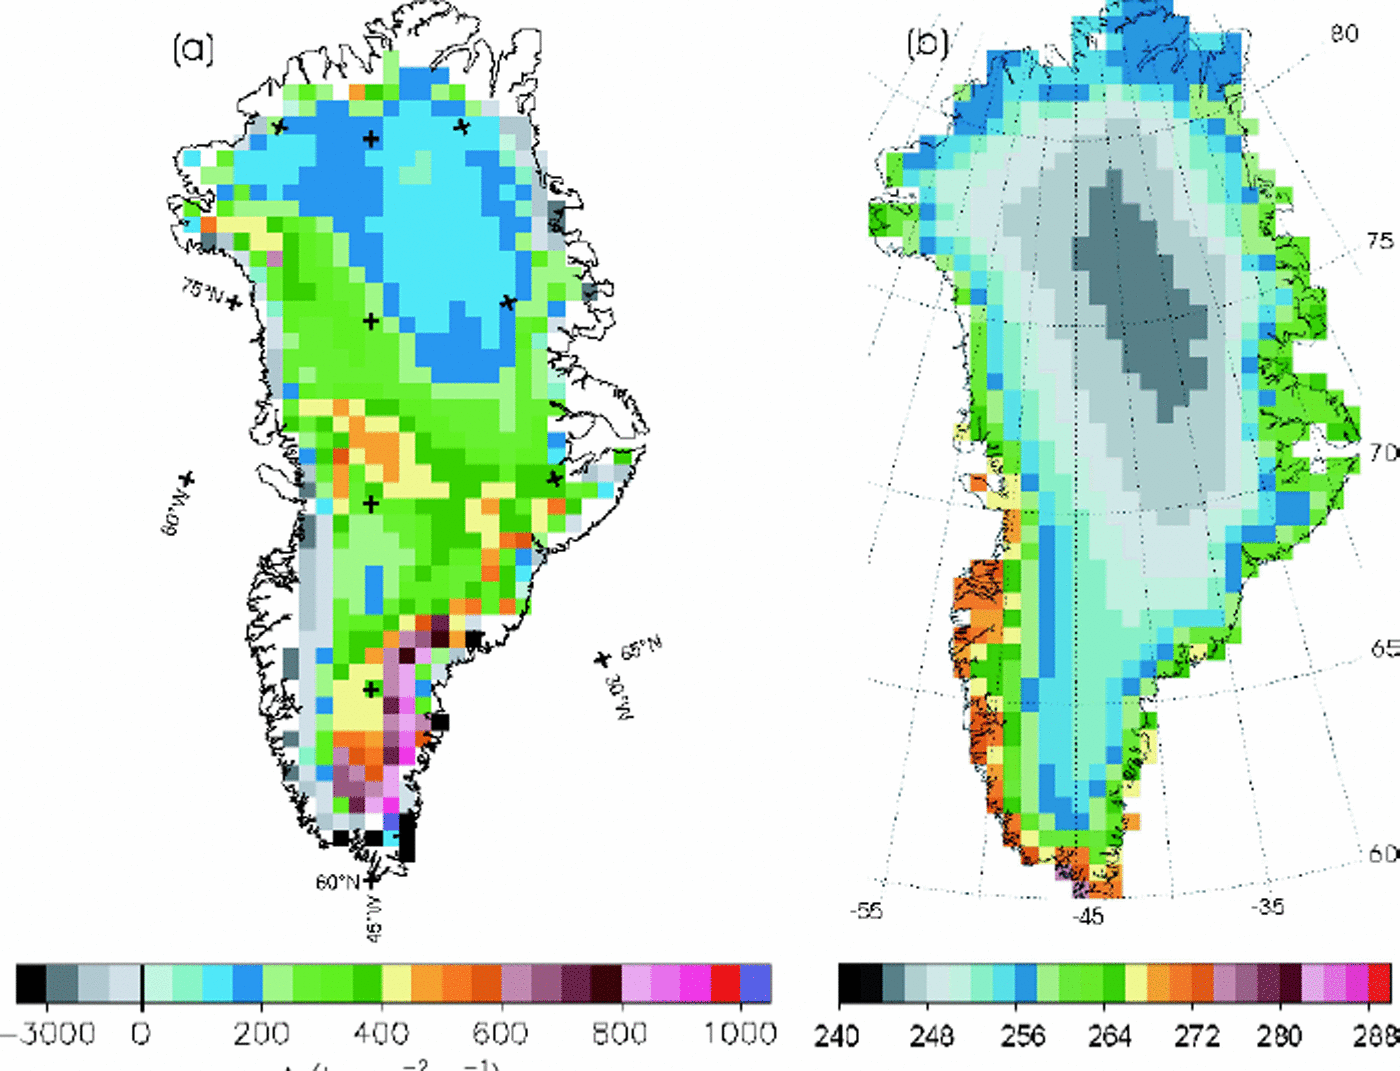
The model inputs are the accumulation rate and the surface air temperature. We use the 50 km grid maps of annual mean accumulation rate for Greenland (Fig. 1a) given by Reference Zwally and GiovinettoZwally and Giovinetto (2000). The surface temperature is derived from annual mean temperature, Tm, derived from satellite infrared data (Fig. 1b) and maximum surface temperature assuming a sinusoidal variation during the year. To determine the seasonal amplitude of the surface temperature, we analyze data from 12 AWSs over Greenland (Reference Steffen, Box and EstupinenSteffen and others, 1999) and derive maximum daily mean temperature as a function of latitude and elevation. The best linear-fit relation is:
Maps showing the distributions of (a) accumulation rate A given by Reference Zwally and GiovinettoZwally and Giovinetto (2000) and (b) annual mean surface temperature Tm from satellite infrared data (personal communication from H. J. Reference Zwally and LiZwally, 2002) over Greenland ice sheet.

where Tmax is the maximum daily mean surface temperature (°C), L is latitude (degrees) and H is elevation (m). The peak-to-peak seasonal amplitude is taken to be the two times difference between Tmax and Tm.
Examination of AWS data shows that the maximum summer temperature might be close to or warmer than the melting point in some areas. Since the model can only be applied to dry snow, the seasonal amplitude is limited to a maximum temperature of –0.5°C. The effect of diurnal temperature variations, discussed in Reference Zwally and LiZwally and Li (2002), is not included because of the difficulty of estimating the spatial variation of the diurnal amplitude from available data. The density of the snow added at the surface in the model is 0.3 for all locations. The time-step for the numerical calculation is 1 day, and 1/365 of the annual accumulation is added at each time-step.
3.3. Model calibration and results
The validity of any densification model rests on the agreement between modeled and observed density profiles. Reference Zwally and LiZwally and Li (2002) introduced an empirical parameter β (ratio of rate constant for grain growth and densification, Equation (3)) to account for the possible differences in rate constants between grain-growth and densification processes. The value β = 8 gave the best match of the density profile for the summit of Greenland. In this study, we model density profiles at all 12 AWSs and adjust the value of β to best match the density profiles. As examples, the modeled density profiles at one site (GITS), with a relatively high accumulation rate and temperature, and another site, North Greenland Icecore Project (North GRIP), with low values of these parameters, are shown in Figure 2a and d. For these profiles, the model was run for longer than 100 years to reach a firn depth of about 80 m and obtain the match between the modeled and observed density profiles.
Examples of modeled density variation with depth (a, c) and the corresponding evolution of the amplitude (b, d) for two sites with high (GITS (a, b)) and low (North GRIP (c, d)) surface temperature and accumulation rate. Field density data (crosses) are also plotted with the modeled density profile for comparison. Values of β, annual mean temperature and accumulation rate are also shown.

The results show that β varies with the annual mean temperature (Fig. 3), which may indicate that the temperature dependence of densification is not fully accounted for in the temperature dependence of E(T) and K(T) in Equation (2). Therefore, we use the variation of β with mean annual temperature, as shown by Figure 3, as an empirical calibration to model the density profiles and the amplitudes of the seasonal elevation changes over the study area.
Variations of pas afunction ofannualmean temperature Tm at eight AWSs over Greenland. The name ofeach AWS is indicated beside each data point in the graph (cf. Reference Steffen, Box and EstupinenSteffen and others, 1999).

The seasonal amplitude of the surface elevation change is mainly due to densification within the top several meters of the firn (Reference Zwally and LiZwally and Li, 2002). For this reason, the seasonal amplitude of the surface elevation approaches an asymptotic value after only about 3–5 model years, as shown in Figure 2b and d. Therefore, to calculate the spatial distribution of the seasonal amplitude, the model is run at each location for 15 years to obtain the asymptotic value.
4. Discussion
The spatial distribution of the amplitude from the densification model is shown in Figure 4a. The modeled amplitudes mostly decrease from west to east and from south to north. This modeled spatial variation is a function of the tendency of both model inputs (temperature and accumulation) that also decrease in these directions. The minimum amplitude is in the north-central area where both the temperature and accumulation rate are very low. The largest amplitude occurs along the southwest side due to the higher temperature and accumulation rate. These same spatial characteristics are also shown in estimates of the observed amplitudes from the altimeter data calculated using several methods (Fig. 4b–d).
Distributions of modeled and observed seasonal surface elevation change over the Greenland ice sheet where annual mean surface temperature Tm < –23° C. (a) Model estimated amplitude of H(t); (b) amplitude from the linear-sine fit with 1 year frequency to the observed H(t) data from ERS-1/-2 for 1992–2000; (c) standard deviation from the observed H(t) data; and (d) amplitude from the linear-sine fit with three frequencies to the observed H(t) data.

Several methods are used to estimate the observed amplitude, for two reasons. First, the modeled amplitude is not symmetrical and is not well described by a seasonal sine function. As described by Reference Zwally and LiZwally and Li (2002), owing to the highly non-linear dependence of the densification rate on firn temperature, the variation of the surface elevation change is not symmetrical during the year despite the use of a sinusoidal surface air temperature. Most of the compaction occurs in about 3 months during the hottest season while during the other period the surface continues to build up. Secondly, the observations have some significant interannual variations in elevation as a result of interannual variations in both temperature and precipitation (Reference Zwally and LiZwally and Li, 2002).
Our standard analysis of the altimeter time series fits a multivariate linear and sine function to the H(t) time series to obtain the linear trend and the amplitude and phase of the seasonal cycle. The seasonal amplitude is shown in Figure 4b. Figure 4c shows the standard deviation of the measurements about the linear trend, which is an indication of the variability regardless of the seasonality. To attempt to match the asymmetry inherent in the modeled amplitude, we have performed a Fourier analysis of a 90 day averaged steady-state elevation time series, computed from the model, to derive the three frequencies with the highest power (containing 72% of the total power). We then make a multivariate linear and three-sinusoidal-frequency fit to the altimeter time series. Figure 4d shows the average of the amplitudes for the three sine terms from the fit.
In terms of the spatial distributions, comparisons between Figure 4a and b–d show the clear similarity between spatial patterns of the modeled and observed results. All diagrams (Fig. 4a–d) show that the magnitude of the variation systematically decreases from west to east and from south to north. The minimum amplitude occurs in approximately the same north-central location in all figures.
Correlations between the modeled amplitudes and the three estimates of the observed amplitudes for all the grid-points are shown in Figure 5a–c. The lowest correlation (R = 0.29) is given for the amplitude of the linear-sine fit with 1 year frequency (Fig. 5a), and the slope of 0.45 is the smallest. The best correlation with the model is given by the standard deviation of 0.84 in Figure 5b. However, the values tend to be larger than the model (slope = 1.5), especially toward the southwest, perhaps due to the inclusion of interannual variability in the standard deviation calculation. Although the correlation (R =0.66) for the three-frequency fit (Fig. 5c) is lower than for the standard deviation, the agreements of the spatial patterns and the magnitudes of the amplitude with the model appear better for the three-frequency fit (slope = 0.7). Also for the three-frequency fit, the values in the southwest corner are in better agreement with the model, in contrast to the rather anomalous values there for both the single-frequency fit and the standard deviation in that region.
Comparison between model-derived amplitude of H(t) and radar-altimetry (ERS-1/-2) observed: (a) amplitude from the linear-sine fit with 1year frequency, (b) standard deviation, and (c) amplitude from three-frequency linear-sine fit to the H(t) data, during 1992–2000 for the region of the Greenland ice sheet where the annual mean surface temperature Tm < –23° C. The solid line is the best linear fit, together with the correlation coefficient R and slope as indicated.

5. Conclusions
The primary purpose of this analysis is to extend our previous model and data comparison from the summit region over the mostly dry-snow zone of Greenland. Although the agreements in pattern and magnitude between the model and observations are good, the approximations made in the model may account for some of the residual differences. First, the interannual variability in both accumulation and temperature was excluded due to lack of data on these variables. There is also the assumption that the accumulation is evenly distributed throughout the year. And, as shown in Reference Zwally and LiZwally and Li (2002), inclusion of the diurnal temperature variation in summer increases the amplitude somewhat and would therefore increase the slope of the three-frequency fit toward unity.
In both the model and the observation, the magnitude of the seasonal amplitudes decreases from west to east and from south to north, dominated by both the accumulation and surface temperature distributions. The agreement reconfirms the importance of firn densification in the interpretation of short-term variations observed by altimeter measurements.



