


Introduction
Changes in the Arctic Earth System (e.g. decreased ice extent and thickness) have been reported, and in September 2012 the lowest ice extent on record was observed (Reference ParkinsonParkinson and Comiso, 2013). As sea-ice extent decreases and freshwater volume increases, the biogeochemical processes will change. As a consequence, the marine environment, vertical carbon transport and carbon dioxide (CO2) exchange between the atmosphere and ocean will all be altered.
Processes in the sea ice affect the CO2 system (or carbonate system) within the sea ice and at the interfaces with the air and the underlying water (e.g. Reference DeLille, Jourdain, Borges and DeLilleDeLille and others, 2007; Reference Rysgaard, Glud, Sejr and BendtsenRysgaard and others, 2007; Reference Nomura, Takatsuka, Ishikawa, Kawamura, Shirasawa and InoueNomura and others, 2009; Reference Fransson and ChiericiFransson and others, 2011,Reference Fransson2013; Reference MillerMiller and others, 2011a,b). Brine rejection transporting chemical substances between the atmosphere and water is important for CO2 transport from the atmosphere to deeper layers of water (e.g. Reference Rysgaard, Glud, Sejr and BendtsenRysgaard and others, 2007; Reference Else, Papakyriakou, Galley, Drennan and ThomasElse and others, 2011). Brine is transported within the sea ice. It is transported downwards due to gravity and upwards at ice formation due to a freezing ice layer near the bottom. This reduces the permeable channels and hence squeezes brines upward. Frost flowers are sometimes formed in this process, as the brine produces a brine skim on the ice surface (Reference PerovichPerovich and Richter-Menge, 1994; Reference Alvarez-Aviles, Simpson, Douglas, Sturm, Perovich and DomineAlvarez-Aviles and others, 2008). Frost flowers are crystalline structures that form on new sea ice when the air, which is supersaturated with water vapour, condenses at the ice surface. They carry high concentrations of chemical substances, gases, bacteria and salts (e.g. Reference DemingDeming, 2010; Reference DouglasDouglas and others, 2012; Reference FranssonFransson and others, 2013; Reference GeilfusGeilfus and others, 2013; Reference GranforsGranfors and others, 2013) and have a 40% larger surface area than sea ice (Reference Domine, Taillandier and SeverinDomine and others, 2005), promoting gas exchange with the atmosphere. Frost flowers are easily destroyed by wind or blowing snow and consequently only have a brief life span of a few days (e.g. Reference DemingDeming, 2010).
The importance of sea ice for the CO2 system characteristics in the underlying water has been shown by Reference FranssonFransson and others (2013). Changes in the underlying water will occur during the sea-ice season. This is due to the increased CO2 in brine and depletion in ∆ T compared to C T due to CaCO3 precipitation during ice freezing (Rysgaard and others, 2007, 2013; Reference Fransson and ChiericiFransson and others, 2011, Reference Fransson2013) and the excess ∆ T in relation to C T and salinity during ice melt. Solid CaCO3 in the form of ikaite has previously been found in Arctic sea ice (Reference DieckmannDieckmann and others, 2010; Reference RysgaardRysgaard and others, 2012, Reference Rysgaard2013; Reference NomuraNomura and others, 2013). When solid CaCO3 precipitates in the sea ice, CO2 is released to the aqueous phase, and when it dissolves, CO2 is consumed:

The solid CaCO3 may be left in the ice until the onset of melt, during melt or when the ice becomes porous enough to release the CaCO3 to the underlying water (e.g. Reference LyakhinLyakhin, 1970). This (intermittent) storage changes the ratios between the CO2 system parameters and salinity, and changes the vertical carbon fluxes and ice–air CO2 gas flux (e.g. Reference FranssonFransson and others, 2013). Ice–air CO2 gas fluxes were previously estimated in Arctic sea ice and showed that CO2 escaped from the ice to the atmosphere during sea-ice formation (Reference Papadimitriou, Kennedy and KattnerPapadimitriou and others, 2004; Reference Nomura, Inoue, Toyota and inNomura and others, 2006; Reference Else, Papakyriakou, Galley, Drennan and ThomasElse and others, 2011, Reference Else2012; Reference MillerMiller and others, 2011a,Reference Miller, Carnat and Sutherlandb; Reference Papakyriakou and MillerPapakyriakou and Reference MillerMiller, 2011; Reference RysgaardRysgaard and others, 2012; Reference FranssonFransson and others, 2013).
It has been demonstrated that biological processes (e.g. primary production and bacterial respiration) are responsible for the variability of the sea-ice CO2 system (e.g. Reference Fransson and ChiericiFransson and others, 2011, 2013). In winter, bacterial respiration is an important process for the production of CO2 at the bottom of the ice, causing an increase in C T and CO2 gas flux from the ice (Reference FranssonFransson and others, 2013). In spring, primary production in the bottom ice consumes CO2, causing a decrease in C T, which results in CO2 uptake by the ice from the surrounding environment (Reference FranssonFransson and others, 2013).
In this study, we investigate the development of the CO2 system in young sea ice, focusing on the effect of sea-ice processes in the role of CO2 exchange at the ice/air interface during a 13 day interval in Kongsfjorden, West Spitsbergen, Svalbard. To our knowledge, this is the first CO2 system study performed in a fjord of Spitsbergen. We present: (1) the evolution of the CO2 system of young sea ice; (2) an estimate of the effect of the biogeochemical processes (e.g. bacterial and primary production and CaCO3 precipitation/dissolution); (3) estimates of CO2 gas fluxes at the ice/air interface; and (4) a discussion of the importance of frost flowers for CO2 transport from the ice to the atmosphere.
Study Area
The ice study was carried out between 21 March and 2 April 2010, in the Thiisbukta Bay area in Kongsfjorden, ∼500m from Ny-lesund, West Spitsbergen, at 78.927° N, 11.901° E (Fig. 1). The total surface area of the bay is ∼10 000 m2 (Fig. 2a). The thickness of the young landfast sea ice (referred to as young ice) was 0.27 m at the start of the study and was formed by freezing of pancake ice (Fig. 2a). Throughout the study, the young ice was void of snow, but frost flowers occasionally formed near the study area (Fig. 2b). On a few occasions, we sampled thin pancake ice (PCI; newly formed sea ice, 0.04 m) near Thiisbukta (TB). In addition to TB sea ice, on 28 March we sampled thicker landfast sea ice (0.42 m thick) in Engelskbukta (EB; 78.832° N, 11.895° E; Fig. 1), situated 10 km (flying distance) from Ny-lesund on the other side (southern part) of the Brøgger Peninsula (Fig. 1).
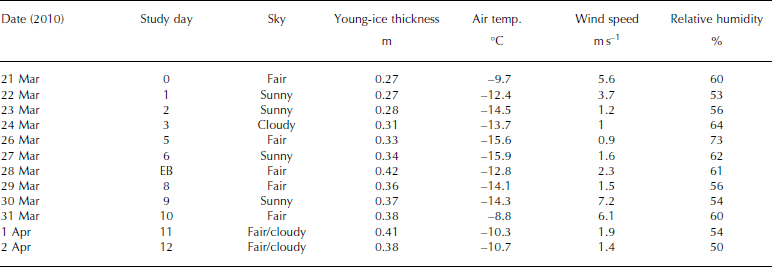
The average daily air temperature varied between -9°C and -16°C. The lowest temperature was recorded on 27 March and the highest on 31 March (Table 1). The average daily wind speed varied between 1 and 6 ms–1. The highest wind speed was recorded on 31 March (data courtesy of Norwegian Meteorological Institute). The measuring site is located 8ma.s.l. and 570 m from the TB study area. The light conditions, obtained from our own measurements of photosynthetically active radiation (PAR; 400-700 nm), varied between zero (during all the nights) and the maximum value of 800 μmol photons m–2s–1 on 26 March, At the end of the study, due to cloudy conditions this dropped to 350-400 μmol photons m–2s–1 (Table 1). In the sea ice, the radiation measurements of incident PAR showed that 8% remained at a depth of 0.35 m (at midday).
Map of the study site at Thiisbukta (78.927° N, 11.901° E) and location of sampling for young landfast sea ice, brine, under-ice water, frost flowers and newly formed pancake ice. Landfast sea ice and brine sampling at Engelskbukta (78.832°N, 11.895°E) is denoted as EB on the map.

Photographs showing (a) the Thiisbukta site, and (b) the sampling of newly formed frost flowers (magnified frost flowers picture included).

Sampling dates of young landfast sea ice, brine and under-ice water, ice thickness of young ice, and meteorological data (mean air temperature, mean wind speed and mean relative humidity) from Ny-lesund weather station (8 m a.s.l.) at the study site in Thiisbukta (78.927° N, 11.901° E), and date for sampling thicker landfast sea ice at Engelskbukta (EB; 78.832° N, 11.895° E). EB is located on the other side of the Brøgger Peninsula 10 km from Ny-lesund (flight distance). See Figure 1 for map location. Note that under-ice water (0–2 m) was collected parallel to sea-ice sampling. There was no snow cover at the site and no precipitation during the study
Methods
Sampling of bulk sea ice, brine, frost flowers and underlying water
During the 13 day study, we collected young ice cores for carbonate chemistry on 11 occasions (21, 22, 23, 24, 26, 27, 29, 30 and 31 March and 1 and 2 April 2010; Table 2 ). Samples of microalgal and heterotrophic bacterial abundances and activities in the young ice were collected on five occasions (21, 23, 26, 29 and 31 March 2010). Additional ice-core sampling of ice in Engelskbukta and pancake thin ice was performed during the study. Sea-ice cores were sampled using a stainless-steel ice-core drill (diameter 0.12 m) with a power head. The ice cores were divided into 0.05 m sections, which were individually placed into Tedlar© gas-sampling bags. After carefully removing surrounding air from the bags using a hand-operated vacuum pump (Nalgene©), the bulk sea-ice samples (hereafter referred to as sea ice) were slowly thawed in darkness for ∼24 hours to reach a temperature varying between 4°C and 10°C. No solid calcium carbonate (CaCO3) was observed in our samples. This is likely because on some occasions the sample temperature exceeded 4°C. The resulting volume of the melted sea ice was ∼0.5 L. Microbiological abundance and activity were sampled from separate ice cores collected within a 0.2 m radius of the cores sampled for chemical analysis. The ice cores were immediately wrapped in black plastic to protect the algae from light stress, and were cut into 0.05 m sections for further processing at 0°C.
Physical and carbonate system properties of young landfast sea ice in Thiisbukta

In parallel to ice-core sampling, brine samples were collected (Table 3) in 0.1 L borosilicate glass bottles (airtight) from partially drilled holes (known as sackholes) in young sea ice (hereafter referred to as YI). We refer to these samples as brine. The brine, which had seeped into the sackhole at different depths in the ice (0.1-0.2 m), was collected with a plastic syringe and PVC tubing after ∼30-40min and transferred to the bottles. Due to the cold sea-ice conditions, the volumes of brine were usually insufficient for analysis and studies of the full CO2 system. Further, we could only collect brine samples on three occasions during the study. The sackholes were covered with a plastic isolated lid to minimize gas exchange with the atmosphere and prevent freezing of the brine. During our study, the seeping time for brine was sometimes >30 min to allow for sufficient sample volume (0.5-0.1 L). Consequently, the occurrence of some gas exchange cannot be excluded.
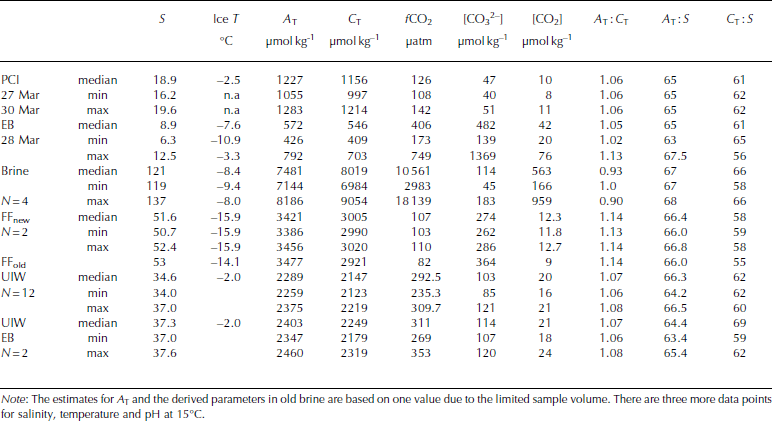
Physical and CO2-system properties in pancake ice (PCI), landfast sea ice in Engelskbukta (EB, thicker ice), brine (Brine), frost flowers (FFnew, FFold), and under-ice water under young ice in Thiisbukta (UIW) and at Engelskbukta (EB). N denotes number of samples and n.a. stands for not applicable
Under-ice water (UIW) was collected in 0.25 L borosilicate glass bottles on every occasion when sea-ice cores were sampled, using a glass bottle on a (custom-built) shaft immersed through the borehole. Although debris from the ice was removed before sampling, some debris may be left in the water collected. The water and brine samples were immediately placed in an insulated cooling box to prevent them from freezing.
Frost flowers were sampled ∼200m from our study site on 27 and 28 March using a Teflon ladle from a surface area of 1 m2 for each sample. The frost flowers were sampled (duplicate) as soon as they formed, and again 20 hours later (one sample). The samples were packed in Tedlar© sampling bags, and the air was gently removed using the hand-operated vacuum pump. After removing the surrounding air from the bags, the samples were thawed in darkness. The melted volume was ∼1 L.
Sea-ice temperature was measured on site immediately after the ice core was recovered, at 0.05 m intervals using a digital thermistor (Amadigit) with an accuracy of ±0.1°C. The holes for the temperature measurement were carefully drilled manually with a clean stainless-steel hand drill to avoid additional heating from the drill. The temperature of brine was measured in the sackhole before it was transferred to a sample bottle. UIW temperature was measured in the sample bottle immediately after sampling using the same handheld thermistor probe (Amadigit).
Data and analysis
After melt of the bulk sea-ice and frost flower samples, we measured the CO2 system parameters, nutrients, bacterial and algal activity and salinity in the melted samples. All sea-ice and frost-flower measurements are hereafter referred to as concentrations and activities in melted samples.
CO2 system
We measured the CO2 system (also referred to as the carbonate system) parameters of total alkalinity (∆ T) and pH in melted sea ice, brine, frost-flower melt and UIW, using the same method as Reference Fransson and ChiericiFransson and others (2011). ∆T and pH in sea ice and frost flowers referred to in this study were always measured in liquid phase (sea ice and frost-flower melt). AT was determined by potentiometric titration in an open cell (Reference DicksonDickson and others, 2007) with ∆T measurement precision of ± 3 μmol kg–1. The pH was determined spectrophotometrically using a 2 mM solution of the sulphonaphtalein dye m-cresol purple (Sigma-Aldrich®), as an indicator valid for water 3 0 >S>37 (Reference ClaytonClayton and Byrne, 1993). The accuracy of the pH measurements is determined by the accuracy of the determination of the equilibrium constants of the dye, which is ∼±0.002 (Reference DicksonDickson, 1993). We used the same indicator batch for the whole study, and studied pH changes between days, so the systematic error due to indicator impurities (Reference Yao and LiuYao and others, 2007) would induce the same error for all measurements. For cold-ice brines, the salinity usually exceeds 40, reducing the accuracy of the measurements. However, Reference Hare, Wang, Barber and RysgaardHare and others (2013) investigated the deviation regarding high salinities and low temperatures using m-cresol purple, and found that the natural variability in sea ice and brine is larger than the analytical uncertainty. The samples were thermostatted to 15°C prior to analysis. Samples were measured in a 0.01 m cell. The analytical precision was estimated to ±0.001 pH units, which was determined by a series of ten analyses of a sample. The pH of the indicator solution was measured daily using a 0.0002 m cell. The precision was checked by triplicate analysis of one sample every second day. The perturbation of sea-water pH caused by the addition of the indicator solution was calculated and corrected for using the method described by Reference Chierici and FranssonChierici and others (1999).
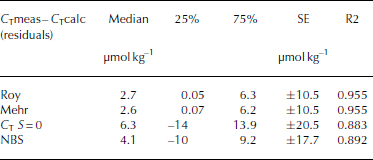
The AT and pH values, measured at 15°C (pH15), salinity and temperature along with the CO2 calculation program CO2SYS (Reference Pierrot and LewisPierrot and others, 2006) were used to calculate total inorganic carbon (C T (μmol kg-1), sometimes referred to as DIC or TIC), carbonate ion concentration ([CO3 2–]), CO2 concentrations ([CO2]; μmolkg–1), partial pressure of CO2 (p CO2) and fugacity of CO2 (fCO2). All calculated CO2 system parameters mentioned in this study are derived from AT and pH measured in liquid (melted) phase. The CO2 system dissociation constants (K1 and K2) estimated by Reference RoyRoy and others (1993, 1994) were used, since an internal consistency study showed these were the most suitable constants for cold waters (Reference Chierici and FranssonChierici and Fransson, 2009). The calculations were performed on the total hydrogen ion scale (pHT) using the HSO4 - dissociation constant of Reference DicksonDickson (1990). In order to investigate the error and variability introduced by using pH measured in melted bulk sea ice, we performed an internal consistency exercise using a comparison between the calculated C T (C Tcalc) from measured ∆T and pH1 5 and the measured C T (C Tmeas). The data were obtained from analyses of melted ice, sampled in Kongsfjorden in April 2013. The CO2 system consistency check was performed using four different sets of equilibrium constants of K1 and K2: (1) Roy and others (1993, 1994; hereafter referred to as Roy); (2) Reference Mehrbach and CulbersonMehrbach and others (1973) refit by Reference DicksonDickson and Millero (1987) (hereafter referred to as Mehr); (3) Reference MilleroMillero (1979; hereafter referred to as Millero); and (4) on the GEOSECS NBS scale (from Reference Mehrbach and CulbersonMehrbach and others, 1973; hereafter referred to as NBS). Figure 3 shows a box-and-whisker plot with the resulting difference between C Tmeas and the calculated C T based on the four sets of constants (C Tmeas-C Tcalc). We found that the C T values based on the Roy and Mehr constants showed the lowest median deviation from the measured C T of ∼2.7μmol kg–1 (Table 4). They also had the lowest standard error (SE) between the measured and calculated values and the best coefficient of determination (R2). K1 and K2 determined by Millero at zero salinity had the largest median deviation from measured CT of ∼6.3 μmol kg–1 (Table 4). In addition, the results from the NBS scale showed a larger median deviation from the measured than the constants estimated based on the sea-water salinity range. This means that by using the Roy constants, the median deviation in the calculated C T was ∼3 μmol kg–1 and the SE was ±11 μmol kg–1 (Table 4). This standard error of the calculated C T was considered insignificant in relation to the natural variability in sea ice.
The residual (μatm) between the measured C T (C Tmeas) in bulk sea ice and the calculated CT (C Tcalc) from the four sets of constants: Roy denotes the constants by Reference RoyRoy and others (1993); Mehr denotes the constants by Reference Mehrbach and CulbersonMehrbach and others (1973), refit by Reference DicksonDickson and Millero (1987); C T S=0 denotes the constants by Reference MilleroMillero (1979) at zero salinity (S = 0); and NBS denotes the constants by the GEOSECS NBS scale from Reference Mehrbach and CulbersonMehrbach and others (1973). The 25th and 75th percentiles show the limits where 2 5% and 75% of the residuals fall below. The non-outlier range isthe range of values that fall below the upper outer limit of ± 1 . 5 x the height of the box (H).

Summary of the resulting median, values at the 25th and 75th percentiles, the standard error (SE) and the coefficient of determination from the regression analysis (R2) of the residual (μatm) between the measured C T (C Tmeas) in bulk sea ice and the calculated C T (C Tcalc) from each of the four sets of constants: Roy denotes the constants by Reference RoyRoy and others (1993); Mehr denotes Reference Mehrbach and CulbersonMehrbach and others (1973), refit by Reference DicksonDickson and Millero (1987); at zero salinity (C T S=0) from Millero (1979); and on the GEOSECS NBS (NBS) scale from Reference Mehrbach and CulbersonMehrbach and others (1973). The 25th and 75th percentiles show the limits where 25% and 75% of the residuals fall below
Dissolved inorganic nutrients
Dissolved inorganic nutrients of nitrate ([NO3–]), phosphate ([PO4 3–]) and silicic acid ([Si(OH)4]) were measured on the melted samples, brine, frost-flower melt and UIW. Acid-washed plastic vials were used for sampling. Samples were filtered (0.45 μm) and frozen at-20°Cfor post-analysis at the Swedish Meteorological and Hydrological Institute, Gothenburg. The nutrients were determined by colorimetric detection and analysed on an auto-analyser using the standard method described by Reference Grasshoff, Ehrhardt and KremlingGrasshoff and others (2009).
Microbiological analysis
In general, all ice processing for microbiological analysis was performed at 0°C. Bacterial carbon production (BCP) was measured in centrifuged brine from bulk ice (and in sackholes). Bacterial production (BP) in the drained brine was determined by (3H)-leucine incorporation (Reference Smith and AzamSmith and Azam, 1992). The detection limit was 0.5 μg C L–1 d – 1 in the samples. Details on the separation of brine and the methodology for microbiological analysis are thoroughly described by Reference GranforsGranfors and others (2013). Sea-ice algae activity and photosynthetic efficiency in the brine were investigated from the maximum quantum yield of photosynthesis (Fv/Fm) using a WATER-PAM chlorophyll fluorometer (Walz Mess- und Regeltechnik, Effeltrich, Germany) and a pulse-amplitude modulated (PAM) fluorometry, respectively. The remaining brine sample was fixed with glutaraldehyde (final concentration 0.1% and 2.5%, respectively) to determine bacterial and microalgal abundance. Samples for bacterial abundance were stored at –80°C for 6 months until analysis, described in Reference GranforsGranfors and others (2013).
Salinity
Salinity and conductivity of the melted sea ice, brine, frost flowers and UIW were measured using a conductivity meter (WTW Cond 330i, Germany) with a resolution and accuracy of ±0.05.
We calculated brine volume fractions (BV) from young-ice salinity (S) and ice temperature (T; °C), according to Reference Frankenstein and GarnerFrankenstein and Garner (1967) derived from Reference AssurAssur (1958):

The ice becomes less permeable as BV decreases (e.g. Reference Golden, Eicken, Heaton, Miner and ZhuGolden and others, 2007; Reference Loose, McGillis, Schlosser, Perovich and TakahashiLoose and others, 2009, Reference Loose2010) and both gas and liquid transport decrease. Ice temperature fundamentally controls the ice porosity (Reference Petrich and EickenPetrich and Eicken, 2010).
Solar radiation
For radiation measurements, a PMA2100 radiometer equipped with a 2-K PMA2132 sensor (Solar Light, Philadelphia, PA, USA) was used to record photosynthetic photon flux (PPF) at 400-700 nm (corresponding to photosynthetic active radiation (PAR)) on the pier at Ny-lesund, i.e. 500 m from the study site. In addition, PPF was measured in ice with a spherical sensor (QSL-2100, internal diameter 1.25 cm, Biospherical Instruments Inc., San Diego, CA, USA). To avoid shading from the instrument, the sensor was deployed at a 45° angle through the ice.
Results
Physical properties in young sea ice, brine and underlying water
The vertical distribution of salinity in the young-ice cores showed a C-shaped pattern, with higher salinity in the top and bottom ice than in the middle parts, which is typical for first-year ice (e.g. Reference MalmgrenMalmgren, 1927; Reference Thomas, Papadimitriou and MichelThomas and others, 2010), ranging between 14 (22 March) and 10 (31 March) in the top 0.05 m (ice/air interface; Fig. 4a) in young ice. In the interior young ice, the salinity decreased from 9 to 6, whereas in the bottom ice (ice/water interface) little change was observed during the 13 day study. The sea-ice temperature increased linearly with depth from top to bottom and was lowest (-10.9°C) in the top ice, in contact with cold air (Fig. 4b), increasing towards the bottom ice, to reach temperatures close to sea-water temperatures (Fig. 4b; Table 2 and Table 3). The coldest ice was observed between 27 and 30 March, when we also recorded the lowest air temperatures.
Vertical and daily distribution of (a) bulk sea-ice salinity, (b) temperature (T; °C) and (c) brine volume fraction (BV) in young landfast sea ice, from 21 March to 2 April 2010; obs and calc denote observed and calculated values, respectively.

The thickness of the young ice varied between 0.27 and 0.41 m, with an increase of ∼0.011 m d–1 (0.14 m increase during the 13 day study) (Table 1). Freeboard was positive throughout the study, suggesting no flooding of the ice, and there was no superimposed ice from melt and refreeze.
BV in the young ice was mostly >0.05, except between 28 March and 1 April, coinciding with the lowest young ice temperatures at depths of 0.05-0.2 m (Fig. 4b and c). These low BV indicated that the mobility of chemical substances (and gases) dissolved in brine was less in the interior ice (BV<0.05; Reference CoxCox and Weeks, 1983; Reference Loose, McGillis, Schlosser, Perovich and TakahashiLoose and others, 2009, 2010) than in the top and bottom ice (BV>0.05).
As the thin pancake ice (<0.04m) formed, ∼45% of the ice salinity was lost (from 34 down to 19), showing a substantial and rapid salinity rejection during the formation (Table 3).
Chemical properties in young sea ice, brine and underlying water
All concentrations for bulk sea ice and frost flowers shown in this and following subsections refer to values in melted samples. Young ice (YI) refers to thinner ice from TB, and EB ice refers to thicker ice from Engelskbukta.
CO2-system evolution
Large variability was observed in all CO2 system parameters (Fig. 5; Table 2 and Table 3). The ∆T and C T of melted samples of young ice (Fig. 5a and b) showed a C-shaped trend each day, similar to salinity, indicating that most of the changes in young-ice C T and ∆T were due to salinity changes. ∆T was highest at the ice/air interface compared to the rest of the ice during the 13 day study. The highest value was measured on 22 March, and ∆T decreased towards the end of the period (Fig. 5b). Between 24 and 26 March, ∆T increased by 120 μmol kg–1from 790 to 910 μmol kg–1. The calculated concentration of CO2 ([CO2]) in melted ice was generally lower in the top ice and higher in the bottom ice, but varied locally on a few occasions (Fig. 5c). [CO3 2–] was highest in the top 0.05 m of the ice and decreased towards the bottom ice (Fig. 5d). In the interior ice, higher [CO2] land lower [CO3 2–] were found between 27 and 30 March (Fig. 5c and d).
Vertical and daily distribution of the properties in melted ice of (a) total alkalinity (A T; μmol kg–1), (b) total inorganic carbon (C T; μmol kg–1), (c) carbon dioxide concentration ([CO2]; μmol kg–1) and (d) carbonate ion concentration ([CO3 2–]; μmol kg–1), in young landfast sea ice from 21 March to 2 April 2010; obs and calc denote observed and calculated values in melted sea ice, respectively.

The values of C T and ∆ T in melted EB ice were similar to those in melted young ice, but [CO3 2–] and [CO2] were almost 200 and 10 times larger, respectively, than in young ice (Table 2). The values of C T, ∆ T and salinity in melted pancake ice (PCI; newly formed thin ice <0.04m) were twice as high (Table 3) as in young ice and EB ice. [CO3 2–] and [CO2] were slightly higher in pancake ice than in young ice, but lower than in EB ice (Table 2). Pancake ice (thin ice) had higher ∆ T, C T and salinity than any of the other melted sea-ice samples in the study (Table 3).
Brine concentrations provide an integrated signal of changes in salinity and chemical substances that occurred over time. In our brine samples, [CO2] was >300 times higher than in melted young ice, whereas [CO3 2–] in brine was of the same order of magnitude as in melted young ice (Table 2 and Table 3). The fugacity of CO2 (fCO2) values in our brine samples was up to 18 000 μatm (1824 Pa) (Table 5).
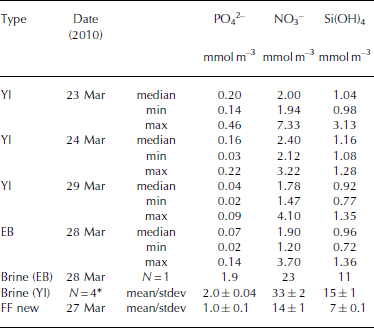
Inorganic nutrients (phosphate (PO4 2–), nitrate (NO3 –), silicic acid (Si(OH)4) in young landfast sea ice (YI), landfast sea ice from Engelskbukta (EB), brine, and frost flower (FF). * denotes that brine values are mean values from four sampling occasions. Minimum and maximum values are denoted min and max, respectively
The salinity, ∆T and CT values of UIW at the EB site were, on average, higher than the UIW values in TB.
Nutrients evolution
In young ice, [NO3–] and [Si(OH)4] did not change significantly during the study, but [PO43–] decreased from 0.2 to 0.04 mmol m– 3 in melted ice during the growth of the young ice (Table 5). The nutrient concentrations in the EB ice were, on average, similar to those in the young ice at the end of the study (Table 5). In brine, the nutrient concentrations were higher than in the melted young ice, with [PO4 3–] 10 times higher and [NO3–] and [Si(OH)4] ∼15 times higher (Table 5). In UIW, the concentrations of all three measured nutrients decreased during the study, with [PO4 3–] decreasing from 1.1 to 0.66, [NO3–] from 14.7 to 8.5 and [Si(OH)4] from 7.0 to 3.9 μM.
Biological properties in sea-ice brines, frost flowers and underlying water
Abundance and activity of heterotrophic bacteria
In all the ice samples, there was a standing stock of heterotrophic bacteria in young ice with bacteria present. The BCP ranged between 0.5 and 9.1 μgCL–1 d –1 during the study. The highest value of BCP (9.1 μgC –1 d–1) was detected on 29 March in the interior of young ice, corresponding to an increase of inorganic carbon by 0.8 μmol Ckg–1 d–1. In the brine from centrifuged bulk ice, the bacterial abundance varied between 7.1 x 1 0 7 and 6.4 x 10⁸ cells L–1. This was of the same order of magnitude as other measurements made in winter Arctic sea ice (Reference Junge and EickenJunge and others, 2004) of 107–109 cells L–1.
In the EB ice, the BCP was higher (up to 14μgCL–1 d–1) than in young ice, with higher values in the top ice and bottom ice. In the frost flowers, the BCP was2.8 μgCL–1 d–1. The BCP in UIW was 1.3 μgC L–1 d–1 on 23 March, with a maximum value of ∼5.0μgCL–1 d–1 on 24 March. It was 1.4 μgCL–1d–1 on 26 March, and decreased towards the end of the study.
Abundance and activity of microalgae
Microalgae were quantifiable in the bottom layer of the young-ice core. The abundances varied between 7.1 x 10⁴ and 8.8 x 1 0 5 cells L–1 in centrifuged brine. The most frequently occurring microalgal genera were pennate diatoms Synedropsis sp., and Fragilariopsis sp., which is typical for ice algal communities. During the study, we measured photosynthetically active algal cells in the young ice. Our estimates of Fv/Fm varied between 0.06 and 0.5. The maximum quantum yield of photosynthesis (Fv/Fm, a measure of the health of the algae) could be measured in the bottom 0.05 m (ice/water interface) of the young ice. The Fv/ Fm was 0.06 at the start on 23 March (bottom 0.05 m) and increased to a maximum of 0.5 on 26 March, likely due to the maximum solar radiation on 26 March.
There were fewer ice algal cells and lower Fv/Fm (0.07-0.25) in the EB bottom ice than the TB young ice. Moreover, the ice algae in the EB thick ice were distributed in the bottom 0.10 m of ice instead of being restricted to the bottom 0.05 m.
Processes driving the CO2 system
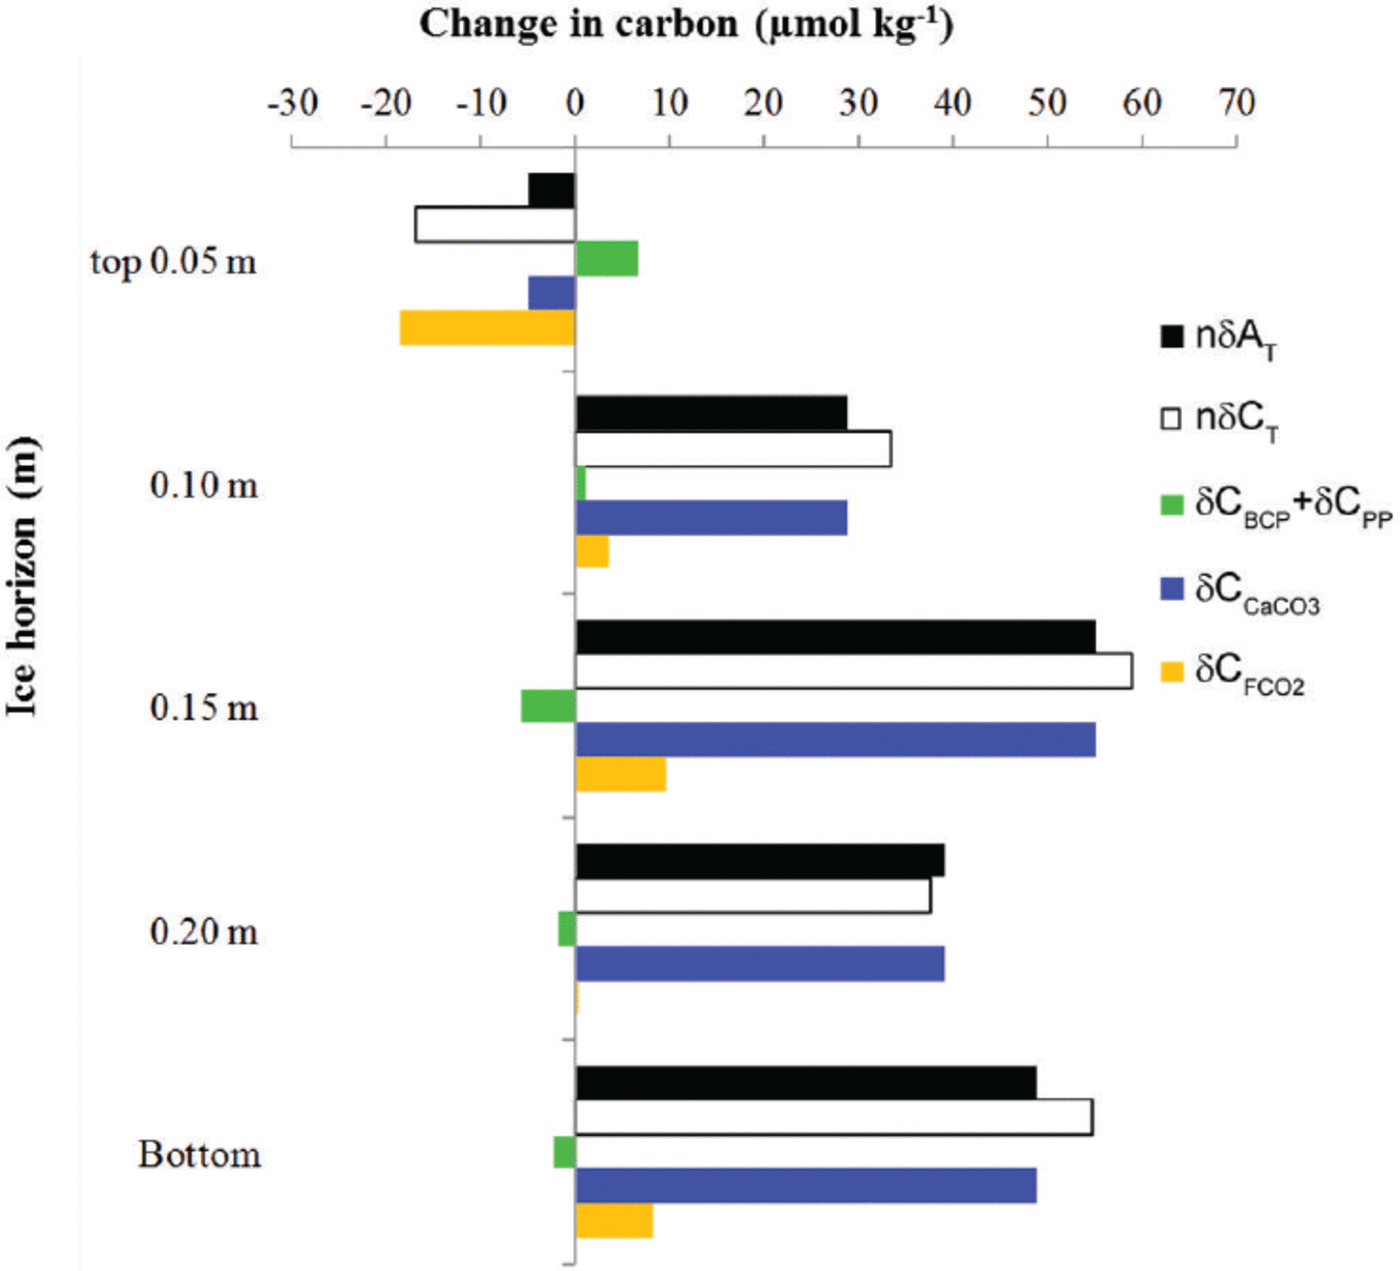
To eliminate the effect of salinity on the changes in young-ice C T and ∆T, we used the mean young-ice salinity (S ice) of 8.8 (following a dilution line; nC = 8.8/S ice C, where C represents young-ice C T, ∆T and nitrate) to obtain salinity-normalized values, hereafter referred to as nδ5C T and nδA T. The nδC T and nδAT values showed a net increase at all ice horizons except in the top 0.05 m of the ice, where both parameters showed a net decrease over the whole study period (Fig. 6). This estimate was based on the difference between the values on 21 March and 2 April (Fig. 6). The main processes driving the changes in nδC T are biological processes such as primary production (5CPP), bacterial carbon production (5CBCP), CaCO3 precipitation and dissolution (δCCaCO3) and CO2 gas flux (δCFCO2)
The change (μmol kg–1) at five different ice horizons in the young ice from top to bottom in salinity-normalized total alkalinity (nAT, black) and total inorganic carbon (nδCT, white). The change in nC T due to processes other than salinity changes is the combined effect of the biological processes of primary production and bacterial-carbon production (SCPP + SCBCP, green) estimated from salinity-normalized [NO3–] change, the effect of calcium carbonate precipitation and dissolution (δCCaCO3, blue) based on nδA T, and CO2-gas flux (δCFCO2, orange). The change was estimated from the start (21 March 2010, day 1) to the end of the study period (2 April 2010, day 13). Positive change denotes a gain in carbon, and negative change a loss of carbon from the ice horizon.

while nδA T is mainly affected by CaCO3 precipitation and dissolution.
To calculate the net effect of biological processes, we used the change in salinity-normalized nitrate concentrations (nδ[NO3-]) converted to carbon equivalents using the stoichiometric carbon and nitrogen ratios of 106.16 after Reference RedfieldRedfield and others (1963). We found significant changes in nδ[NO3–] in the top 0.05 m and in the top 0.15 m young-ice horizons during the study period. In the interior ice (at 0.15 m), we found a net nδ[NO3–] decrease of 0.9 mmol m–3corresponding to a carbon uptake of 6 μmolkg–1 due to primary production (δCPP; Fig. 6). The fact that we observed photosynthetic activity with significant algae abundances (7 x 10⁴ and 8.8 x 10⁵ cells mL–1) implies that such organisms were partly responsible for the variations found in nδ[NO3–] and young ice [CO2] after 25 March (Fig. 5c). The yield was highest in the bottom ice. At the same time as we found a net carbon uptake, we also found the highest measured BCP of 9.1 μgCL–1 d–1 in the interior of the ice (maximum on 29 March 2010), corresponding to an increase in inorganic carbon of 0.8 μmol L–1 d–1. Denitrification by bacteria could also explain the n[NO3 –] decrease (Reference RysgaardRysgaard and Glud, 2004). In the top 0.05 m we found a small but significant net increase in nδ[NO3–] of 1 mmol m–3corresponding to a C T increase of 7μmolkg–1likely due to BCP (δCBCP; Fig. 6).
The sum of the effects of CaCO3 formation and dissolution and CO2 gas flux was obtained by calculating the difference between nδCT and the values from biological processes:

Based on the correction of nδCT due to biological processes (nδCbio), there was nonetheless a net C T loss at the top 0.05 m ice horizon and a larger gain at the 0.15 m ice horizon and at all other horizons (Fig. 6). A similar pattern was found for nδAT (Fig. 6). Between the interior ice and the basal ice, nδA T increased by 40–55 μmol kg–1mostly explained by the effect of CaCO3. We estimated the net CO2 gas flux

resulting in a negative CO2 gas flux (loss of 20 μmolkg–1 melted ice) at the top 0.05 m ice horizon and a positive CO2 gas flux (gain of maximum 10μmolkg–1) in the interior ice and in the bottom ice (Fig. 6). The CO2 loss from the 0.05 m of top ice to the atmosphere was estimated as ∼1 mmol m–2 (or 12 mg C m–2) or 0.08 mmol m– 2 d–1 melted ice.
Frost flowers and ice-air CO2 gas flux
On 26 March the weather conditions were cold with little wind (wind speed of 0.9 ms–1) and an air temperature of -15.6°C. The relative humidity was the highest during the study (73%; Table 3). New thin sea ice and new frost flowers were formed further out in the bay, 200 m from our study site. Elevated concentrations of ∆T (3421 μmol kg–1) and C T (3005 μmol kg–1) were observed in the new frost-flower melt, which were substantially higher than the UIW concentrations but less than in the brine (Table 2). The lower C T in frost-flower melt compared to brine C T means that there was a loss of C T (i.e. CO2) probably before our first sampling. When the frost flowers from the same location were sampled 20 hours later, ∼25% (from 12 to 9μmolkg–1) of the CO2 content in the frost-flower melt had disappeared. The salinity in the frost flowers had changed by 1 after 20 hours, supporting the fact that processes other than salinity changes were affecting the CO2 concentrations and C T (e.g. air-ice CO2 flux). Similar to salinity, ∆T did not change significantly, but [CO3 2–] in the melted frost flowers increased (Table 3), which suggests influence of CO2 loss. Additionally, C T in the frost-flower melt decreased from 3005 μmol kg–1 to 2921 μmolkg–1resulting in a C T loss of 84 μmolkg–1 d–1likely due to CO2 loss to the atmosphere (Table 3). The BCP was 2.8 μgCL–1 d–1 (i.e. 0.23 μmol kg–1 d–1) in the 1 day old frost-flower melt, which was insignificant relative to the uncertainty in the C T analysis. Using salinity-normalized (S = 52) C T for both days during the frost-flower melt, the resulting CO2 loss was 142 μmol kg–1 d–1 (7mmol m– 2 d–1). After frost-flower formation, the life span of the frost flowers at the sampling site was ∼48 hours.
When [CO2] in brine was high, the CO2 loss through frost flowers could have an impact on the atmospheric CO2 concentrations (mainly near the ice surface). Since CO2 easily escapes from the ice when the ice is porous enough (BV>0.05), the frost flowers form an efficient transport path for CO2 from the ice to the atmosphere (e.g. Reference FranssonFransson and others, 2013; Reference GeilfusGeilfus and others, 2013). We used the formulation by Reference FranssonFransson and others (2013) to estimate the C T loss and CO2 outflow from sea ice to atmosphere through frost flowers and brine of Arctic sea ice:


where S FF and Sbrine are the salinity of frost-flower melt (average S = 51) and brine (S=121), respectively. C TFF and C Tbrine are the C T in frost-flower melt (C T = 3000 μmol kg–1) and brine (C T = 9054 μmol kg-1). This gives a C Tcalc of 3816 μmol kg-1), resulting in a maximum CO2 loss (CTout) of 816 μmol kg–1 d–1 (∼40 mmol m–2 d–1) from the ice to the atmosphere, assuming no biological production. The salinity-normalized (S=121) nutrient ([PO4 3–], [NO3–], [Si(OH)4)]) concentrations in new frost flowers were the same as those in brine (Table 5), which supports our assumption that, in our study, no CO2 was consumed associated with primary production. Moreover, since the fCO2 values in both brine and frost-flower melt (Table 2 and 3) were much larger than the atmospheric fCO2 value of ∼394 μatm (39.9 Pa; Ny-lesund 2010), frost flowers show a great potential to act as a CO2 source to the atmosphere.
Discussion
We found that the C T loss from frost flowers was due to a CO2 loss of 40 mmol melted sample mediated by upward-transported brine and by frost-flower formation. Our estimates were similar to the findings by Reference GeilfusGeilfus and others (2013), which estimated a CO2 loss from the ice to the atmosphere of 20-40 mmol m– 2 d–1 melted sample. These estimates indicate the efficient transfer of CO2 by frost flowers and a large potential for CO2 loss during a short period. Moreover, the mean calculated fCO2 in brine was 10 560 μatm (1070 Pa), which was several times higher than the atmospheric values of ∼400 μatm (40.5 Pa), supporting a large potential for a CO2 loss from the ice due to ice dynamics. Using our estimates of CO2 loss by the frost flowers of 0.8 molm– 3 melted sample (800 mmol m–3) and assuming that the frost flowers formed at least on one day (24 hour life cycle) on top of all newly formed spring ice in the Arctic Ocean (area of 14 x 106km– 2 (US National Snow and Ice Data Center, mean sea-ice covered area in April 2010)), we obtain a total CO2 gas flux to the atmosphere of 0.2 x101 to 1.1 x 10¹³ mol C (0.02-0.13 PgC) in one day. This estimate can be compared to the summer net CO2 uptake of 0.1 Pg C a–1 in the Arctic Ocean based on Reference SchusterSchuster and others (2013). However, although it is likely that this is an overestimation, it strongly supports the fact that frost flowers play a large role in the CO2 outgassing from the sea water, and that the role of frost flowers in CO2 air–ice flux needs further investigation.
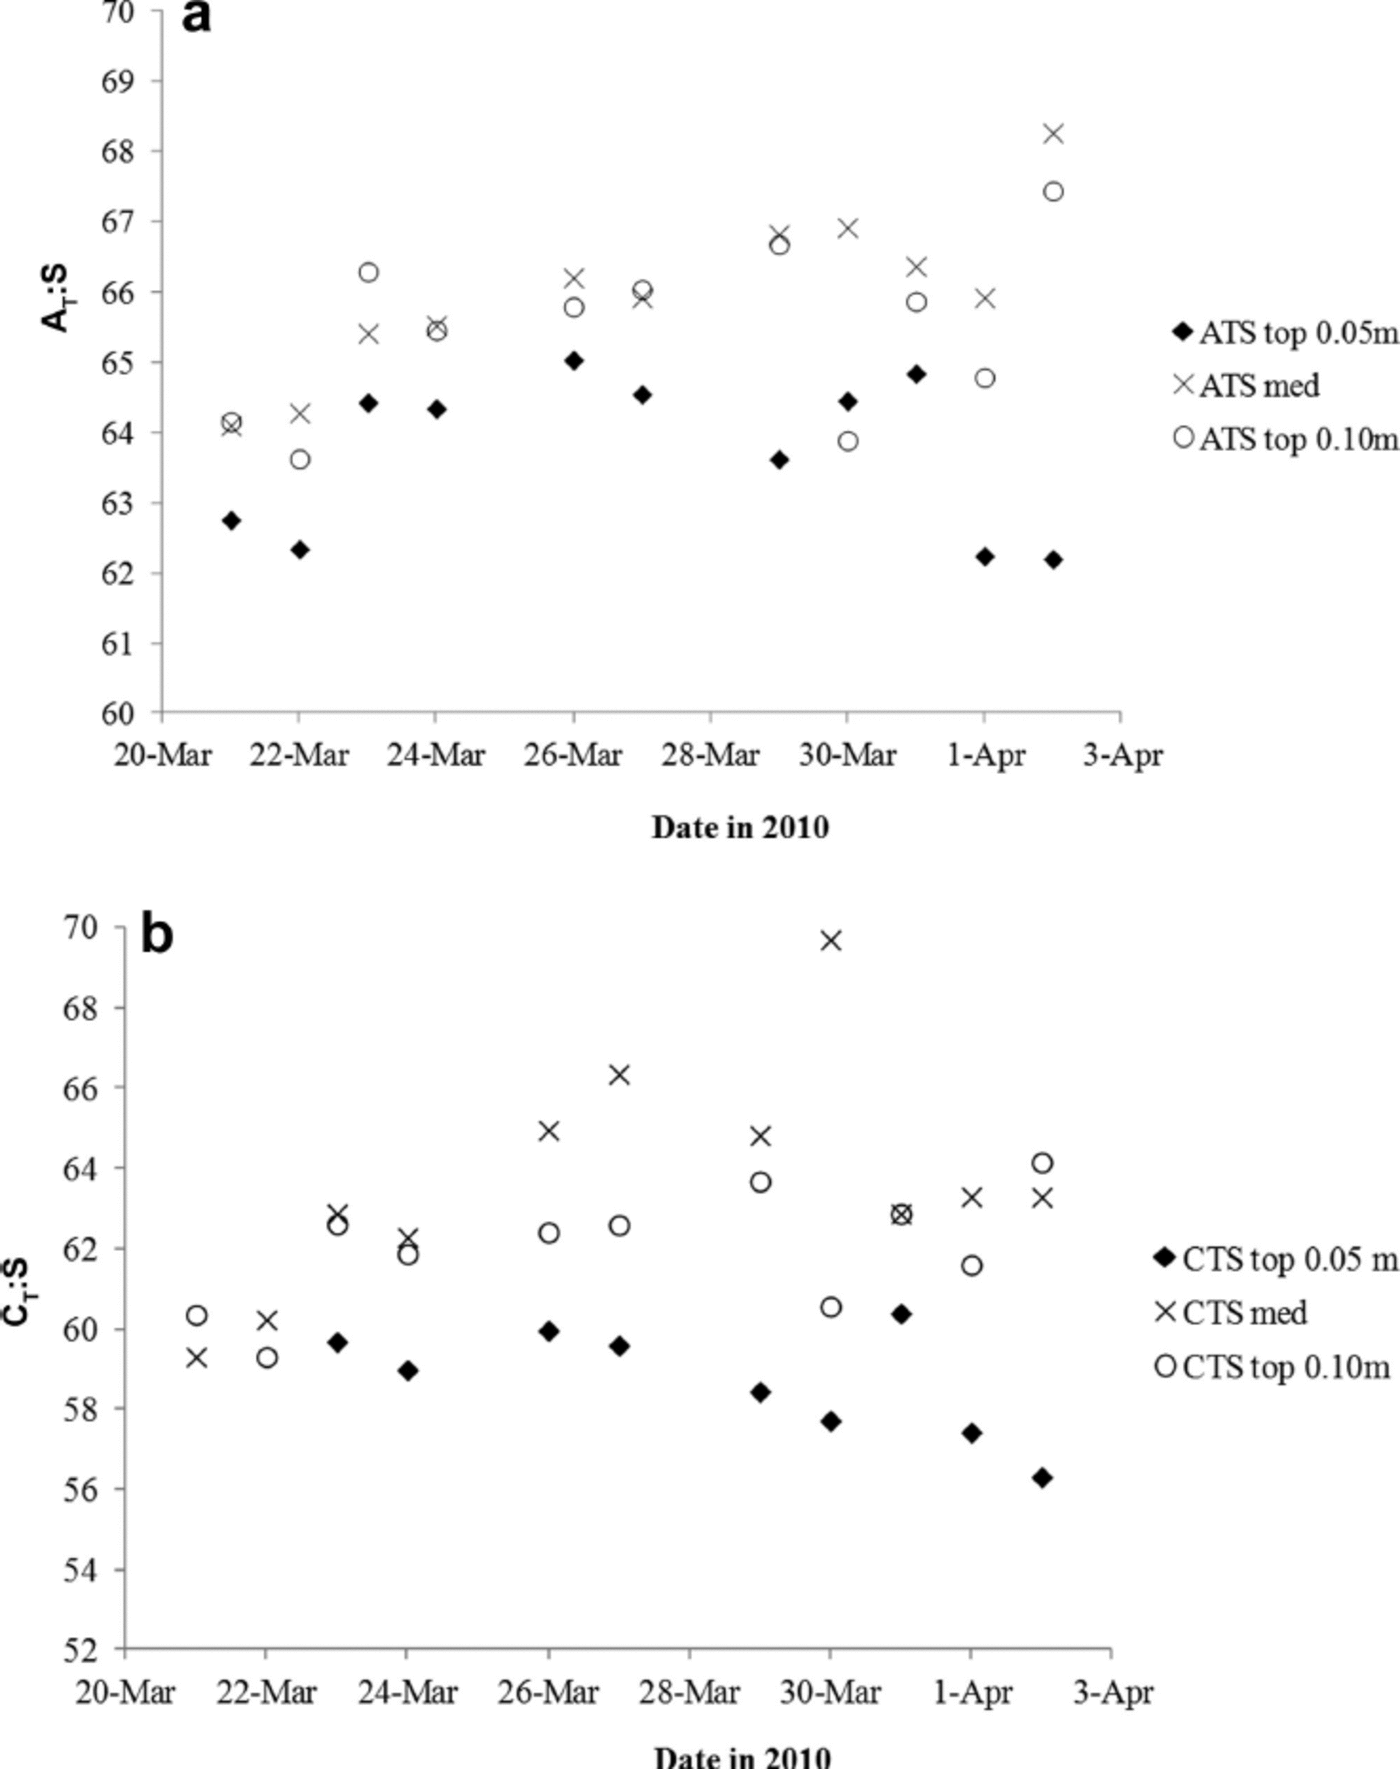
To further investigate the variability of nA T (and nC T) in the young ice, we used the ratios between ∆ T and salinity (∆ T .S) as proxies for CaCO3 precipitation in sea ice (e.g. Reference Fransson and ChiericiFransson and others, 2011, Reference Fransson2013; Reference RysgaardRysgaard and others, 2012). Increasing ∆ T .S means fractionation of ∆ T and salinity, likely indicating the presence and dissolution of solid CaCO3. Except for in the top 0.05 m, the ∆ T : S ratio in melted young ice increased (Table 2). Based on the ∆ T .S-ratio development during the study (Fig. 7a), we distinguished a pattern in the variability of the ice horizons, which may be due to changes in ∆ T relative to salinity or transport of CaCO3 to underlying ice horizons during ice formation (Fig. 7a). Moreover, we found that the ∆ T : S variability in the top 0.05 m ice corresponded to changes in air temperature. The lowest air temperature was recorded on 27, 29 and 30 March, shifting to warmer air on 30–31 March (Table 1). The increased air and young-ice temperatures caused an increase in BV, allowing chemical substances to move through the ice in brine channels.
The variability of (a) the AT.salinity ratio (∆T : S) and (b) the CT.salinity ratio (CT: S) in the top 0.05 m (filled diamonds), top 0.10 m (open circles) and median sea ice (crosses) for the whole study.
Conclusion
In this wintertime study of growing young ice, we found changes in the sea-ice CO2 system at all ice horizons. At the ice/air interface (top 0.05 m), we found that nC T decreased in the ice due to CO2 loss to the atmosphere during our study and that nC T and nA T increased at underlying horizons. The ice–air CO2 gas flux was partly driven by the process of CaCO3 precipitation within the ice, as was also concluded by Reference GeilfusGeilfus and others (2013). The amount of solid CaCO3 estimated for the 13 day study was smaller or in the same order of magnitude as found by Reference FranssonFransson and others (2013) and Reference RysgaardRysgaard and others (2013). Biological processes were active only to a limited extent in the young ice during the study but imposed local effects on the sea-ice CO2 system.
Our study confirms previous results that frost flowers are important conveyors for CO2 gas exchange from ice to atmosphere during ice formation. Assuming that frost flowers will form on newly formed sea ice, this source of CO2 to the atmosphere would be similar to the net CO2 uptake in the Arctic Ocean (Reference SchusterSchuster and others, 2013). Our study implies that CO2 loss from frost flowers may be more important for the air–ice–sea CO2 transfer for the Arctic Ocean than previously reported.
Acknowledgements
This is a contribution to the project ‘Greenhouse gases and mercury in a changing Arctic’, funded by the Swedish Research Council (No. 2007-8365). We thank the Norwegian Meteorological Institute for making their meteorological and ice concentration data available (www.met.no). We thank the personnel at the Sverdrup station (Norwegian Polar Institute) in Ny-lesund for logistic support. We also thank two anonymous reviewers for constructive comments, which improved the manuscript.


 Open access

