Key findings
• The performance of LAMP assay for the detection of Schistosoma mansoni DNA from stool and urine samples in comparison with Kato–Katz and real-time PCR was studied.
• The overall prevalence of S. mansoni was 46% in stool and urine samples as detected by the employed techniques and most of the cases had light infection intensity.
• Real-time PCR in stool samples gave the highest sensitivity compared to Kato–Katz and LAMP.
• Urine examination by both real-time PCR and LAMP displayed the lowest sensitivity compared to stool examination.
• Despite the LAMP assay missing a few S. mansoni positive cases diagnosed either by Kato–Katz and/or by real-time PCR, it displayed a good diagnostic performance when the intensity of infection was more than 8 eggs/g in stool samples.
• The LAMP assay is a promising technique for S. mansoni diagnosis in poor resources countries of high- and moderate-intensity infection, yet it needs further optimization, particularly in DNA urine extraction methods.
Introduction
Schistosomiasis is a stigmatized and debilitating infectious disease that affects poor populations, particularly those living inadequate sanitary conditions in tropical and subtropical regions. The disease transmission has been reported in 78 countries (King, Reference King2010). Despite the recent significant efforts to schistosomiasis control, its burden remains extremely high (WHO, 2016, 2022). Long-term, fully structured control programs and management of hot spots are still needed in endemic areas. For optimal design of schistosomiasis control programs, upgraded diagnostic methods have great prospects to gain baseline information on the true prevalence. Accurate diagnosis is also key for adequate patient management and for monitoring the control measures (Fuss et al., Reference Fuss, Mazigo, Tappe, Kasang and Mueller2018; Allam et al., Reference Allam, Salem, Elsheredy, Dewair, Ibrahim, Farag, Hagras and Shehab2021a).
Aside from the microscopic Kato–Katz technique, many Schistosoma mansoni diagnostic methods including Percoll, FLOTAC technique on faecal samples (Allam et al., Reference Allam, Farag, Zaki, Kader, Abdul-Ghani and Shehab2015; Allam et al., Reference Allam, Farag, Lotfy, Fawzy, Elhadad and Shehab2021b) and the point-of-care circulating cathodic antigen assay (POC-CCA) in urine samples had been used in Egypt and elsewhere (Allam et al., Reference Allam, Farag, Osman, Hagras, Ahmed, Zaki, Ghani and Shehab2018; Okoyo et al., Reference Okoyo, Simiyu, Njenga and Mwandawiro2018). POC-CCA was reported to display high accuracy and performance in moderate- and high-transmission areas but lacked specificity in low endemic settings in Brazil (Peralta et al., Reference Peralta and Cavalcanti2018; Graeff-Teixeira et al., Reference Graeff-Teixeira, Favero and Pascoal2021).
Currently, molecular techniques have seen great advances in parasite detection and offer accurate approaches in many applied fields including diagnosis in parasitology (Versalovic & Lupski, Reference Versalovic and Lupski2002). Conventional polymerase chain reaction (PCR) was the first of these molecular tools. Real-time PCR assay using SYBR Green dye for the detection and quantification of S. mansoni DNA in faecal samples was developed and evaluated as a technique of choice to study the epidemiology of schistosomiasis (Ten Hove et al., Reference Ten Hove, Verweij, Vereecken, Polman, Dieye and van Lieshout2008; Allam et al., Reference Allam, Farag, Zaki, Kader, Abdul-Ghani and Shehab2015; Allam et al., Reference Allam, Farag, Osman, Hagras, Ahmed, Zaki, Ghani and Shehab2018). However, the current need for devices that allow pathogen detection in the field and at a point-of-care setting could not be met by PCR techniques, which require a high cost and a high level of technicality for thermocycling conditions (Vincent et al., Reference Vincent, Xu and Kong2004; Abdul-Ghani et al., Reference Abdul-Ghani, Al-Mekhlafi and Karanis2012).
The loop-mediated isothermal amplification (LAMP) method that was first described in 2000, was acknowledged as a promising approach for point-of-care diagnostics (Fernandez-Soto et al., Reference Fernandez-Soto, Gandasegui Arahuetes, Sanchez Hernandez, Lopez Aban, Vicente Santiago and Muro2014). It has since been approved for detecting a variety of parasitic diseases, including Plasmodium falciparum, Schistosoma japonicum, S. mansoni and Schistosoma haematobium (Abdul-Ghani et al., Reference Abdul-Ghani, Al-Mekhlafi and Karanis2012; Fernández-Soto et al., Reference Fernández-Soto, Gandasegui, Carranza Rodríguez, Pérez-Arellano, Crego-Vicente, García-Bernalt Diego, López-Abán, Vicente and Muro2019). Under isothermal circumstances, the LAMP method uses an enzyme with strand displacement activity to amplify DNA with great sensitivity. The method employs four to six specially designed primers that identify six to eight regions of the target DNA sequence, resulting in a high degree of specificity. Compared to real-time PCR, LAMP is cheaper and only needs a heat block; it still requires trained personnel to run, but because the results readout is visual, it is less technical. However, DNA extraction methods remain the expensive part of both techniques (Abdul-Ghani et al., Reference Abdul-Ghani, Al-Mekhlafi and Karanis2012; Fernandez-Soto et al., Reference Fernandez-Soto, Gandasegui Arahuetes, Sanchez Hernandez, Lopez Aban, Vicente Santiago and Muro2014).
Consistent with the research and development of various intestinal schistosomiasis diagnostic methods, this study assessed the performance of LAMP for the detection of S. mansoni DNA from stool and urine samples in comparison with microscopy and real-time PCR.
Materials and methods
Study area
This study was carried out in 2020 in Arab Elmahdar Primary School in Motobus village of Kafr El-Sheikh Governorate. Motobus is 100 km away from Alexandria, Egypt. It is a well-known endemic area for S. mansoni, no cases were reported regarding S. haematobium (Allam et al., Reference Allam, Farag, Osman, Hagras, Ahmed, Zaki, Ghani and Shehab2018).
Subjects and sample collection
The study included 50 children from a primary school. Due to Covid 19, few parents agreed to submit stool and urine samples from their children. Thus, children were randomly included from each grade according to the school guardians’ approval, parents’ consent and their compliance. The school was visited on two consecutive days weekly for three weeks. On the first day, tightly closed plastic containers and plastic screwcap vials labelled with the child's number, name and class were distributed for the collection of stool and urine samples, respectively. On the next day, the containers were collected from all students enrolled in the study and returned to the parasitology laboratory in the Medical Research Institute, Alexandria University.
Microscopic examination
All the stool samples were examined microscopically after the Kato–Katz technique (41.7 mg/slide, three slides for each sample) and eggs were counted (Katz et al., Reference Katz, Chaves and Pellegrino1972).
Real-time PCR for S. mansoni detection in stool and urine samples
A part of each faecal specimen and the collected urine samples were stored at −20°C for further processing by real-time PCR and LAMP assays. After thawing at room temperature, DNA was extracted from 200 mg of stool samples using the QIAamp DNA stool mini kit (Qiagen, Hilden, Germany). As for urine, 100 μl from the precipitate of the centrifuged sample (1 ml) was used for DNA extraction using the DNeasy blood extraction mini kit (Qiagen, Hilden, Germany) following the manufacturer's instructions.
As for both stool and urine samples, specific forward and reverse primers (SmF/SmR) were selected for the amplification of the 28S ribosomal DNA region from S. mansoni to amplify a fragment of 350 bp. The reaction mixture included 5 μl of extracted DNA from each sample, 1 μl (40 pmol) of each S. mansoni forward and reverse primers: SmF GAGATCAAGTGTGACAGTTTTGC and SmR CAGTGCGCGCGTCGTAAGC (GenBank accession number AY157173) (Sandoval et al., Reference Sandoval, Siles-Lucas, Perez-Arellano, Carranza, Puente, Lopez-Aban and Muro2006); 12.5 μl SYBR Green universal PCR master mix, as well as nuclease free water, were added in the reaction tube to a final volume of 25 μl. Then, the real-time PCR was performed under the thermal profile as follows: an initial denaturation step at 95°C for 15 min was first carried out. Forty cycles of amplification were performed (94°C for 20 s, 61°C for 20 s and 72°C for 30 s). Well-defined positive and negative controls were used in each run to set up accurate real-time PCR results. Positive control was selected from positive cases of moderate infection intensity as diagnosed by Kato–Katz. Negative control was from a volunteer in the department who lives in an urban area in Alexandria city and has no history of exposure to S. mansoni. A melting curve was performed to confirm the specificity of the amplicon products by increasing temperature slowly from 72°C to 95°C for one min, then at 55°C for 30 s and finally at 95°C for 30 s (Ten Hove et al., Reference Ten Hove, Verweij, Vereecken, Polman, Dieye and van Lieshout2008; Cnops et al., Reference Cnops, Soentjens, Clerinx and Van Esbroeck2013; Allam et al., Reference Allam, Farag, Osman, Hagras, Ahmed, Zaki, Ghani and Shehab2018; Allam et al., Reference Allam, Salem, Elsheredy, Dewair, Ibrahim, Farag, Hagras and Shehab2021a,Reference Allam, Farag, Lotfy, Fawzy, Elhadad and Shehabb).
LAMP assay
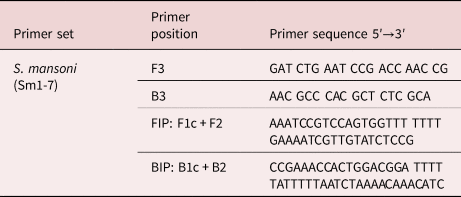
The LAMP primers used to perform the present assay were previously described by Abbasi et al. (Reference Abbasi, King, Muchiri and Hamburger2010) and targeted 121-bp DNA repeated sequence in S. mansoni as shown in table 1.
Primer sets used for loop-mediated isothermal S. mansoni DNA amplification from stool and urine samples (Abbasi et al., Reference Abbasi, King, Muchiri and Hamburger2010).

F3, forward outer primer; B3, reverse outer primer; FIP, forward inner primer (including F1c and F2 sequences); BIP, reverse inner primer (including B1c and B2 sequences); bp, base pair.
The LAMP assay was done by using primer sets (Sm1-7) of forward and backward external primers (F3 and B3), and forward and backward internal primers (FIP and BIP). The assay conditions were as follows: the final reaction mixture of 25 μl contained primers (40 pmol of each FIP and BIP and 5 pmol of F3 and B3 outer primers), DNA polymerase, eight units of Bst I large fragment, 1 mm Deoxyribonuleoside Triphosphates (dNTPs), 0.8 M betaine; 1× reaction buffer (containing 20 mm Tris-HCl, pH 8.8, 10 mm KCl, 10 mm (NH4)2SO4, 8 mm MgS4 and 1% Tween 20) and 5 μl target DNA samples. The reaction was incubated at 63°C in a water bath for 1 h. To justify the technique, positive and negative controls were used as mentioned above. The amplified DNA was visualized under ultraviolet light at 320 nm after electrophoresis on 2% standard agarose gel for 1 h and then photographed. Direct detection of amplicons in a reaction tube was also done by direct observation of the reaction with an unaided eye after adding 2 μl of 1:10 dilution 10,000× concentration SYBR I Green dye (Invitrogen, Carlsbad, California, USA) to the amplicon. Under these conditions, the colour in the reaction tube changed from orange to yellowish green in the presence of positive LAMP amplicons.
Statistical analysis
Data were analysed using IBM SPSS for Windows, version 20.0 (IBM Corp, Armonk, New York, USA). The statistical program was utilized for both data presentation and statistical analysis of the results. For descriptive analysis, the prevalence by different methods was articulated in percentages, geometric mean was used to express the S. mansoni egg counts (GMEC) (Montresor, Reference Montresor2007). A confidence interval (CI) of 95% was applied as a measure of central tendency and dispersion respectively for normally distributed quantitative data. Kappa agreement (K) test was applied for measuring the agreement between the results of the diagnostic tests (at k < 0.2 poor agreement, k 0.2–0.4 fair agreement, k > 0.4–0.6 moderate agreement, k > 0.6 high agreement). In all statistical tests, significance was accepted as P < 0.05. The diagnostic parameters including sensitivity, specificity, positive predictive value and negative predictive value (NPV) of the three methods were calculated by establishing a reference standard incorporating all the positive cases by Kato–Katz, real-time PCR and LAMP methods (Altman, Reference Altman1992).
Results
Diagnosis of S. mansoni by Kato–Katz, real-time PCR and LAMP assay
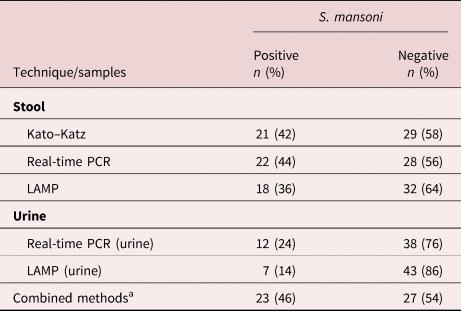
The age of the 50 participants ranged from 7 to 11 years, 70% boys (35/50) and 30% girls (15/50). As shown in table 2, the overall S. mansoni prevalence was 46% (23/50) as diagnosed by the employed techniques in stool and urine samples. The highest percentage of infection was detected by real-time PCR (44%), followed by Kato–Katz (42%) and LAMP in the stool (36%), while the lowest percentages of infection were diagnosed by real-time PCR and LAMP in urine (24% and 14%, respectively).
Percentage of S. mansoni among the 50 examined school children as diagnosed by the employed techniques.
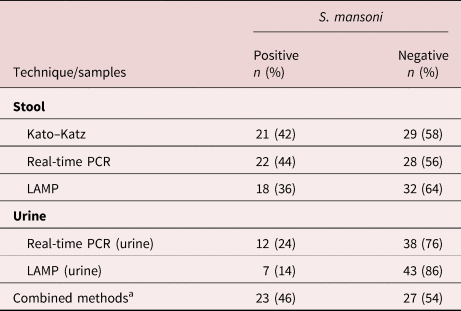
a 20 cases were positive by both Kato–Katz and PCR, two cases by PCR only and one case by Kato only = 23; disease prevalence = 46%.
Performance of real-time PCR and LAMP according to infection intensity by Kato–Katz
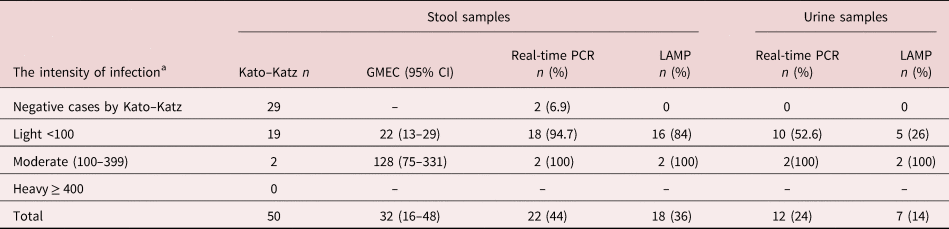
Based on Kato–Katz categorized infection intensity, it was found that two cases diagnosed negative by Kato–Katz were detected by real-time PCR, while PCR gave a negative result in one case with light infection (8 eggs/g). S. mansoni was detected by the three techniques in all subjects with moderate infection intensity both in stool and urine samples. Compared to real-time PCR, the LAMP technique missed more positive cases of light intensity infection in stool and urine samples (tables 3 and 4).
Real-time PCR and LAMP results for S. mansoni diagnosis, categorized by the intensity of infection.
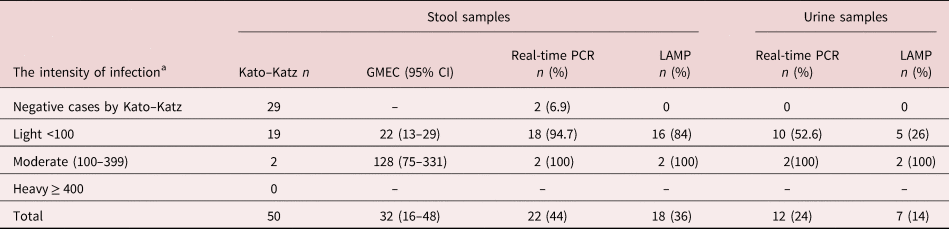
GMEC, geometric mean egg count (calculated based on Kato–Katz); CI, confidence interval.
a Intensity of infection categorized according to WHO (2002).
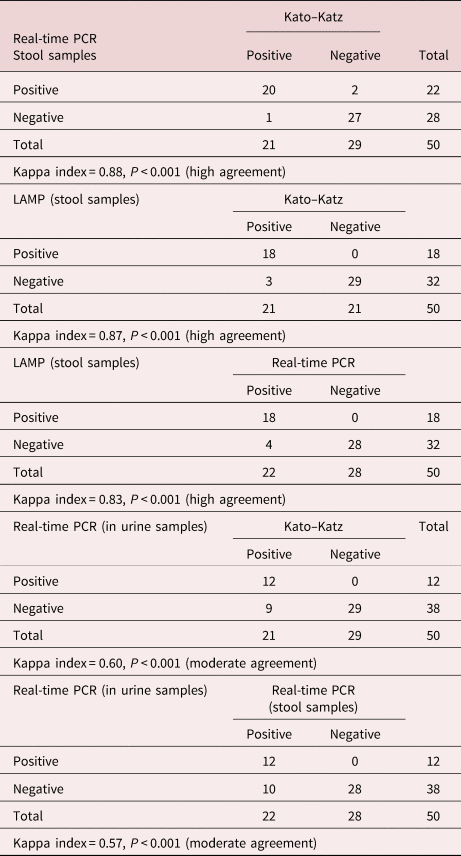
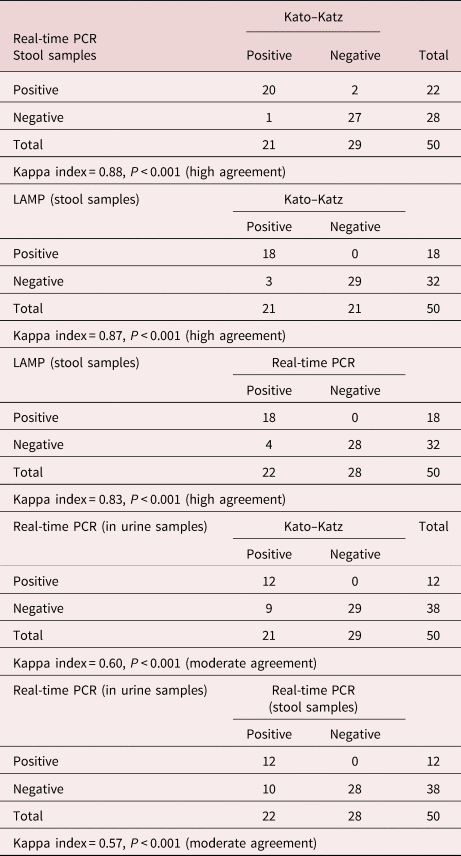
Agreement between Kato–Katz, real-time PCR test and LAMP (stool samples).
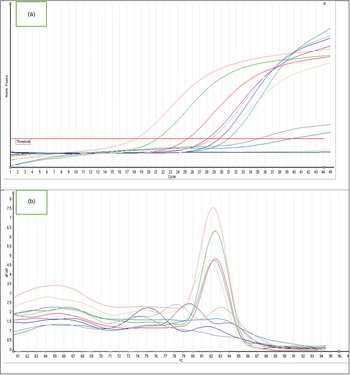
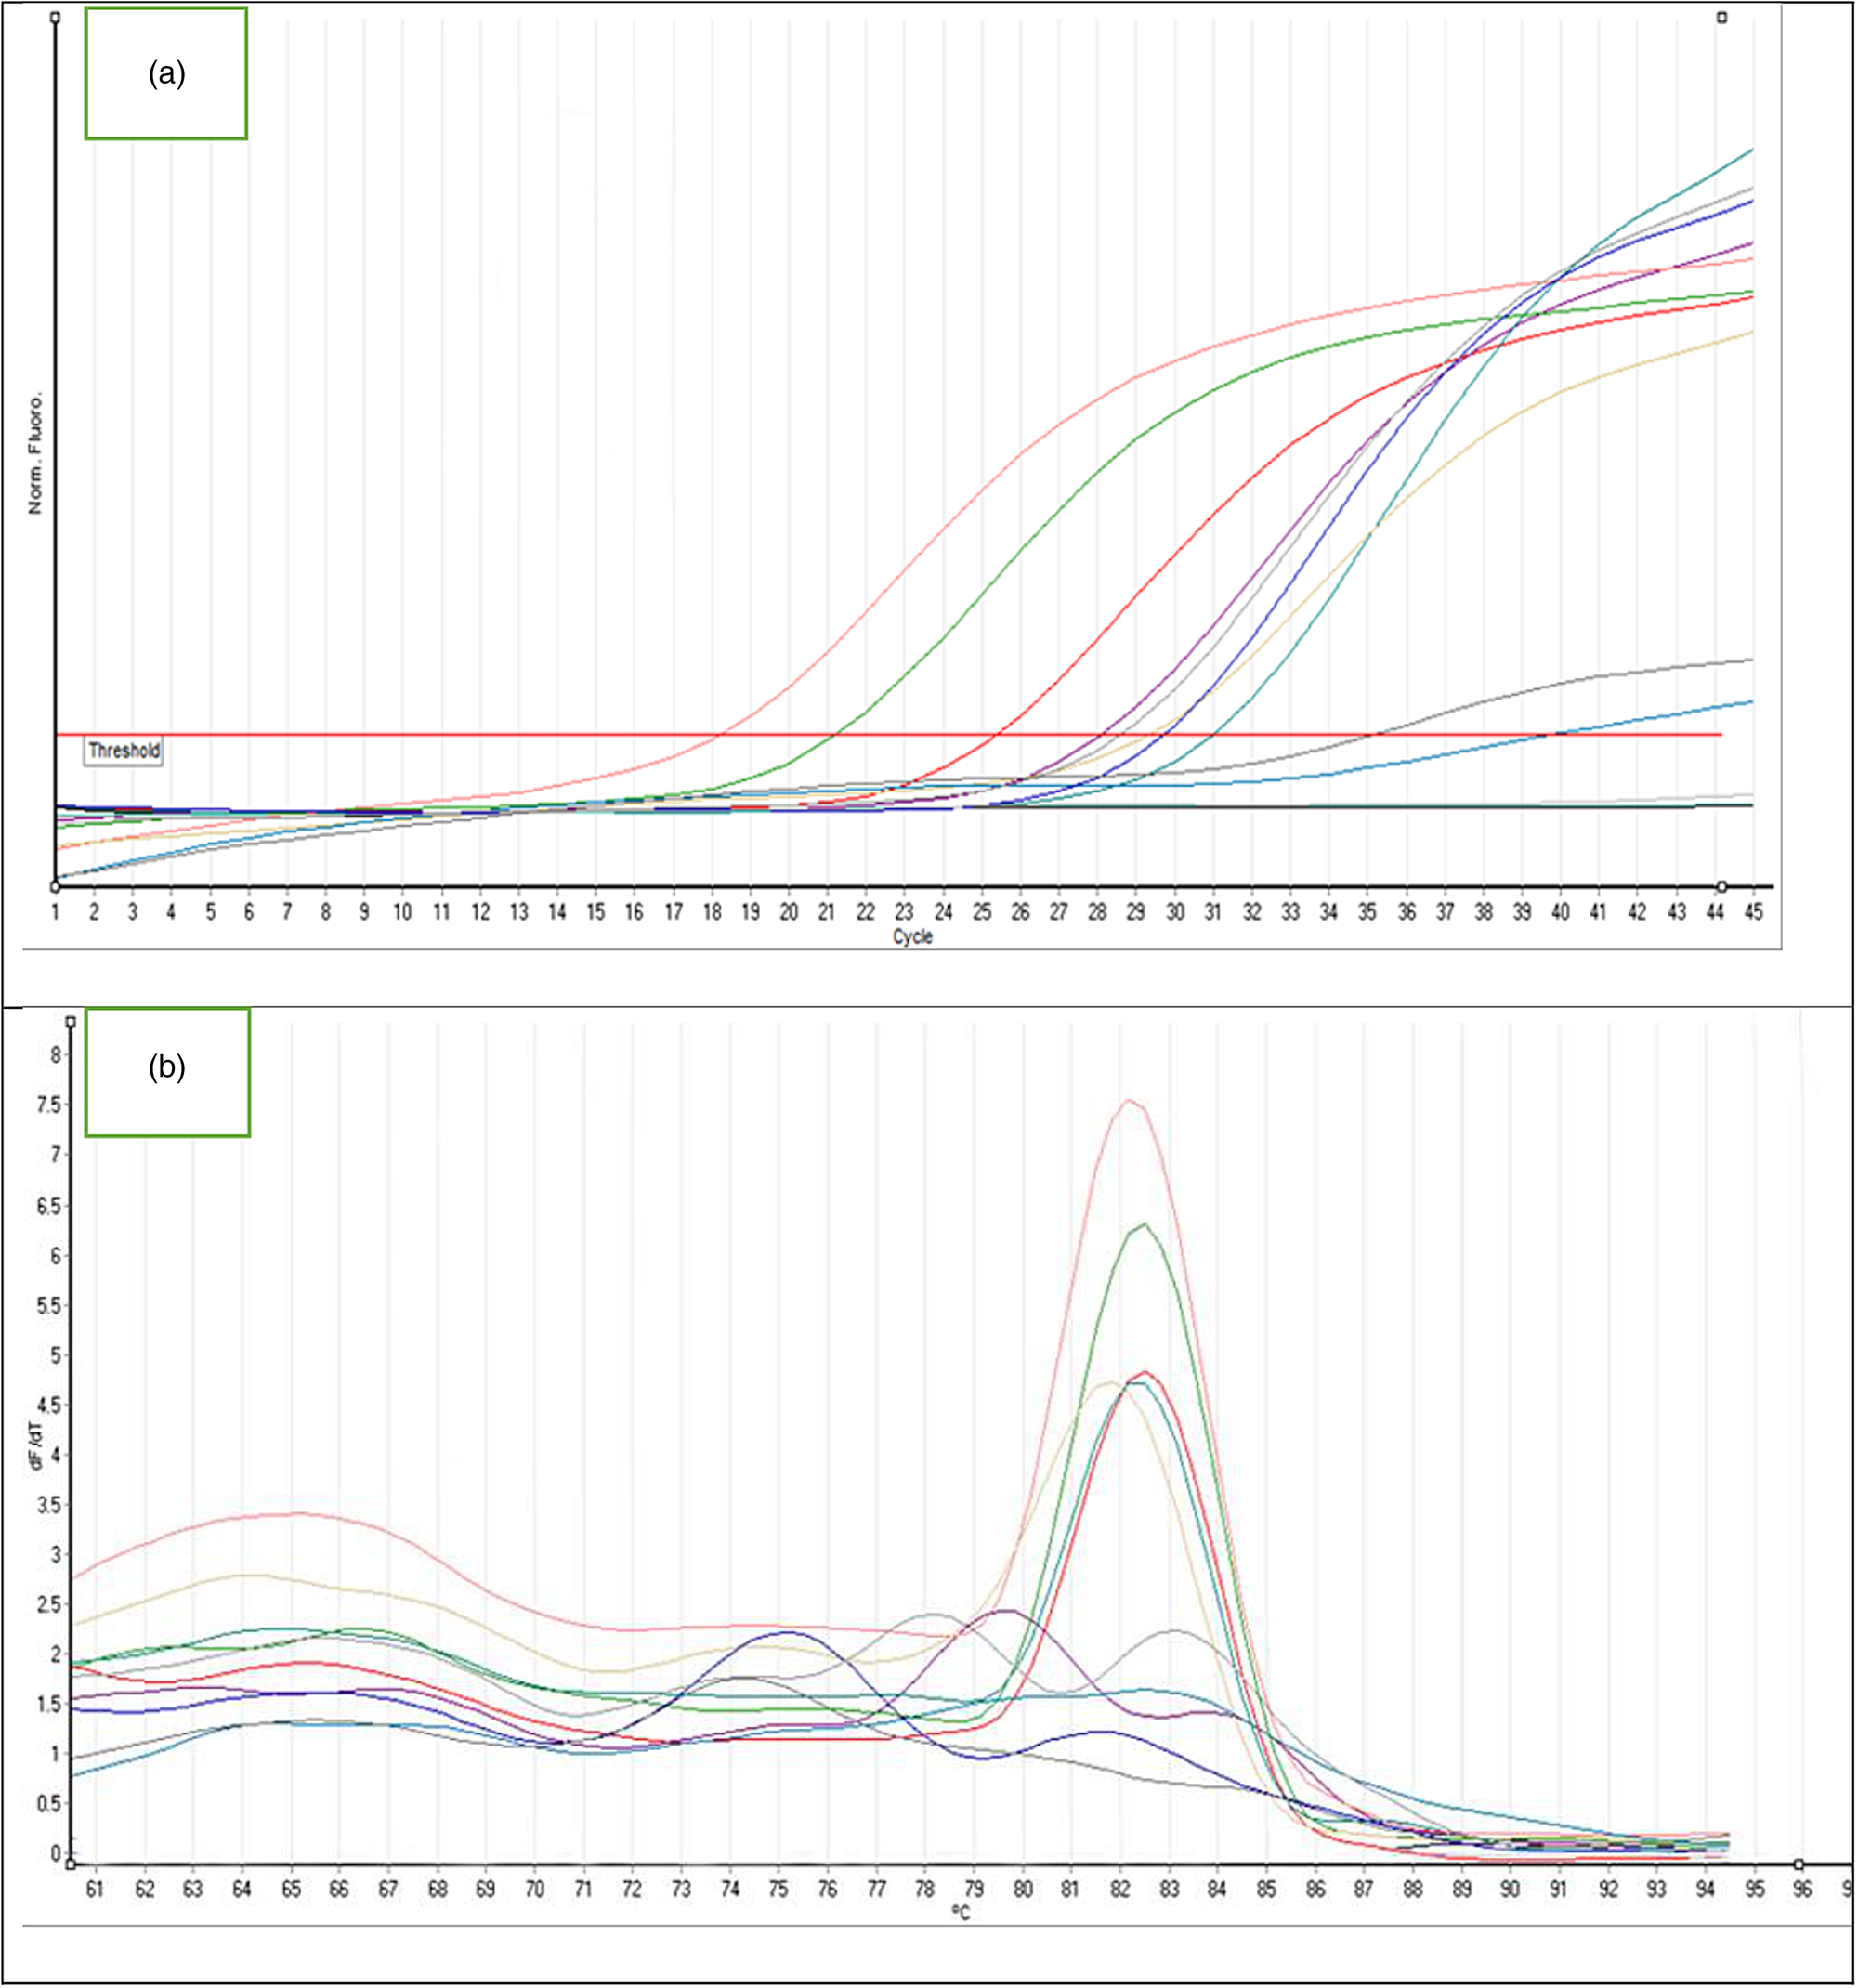
Referring to real-time PCR, fig. 1a revealed that cycle threshold values (Ct) ranged from 18 to 32, pointing to the different intensity of infections, knowing that there is a negative correlation between Ct and the parasite-specific DNA load in the examined samples. Melting curve analysis defined the high specificity of S. mansoni amplified fragments where the melting temperature was 82.3°C (fig. 1b).
The amplification plot and melting curve of real-time PCR reactions using a primer pair specific for Schistosoma mansoni. The positive representative samples show typical progress line (a) and melting peak (b). Samples with multiple peaks were considered negatives.
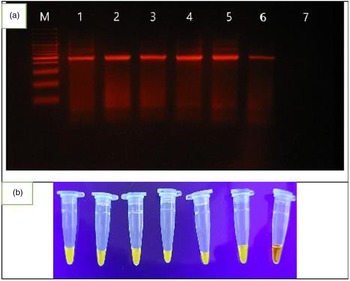
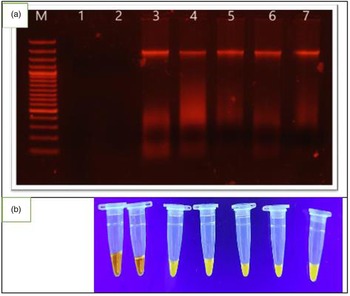
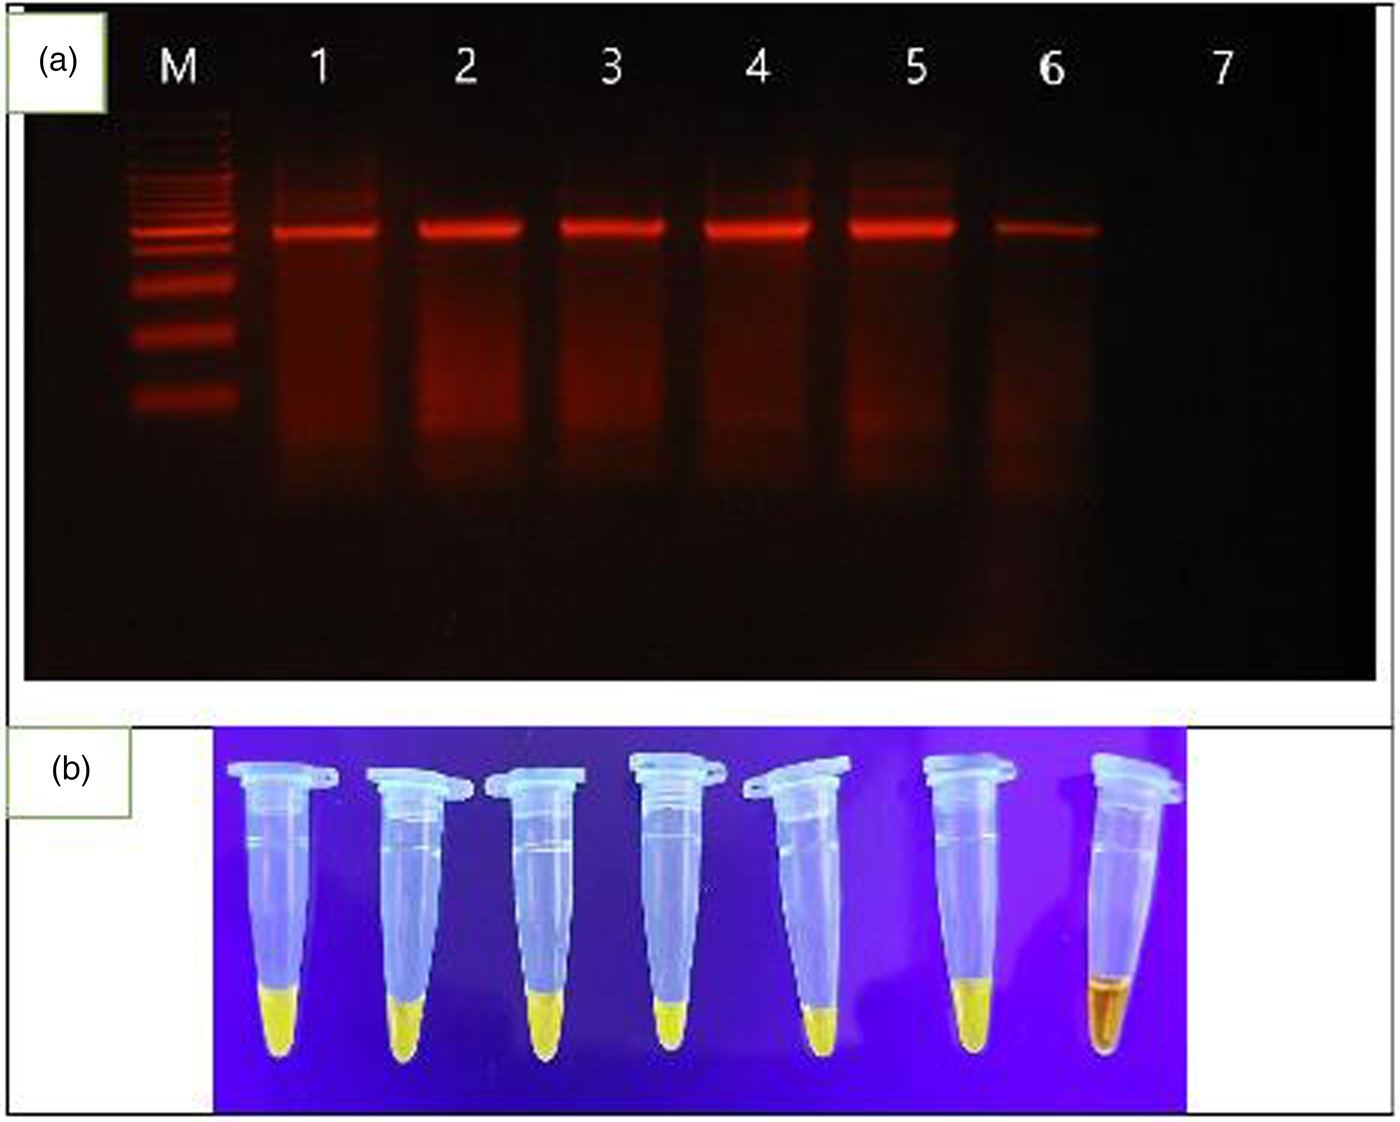
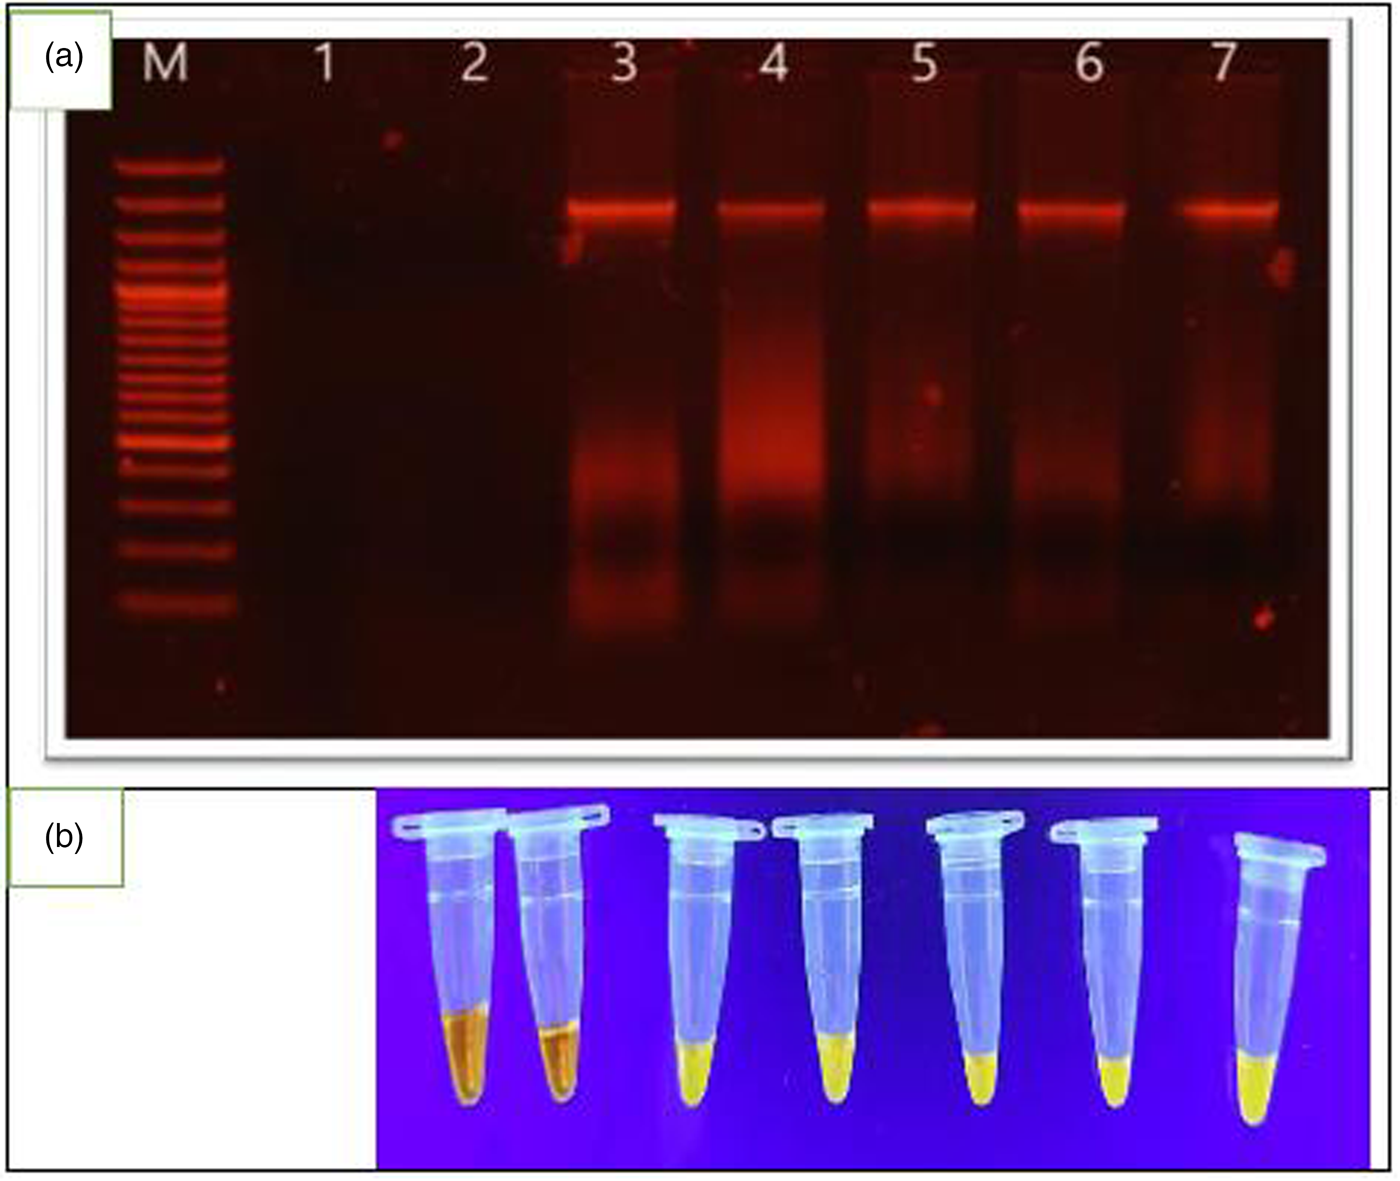
Regarding LAMP assay, figs 2a, b and 3a, b showed that the LAMP could successfully detect S. mansoni DNA in human faecal and urine samples with low and moderate infection intensities (table 3).
(a) Lane M represents the molecular marker. Lanes 1, 4 and 5 represent results of DNA amplification in faecal samples with moderate intensity S. mansoni infection; lanes 2, 3 and 6 represent results of faecal samples with low infection intensities; lane 7 represents amplification results for negative S. mansoni faecal sample. (b) LAMP amplification reactions in a tube with products stained with SYBR Green I stain and samples visualized directly with the unaided eye. Tubes 1–7 in figure (b) correspond to lanes 1–7, respectively, in (a). Yellowish green is a positive reaction and orange colour is a negative reaction.
(a) Lane M represents the molecular marker, lanes 1–7 represent the results of urine samples for S. mansoni with low and moderate infection intensities. Lanes 1 and 2 represent the results of DNA amplification of negative urine samples. (b) LAMP amplification reactions in a tube with products stained with SYBR Green I stain and samples visualized directly with the naked eye. Tubes 1–7 in (b) correspond to lanes 1–7, respectively, in (a). Orange colour is a negative reaction and yellowish green is a positive reaction.
Agreement between the employed S. mansoni diagnostic techniques
As shown in table 4, by comparing the results of the 50 examined cases, the kappa index revealed high agreement between Kato–Katz and real-time PCR, between Kato–Katz and LAMP and between real-time PCR and LAMP in stools. Moderate agreement was found between Kato–Katz and real-time PCR in urine. Likewise, a moderate agreement was found between real-time PCR in stool and real-time PCR in urine samples. LAMP assay in urine was not included in the table, yet it displayed fair agreement between Kato–Katz and real-time PCR (kappa index = 0.37, 0.34, respectively).
Comparison of the diagnostic efficiency of the used techniques
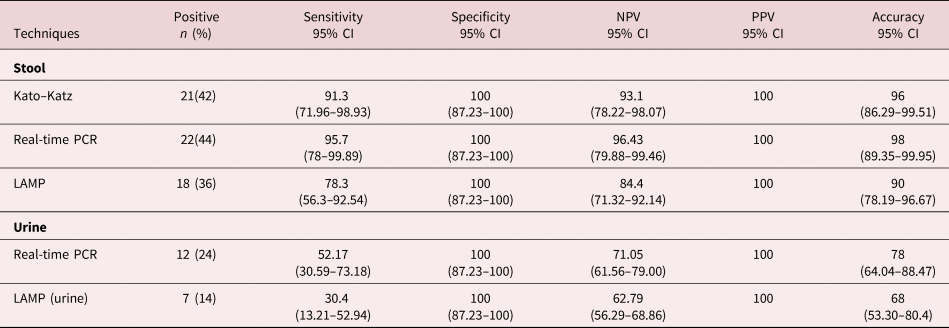
Based on the calculated gold standard according to the combined results of Kato–Katz, real-time PCR and LAMP (20 true positives by both Kato–Katz and PCR, two cases by PCR and one case by Kato–Katz) and a disease prevalence of 46%, Kato–Katz showed a sensitivity of 91%, NPV of 93% and 96% accuracy. Real-time PCR displayed the highest calculated parameters regarding sensitivity (96.43%), NPV (95.7%) and accuracy (98%). LAMP stool test revealed lower sensitivity, NPV and accuracy compared to Kato–Katz and real-time PCR. As for real-time PCR and LAMP urine tests, the lowest calculated parameters were obtained indicating their lower diagnostic performance. Interestingly, all cases tested positive by LAMP assay were concordantly positive by the Kato–Katz and real-time PCR, indicating its high specificity. The obtained results are presented in table 5.
The measured performance parameters of the employed techniques for S. mansoni diagnosis.
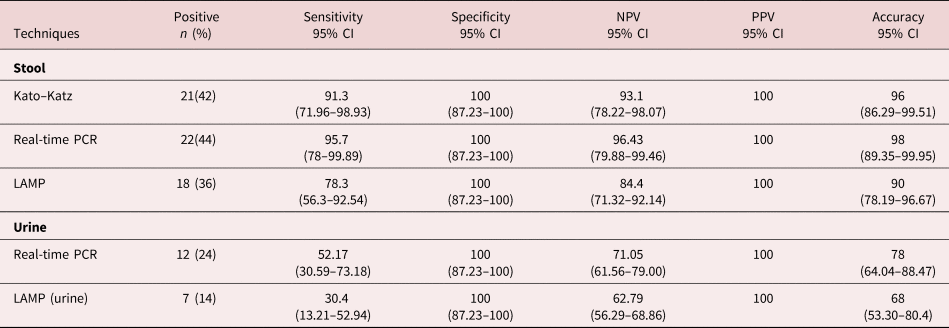
CI, confidence interval; NPV, negative predictive value; PPV, positive predictive value.
Discussion
In Egypt, despite the application of robust control programs against schistosomiasis and the decreased prevalence, it remains a never-ending story. The present study revealed an overall schistosomiasis prevalence of 46% by Kato–Katz, real-time PCR and LAMP. This rate is relatively lower than the previous studies in Kafr El-Sheikh Governorate. Allam et al. (Reference Allam, Farag, Osman, Hagras, Ahmed, Zaki, Ghani and Shehab2018) reported an overall prevalence of 83% by Kato–Katz, CCA and real-time PCR. The difference might be due to the study period and the employed methods in laboratory diagnosis. Even so, the presence of S. mansoni among school children in the present work indicates illiteracy about the prevention and improper control methods including contamination of water canals and probably inappropriate application of snail control and treatment policy (Motawea et al., Reference Motawea, Soliman, El-Nemr, Elnahas, Sultan and Gabr2004). Most of the children live in poor hygiene and sanitation areas. Additionally, bathing, swimming and playing behaviours in contaminated water could also increase the risk of infection (Hajissa et al., Reference Hajissa, Abd Elhafiz and Eshag2018).
Despite the relatively high prevalence, 90.5% of positive children had light infection intensity and 9.5% had moderate infection, with a total GMEC of 32 eggs/g. Varying results were reported by Allam et al. (Reference Allam, Farag, Osman, Hagras, Ahmed, Zaki, Ghani and Shehab2018) in this study area (64.3% had light infection). Comparable results of low faecal egg counts were reported by Bajiro et al. (Reference Bajiro, Dana, Ayana, Emana, Mekonnen, Zawdie, Garbi, Kure and Zeynudin2016) in Ethiopia, where 70% had low infection intensity. This could be explained by a lower transmission potential due to low snail infection, combined with the availability of passive treatment in rural areas. Physicians are found all around the governorate, and self-referral for evaluation and treatment is common.
In the present study, concerning the performance of Kato–Katz, real-time PCR and LAMP test in the diagnosis of S. mansoni, the highest infection rate was detected by real-time PCR (44%), followed by Kato–Katz (42%) and LAMP (36%) in stool specimens. The lowest infection rates were obtained by real-time PCR and LAMP in urine samples (24% and 14%, respectively).
Despite real-time PCR being most sensitive among the three applied diagnostic techniques, it gave results almost comparable to those of Kato–Katz. Similar results were reported by Ten Hove et al. (Reference Ten Hove, Verweij, Vereecken, Polman, Dieye and van Lieshout2008). However, these results contradict what is known about the high sensitivity of real-time PCR versus Kato–Katz, especially in individuals with light intensity (Meurs et al., Reference Meurs, Brienen, Mbow, Ochola, Mboup, Karanja, Secor, Polman and van Lieshout2015; Allam et al., Reference Allam, Farag, Osman, Hagras, Ahmed, Zaki, Ghani and Shehab2018). This finding may be due to the small sample size in the present study or to a few cases that had egg counts below the detection limit of Kato–Katz.
Referring to the intensity of infection according to Kato–Katz, the obtained results showed that the Kato–Katz, real-time PCR and LAMP assay detected the same infection rate for S. mansoni in moderate infections. Among negative cases after Kato–Katz, PCR detected approximately 6.9% increment S. mansoni positive cases compared to no positives diagnosed by LAMP assay. This confirms that inconsistency between the outcome of microscopy and the other two methods occurred in children with no eggs detected or with the light intensity of infection.
Kappa statistical analysis showed high agreement between real-time PCR, Kato–Katz and LAMP in stool samples. However, detailed analysis revealed slight discordant results on the three sides. By analysis of the results, one case was diagnosed only by Kato–Katz, and two cases diagnosed only by real-time PCR; however, two cases diagnosed by both Kato–Katz and real-time PCR were missed by LAMP. On the contrary, Mwangi et al. (Reference Mwangi, Agola, Mugambi, Shiraho and Mkoji2018) revealed that the lowest detection limit of the LAMP reaction was as low as 32 fg of S. mansoni egg DNA in a faecal sample. As for urine samples, the results confirmed slight/poor agreement inter-rater and lower diagnostic sensitivity of real-time PCR and LAMP in urine samples compared to their performance in stool samples. This may be due to the low amount of cell-free DNA present in the sample, DNA extraction and amplification failure from frozen urine samples of S. mansoni confirmed positive by stool examination. Likewise, possibly due to contamination prior to storage or DNA damage hindering proper amplification. Fernández-Soto et al. (Reference Fernández-Soto, Gandasegui, Carranza Rodríguez, Pérez-Arellano, Crego-Vicente, García-Bernalt Diego, López-Abán, Vicente and Muro2019) revealed that long incubation time for the conventional Sm mitochondrial S. mansoni minisattelite DNA region (MIT-LAMP) reaction improved the efficiency of the amplification and avoided false negatives in parasitological S. mansoni-confirmed infections and in other urine samples analysed. The absence of positive results in urine samples may be due to several factors, such as DNA extraction and amplification failure from frozen urine samples, fungal or bacterial contamination during their storage, long frozen storage without preservation, repetitive freezing and thawing cycles for different processing. The standard 60 min reaction time may be the main cause of lacking positive diagnostic results as reported by Fernández-Soto et al. (Reference Fernández-Soto, Gandasegui, Carranza Rodríguez, Pérez-Arellano, Crego-Vicente, García-Bernalt Diego, López-Abán, Vicente and Muro2019), who revealed that longer incubation time for 120 min increased the LAMP S. mansoni positive results in patient urine samples.
Focusing on LAMP assay, all positive cases by LAMP were positive by both Kato–Katz and real-time PCR, indicating its high specificity. Nevertheless, LAMP missed a few cases of very low intensity. In compliance with other molecular evaluates for S. mansoni diagnosis, this fraction of false negative by LAMP is entirely acceptable (Mwangi et al., Reference Mwangi, Agola, Mugambi, Shiraho and Mkoji2018).
By comparing LAMP with Kato–Katz, weighing personnel cost and turnaround time, it is of lower cost and rapid test. Compared to PCR-based evaluates, adding to the previous advantages, LAMP is a single tube method used for nucleic acid amplification in isothermal conditions without complex equipment and permitting direct visual diagnosis of positive cases. It may be favourably used under field conditions in endemic areas of low resources. Yet, LAMP assays still have limitations and do not entirely meet WHO equipment-free/electricity-free operation criteria (Ahmed et al., Reference Ahmed, Nahar, Safavieh and Zourob2013). The difficulty in maintaining the cold preserved reagents has been one of the greatest barriers to the implementation of LAMP in countries with neglected tropical diseases. As a result, the goal is to provide a ready dried LAMP reagents kit that can be applied quickly and easily under field conditions (García-Bernalt et al., Reference García-Bernalt, Fernández-Soto, Crego-Vicente, Alonso-Castrillejo, Febrer-Sendra, Gómez-Sánchez, Vicente, López-Abán and Muro2019). LAMP kits for tuberculosis and malaria are rather developed and already commercially available (WHO, 2016, 2022; Morris & Aydin-Schmidt, Reference Morris and Aydin-Schmidt2021). Also, LAMP prototype kits in dried form are developed for Chagas disease, Human African Trypanosomiasis, for multiplexing Dengue and Chikungunya viral infections (Besuschio et al., Reference Besuschio, Llano Murcia and Benatar2017; Yaren et al., Reference Yaren, Alto, Gangodkar, Ranade, Patil, Bradley, Yang, Phadke and Benner2017).
In conclusion, LAMP assay displayed a good diagnostic performance when the intensity of infection was more than 8 eggs/g in stool samples. So, the present study acknowledges the ease and performance of the LAMP assay as a promising tool for S. mansoni diagnosis in field surveys in areas of moderate and high intensity. Further studies are needed considering different primers, classical DNA extraction procedures, ready used dried kits reagents, cheaper DNA extraction kits and a longer incubation time principally in urine samples.
Due to COVID-19 and lockdown, the small sample size (50 children) is a limitation of the current study.
Acknowledgements
The authors appreciate and would like to thank the Arab Elmahdar school guardians and children's parents for their support in collecting stool and urine samples. They also appreciate Dr Hala A Hafez, assistant lecturer in the Biochemistry Department, and Mrs Doaa Gaber Shalaby, Hematology Department, Medical Research Institute, Alexandria University, for their support in PCR analysis.
Conflicts of interest
None.
Financial support
This research received no specific grant from any funding agency, commercial or not-for-profit sectors.
Ethical standards
This work was approved by the ethical committee of the Medical Research Institute, the Egyptian Ministry of Health and Population and the Administration of Health Affairs in Kafr El-Sheikh Governorate.