Introduction
The majority of Southern Ocean fish species are members of the Notothenioidei, a perciform suborder largely confined to the Antarctic region (Eastman Reference Eastman2005). South Georgia icefish (Pseudochaenichthys georgianus, Norman 1937) belong to one of the eight families of Notothenioids, the Channichthyidae (Balushkin Reference Balushkin2000, Eastman Reference Eastman2005). The Channichthyidae, commonly called icefish or ‘white-blooded’ fish are unique in that they lack the respiratory pigment haemoglobin (Everson Reference Everson and Laws1984, Kock & Everson Reference Kock and Everson1997, Kock Reference Kock2005). With the exception of one species, which occurs on the southern Patagonian shelf, the remaining 14 members of the icefish family live in the cold-stable and oxygen-rich waters of the Southern Ocean (Kock Reference Kock2005). They are similar in morphology, ecology and behaviour and most have combined pelagic-benthic life styles, exhibiting an active vertical migration to feed on pelagic prey, especially fish and krill (Eastman Reference Eastman2005).
Three species of icefish (Champsocephalus gunnari Lönnberg 1905, Chaenocephalus aceratus Lönnberg 1906 and P. georgianus) are abundant around South Georgia and Shag Rocks. Pseudochaenichthys georgianus is known only from the island shelves of the Scotia Sea and the northern part of the Antarctic Peninsula (Gon & Heemstra Reference Gon and Heemstra1990). Studies based on parasite infestation carried out by Siegel (Reference Siegel1980) determined that there is no exchange between the South Orkneys and South Georgia populations. South Georgia icefish attain a total length (TL) of c. 600 mm and are found down to depths of 475 m (Gon & Heemstra Reference Gon and Heemstra1990). Reaching sexual maturity at 4–5 years (Kock Reference Kock1981), mature fish are thought to move inshore to spawn (Kock Reference Kock1992) during the autumn (Olsen Reference Olsen1955). Pseudochaenichthys georgianus is preyed upon by many higher predators, such as black-browed and grey-headed albatrosses (Thalassarche melanophrys (Temminck 1828) and T. chrysostoma (Forster 1785)), (Reid et al. Reference Reid, Croxall and Prince1996), wandering albatross (Diomedea exulans Linnaeus 1758) (Croxall et al. Reference Croxall, North and Prince1988), macaroni penguins (Eudyptes chrysolophus (Brandt 1837) (Croxall et al. Reference Croxall, Prince and Reid1997) and Antarctic fur seals (Arctocephalus gazella Peters 1875) (Reid Reference Reid1995), and is also a regular bycatch in the trawl fishery for mackerel icefish (Champsocephalus gunnari) around South Georgia (Gon & Heemstra Reference Gon and Heemstra1990). A bottom trawl fishery began at South Georgia in the early 1970's, and although mackerel icefish was the principal target, P. georgianus probably formed a substantial, but unreported, bycatch. Detailed catch reporting began in 1976/77 and in the 1977/78 season P. georgianus was targeted by Polish and East German vessels, with 12 743 tonnes caught (CCAMLR 2007). Large catches were also taken in the 1979/80 and 1983/84 seasons (CCAMLR 2007) and biomass estimates from the mid 1980s indicated a ≥ 75% decline from the pre-exploitation stock levels of the early 1970s (Sosinski & Szlakowski Reference Sosinski and Szlakowski1992). In 1990 the Commission for the Conservation of Antarctic Marine Living Resources (CCAMLR) prohibited a direct fishery on this species and introduced bycatch limitations in the pelagic trawl fishery for mackerel icefish (Kock Reference Kock2005). Juvenile P. georgianus are also vulnerable to exploitation as bycatch in the krill fishery (Rembiszewski et al. Reference Rembiszewski, Krzeptowski and Linkowski1978, Ross et al. Reference Ross, Jones, Belchier and Rothery2006).
Previous studies (Olsen Reference Olsen1955, Linkowski & Rembiszewski Reference Linkowski and Rembiszewski1978, Mucha Reference Mucha1980, Chojnacki & Palczewski Reference Chojnacki and Palczewski1981, Traczyk Reference Traczyk1992) on P. georgianus have reported on age, growth and population biomass which are important components in understanding the ecology and biology of a species and as input parameters for fish stock assessment models (Kock Reference Kock1992). This current study investigates data collected during 14 surveys around South Georgia and Shag Rocks, examining the distribution, biomass, growth based on length-frequency, interannual variability in abundance, maturity and summer diet of P. georgianus in an effort to gain a better understanding of the life history of this species.
Materials and methods
Sample collection and processing
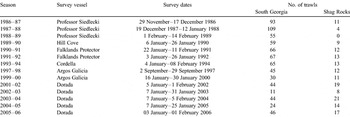
Samples were collected from 14 surveys around South Georgia and Shag Rocks, carried out between November 1986 and January 2006 (Table I). The fish were caught using a commercial-sized otter trawl (FP-120), with a headline height of 4–6 m, a wingspread of c. 18 m and a cod-end mesh of 40 mm (see Everson et al. Reference Everson, Parkes, Kock and Boyd1999). The net was towed for c. 30 min along the sea floor at a speed of 3–4 knots. For all years, except 2003, sampling was carried out using a random stratified design divided into grid squares at three depth strata (< 150 m, 151–250 m and > 250 m). A non-randomised ‘transect’ design was used for the 2003 survey, where trawls were undertaken at pre-determined locations along transects radiating away from shore to a depth of 900 m.
Details of the fourteen groundfish surveys undertaken around South Georgia and Shag Rocks between 1986 and 2006.

Fish were sorted by species and total catch weight was determined using motion compensated marine scales. The following data were recorded for individual fish when time allowed: total length (mm) to the nearest mm below, total weight (g) to the nearest gram sex, and maturity stage (according to a five-point scale, Kock & Kellerman Reference Kock and Kellerman1991).
During the 2005 and 2006 surveys stomachs were removed from sub-samples of the catch and frozen at -20°C in zip-lock bags for subsequent processing in the laboratory at the Applied Fisheries Research Station, King Edward Point, South Georgia.
Stomach contents analysis
The stomachs were thawed and the contents were identified and separated into constituent species or species groups. Stomach contents were identified to the lowest possible taxonomic level using published guides (Gon & Heemstra Reference Gon and Heemstra1990, Reid Reference Reid1996) and reference collections. Prey items were counted, weighed to the nearest 0.01 g and measured to the nearest mm below. In the case of partially digested fish, the sagittal otoliths were used (when found) to aid with identification by comparison with reference material and Reid's (1996) guide. The total length of these fish was estimated using otolith-length relationships (Reid Reference Reid1996).
Diet was expressed as percent mass (%M), percent by number (%N), percent frequency of occurrence (%F) and by percent index of relative importance (%IRI: see Cortes Reference Cortes1996). Percent index of relative importance was calculated using a combination of %M, %N and %F (see below).
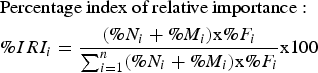
Biomass estimates & length frequency analysis
For each catch, fish density was estimated using the mass of the catch, distance trawled and horizontal opening of the net. The net opening was measured by sensors placed in the wing ends. Catchability (q) was assumed to be 1, that is all fish within the swept area of the trawl were caught and that there was no additional herding by the trawl doors. Biomass estimates were obtained using the TrawlCI programme, which uses Aitchison's delta distribution to generate unbiased estimates of abundance with confidence intervals (de la Mare Reference De la Mare1994). The input data were the individual densities for each trawl, stratified by depth zone, and the seafloor area for each depth strata, which was taken from Everson & Campbell (Reference Everson and Campbell1991).
Analyses of the length frequency distributions of P. georgianus from each survey were carried out using “MIX” software (Macdonald & Green Reference Macdonald and Green1988), applied in “R” as “RMIX” (Du Reference Du2002). Each survey's data were examined individually, with the number of components (cohorts) and initial estimates of cohort means being estimated from length-frequency plots. “RMIX” outputs were unconstrained and were run from different starting parameters (means, standard deviations and proportions) to find the optimal solution (minimising χ2). September 1997 data were excluded as the survey was undertaken at a different time of year.
Length-mass relationships and length at first spawning were assessed. The length at which 50% of the population spawns for the first time (L50) was estimated by fitting a logistic curve to the cumulative frequency of individuals of maturity stage 3 and greater. L50 was estimated for both sexes.
Mean larval hatching date (birth date) was assumed as 1 August (British Antarctic Survey (BAS), unpublished data) and the resultant means from the “RMIX” analysis were assigned an age relating to the length-frequency distributions. In order to produce a more appropriate growth curve, length data from larvae and juvenile fish (0+) were included. These supplementary data were attained from the larval sampling programme undertaken in Cumberland East Bay, South Georgia (August–December 2001–05) and from pelagic tows carried out during the 2004 Dorada demersal fish survey. Larval and juvenile fish were assigned ages based on capture dates in relation to mean hatch data. A mean total length from the month of peak abundance for each year (November 2001, 27 mm, n = 3; September 2002, 26 mm, n = 3; August 2003, 22 mm, n = 5; August 2004, 24 mm, n = 5; November 2005, 24 mm, n = 3) was determined from the larval data and a mean total length (58 mm) was calculated for the juvenile fish collected during the 2004 Dorada survey (n = 8). A von Bertalanffy growth curve was then fitted to these unvalidated length-at-age data, using least squares regression methods in Sigma Plot 10.0.
Additional data analysis
Correlation analyses were undertaken, using MINITAB 14, to investigate relationships between depth and fish length and prey size in relation to the size of South Georgia icefish.
Results
Distribution and biomass
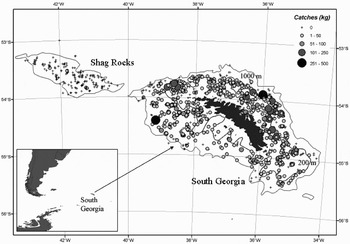
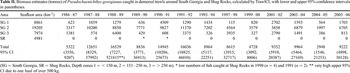
Pseudochaenichthys georgianus were found throughout the South Georgia shelf (Fig. 1). They were recorded in 87% (n = 674) of trawls undertaken during fourteen annual surveys around the island. In comparison, the density of South Georgia icefish was considerably less around Shag Rocks, being caught in less than 1% of trawls carried out in this area (in 1990 and 1991). Biomass estimates, based on swept areas of trawls display considerable interannual variability (Table II), being highest in 1989 (16 529 tonnes) and lowest in 2005 (2948 tonnes). Since 1994 the estimated biomass for this species has not exceeded 10 000 tonnes. The greatest biomass of P. georgianus was caught at depths between 150 m and 250 m.
Distribution (by estimated biomass) of Pseudochaenichthys georgianus around South Georgia and Shag Rocks from fourteen demersal trawl surveys undertaken between 1986 and 2006.

Biomass estimates (tonnes) of Pseudochaenichthys georgianus caught in demersal trawls around South Georgia and Shag Rocks, calculated by TrawlCI, with lower and upper 95% confidence intervals in parentheses.

(SG = South Georgia, SR = Shag Rocks, Depth zones 1 = < 150 m, 2 = 151–250 m, 3 = > 250 m). * low numbers of fish caught at Shag Rocks in 1990 (n = 4) and 1991 (n = 2). ** very high upper 95% CI due to one haul of over 500 kg.
Length, weight and growth parameters
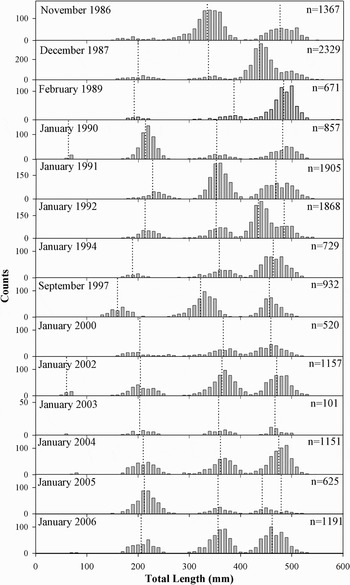
In total 15 403 P. georgianus were recorded from the fourteen surveys. Total lengths (TL) of the fish sampled ranged between 50–590 mm. Length-frequency distributions for P. georgianus for all surveys are displayed in Fig. 2. Detailed measurements were carried out on a total of 9049 fish. The TL of the 4984 males and 4065 females examined ranged from 80–560 mm TL and 140–590 mm TL, respectively. Maturity stages were not determined for all sexed fish.
Length frequency distribution (counts) of Pseudochaenichthys georgianus from the surveys carried out around South Georgia between 1986 and 2006, showing the size of fish sampled. Dotted lines indicate mean TL of each cohort determined by ‘RMIX’ analysis.

Comparing mean total length (TL) of P. georgianus with mean depth demonstrated that smaller sized fish were caught at greater depths (Pearson's correlation (r): -0.403, df 372, P < 0.001). The majority of the fish caught were found between 100–300 m. During the 2003 survey trawls were undertaken down to depths of 917 m with South Georgia icefish only being recorded from trawls down to 317 m.
Female weights ranged from 1–2070 g (n = 2107) while males weighed between 2–1980 g (n = 2553). Despite this males were found to weigh more than females for a given length. The total length (TL) (mm) to mass (M) (g) relationships are summarised by the following equations:

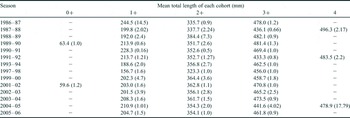
In each year the catch was comprised of three distinct size cohorts corresponding with putative 1+, 2+ and 3+ year classes (Fig. 2). The length distribution of individual size classes varied in size between 150–220 mm (1+), 320–385 mm (2+) and 447–483 mm (3+). Low numbers of 0+ fish (1–5 month old larvae, mean TL ~ 25 mm in August–December; 8 month old juveniles, mean TL ~ 58 mm in March) and 4+ (mean TL 486 mm) were caught in certain years. Strong cohorts, identified by “RMIX”, could be tracked through consecutive years (Fig 2, Table III). The strong 1+ mode (mean TL 214 mm) evident in 1990 was tracked through the following two years, appearing as the 2+ mode (mean TL 353 mm) in 1991 and the 3+ mode (mean TL 443 mm) in 1992 (Fig. 2). The 1+ cohort (mean TL 202 mm) identified in 2000 is likely to be the 3+ size mode (mean TL 471 mm) in 2002. A growth trend for the 1+ mode in 2004 was also tracked through subsequent years as the 2+ and 3+ cohorts, in 2005 and 2006 respectively. Although three modal sizes were also determined from the 2003 survey the sample size for this survey was lower than other years, resulting from the non-randomised ‘transect’ design employed, thus age classes from 2003 were not compared to other years.
Mean total length (mm) of each Pseudochaenichthys georgianus age class determined by RMIX analysis. Standard errors are in parentheses.

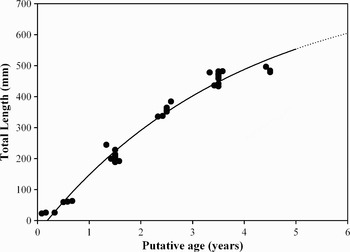
The following von Bertalanffy growth parameters were estimated; K = 0.259, t0 = 0.187 and L∞ = 776 mm by fitting a growth curve to the age-length data (Fig. 3). Growth rate in the putative first two years was similar, c. 147 mm yr-1 and 144 mm yr-1, respectively. Rate of growth decreased to 111 mm yr-1 in the third year, 86 mm yr-1 in the fourth year, 66 mm yr-1 in year five and slowed down to 51 mm yr-1 and less from year 6 onwards. Through extrapolation of the von Bertalanffy growth curve the largest fish (590 mm) caught from the fourteen surveys examined can be estimated to be between 5 and 6 years old.
Von Bertalanffy growth curve for P. georgianus, determined from the mean total lengths of each component (cohort) estimated by “RMIX”. Data were collected from 14 demersal surveys on the South Georgia shelf between 1986 and 2006. Larval and juvenile data was attained from Cumberland East Bay, South Georgia (August to December 2001–2005) and from the 2004 Dorada survey (February). Dotted line shows estimated growth.

Maturity
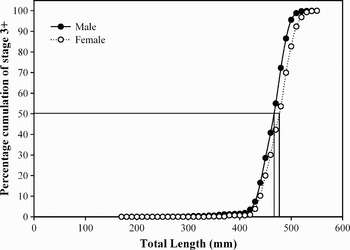
Size at 50% sexual maturity (L50) was similar for both male (465 mm TL) and female (475 mm TL) P. georgianus, at c. 60% of their maximum total length (Lmax) (Fig. 4). Almost 40% of the fish caught were immature (stage 1), with the largest proportion of these being male (64%). The majority of females (36%) were stage 2. The highest numbers of stage 1 fish were caught west of South Georgia, while higher numbers of stage 3 fish were caught to the east. A very low proportion of spawning (stage 4) or spent fish (stage 5) were recorded overall. Age estimates determined from the von Bertalanffy growth parameters, found both male and female P. georgianus to be c. 4 years old at sexual maturity.
Logistic curve for the size at maturity of male and female Pseudochaenichthys georgianus from around South Georgia. Solid lines indicate the estimated size at which 50% of the males and females reach maturity.

Stomach contents
A total of 70 stomachs from 12 trawls were examined in 2005 and 164 stomachs from 20 trawls were examined in 2006. The size of the P. georgianus sampled ranged from 90–510 mm in 2005 and 190–520 mm in 2006, representative of the length-frequency distribution of the South Georgia icefish sampled in each year.
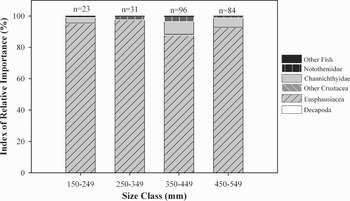
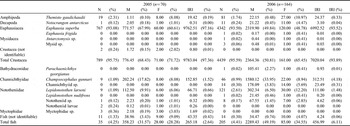
Pseudochaenichthys georgianus predominately preyed on crustaceans, which constituted 68% (by mass) and 97.4% (by IRI) of the diet in 2005 and 51% (by mass) and 93.9% (by IRI) of the diet in 2006. Antarctic krill (Euphausia superba Dana 1852) was the dominant prey item, accounting for 97.2%IRI in 2005 and 93.5%IRI in 2006 (Table IV, Fig. 5). Other crustacea recorded from both years included the amphipod Themisto gaudichaudii Guérin-Méneville 1825 and the decapod Notocrangon antarcticus Pfeffer 1887. The euphausid Euphausia frigida Hansen 1911 and species of mysid were noted in 2006 stomachs.
Index of relative importance (%) of prey items of Pseudochaenichthys georgianus split into separate size classes from around South Georgia. Data from January 2005 and 2006 pooled together.

Diet composition of South Georgia icefish (Pseudochaenichthys georgianus) collected around South Georgia in January 2005 and 2006, expressed as % number (N),% mass (M),% frequency of occurrence (F) and a % index of relative importance (IRI) has been determined (see Cortes Reference Cortes1996).

(n = number of stomachs examined for each season).
Champsocephalus gunnari and Lepidonotothen larseni (Lönnberg 1905) were the most common fish preyed upon by P. georgianus. Similar numbers of both species (n = 9) were identified in the 2005 stomachs, however C. gunnari dominated by mass (18%) and IRI (1.5%). In 2006, despite higher numbers of L. larseni (n = 121) being recorded, C. gunnari (n = 46) dominated the fish proportion of the diet again by both mass (34%) and IRI (4.2%). Three myctophids were recorded in 2005 and one Lepidonotothen nudifrons (Lönnberg 1905) was taken in 2006.
Overall prey size increased significantly with predator size (Pearson's correlation (r): 0.206, df 166, P = 0.007). However this increase was predominantly influenced by the fish component of the diet (r = 0.252, df 67, P = 0.038). The crustacean component did not show a similar increase in size with predator size (r = -0.013, df 98, P =0.899).
Euphausia superba were taken by P. georgianus of 180 mm TL upwards. The total length of krill consumed ranged from 32–58 mm. Themisto gaudichaudii (mean length 15 mm) appeared in the diet of fish > 330 mm TL, with Notocrangon antarcticus being recorded from fish greater than 370 mm TL.
Fish were recorded from the stomachs of P. georgianus individuals of greater than 230 mm TL. Lepidonotothen larseni, ranging in size from 50–160 mm were taken by South Georgia icefish ranging from 230–500 mm TL, while C. gunnari (65–401 mm TL) were recorded in the stomachs of fish between 180–510 mm TL. Pseudochaenichthys georgianus were found to consume fish up to 98% of their own body length.
Discussion
The distribution of P. georgianus around South Georgia and Shag Rocks is consistent with previous studies, in which P. georgianus was shown to be abundant and evenly distributed over the South Georgia shelf (Sosinski & Szlakowski Reference Sosinski and Szlakowski1992) but was not commonly found on the Shag Rocks shelf. Despite proximity to South Georgia the Shag Rocks fauna is highly distinct, with the most abundant fish species being the notothenid, Patagonotothen guntheri, which is not found at South Georgia (Collins et al. Reference Collins, Shreeve, Fielding and Thurston2008).
Biomass estimates for P. georgianus have shown a corresponding decline since the 1970s to other icefish species (Sosinski & Szlakowski Reference Sosinski and Szlakowski1992) around South Georgia. The biomass determined by Kock in Reference Kock1986 was c. 25% of the biomass estimated during the 1975/76 and 1977/78 seasons (36 401 and 31 057, respectively) (Mucha Reference Mucha1984, Sosinski & Szlakowski Reference Sosinski and Szlakowski1992). Although Sosinski & Szlakowski (Reference Sosinski and Szlakowski1992) found P. georgianus maintained a relatively stable biomass level during the 1980s the results in Table II show that since 1986 there has been high variability in biomass estimates for this species, which have remained lower (10–55%) than pre-exploitation levels.
There was a decrease of large fish in the South Georgia icefish stock from 1977/78 to 1981/82, with a shift in the mode of length frequency distributions from about 500–510 mm TL to 450–460 mm, indicating an influence of fishing pressure (Kock Reference Kock1985); however direct fishing for P. georgianus has been prohibited since 1990. The current fishing pressure on this species is as bycatch in both the commercial mackerel icefish (Agnew Reference Agnew2004) and krill (Rembiszewski et al. Reference Rembiszewski, Krzeptowski and Linkowski1978, Ross et al. Reference Ross, Jones, Belchier and Rothery2006) fisheries. A precautionary bycatch limit of 300 tonnes yr-1 for P. georgianus was implemented in 1992/1993 (Agnew Reference Agnew2004) for the mackerel icefish fishery and the total catch for this species has not exceeded 25 tonnes since then (CCAMLR 2007).
Juvenile specimens (TL 50–300 mm) have been caught in krill trawls (Rembiszewski et al. Reference Rembiszewski, Krzeptowski and Linkowski1978, Everson et al. Reference Everson, Neyelov and Permitin1992, Ross et al. Reference Ross, Jones, Belchier and Rothery2006). Frequency of occurrence depends on location, seasonal differences and water depth (Ross et al. Reference Ross, Jones, Belchier and Rothery2006), which was evident when Rembiszewski et al. (Reference Rembiszewski, Krzeptowski and Linkowski1978) found that P. georgianus accounted for 5% of the total weight of some shallow shelf trawls undertaken from twilight to dawn. A potential fishing pressure on the larval stages will have an adverse impact on recruitment of P. georgianus.
Pseudochaenichthys georgianus occupies overlapping habitat niches to Champsocephalus gunnari, sharing the bottom of the deep fjords around South Georgia as juveniles (Olsen Reference Olsen1955) and spending some time in the pelagic zone feeding on krill as adults (Olsen Reference Olsen1955, Targett Reference Targett1981). In common with other members of the Channichthyidae around South Georgia P. georgianus are thought to move inshore to spawn (Kock Reference Kock1992) and are likely to have demersal eggs which may require a period of parental care or brooding (Olsen Reference Olsen1955, Permitin Reference Permitin1973, Detrich et al. Reference Detrich, Jones, Kim, North, Thurber and Vacchi2005, Kock et al. Reference Kock, Pshenichnov and DeVries2006). The absolute and relative fecundity of this species is relatively low, while the eggs are large (Permitin Reference Permitin1973). Thus parameters that influence the biomass of mackerel icefish, such as hydrography (Shnar & Shlibanov 1990), sea surface temperature (Hill et al. Reference Hill, Reid and North2005) and krill abundance (Everson et al. Reference Everson, Parkes, Kock and Boyd1999), may also impact on the stock of South Georgia icefish. The interannual variability in the direction of flow and the velocity of the shelf break front described by Meredith et al. (Reference Meredith, Brandon, Murphy, Trathan, Thorpe, Bone, Chernyshkov and Sushin2005) may effect the distribution of P. georgianus larvae and thus recruitment of this species, resulting in larval retention on the continental shelf.
Reid et al. (Reference Reid, Davis and Staniland2006) found P. georgianus to be an important prey species of Antarctic fur seals around South Georgia. The recovery of the Antarctic fur seal population around South Georgia to in excess of 5 million (Reid et al. Reference Reid, Davis and Staniland2006) may indicate a potentially significant predatory pressure on P. georgianus.
At least three distinct cohorts are distinguishable from the length-frequency data each year and it is possible to track strong cohorts through successive years. Pseudochaenichthys georgianus are first sampled as putative 1+ year olds (TL 189–244 mm), although recruitment of these 1+ fish shows considerable interannual variability. The majority of 1+ sized fish were recorded from the south-west of South Georgia possibly indicating that this area is important in terms of a nursery ground, while the highest proportion of larger, and presumably older, fish are found to the north-east of the island. Juvenile (1+) Chaenocephalus aceratus (Reid et al. Reference Reid, Clarke, Collins and Belchier2007) and C. gunnari (Frolkina Reference Frolkina1999) also recruit to the south of the island, before migrating to the northern shelf, indicating comparable life history strategies for all three icefish species around South Georgia.
Previous investigators (Olsen Reference Olsen1955, Mucha Reference Mucha1980, Chojnacki & Palczewski Reference Chojnacki and Palczewski1981, Traczyk Reference Traczyk1992) have examined growth increments of P. georgianus using both otoliths and vertebrae. The ageing of icefish species has proved difficult and earlier researchers acknowledge that their age data on P. georgianus may contain errors (see Mucha Reference Mucha1980). To date no validation of the annual deposition of growth rings in P. georgianus otoliths has been accomplished. However, a more recent study by Traczyk (Reference Traczyk1992) examined the daily increments and otolith weight relationships of P. georgianus and used length-frequency analysis to achieve reliable age data for this species.
Analysis of growth increments was beyond the scope of this present study. Tracking cohorts between surveys using length-frequency is subjective and thus results should be treated with some caution. However, in the highly seasonal environment around South Georgia, the clear modes consistently identified in the first three size classes supports the hypothesis that these are year classes and indicates relatively rapid growth. The growth parameter K = 0.259 is in close agreement with those determined from earlier investigations (Mucha Reference Mucha1980, K = 0.358; Chojnacki & Palczewski Reference Chojnacki and Palczewski1981, K = 0.283; Traczyk Reference Traczyk1992, K = 0.42) and the current study, in general, concurs with the findings of Olsen (Reference Olsen1955), Mucha (Reference Mucha1980) and Chojnacki & Palczewski (Reference Chojnacki and Palczewski1981) who found South Georgia icefish to have a rapid growth rate in the early years of development.
There are differences between this and previous studies in terms of growth rate estimates. The identical growth rate of 100 mm yr-1 for the first 4–5 years reported by Olsen (Reference Olsen1955) and Chojnacki & Palczewski (Reference Chojnacki and Palczewski1981) was not reflected in the current study. Chojnacki & Palczewski (Reference Chojnacki and Palczewski1981) state that the von Bertalanffy model may not be a suitable fit for growth increments of P. georgianus during early development, as it assumes decreasing length increments in successive years. Thus they estimated the growth rate for these early years by using a linear regression (Chojnacki & Palczewski Reference Chojnacki and Palczewski1981). Length increments were found to decrease annually in the present analysis, and therefore a von Bertalanffy growth curve was considered to be the most appropriate growth model.
The sizes of putative 0+, 1+, 2+, 3+ and 4+ year old fish from the present length-frequency investigation (see Table III) are similar to Traczyks' (1992) ELEFAN analysis results (TLs of 70, 250, 360, 440 & 490 mm) and to Olsens' (1955) results for 0+, 1+ and 2+ year olds (TLs ranging from 60–100, 170–230 & 270–330 mm, respectively). The size of fish determined from studies carried out by Mucha (Reference Mucha1980) and Chojnacki & Palczewski (Reference Chojnacki and Palczewski1981) were smaller however, with their 2+ year old fish corresponding in length to the 1+ fish from the present study. The L∞ (776 mm) determined here is higher than preceding investigations (Mucha Reference Mucha1980 L∞ = 546 mm, Chojnacki & Palczewski Reference Chojnacki and Palczewski1981 L∞ = 501 mm, Traczyk 1992 L∞ = 601 mm).
The significant decline in growth rate after the first four years is most probably due to attainment of sexual maturity (Olsen Reference Olsen1955). L50 determined for males (465 mm TL) and females (475 mm TL) agree with Permitin's (1973), where male and female P. georgianus were found to attain sexual maturity at body lengths of 400–480 mm and 440–500 mm, respectively (Chojnacki & Palczewski Reference Chojnacki and Palczewski1981). According to Kock (Reference Kock1992) length at first spawning commonly attained by Antarctic fish is between 55–80% of their maximum total length (Lmax), with some species not spawning until they have attained 70–80% of their final size. Similar to Olsen (Reference Olsen1955) and Kock (Reference Kock1981) P. georgianus are assumed to commence spawning at c. 4 years of age.
Although this study only examined the summer diet of P. georgianus it is clear that this species is a predator of krill and pelagic fish as suggested by Linkowski & Rembiszewski (Reference Linkowski and Rembiszewski1978), Targett (Reference Targett1981), Eastman (Reference Eastman1993) and McKenna (Reference McKenna1991). The results of McKenna's (1991) study found that the diet of P. georgianus overlapped by 80% with that of the bathydraconid, Parachaenichthys georgianus preying heavily on fish, however, the sample size was small (n = 27). Targett (Reference Targett1981) found P. georgianus to overlap greatly with C. gunnari and Lepidonotothen larseni, due to the importance of E. superba and mysids in their diets. Both C. gunnari and C. aceratus made up a small proportion of the diet of the P. georgianus examined by Linkowski & Rembiszewski (Reference Linkowski and Rembiszewski1978), while krill was the dominant food component.
McKenna (Reference McKenna1991) found South Georgia icefish tended to feed on smaller fish than C. aceratus, despite having a similarly large gape. This is consistent with our findings compared to those of Reid et al. (Reference Reid, Clarke, Collins and Belchier2007) who found C. aceratus to ingest fish up to 490 mm TL whereas 401 mm TL was the largest fish taken by a P. georgianus examined in this study.
Pseudochaenichthys georgianus undergoes diurnal vertical migrations to feed on krill (Linkowski & Rembiszewski Reference Linkowski and Rembiszewski1978), therefore the considerable interannual variability of krill abundance at South Georgia (Brierley et al. Reference Brierley, Watkins and Murray1997) is likely to influence their diet. Despite this, the relatively scarce krill abundances indicated by the poor 2004/05 and 2005/06 seasons for land-based krill-dependent predators at South Georgia (Jaume Forcada, BAS unpublished data) do not seem to have influenced the diet of the P. georgianus examined here, with Antarctic krill being the dominant prey item.
Acknowledgements
We would like to thank the captains, crews and scientists who have been involved in South Georgia and Shag Rocks trawl surveys since 1986. The first two surveys were undertaken as part of the United States Antarctic Marine Living Resources Programme, the third was a joint UK/Poland survey and the remainder, were carried out by the Government of South Georgia and the South Sandwich Islands. This work was conducted at King Edward Point Applied Fisheries Laboratory, South Georgia, under contract to the Government of South Georgia and the South Sandwich Islands. Thanks to two anonymous referees for their constructive comments on the manuscript. This is a contribution to the Scotia Sea Foodwebs Project in the BAS Discovery 2010 Science Programme.