Implications
Our goal was to conduct a herd-level N mass balance study to determine and monitor the changes in ammonia-N emission in response to feeding practices and seasonal conditions throughout the year that reflected commercial farm-like conditions in the Midwest of the United States. Although temperature was poorly associated with ammonia-N emission during manure collection, the removal of excess crude protein from the diet reduced emission without altering milk production. This study illustrated the potential of diet manipulation as an economically effective abatement strategy for dairy producers because N intake was the single factor most closely associated with ammonia emission.
Introduction
Manure from livestock operations is the major source of anthropogenic NH3–N emission in the United States (National Research Council (NRC), 2003; US Environmental Protection Agency (EPA), 2005) and globally (Food and Agriculture Organization of the United Nations (FAO), 2006). Current emission factors range from 3.6 to 21 kg NH3–N per head per year for lactating dairy cattle depending on mode of housing and manure collection (EPA, 2005). Although factors that control NH3–N volatilization are well understood (Monteny et al., Reference Monteny, Schulte, Elzing and Lamaker1998) and have been included in prediction models (Rotz and Oenema, Reference Rotz and Oenema2006), direct estimates of emission and evaluation of abatement strategies under common farm conditions remain a challenge.
Several studies have evaluated the relationship between NH3–N emission and dietary crude protein (CP) under laboratory settings (Paul et al., Reference Paul, Dinn, Kannangara and Fisher1998; James et al., Reference James, Meyer, Esparza, Depeters and Perez-Monti1999; Misselbrook et al., Reference Misselbrook, Powell, Broderick and Grabber2005). There have been few attempts to study the impact of dietary CP on NH3–N emission at the herd level in long-term studies that reflect farm-like conditions in which ration composition and other management practices change along with seasonal temperature. Recent results have indicated that dietary CP can be reduced from 18% to 16.5% of ration dry matter (DM) with no impact on milk production (Broderick, Reference Broderick2003; Olmos Colmenero and Broderick, Reference Olmos Colmenero and Broderick2006), but a 9% reduction in manure N excretion and a 16% reduction in urinary-N excretion (Wattiaux and Karg, Reference Wattiaux and Karg2004b). As urinary urea-N is most vulnerable to volatilization after conversion to NH3 on the barn floor (Muck and Richards, Reference Muck and Richards1983), avoiding excess dietary N may be an effective NH3–N emission abatement strategy (James et al., Reference James, Meyer, Esparza, Depeters and Perez-Monti1999). Unfortunately, feeding excess dietary CP may still be common in US dairy farms as dietary CP averaged 17.8 ± 0.1% in a recent survey conducted in 106 large US herds (Caraviello et al., Reference Caraviello, Weigel, Fricke, Wiltbank, Florent, Cook, Nordlund, Zwald and Rawson2006). The work of Van Duinkerken et al. (Reference Van Duinkerken, Andre, Smits, Monteny and Sebek2005) suggested that milk urea nitrogen (MUN) could be used to predict NH3–N emission because bulk tank MUN was a good indicator of emission reduction when excess dietary CP was removed from the diet. There are ample evidences that MUN is an accurate predictor of dietary CP (Broderick and Clayton, Reference Broderick and Clayton1997; Jonker et al., Reference Jonker, Kohn and Erdman1998; Kohn et al., Reference Kohn, Kalscheur and Russek-Cohen2002) and urinary urea-N excretion (Burgos et al., Reference Burgos, Fadel and DePeters2007) nevertheless, under farm-like conditions MUN is affected by management and other non-nutritional factors (Wattiaux et al., Reference Wattiaux, Nordheim and Crump2005).
Thus, the main objective of this experiment was to monitor the impact of barn side and dietary CP on production performance, manure production and composition and NH3–N emission from a lactating dairy herd housed in a free-stall barn and managed under farm-like conditions throughout a number of months in each season of the year. An additional objective was to evaluate the relationship between MUN and dietary CP, manure N excretion and NH3–N loss.
Material and methods
Facilities, experimental design and herd management
This study was carried out at the Pioneer system-research farm, University of Wisconsin, Platteville, from February 2004 to January 2005. Before this trial, no large-scale studies had been conducted with this herd, which had been managed for teaching purpose, and it was agreed that the interference due to sampling and data collection would be minimized in order to maintain farm-like management practices throughout the trial. Facilities included a four-row drive-through barn with tail-to-tail stall configuration and concrete floor with one side of the barn oriented to the north and the other to the south. Surface area of the front and back alley was 99.3 and 74.6 m2, respectively. Stalls were floored with mattresses and bedded daily with an average of 0.4 kg per cow of chopped oat straw. Before the onset of the trial, lactating cows were randomly assigned to a ‘green’ or ‘blue’ group based on stage of lactation and parity. The green group consisted of 36 cows (166 ± 108 days in milk (DIM)) producing 34.2 kg of milk/day, whereas the blue group included 35 cows (180 ± 100 DIM) producing 32.5 kg of milk/day.
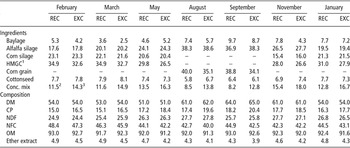
Two rations were balanced according to NRC (2001) with a minimum of 45% forage as corn silage, alfalfa silage or alfalfa baylage to support 33 kg/day milk. Our goal was to maintain the average CP (DM basis) of the recommended (REC) diet between 16% and 17% and to formulate an excess CP diet 1.5 unit above the REC diet. This difference was achieved by substituting a high protein custom-made concentrate mix for corn grain or high moisture ground corn and substituting solvent soybean meal for expeller soybean meal and blood meal in the concentrate mix (Table 1). During the months of August and September, alfalfa silage replaced corn silage, which was no longer available and similarly, corn grain replaced high moisture ground corn. Except for alfalfa baylage, which was top-dressed twice a day, ration ingredients were mixed and delivered at approximately 0800 and 1800 hours. The amount of mixed ingredients offered daily was adjusted to minimize refusals.
Dietary ingredients and composition (% of DM)

REC = recommended; EXC = excess.
1High moisture ground corn.
2Ingredient compositions (dry matter basis) for REC diet concentrate mix: expeller soybean meal 68%, blood meal 11%, dicalcium phosphate 2%, limestone 2%, magnesium oxide 4%, salt 2% sodium bicarbonate 7%, vitamins 5%.
3Ingredient composition (dry matter basis) for EXC diet concentrates mix: solvent soybean meal 51%, expeller soybean meal 22%, blood meal 9%, dicalcium phosphate 4%, limestone 1%, magnesium oxide 2%, salt 1% sodium bicarbonate 6%, vitamins 3%.
To avoid possible confounding effects due to feeding the same diet to the same group of cows on the same side of the barn, each month cows in the green group and blue group were switched (or not) from the north to the south side of the barn with (or without) re-allocation of dietary treatment. At the end of the trial, the green group had been allocated four times to the south side of the barn and three times to the north side of the barn, whereas the blue group had been allocated three times to the south side of the barn and four times to the north side of the barn. Cow body weights (BW) were recorded when they entered the trial, 2 to 3 weeks after calving, and when removed from the trial at dry-off, 60 days before the anticipated next calving. Dry cows and early lactation cows were managed in separate facilities. Cows were cared for according to the guidelines of the Research Animal and Resource Committee at the University of Wisconsin-Madison and all experimental procedures were approved.
Data and sample collection
The amounts of feed, bedding, milk and manure to and from each group of cows were recorded and samples were collected in February, March, May, August, September and November of 2004 and January of 2005. Data were not collected for the other months of the year because of either errors in concentrate mix formulation at the local feed mill or shortage of labor to complete the manure scraping protocol (see below). Thus, cows were adapted to their experimental diets for at least 2 weeks before a 2-week data collection period.
Group Milk N. Milk yield was recorded on each cow at each of two daily milkings (0500 and 1600 h), and average milk production of each group of cows was calculated with data from the last 2 weeks of a monthly collection period. During one of the manure collection days (see below), milk samples were collected from each cow at the morning and evening milking. Samples were frozen at −20°C for posterior analyses of total N and MUN. In addition, results from monthly Dairy Herd Improvement Association (DHIA) testing service (AgSource-CRI, Verona, WI, USA) were recorded. The DHIA sampling occurred within 7 ± 4 days of the manure sampling collection days and followed a standard morning/evening protocol in which monthly samples were obtained from a single milking alternating between the morning and the evening milking in consecutive months.
Group Feed and Bedding N. Feed offered and refusals were recorded daily and group DMI (DM offered minus DM refused) was calculated with data from the last 2 weeks of a monthly collection period. Rations were adjusted periodically for changes in forage DM concentration. Diet ingredients were sampled on the last day of each monthly collection period. Oat straw bedding addition was recorded and sampled monthly. All samples were dried for 48 h in a 60°C forced-air oven and stored until further analyses.
Group Manure N. Preliminary measurements indicated that automatic scrapers collected on average 70% of the manure in the alleys. Thus, measurements of manure production were conducted after cleaning alleys with automatic scrapers followed by manual scrapping. Measurements were conducted on 8-h intervals staggered over a 3-day period to include every hour of a 24-h clock. At 0800 hours on day 1, front and back alleys were cleaned. Manure was allowed to accumulate during the subsequent four hours. At 1200 hours manure scraped to the end of each alley was mixed manually and weighed using 19-L buckets and a bench scale (Ohaus ES Series Bench Scale, Ohaus Co., Pine Brook, NJ, USA). Then, manure was allowed to accumulate for another 4-h interval before applying the same scrapping and weighting procedure. This 8-h protocol was applied on day 2 between 1600 and 0000 hours and on day 3 between 0000 and 0800 hours. Manure deposited away from the alley during milking (approximately 1 h at each milking) was not collected or sampled. As cows were given time to stand up and void themselves before walking away from the alleys, the error in the measurement of manure production due to this lapse in sampling was likely less than proportional to the amount of time spent in the holding area and the milking parlor. This contention is supported by the data of White et al., (Reference White, Sheffield, Washburn, King and Green2001) obtained with cows brought to the holding area and the milking parlor from pasture. In addition, at four of the 42 alley-scraping events, manual scrapping was missing. For those events, weight of manure measured with the automatic scraper was adjusted using preliminary estimates of residual manure. Before weighing the pile of manure at the end of each alley, samples from different locations were collected, mixed and sub-sampled twice for measurement of temperature and pH before acidification (Twin pH-meter Model B-213, Spectrum Technologies Inc., Plainfield, IL, USA) with 8 ml of 60% sulfuric acid. Both samples were frozen at −20°C for posterior compositional analysis.
Ambient Temperature. Barn temperature was recorded daily at 1-h intervals using four remote sensors (Watchdog™ Data loggers Spectrum Technologies Inc., Plainfield, IL, USA) located 2.13 m from the barn floor. Average outside temperature was recorded daily in a meteorological station located on the premises.
Sample analyses
After thawing overnight at 5°C, daily milk composites were generated for each cow weighted by morning and evening milk production (45% in the morning and 55% in the evening). Samples were divided in two sub-samples, one for the analysis of total N (Association of Official Analytical Chemists (AOAC), 1990) and the other for MUN by an enzymatic colorimetric assay (MUNE) (Chaney and Marbach, Reference Chaney and Marbach1962). Samples collected by DHIA were analyzed by AgSource-CRI commercial laboratory (Menomonie, WI, USA) using the combiFoss 5000 (Foss Electric, Hillerød, Denmark) that allows for determination of fat and protein by MilkoScan 4000 and MUN by infrared (MUNIR) using the differential pH method as a standard. After thawing overnight at 5°C, manure samples were lyophilized in a Frezone 12 freeze dryer (Labonco Corporation, Kansas City, MO, USA). Feed, bedding and lyophilized manure samples were ground through a 1-mm screen (Wiley Mill, Arthur H. Thomas, Philadelphia, PA, USA) and analyzed for DM, organic matter (OM), and total N. Manure DM was calculated as the amount of sample recovered after lyophilization, but feed and bedding DM was determined with a 105°C forced-air oven. For all samples, OM was determined using a muffle furnace maintained at 550°C for 12 h. Ash content was calculated as 100 – OM. CP in feed, manure and bedding was determined by micro-Kjeldahl (AOAC, 1990). However, macro-Kjeldahl was used to determine milk N (AOAC, 1990). Neutral detergent fiber was determined on feed samples using α-amylase (Sigma no. A3306: Sigma Chemical Co., St Louis, MO, USA) with sodium sulfite and corrected for ash concentration according to Van Soest et al. (Reference Van Soest, Robertson and Lewis1991), adapted for Ankom200 Fiber Analyzer (Ankom Technology, Faiport, NY, USA). Non-fibrous carbohydrate (NFC) was calculated as 100−(NDF + ether extract + CP + ash), where ether extract was from Table 15.1 of NRC (2001). Dietary chemical composition (DM basis) was computed from chemical composition and proportion of ingredients in dietary DM.
Group N balance and NH3–N emission
In this experiment, the group of cows was the experimental unit, but for convenience of data interpretation, all results were expressed on a per-day and per-cow basis. Ammonia-N emission was estimated for each group of cows for each monthly sampling period by N mass balance (Nin−Nout = 0) with the following equation:

where Intake N (g/day per cow) = DMI (kg/day per cow) × ration N (% of DM) × 10; Bedding N (g/day per cow) = bedding DM (kg/day per cow) × bedding N (% of DM) × 10; Milk N (g/day per cow) = milk production (kg/day per cow) × milk total N (%) × 10; Scraped Manure N (g/day per cow) = scraped manure (kg/day per cow) × manure N (%) × 10.
In addition, NH3–N emission was expressed as a percentage of intake N, milk N and manure N, as indicators of emission in relation of feed N consumption, added-value N recovered in milk, and potential fertilizer N excreted in manure, respectively.
As bedding N added was assumed to be recovered entirely in the scraped manure, the amount of manure N (fecal and urinary N) that did not volatilize between scrapping events was calculated as scraped manure N – bedding N. Furthermore, the difference between N intake and milk N was used as a predictor of manure N (fecal and urinary N as-excreted) by a group of cows as proposed by Van Horn et al. (Reference Van Horn, Newton and Kunkle1996). Using the above equation, NH3–N emission was estimated assuming that other volatile N compounds were a negligible fraction of the total volatilized N during manure collection. As discussed below our review of the literature suggested that the experimental conditions and housing system of this study were not conducive to the release of dinitrogen (N2), or intermediate volatile compounds (nitrous oxide, N2O and nitric oxide, NO) produced during nitrification of NH3 or denitrification of nitrate. A second assumption built in the above equation was that the N pool in the body of a group of cows remained constant. Any departure from this assumption should be minimal because variations in average DIM were relatively minor (see Table 2 below). Others have reported that change in body N was likely negligible in estimating N balance of commercial dairy herds (Powell et al., Reference Powell, Jackson-Smith, McCrory, Saam and Mariola2006).
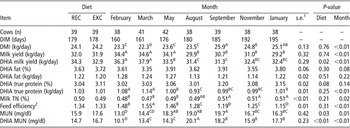
Animal performance and milk composition

REC = recommended; EXC = excess.
A–DMeans within a row with different superscript differ (P ⩽ 0.01).
a–dMeans within a row with different superscript differ (P ⩽ 0.05).
1Standard error of the mean for treatment effect.
2Calculated as average milk yield (kg/day per cow) divided by average DMI (kg/day per cow).
Statistical analysis
Data were analyzed with the mixed procedure of SAS (Statistical Analysis Systems Institute, 2001). Animal performance (DMI, milk production, milk total N, MUN, feed efficiency calculated as milk production/DMI and DHIA measurements), and N mass balance variables were analyzed using the following model:

where Yijk is a measurement from a group of cows allocated to side of the barn (i = 1 to 2), receiving diet j (j = 1 to 2) during the month k (k = 1 to 7); μ is the overall mean; Bi is the effect of side of the barn; Dj is the effect of dietary CP; Mk is the effect of month; and eijk is the residual error. For selected variables including NH3–N emission, the predicted values minus the observed values were plotted against the predicted values by diet, month and barn side, and inspected to ascertain randomness of residuals.
Manure excretion and composition variables were analyzed using the following model:

where Yijklm is a measurement from a group of cows allocated to side of the barn i (i = 1 to 2), receiving diet j (j = 1 to 2) during the month k (k = 1 to 7); collected from the alley l (l = 1 to 2) at time m (m = 1 to 3); μ is the overall mean; Bi is the effect of side of the barn; Dj is the effect of dietary CP; Mk is the effect of month; Al is the effect of alley; Tm is the effect of sampling time and eijk is the residual error.
Owing to the limited degrees of freedom, the significance of the interaction between month and diet could not be determined. However, interactions were assessed graphically. Significance was declared at P < 0.05 and tendency for 0.05 ⩽P < 0.10. When appropriate, monthly averages were separated by least significant difference at α = 0.05. The PROC REG procedure of SAS (Statistical Analysis Systems Institute, 2001) was used to assess linear relationships among the following variables: MUN, NH3–N emission, N intake, scraped manure N, and dietary CP. The same procedure was used to assess linear relationships between NH3–N emission and manure pH or manure temperature.
Results
Diet composition
Relative proportion of dietary ingredients and chemical composition of the diets are reported in Table 1 for each monthly sampling. Throughout the trial, CP ranged from 15.0% to 18.2% of DM in the REC diet and from 16.5% to 20.4% in the EXC diet. Nevertheless CP in the REC diet remained on average 1.5 percentage unit lower than in the EXC diet (mean ± s.d.; 16.7 ± 1.3 v. 18.2 ± 1.5% CP). Predicted rumen degradable protein (RDP) and rumen undegradable protein (% of DM) was 9.7 and 7.1 for the REC diet, and 11.0 and 7.2 for the EXC diet. The RDP balance obtained from NRC (2001) using actual diet ingredients and cow performance data averaged −7 ± 35 and 54 ± 37 g/day of N for the REC and the EXC diet, respectively. Overall, NFC in the REC diet was 1.5 percentage units higher than in the EXC diet (44.7 ± 2.1 v. 43.2 ± 2.5%). There were no substantial differences in OM, NDF and ether extract content, which averaged 92.3%, 26.4% and 4.6%, and 91.9%, 26.3% and 4.2% of the REC diet and the EXC diet, respectively. Net energy of lactation was 1.61 Mcal/kg DM for both diets (NRC, 2001). Overall, data presented in Table 1 and DMI reported in Table 2 suggest little differences in nutrient intake between the REC and EXC diets, except for CP and NFC.
The oat straw used for bedding contained 85.7 ± 3.4% DM and 1.14 ± 0.5% N (DM basis).
Animal performance and milk composition
In this trial, average BW was 607 kg, but ranged from 563 ± 62 kg as cows entered the trial 2 to 3 weeks after calving to 650 ± 53 kg as they exited the trial at dry off. No measurement was influenced by barn side, which therefore was excluded from tabulated results. In this trial, interactions between dietary CP and month could not be explored statistically, but bar graphs of selected measurements indicated that the magnitude of the difference in response was relatively constant when fed the EXC diet compared with the REC diet (data not shown). Consequently effects of dietary CP and month will be presented separately therein.
Dietary CP. There was no significance of dietary CP on DMI, milk yield, milk total N and feed efficiency (Table 2). However, MUNE was 1.7 mg/dl higher for the EXC diet compared with the REC diet (17.6 v. 15.9 mg/dl). In contrast to our experimental results, DHIA records indicated a higher milk yield when cows were fed the REC diet compared with the EXC diet (34.3 v. 32.9 kg/day per cow). Although DHIA milk true protein percent tended to be higher when cows were fed the EXC diet compared with the REC diet, there was no difference in milk protein yield. On the average, MUNIR from DHIA was 2.0 mg/dl higher when cows were fed the EXC diet relative to the REC diet. Although both MUN assays agreed with each other with regard to detecting a dietary effect, on average, MUNIR from DHIA was 1.05 mg/dl lower than the MUNE.
Month. Average DIM increased from 160 to 195 between February 2004 and January 2005. Month of sampling influenced all measurements reported in Table 2, except for DHIA milk fat yield and protein percent. Average DMI was lower in the first 4 months of sampling compared with the last three. In contrast milk production was higher in the first 3 months of the trial, but declined thereafter. As a result, feed efficiency declined throughout the course of the trial. Milk production from DHIA records was on average 1.61 ± 1.38 kg/day higher than the experimental milk production average; however the pattern of change over time was similar. Milk protein yield followed the same pattern as milk production, with the higher values observed early in the trial. Both MUNE and MUNIR from DHIA followed a relatively similar pattern starting with lower values early in the trial.
Manure excretion and composition
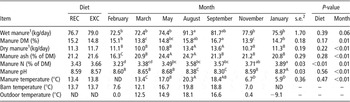
Dietary CP. Dietary CP had no influence on manure excretion or composition, except for a higher N concentration when cows were fed the EXC diet compared with the REC diet (3.66% v. 3.43%, Table 3).
Manure excretion and composition

REC = recommended; EXC = excess; ND = not determined.
A–DMeans within a row with different superscript differ (P ⩽ 0.01).
a–dMeans within a row with different superscript differ (P ⩽ 0.05).
1Excluding manure deposited for the approximately 2 h away from the alley during milkings.
2Standard error of the mean for treatment effect.
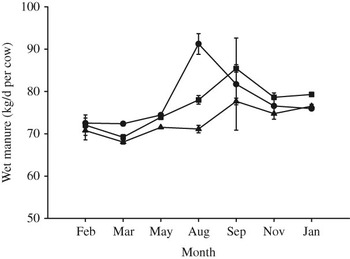
Month. Sampling month influenced all manure excretion and composition measurements. Wet manure excretion was highest in August, DM content was highest in September, and dry manure excretion was 2.7 kg/day per cow higher in August and September than any other months (13.5 v. 10.8 kg/day per cow). Total N content of manure increased gradually from 3.23% of DM at the beginning of the trial to 3.89% of DM at the end. This pattern of change appeared more related to the pattern of change in DMI than to changes in dietary CP throughout the trial. There were small but significant changes in manure pH associated with month of sampling. The lowest two pH values were observed in August and September, when alfalfa silage was the only source of forage in the diet and corn grain had replaced high moisture corn. As expected, manure temperature was affected by month of sampling. The fluctuations in ambient air temperature were reflected closely in manure temperature throughout the trial.
Barn alley and sampling time. Cows consistently deposited 40% of the daily wet manure excretion in the front alley and 60% in the back alley (data not shown). There were no differences in DM content or N content, however manure pH was higher in the front alley compared with the back alley (8.64 v. 8.54, respectively, P = 0.03). Similarly, manure temperature tended to be 1.0°C higher in the front alley compared with the back alley (13.1 v. 14.1, respectively, P = 0.09). Time of manure sampling did not influence manure composition and temperature, but manure pH was lower for the 1200 hours compared with the 2000 hours sampling time (8.51 v. 8.66, P = 0.01).
N balance and NH3–N emission
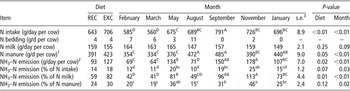
In this experiment, overall N intake, milk N, manure N, and NH3–N were (means ± s.d.) 674 ± 85, 157 ± 8, 407 ± 61 and 110 ± 48 g/day per cow, respectively. Thus, the amount of NH3–N emitted equated to 16% of N intake, 70% of milk N and 27% of manure N. In other words, 1 g of NH3–N was emitted for every 6.4 g of N consumed by the cow, for every 1.4 g of N excreted in milk, and for every 3.7 g of N excreted in manure.
Dietary CP. Intake of N was 63 g/day per cow higher when cows were fed the EXC diet compared with the REC diet (706 v. 643 g/day per cow, Table 4). Milk N excretion was not influenced by dietary CP (157 g/day per cow), but manure N was 32 g/day per cow higher for cows fed the EXC diet compared with the REC diet (423 v. 391 g/day per cow). Similarly, NH3–N emission was 34 g/day per cow higher for the EXC diet compared with the REC diet (127 v. 93 g/day per cow). Ammonia-N emission expressed as a percent of N intake, milk N and manure N was reduced by 4, 6 and 23 percentage units, respectively, when cows were fed the REC diet compared with the EXC diet (Table 4).
Nitrogen balance and NH3–N emission

REC = recommended; EXC = excess.
A–DMeans within a row with different superscript differ (P ⩽ 0.01).
a–dMeans within a row with different superscript differ (P ⩽ 0.05).
1Fecal and urinary N that did not volatize between scrapping events calculated as [manure scraped (g/day per cow) × manure N (%)] – [bedding (g/day per cow) × bedding N (%)].
2Calculated as N intake + N bedding − N milk – Scraped manure N.
3Standard error of the mean for treatment effect.
Month. Throughout the trial, N intake changed in the same pattern as described earlier for DMI. Milk N secretion remained unchanged, but the conversion of dietary N intake to milk N ranged from 22% to 29%. Manure N excretion varied considerably throughout the trial as the highest amount of manure N (485 g/day per cow) collected when cows were fed alfalfa silage as the sole source of forage in September, was 45% higher than the lowest amount of manure N (334 g/day per cow) observed in the earlier months of the trial. Month of sampling influenced the amount and percentages of NH3–N emission. The amount of NH3–N emitted was higher in September (150 g/day per cow) and November (178 g/day per cow) compared with other months and lower in March, February and August (64, 69 and 71 g/day per cow, respectively) than in the other months. There was more than a two-fold range in NH3–N emission expressed as a percent of N intake, milk N and manure N throughout the trial.
MUN and NH3–N relationships with other measurements
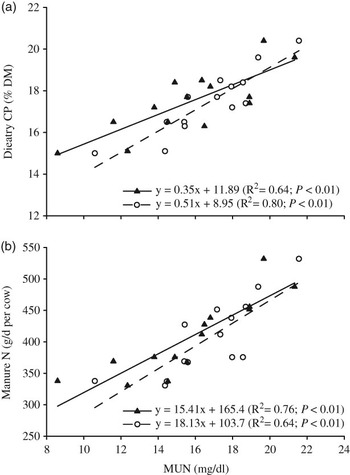
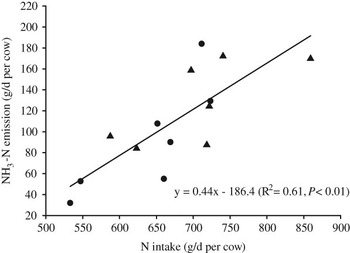
In this trial, MUN results were obtained from individual cow samples, however sample preparation and method of analysis differed between DHIA (infrared assay) and our experimental results (enzymatic colorimetric assay). Nonetheless, both the MUNIR N and MUNE were linearly related to dietary CP (% DM) and manure N excretion with R 2 in the range of 0.6 to 0.8 (Figure 1). Although MUNE tended to be linearly related with NH3–N emission (NH3–N (g/day) = −34.6 + 8.64 × MUNE (mg/dl), P = 0.08), the R 2 was low (0.23). In contrast, N intake was associated with NH3–N emission and explained 61% of its variation (Figure 2).
Relationship between MUN and dietary CP (a), and manure N (b), when MUN was determined by colorimetric (○) and infrared method (▴).

Relationship between NH3–N emission and N intake when cows were fed either the recommended (●) or excess (▴) CP in the diet.

Discussion
Diet composition and animal performance
Although our objective of maintaining a 1.5 unit difference in CP between the REC diet and the EXC diet was successful, we did not anticipate such large variations in dietary CP and N intake throughout the course of this trial. Our results agreed with those of Dhiman and Satter (Reference Dhiman and Satter1997) suggesting that a large substitution in the proportion of alfalfa silage and corn silage in the forage portion of the diet may not have a profound impact on milk production. However, under farm conditions, failure to manage inventory of silages for year-around availability may be a major source of variation in N intake, manure N excretion and ultimately NH3–N volatilization. Short-term experiments conducted at the cow level (Broderick, Reference Broderick2003; Wattiaux and Karg, Reference Wattiaux and Karg2004a) agreed with our herd-level findings that a reduction in dietary CP from approximately 18% to 16.5% (DM basis) does not impact negatively milk performance or feed efficiency over an extended period of time. In addition, our results suggest that using DHIA data to assess the effect of dietary CP on milk yield under farm-like conditions may lead to a different conclusion than using more intensive on-farm record analysis (as per the protocol followed in this trial); however, using MUNIR from DHIA or an MUNE method would lead to the same conclusion.
Prediction of manure production
In this trial, accurate measurement of manure production was a critical component of herd N mass balance. Manure collection did not include the amount deposited in the waiting area and the parlor during milking (approximately 2 h per day). However, as discussed above, the uncollected manure was likely less than proportional to the time spent away from the alleys. Mean wet manure excretion measured in this trial (77.8 ± 7.2 kg/day per cow; mean ± s.d.) was similar to predicted values from the equation of Weiss and St-Pierre (Reference Weiss and St-Pierre2006) (76.6 ± 5.2 kg/day per cow; mean ± s.d.) but somewhat higher than predicted by the equation of Nennich et al. (Reference Nennich, Harrison, VanWieringen, Meyer, Heinrichs, Weiss, St-Pierre, Kincaid, Davidson and Block2005) (72.9 ± 3.4 kg/day per cow; mean ± s.d.). An analysis of residuals as outlined in St-Pierre (Reference St-Pierre2003) indicated no mean bias (2.17 ± 2.1 kg/day, P = 0.31) or linear (P = 0.44) biases between our observed values and the predicted values according to the equation of Weiss and St-Pierre (Reference Weiss and St-Pierre2006). However, predictions using the equation of Nennich et al. (Reference Nennich, Harrison, VanWieringen, Meyer, Heinrichs, Weiss, St-Pierre, Kincaid, Davidson and Block2005) resulted in a mean bias (4.9 kg/day ± 1.9, P = 0.03) but no linear bias (P = 0.37). Interestingly, the equation of Weiss and St-Pierre (Reference Weiss and St-Pierre2006) adjusts wet manure production for forage source in the diet and predicts higher production when mostly legume forages are substituted for corn silage in the diet. These authors suggested that the increased wet manure production with a higher proportion of mostly legumes in the diet, as observed in this trial (Figure 3), was due to increased urine volume as a result of higher concentration of potassium in the diet (Bannink et al., Reference Bannink, Valk and Van Vuuren1999) rather than differences in DM or fiber digestibility of the forages. This explanation, however, agreed only partially with our observation because both percent DM and manure DM excretion were substantially increased when alfalfa was the sole source of forage in the diet (Table 3).
Wet manure excretion measured by hand scraping (●) or predicted by equations of Nennich et al. (Reference Nennich, Harrison, VanWieringen, Meyer, Heinrichs, Weiss, St-Pierre, Kincaid, Davidson and Block2005) (▴; Manure (kg/day) = 9.4 + 2.63 × DMI (kg/day)) and Weiss and St-Pierre (Reference Weiss and St-Pierre2006) (▪; Manure (kg/day) = 7.6 + 3 × DMI (kg/day) −0.11 × % corn silage in diet DM). Vertical bars represent the standard deviations.

Nitrogen balance of a group of cows
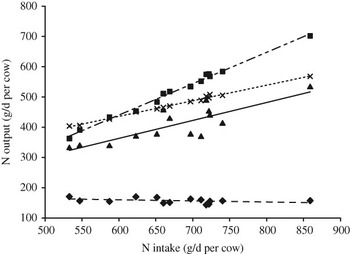
In this study, N mass balance of a group of cows was measured as N input (feed N and bedding N) minus N output (milk N, un-volatilized manure N and bedding N) from the side of the barn where the group of cows was housed. By default, this N mass balance equation assumed that feed N consumed, but not converted to milk N was excreted in the manure. In other words, the equation assumed implicitly that the amount of manure N as-excreted (fecal and urinary N before any loss due to volatilization) can be predicted by subtracting milk N secretion from N intake as suggested by Van Horn et al. (Reference Van Horn, Newton and Kunkle1996). For herd-level studies as the one reported here, the small amount of dermal and scurf N shed by cows (NRC, 2001) are likely to be recovered with the scraped manure. Also, as long as DIM remained relatively constant, change in body protein pool in a group of cows should be minimal as protein accretion in mid and late lactation (Andrew et al., Reference Andrew, Erdman and Waldo1995) compensates for protein mobilization in early lactation (Komaragiri et al., Reference Komaragiri, Casper and Erdman1998). However, an alternative to predicting manure N as-excreted by a group of cows is to use the empirical equation developed from N balance studies of individual cows as reported by Nennich et al. (Reference Nennich, Harrison, VanWieringen, Meyer, Heinrichs, Weiss, St-Pierre, Kincaid, Davidson and Block2005) (as-excreted manure N (g/day) = DMI (kg/day) × 84.1 × dietary CP (g/g) of DM + 0.196 × BW (kg)). Predicted values from this equation were evaluated against as-excreted manure N calculated as intake N – milk N (Figure 4). An analysis of residuals according to St-Pierre (Reference St-Pierre2003) showed a significant mean difference (intercept = 43.3 ± 2.98, P < 0.01) and a significant difference in slope (slope = 0.992 ± 0.07, P < 0.01). The slope difference translated into an overestimation of manure N of 26 g/day at the bottom of the range (404 g/day), and a more serious underestimation of manure N of 136 g/day at the top of the range (567 g/day) of as-excreted manure N calculated as intake N – milk N. Overall, the estimate based on N mass balance approach used in this trial (intake N – milk N) for a group of cows was 9% higher than the prediction of manure N derived from a database of individual cow measurements (Nennich et al., Reference Nennich, Harrison, VanWieringen, Meyer, Heinrichs, Weiss, St-Pierre, Kincaid, Davidson and Block2005), which have been incorporated in the standards of the American Society of Agricultural Engineers (ASAE, 2005). Similarly, Hollmann et al. (Reference Hollmann, Knwolton and Hanigan2008) reported 7% greater expected manure N production from N mass balance compared with predicted values based on Nennich et al. (Reference Nennich, Harrison, VanWieringen, Meyer, Heinrichs, Weiss, St-Pierre, Kincaid, Davidson and Block2005). In summary, the data used in calculating N mass balance, indicated that N intake had no effect on milk N secretion, and the un-volatilized manure N (scraped manure N – bedding N) increased linearly with N intake albeit at a slower rate than the as-excreted manure N (fecal and urinary N as-excreted) calculated as intake N – milk N (Figure 4).
Relationship between N intake and milk N (⧫), manure N (scraped manure N – bedding N, ▴) and predicted manure N calculated as N intake minus milk N (▪) or as per Nennich et al., Reference Nennich, Harrison, VanWieringen, Meyer, Heinrichs, Weiss, St-Pierre, Kincaid, Davidson and Block2005 (×).

NH3–N emission during manure collection
One of the main assumptions in the NH3–N emission computation used in this study was the negligible emission of other volatile N compounds. In slurry-based housing systems (i.e. free stall barns) nitrifying activity is low and probably has a minor effect on total N volatilization losses (Sommer et al., Reference Sommer, Zhang, Bannink, Chadwick, Misselbrook, Harrison, Hutchings, Menzi, Monteny, Ni, Oenema and Webb2006). Hollmann et al. (Reference Hollmann, Knwolton and Hanigan2008) found no detectable amount of nitrate or nitrite in manure samples collected from a freestall barn. In addition, Wheeler et al. (Reference Wheeler, Adviento-Borbe, Topper, Brown and Varga2008) evaluated the impact of different diets on NH3–N and N2O–N emissions from manure deposited in freestall barn floor. Overall, N2O–N emissions were <0.1 g per cow per day and accounted for <1% of the average NH3–N emission (3.2 g/day per cow). The authors speculated that high rate of NH3–N volatilization may limit substrate availability for nitrification. In contrast, nitrifying activity in surface layers of manure deposited on deep litter and slate floor barns can oxidize significant amounts of NH3–N into nitrate, thereby increasing the potential for production and losses of intermediary volatile N compounds (Sommer et al., Reference Sommer, Zhang, Bannink, Chadwick, Misselbrook, Harrison, Hutchings, Menzi, Monteny, Ni, Oenema and Webb2006). Jungbluth et al. (Reference Jungbluth, Hartung and Brose2001) reported averaged NH3–N and N2O–N emissions from dairy cows housed in barns with slate floor of 13.8 g NH3–N and 1.2 g N2O–N per livestock unit (1 livestock unit = 500 kg BW).
Housing and season. In this study, NH3–N emission averaged 110 ± 48 g/day per cow with no clear seasonal trends. In contrast, NH3–N emissions reported by Moreira and Satter (Reference Moreira and Satter2006) when manure was scraped from the alleys of a free stall barn ranged from 109 g/day per cow in the winter to 244 g/day per cow in the summer. When manure was collected with a flushing system daily NH3–N emission was 182 g/day per cow (Hollmann et al., Reference Hollmann, Knwolton and Hanigan2008). Although this result was collected in a 14-month study, the authors did not discuss any seasonal effects. Clearly, the impact of housing and manure collection system cannot be overemphasized as Powell et al. (Reference Powell, Broderick and Misselbrook2008) reported considerably lower NH3–N emission from solid manure collected in the gutter of a tie-stall barn (6.7 g/day per cow in the winter, 8.4 g/day per cow in early fall, and 18.8 g/day per cow in the spring) compared with emission obtained from slurry or liquid manure collected from a free stall barn. Such differences have been reported in European research (Monteny and Erisman, Reference Monteny and Erisman1998) and they have recently been incorporated in the US Environmental Agency National Emission Inventory (EPA, 2005). This publication estimated N emission separately in the housing area, during storage and after land application and predicted N emission in the housing area to be 9%, 18% and 22% of N excreted for scrape barn handling solid manure, flushed barn, and scrape barn with a slurry system, respectively. As the EPA (2005) assumed that the average lactating cow produces manure N at a rate of 273 g/day, N emission in the housing area of a freestall barn similar to the one used in this trial would be 60 g/day per cow (i.e., 273 × 0.22). This value is considerably lower than the one we observed, not because of substantial difference in percentage loss, but rather because lactating cows in this trial produced two to three times the amount of N assumed by the EPA (2005) publication. The N excretion results are in accordance with previous studies in which cows were fed similar dietary CP levels to the ones used in this experiment (Wattiaux and Karg, Reference Wattiaux and Karg2004b; Olmos Colmenero and Broderick, Reference Olmos Colmenero and Broderick2006). In this study, 21% of the predicted manure N excretion was volatilized, which is lower than the 39% measured by Hollmann et al. (Reference Hollmann, Knwolton and Hanigan2008) in a flushed free-stall barn, but higher than the 16% reported by Rotz (Reference Rotz2004) from a review of the literature. Although our measurements were conducted under a protocol respectful of normal management practices, at least two factors have biased the NH3–N emissions reported here. First, under normal practice, the 30% of manure uncollected by mechanical scraping (as determined in our preliminary observations) may enhance NH3–N volatilization because of increasing time and surface area of exposure (Braam et al., Reference Braam, Smits, Gunnick and Swierstra1997). Thus the thorough manual scrapping conducted here may have contributed to underestimating NH3–N emission. In contrast, our mass balance calculation resulted in an overestimation of emission because the manure deposited away from the feeding alleys was not recorded.
Dietary CP. In this trial, feeding EXC dietary N did not result in higher milk production or milk N secretion. However, by feeding cows a diet containing the NRC (2001) recommended dietary CP (16.7% of diet DM), we observed a 27% reduction in NH3–N emission compared with feeding cows a diet containing 18.2% CP (93 v. 127 g/day per cow). Smits et al. (Reference Smits, Valk, Elzing and Keen1995) also reported large effects of dietary CP on emission. These authors observed a 39% reduction in N emission when dietary CP was reduced from 20% to 15% of diet DM. The effect of N intake on NH3–N emission is illustrated clearly in Figure 4 because the surface area between the predicted manure N line (predicted manure N (g/day per cow) = −180.9 + 1.035 × N intake (g/day per cow), R 2 = 0.99) and the manure N line (manure N (g/day per cow) = 5.92 + 0.595 × N intake (g/day per cow), R 2 = 0.69) is the estimate of NH3–N emission at any N intake. As the slope of these two lines differ, NH3–N emission increased with an increase in N intake.
Manure pH and temperature. Manure pH and temperature are two important factors affecting urease activity and volatilization of NH3–N (Muck, Reference Muck1982), however under the conditions of this study, we did not find any relationship between NH3–N emission and manure pH (R 2 = 0.01) or manure temperature (R 2 = 0.1). Interestingly, the large amount of manure and the lower manure pH observed when alfalfa silage replaced corn silage in the diet, may have contributed to slowing down the rate of NH3–N loss in spite of the higher temperatures observed in August and September (Table 3). This observation was supported by the modeling effort of Rotz and Oenema (Reference Rotz and Oenema2006) showing that relatively small pH reduction can have a substantial effect on NH3–N emission, especially when temperatures are high. Wind velocity and concentration of urea N in urine were not measured in this study, but have been reported as the other two important factors influencing the rate of NH3–N emission (Monteny et al., Reference Monteny, Schulte, Elzing and Lamaker1998).
MUN correlations
Regardless of the analytical method, and in agreement with Broderick and Clayton (Reference Broderick and Clayton1997) and Wattiaux and Karg (Reference Wattiaux and Karg2004a), MUN was linearly associated with dietary CP (% of DM) in this study. In addition, we found a strong linear association between MUN and manure N. This relationship may reflect the strong association between MUN and urinary N reported in the literature (Kohn et al., Reference Kohn, Kalscheur and Russek-Cohen2002). The weak relationship between MUNE and NH3–N emission found here agreed with results of Powell et al. (Reference Powell, Broderick and Misselbrook2008), but contrasted with those of van Duinkerken et al. (Reference Van Duinkerken, Andre, Smits, Monteny and Sebek2005). The latter study however, included dietary treatments with large excesses in dietary CP in the form of RDP primarily, resulting in wide ranges of MUN and NH3–N emission. In short, our results suggest that under farm-like conditions MUN captures only a fraction of the important factors determining NH3–N emission.
Conclusion
Results highlighted that ammonia emission per cow in a free-stall barn is not a constant, but may vary by a factor of two or greater throughout the months of the year under practical management conditions. In this study, NH3–N emission depended upon complex interactions between seasonal temperatures and manure composition – namely N content and pH, which was influenced by changes in diet composition (dietary CP and diet ingredients) throughout the months of the year. Nevertheless, our data suggested that reducing dietary CP from 18% to 16.5% (DM basis) did not penalize milk production and milk protein production of the cows in the herd, but reduced NH3–N emission from the floor of the free-stall barn by 27%. Although MUN was not a reliable predictor of ammonia emission, further research should focus on the use of MUN as a dependable predictor of both dietary CP and manure excretion under farm-like conditions.
Acknowledgements
The authors would like to thank Randy Mertz and the employees of the Pioneer system-research farm, University of Wisconsin-Platteville staff and employees for feed preparation and animal care, Celina Checura and other UW-Madison students for helping during sample collection and processing, and laboratory manager Sandy Bertics for technical support.