INTRODUCTION
Haemosporidian (malaria) parasites infect virtually all terrestrial vertebrate families examined to date (Perkins and Schall, Reference Perkins and Schall2002; Martinsen et al. Reference Martinsen, Perkins and Schall2008; Outlaw and Ricklefs, Reference Outlaw and Ricklefs2011). Haemosporidian parasites are obligate, intracellular parasites in the Phylum Apicomplexa that alternate between dipteran hosts (i.e. flies) and terrestrial vertebrate hosts (Garnham, Reference Garnham1966; Valkiunas, Reference Valkiunas2005; Telford, Reference Telford2009) during their life cycle. Haemosporidian parasites are well known from mammals (Escalante et al. Reference Escalante, Freeland, Collins and Lal1998; Witsenburg et al. Reference Witsenburg, Salamin and Christe2012), lizards (Schall, Reference Schall1996; Telford, Reference Telford2009) and birds (Valkiunas, Reference Valkiunas2005; Ricklefs et al.). Different groups of malaria parasites rely on different dipteran groups, but all haemosporidian parasite genera and species undergo sexual reproduction in the midgut of the insect; ‘spores’ (sporozoites) migrate to the salivary glands from which they are injected into a vertebrate host when the insect takes a blood meal (Garnham, Reference Garnham1966; Valkiunas, Reference Valkiunas2005). The parasites develop in various vertebrate tissues, again depending on the parasite genus and species, but all haemosporidian parasites eventually produce gametocytes in blood cells. As the gametocytes erupt from blood cells, they can then be taken up by the insect host.
The effects of malaria parasite infection are dependent on a number of factors, including the ‘species’ of malaria parasite (e.g. van Riper, Reference vanRiper1991; Knowles et al. Reference Knowles, Wood, Alves, Wilkin, Bensch and Sheldon2011), the immune system of the vertebrate host and the length of coevolutionary history between host and parasite (i.e. evolved immune defences and other mechanisms such as sickle-cell; see also Kwiatkowski, Reference Kwiatkowski2005; Perkins et al. Reference Perkins, Martinsen and Falk2011). In general, infection causes anaemia associated with loss of blood cells (red blood cells mostly although some parasites infect white blood cells), and can reduce overall health and reproductive success (for birds, seeAtkinson, Reference Atkinson, Atkinson, Thomas and Hunter2008a , Reference Atkinson, Atkinson, Thomas and Hunter b ; Forrester and Greiner, Reference Forrester, Greiner, Atkinson, Thomas and Hunter2009; for lizards, see Schall, Reference Schall1990). In many instances, acute and chronic infections of Haemoproteus and Parahaemoproteus seem to have lower fitness consequences than Plasmodium and Leucocytozoon, and certainly less so than in human Plasmodium falciparum parasites, but in some cases, entire species, such as many Hawaiian Honeycreepers (Aves), have been driven to extinction (Atkinson and van Riper, Reference Atkinson, van Riper, Loye and Zuk1991).
As a group, it has been suggested that extant malaria parasite lineages are less than 20 million years old (Ricklefs and Outlaw, Reference Outlaw and Ricklefs2010; Bensch et al. Reference Bensch, Hellgren, Križanauskienė, Palinauskas, Valkiūnas, Outlaw and Ricklefs2013), much younger than their insect and vertebrate hosts. This would likely preclude large-scale effects of host divergence as a factor in parasite divergence. It appears that host switches between bird and lizard hosts are quite common (evolutionarily), but that switches between bird/lizard and mammal hosts are very rare. Indeed, only recently was the first example of a switch from bird to mammal hosts demonstrated in bats (Outlaw and Ricklefs, Reference Outlaw and Ricklefs2010; Witsenburg et al. Reference Witsenburg, Salamin and Christe2012), which are ecologically similar to birds (Schaer et al. Reference Schaer, Perkins, Decher, Leendertz, Fahr, Weber and Matuschewski2013).
Given the large genetic diversity in haemosporidians, assessing the evolutionary relationships of genetic lineages has become an active area of study. Recent molecular phylogenies suggest that avian malaria parasites constitute five genera, Haemoproteus, Parahaemoproteus, Leucocytozoon, bird+lizard Plasmodium and bat Polychromophilus, each of which is vectored by a different dipteran group (Outlaw and Ricklefs, Reference Outlaw and Ricklefs2011; see also Perkins, Reference Perkins2014). These five genera (hereafter ‘avian’) have been proposed to be sister to mammalian Plasmodium and Hepatocystis (and others) parasites, excluding the embedded bat parasites, Polychromophilus. While the breadth of genera included in this study do not represent the entire diversity of malaria parasites, these were the lineages from which there was enough existing genetic data to carry out these analyses; the largest number of markers from across the three parasite genomes. The mitochondrial cytochrome b (cyt b) gene is the genetic marker that has primarily been used to reconstruct hypotheses of relatedness of haemosporidians (Perkins and Schall, Reference Perkins and Schall2002; Martinsen et al. Reference Martinsen, Perkins and Schall2008). In phylogenetic analyses of higher eukaryotes, cyt b has been largely assumed to evolve neutrally, despite evidence to the contrary (Ballard and Kreitman, Reference Ballard and Kreitman1995; Nunn and Stanley, Reference Nunn and Stanley1998; Nabholz et al. Reference Nabholz, Glémin and Galtier2007). However, extensive genome re-organization and host diversification in apicomplexans suggest that this also may not be the case for malaria parasites (Mather and Vaidya, Reference Mather and Vaidya2008).
Apicomplexans have an unusual mitochondrion and mitochondrial genome. Their mitochondrial genome has been reduced to 3 genes, as opposed to 13 in vertebrates; cyt b, and cytochrome oxidases 1 (COI) and 3 (COIII) plus ribosomal RNAs, the entirety of which is repeated many times (Suplick et al. Reference Suplick, Akella, Weidanz, Long and Vaidya1987; Hikosaka et al. Reference Hikosaka, Kita and Tanabe2013). The electron transport chain (ETC) of these parasites is therefore highly reduced, and complexes III and IV are the only functional units that persist (van Dooren et al. Reference Van Dooren, Stimmler and McFadden2006). These reductions in the apicomplexan mitochondrial genome are a direct reflection of the reduced functionality of the organelle (Slamovits et al. Reference Slamovits, Saldarriaga, Larocque and Keeling2007; Mather and Vaidya, Reference Mather and Vaidya2008). Only one of these mitochondrial genes appears to be absolutely necessary for metabolism and survival, cytochrome b (van Dooren et al. Reference Van Dooren, Stimmler and McFadden2006).
A recent study compared the relative branch lengths of two mitochondrial (cyt b, COI) and one apicoplast (ClpC) gene within the haemosporidian phylogeny (Outlaw and Ricklefs, Reference Outlaw and Ricklefs2010). They found evidence of adaptive molecular evolution, via elevated dN/dS (ω) ratios, in cyt b in the branch connecting bird and mammal parasites, which the authors suggest is caused by differences in host (bird vs mammal) tissues in which the parasites reproduce. The authors postulated that the physical and physiological environment of the vertebrate host blood cells creates a selective pressure that drives host specificity within lineages and divergence between lineages. Mammal erythrocytes (red blood cells) have no nucleus at maturity but both bird and lizard erythrocytes do, and it has been suggested that the presence of the nucleus alters the parasite's environment and therefore its metabolism within that environment (see Hagner et al. Reference Hagner, Misof, Maier and Kampen2007, discussed in Chitnis and Staines, Reference Chitnis and Staines2013). Although this study did not uncover evidence of selection on genes within bird or mammal parasite groups, the power to detect the molecular signature of selection may have been limited by a lack of taxonomic sampling and assumptions of appropriate outgroups. A subsequent study suggested that Leucocytozoon may not be an outgroup taxon to avian and mammal parasites, but rather nested within avian haemosporidians (Outlaw and Ricklefs, Reference Outlaw and Ricklefs2011). This result was due to the alternative phylogenetic methodologies employed on existing genetic data, namely a molecular clock rooting method that does not require a priori assignment of outgroup taxa (Outlaw and Ricklefs, Reference Outlaw and Ricklefs2011).
Although the haemosporidian phylogeny remains unresolved, the methods used in this study to estimate rates of gene evolution of individual lineages and their ancestral branches should be robust to phylogenetic topology. If the hypothesis of relationships of Outlaw and Ricklefs (Reference Outlaw and Ricklefs2011) holds, with increased sampling, the potential novel position of Leucocytozoon embedded within avian malaria parasites would suggest that there may be marked rate heterogeneity in avian haemosporidians via elevated rates of evolution in cyt b (see Fig. 3, Outlaw and Ricklefs, Reference Outlaw and Ricklefs2011). Rate heterogeneity in cyt b and a new hypothesis of relatedness of avian haemosporidians, combined with elevated ω ratios in the branch separating bird and mammal parasites, raises questions in regard to the role of cyt b in malaria parasite diversification.
Evidence of host-switches is apparent throughout the evolutionary history of haemosporidian parasites (reviewed in Perkins, Reference Perkins2014; see also Ricklefs et al. Reference Ricklefs, Outlaw, Svensson-Coelho, Medeiros, Ellis and Latta2014). In fact, it has been posited that given the diversity of malaria parasites and their relatively young age, host shifts are likely the primary driver of diversification; they are absolutely required to explain the current diversity of avian malaria parasites (Ricklefs et al. Reference Ricklefs, Outlaw, Svensson-Coelho, Medeiros, Ellis and Latta2014). There have been multiple switches from bird to lizard hosts and a recent switch from bird to bat hosts (Witsenburg et al. Reference Witsenburg, Salamin and Christe2012). As mammals have non-nucleated erythrocytes, compared with the nucleated erythrocytes of birds and lizards, this shift from birds to bats represents not only a shift in the host and vector, but also in the physiological environment in which the parasites find themselves. A detailed understanding of how these different groups of haemosporidian parasites have diversified with regard to metabolic pathway genes can provide significant insight into how these host shifts occur among hosts and host cells with very different physiologies.
MATERIALS AND METHODS
Data acquisition and alignment
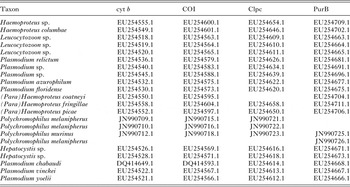
The DNA sequences used in this study were acquired from the nucleotide database of the National Center for Biotechnology Information (NCBI; GenBank), and include representatives from each genetic lineage of haemosporidian ‘malaria’ parasite for which there were data from all three genomes: Haemoproteus (avian, 2), Leucocytozoon (avian, 3), Parahaemoproteus (avian, 3), Plasmodium (avian, 3+squamate, 2), Polychromophilus (chiropteran, 3), Hepatocystis (chiropteran, 2) and Plasmodium (mammal, 3). A total of 83 sequences were included encompassing two mitochondrial genes (cyt b, COI) for each of 21 lineages, one apicoplast gene (caseinolytic protease C [Clpc]), and one nuclear gene (adenylosuccinate lyase [PurB]) for each of 20 lineages (Table 1). Sequences were aligned using BioEdit (v. 7.1.11; available at http://www.mbio.ncsu.edu/bioedit/bioedit.html) sequence alignment software. All sequences possessed no gaps and were verified to be in the appropriate reading frame via observation of the protein sequence. Each gene-specific taxon set was then exported in phylip format for use in analyses of adaptive evolution.
Taxa and gene sequences used in this study with associated GenBank accession numbers

Tree reconstruction
To reconstruct the phylogeny, we used a Bayesian framework with an uncorrelated lognormal relaxed molecular clock rooting method and the General Time Reversible (GTR) model of nucleotide substitution with proportion of invariable sites (I) and gamma distribution (Γ) to account for variation in transition/transversion rates, proportion of invariable sites and rate heterogeneity in the dataset (BEAST v.1.7.5; Rambaut and Drummond, Reference Rambaut and Drummond2007). We used a random starting tree with the Yule speciation birth rate prior, and ran the analysis for 10 000 000 generations, sampling every 1000th generation. The resulting set of trees was trimmed using a 10% (1000 trees) burn-in as determined using the trace of tree likelihoods in Tracer (v1.5.0.; Rambaut and Drummond, Reference Rambaut and Drummond2007) A consensus tree (not shown) was then reconstructed from the resulting 9000 trees and exported for use in the PAML analyses.
Data analysis
For each gene sequence data set, we estimated dN (rate of nonsynonymous substitutions per nonsynonymous site), dS (rate of synonymous substitutions per synonymous site) and the ratio of the two, dN/dS (ω), a measure of selection, in a phylogenetic context. Using the computer program Phylogenetic Analysis by Maximum Likelihood (PAML v.4.0; Yang, Reference Yang2007), we estimated ω among lineages, along individual branches, and on individual amino acids within a fixed haemosporidian phylogeny (as above). As an alternative to these extremely conservative methods (Kosakovsky Pond and Frost, Reference Kosakovsky Pond and Frost2005), we used HyPhy to measure selection via the Single Likelihood Ancestor Counting (SLAC), Fixed Effect Likelihood (FEL) and Branch-Site Random Effects Likelihood (BSR; Kosakovsky Pond and Frost, Reference Kosakovsky Pond and Frost2005; Delport et al. Reference Delport, Poon, Frost and Kosakovsky Pond2010) analyses using individual gene trees reconstructed using a distance algorithm (i.e. the tree topology was not defined a priori). Combined, these analyses allowed us to evaluate how non-synonymous and synonymous substitutions are partitioned and distributed across the parasite phylogeny to determine which genes/amino acid residues are under selection and where in the phylogeny selection is stronger or weaker.
Branch model analysis
Using PAML (Yang, Reference Yang2007), we estimated ω on branches within the phylogeny with branch models M0, M1, and M2, and also used the SLAC and FEL methods (Kosakovsky Pond and Frost, Reference Kosakovsky Pond and Frost2005) to determine a global ω. Branch model analysis allows us to detect potential selection acting on lineages in a phylogeny (Yang, Reference Yang2007). Branch model M0 estimates a single ω ratio on all sites, assuming that no sites are being selected (neutral evolution). Branch model M1 is a ‘free-ratios’ model (Yang, Reference Yang2007), which estimates independent ω rates on all branches of the phylogeny. Phylogenies were generated for each gene with branch lengths proportional to substitutions per codon from the results of the M1 analysis. Branch model M2 allowed for multiple ω values to be estimated on groups of branches (clades), i.e. a foreground ω value for the clade of interest, and a background ω for the remaining taxa, to determine where potential adaptive evolution may be occurring in the phylogeny. Branch model M2 analyses were conducted for each of the six parasite lineages (mammal Plasmodium and Hepatocystis were analysed as a single lineage) and on ancestral branches alone. Branch model analyses were conducted on each of the four datasets (cyt b, COI, Clpc and PurB) for the lineage as a whole and on the individual ancestral branch leading to each lineage.
Site model analysis
We estimated ω on individual amino acid residues within each gene with site model analysis (Nsites) using models M0, M1a, M2a, M7 and M8 as implemented in PAML (Yang, Reference Yang2007). Site model M0, similar to branch model M0, estimates a single ω value for all sites, again, assuming that no sites are being selected. Site model M1a (nearly neutral) estimates the proportion of sites, and their ω, for sites under purifying selection (0<ω<1) assuming a background of neutral evolution (ω = 1). Site model 2a (positive selection) estimates the proportion of sites, and their ω, for sites under purifying selection (0<ω<1) and directional selection (ω>1) assuming a background of neutral evolution (ω = 1). Site model M7 assesses variation in ω at sites using a beta distribution but does not estimate the proportion of sites, or their ω, for sites under directional selection, while site model M8 does both. All five site model analyses were performed for each dataset (cyt b, COI, Clpc and PurB). To estimate episodic selection events (negative or positive) on each gene within the phylogeny, we used the BSR method in HyPhy (Kosakovsky Pond et al. 2011), which determines the type and strength of selection on all branches within a phylogeny.
Likelihood ratio tests
For each of the aforementioned analyses, we quantified which models were significantly better estimates of the data by conducting pairwise likelihood ratio tests (LRT). The test statistic for the LRT is calculated with the equation [LR = −2×(lnL1−lnL2)], where lnL1 and lnL2 represent the log likelihood value of the models being compared. Given that these models are hierarchically nested and each model was conducted on the same data set using the same tree topology, these likelihood values are directly comparable. The LRT statistic approximately follows a Chi-squared distribution (Hillis et al. Reference Hillis, Moritz and Mable1996) and was compared to a Chi-squared distribution for branch models and site models with 1 and 2 degrees of freedom, respectively (Yang, Reference Yang2007). The critical values of the Chi-squared distribution for d.f. = 1 were 3·842 and 6·635 (for alpha levels 0·05 and 0·01), and for d.f. = 2 were 5·992 and 9·210 (for alpha levels 0·05 and 0·01).
RESULTS
dN/dS Analysis and LRTs
Branch model analysis
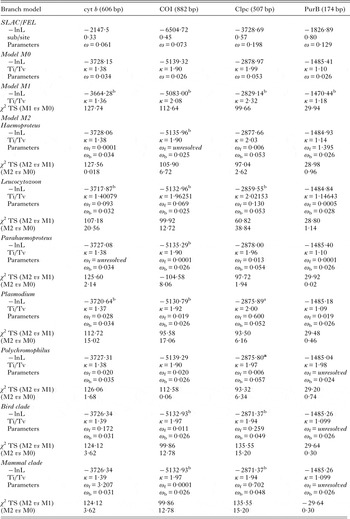
Results of branch model M0 suggest an overall ω rate of 0·034 for cyt b, 0·026 for COI, 0·053 for Clpc and 0·026 for PurB (Table 2). Model M1 returned unique ω rates for all branches in the phylogeny. For all genes examined, LRTs show that model M1 is a significantly better estimate of the data than M0, suggesting heterogeneity in the rates of ω among these genes and gene trees (Table 2). The results from branch model analyses using HyPhy similarly show constraint across the data sets: ω of cyt b = 0·061; ω for COI = 0·073; ω for Clpc = 0·198; and ω for PurB = 0·129 (Table 2).
Branch specific results of HyPhy (Kosakovsky Pond and Frost, Reference Kosakovsky Pond and Frost2005) and branch model analyses M0, M1 and M2 as implemented in PAML (Yang, Reference Yang2007) on lineage groups

Parameters: –lnL = likelihood score of the tree recovered from the model analysis; ω = estimated rate of ω for the model/lineage; ω f and ω b = foreground and background rates of ω as implemented in model M2, respectively.
a LRT shows significantly better model than M0.
b LRT shows significantly better model than M1. d.f. = 1; critical χ 2 = 3·8415 and 6·6349 (for alpha levels 0·05a/b and 0·01a/b).
χ 2 TS = calculated Chi-squared statistic.
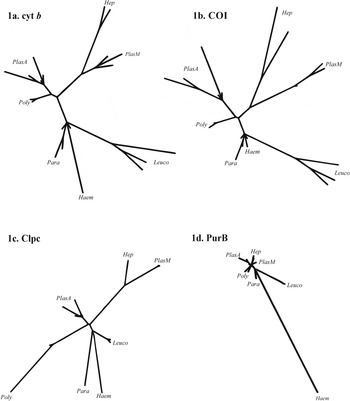
Figure 1 shows representative phylogenies from the M1 analysis. The branch lengths in these trees are proportional to substitutions per codon and are a proxy for where in the phylogeny nonsynonymous substitutions are concentrated. For the cyt b tree, substitutions per codon are primarily distributed on internal and terminal Leucocytozoon branches, the branch leading to Hepatocystis and terminal Haemoproteus and avian Plasmodium branches (Fig. 1a). In the COI tree, they occur in the branch leading to Leucocytozoon as well as Leucocytozoon and Plasmodium terminal branches in the avian side of the tree, and in mammal Plasmodium and Hepatocystis (Fig. 1b). In the Clpc data set, substitutions per codon are concentrated on the branches leading to Polychromophilus and mammal parasites as well as terminal Polychromophilus and Parahaemoproteus lineages (Fig. 1c). In the PurB dataset, the majority of nonsynonymous substitutions appear to be concentrated in single Haemoproteus and Leucocytozoon lineages (Fig. 1d). With respect to ancestral lineages of each clade, in the cyt b tree, the branch leading to the genus Leucocytozoon is longer than those leading to other genera, with the exception of Hepatocystis, indicative of elevated rates of ω (Fig. 1a and b) on the branches leading to Leucocytozoon and Hepatocystis. This relationship was not recovered for Clpc or the PurB gene however (Fig. 1c and d). In the COI tree, there appear to be higher rates of ω leading to Leucocytozoon and the two mammal parasite lineages. In Clpc (Fig. 1c), elevated rates of ω appear on the ancestral branch leading to the chiropteran Polychromophilus and the mammal parasite lineages. For the genus-specific branch model analysis (M2), LRTs show that M2 is not a better model of the data than M1 (Table 2) suggesting that a free ratios rate that allows branch specific ω may be more informative than either a single or clade specific ratio. Results of all pairwise LRTs can be found in Table 2.
Single gene topologies of the four genes under study (a: cyt b, b: COI, c: Clpc, d: PurB) as recovered from PAML branch model M1. Branch lengths in figures are proportional to nonsynonymous substitutions per codon. These trees illustrate differences in rates of nonsynonymous to synonymous substitutions throughout trees and among genes. Key: PlasM = Plasmodium, mammal; Hep = Hepatocystis; Poly = Polychromophilus (chiropteran); Haem = Haemoproteus; Leuco = Leucocytozoon; Para = Parahaemoproteus; PlasA = Plasmodium (avian/squamate).

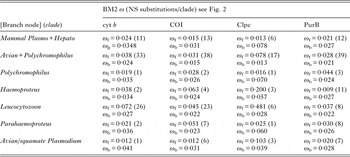
Branch model M2 was utilized in 2 different analyses; estimating ω on the clade+ancestral branch as the foreground rate and all other branches in the phylogeny as the background rate, and estimating ω on the ancestral branch alone as a foreground rate with all remaining branches as the background rate. Results of the clade-based analysis suggest heterogeneity with regard to which lineages display increased ω for different genes. cyt b, for example, shows about a 3-fold elevation of ω in Leucocytozoon only (ω f = 0·072; ω b = 0·027; Table 3). COI shows minor elevations (2- to 3-fold) in ω for three lineages; Haemoproteus, Leucocytozoon and Parahaemoproteus (Table 3). Interestingly, the gene Clpc shows much more variation in rates of ω among lineages, from 3- to 17-fold increases in ω in all bird+Polychromophilus parasites, Haemoproteus, Leucocytozoon and avian Plasmodium (Table 3). PurB shows no elevated values of ω for any lineage as expected (Table 3).
Clade specific foreground and background ω values from branch model M2 and number of amino acid residues that show significant evidence of selection from Nsites analysis in PAML

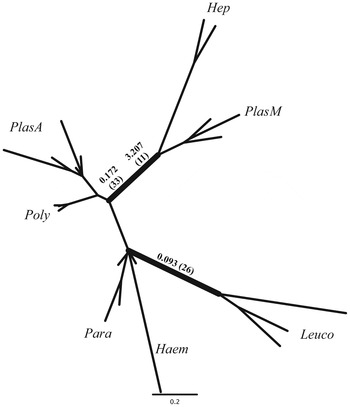
However, when branch model M2 analyses were run on the ancestral branches within the cyt b phylogeny, the result was quite different (Table 2). On the branch leading to mammal parasites, model M2 recovered a nearly 100-fold increase in ω (ω f = 3·207; ω b = 0·031). The branch leading to bird parasites shows a nearly 6-fold increase in ω (ω f = 0·172; ω b = 0·031; Table 2; Fig. 2). Within the bird parasite clade, the branch leading to the genus Leucocytozoon shows a 3-fold increase in ω (ω f = 0·093; ω b = 0·032). Ancestral branches leading to Haemoproteus, Parahaemoproteus, bird/lizard Plasmodium and Polychromophilus were similar to reconstructed background ω or highly conserved. These analyses were also run on the COI, Clpc and PurB genes (see Online Supplemental figures S1–S3). COI shows a 2·5-fold increase in ω on the branch leading to the genus Leucocytozoon (ω f = 0·069; ω b = 0·025; Table 2; Online Figure S1). In the Clpc phylogeny (Table 2; Online Figure S2), there is a 14-fold increase in ω on the branch leading to mammal parasites (ω f = 0·702; ω b = 0·048), a 2·5-fold increase on the branch leading to Leucocytozoon (ω f = 0·130; ω b = 0·053), a 5-fold increase in ω on the branch leading to all bird parasites (ω f = 0·259; ω b = 0·049) and a 11·5-fold increase in ω on the branch leading to avian Plasmodium (ω f = 0·600; ω b = 0·052). Only one branch in the PurB phylogeny shows any elevated rate of ω, the branch leading to the genus Haemoproteus, a 54-fold increase (ω f = 1·395; ω b = 0·026; Table 2; Online Figure S2).
Cytochrome b phylogenetic reconstruction from PAML branch model M1. Branch length in this tree is proportional to nonsynonymous substitutions per codon and illustrates where in the phylogeny nonsynonymous substitutions are concentrated. Values on internal branches represent ω values as recovered in branch specific model M2 analysis in PAML for nodes in which the foreground ω>background ω. Numbers in parentheses represent the total number of nonsynonymous substitutions on that branch and all branches within that clade. Thickened branches represent those with ω values >5 as recovered in HyPhy. Values for cyt b and all other genes are found in Table 3 (trees for the other three genes can be seen in Online Supplemental Information). Key: PlasM = Plasmodium, mammal; Hep = Hepatocystis; Poly = Polychromophilus (chiropteran); Haem = Haemoproteus; Leuco = Leucocytozoon; Para = Parahaemoproteus; PlasA = Plasmodium (avian/squamate).

Site model analysis
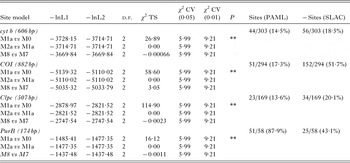
Site model analyses M0, M1a, M2a, M7 and M8 were conducted on each gene data set. The appropriate comparisons for these models include M2a vs M1a and M8 vs M7 with 2 degrees of freedom (Yang, Reference Yang2007). Results of LRTs suggest that for the four genes, Nsites model M1a is a significantly better estimate of the data than model M0 (Table 4). Nsites model M2a was not a significantly better estimate of the data than M1a, and models M7 and M8 were equivalent suggesting an absence of positive selection. Given this, we investigated the results of site model M1a (nearly neutral) as this is the most conservative analysis and does not a priori assume directional selection is taking place in the data. Results of Nsites model M1a analysis on each of the parasite genera/lineages show a disproportionate number (minimum 2-fold) of amino acid residues significant for adaptive evolution in three of the four genes (cyt b: 26, COI: 23, Clpc: 6) in the genus Leucocytozoon (Table 3). Site-model analyses using HyPhy suggest negative or purifying selection across each data set, with for example, 18% in cyt b: 56/303 residues to 51% in COI: 152/294 residues (Table 4). Overall there were several branches in each dataset for which ω>5 (Fig. 2 and Online S1–S3). At each gene, these branches with large ω reflect different rates of evolution in different malaria lineages; in cyt b leading to mammal parasites, bird parasites and the genus Leucocytozoon, in Clpc leading to mammalian Plasmodium and Hepatocystis and Leucocytozoon, and in PurB leading to Haemoproteus.
LRT results of site model M1a ‘Nearly Neutral’ analysis as implemented in PAML (Yang, Reference Yang2007) and LRTs

Obs and Exp = −lnL of two models being compared; d.f. = degrees of freedom; χ 2 TS = calculated Chi-squared statistic; χ 2 CV (0·05) = Chi-squared critical value at alpha = 0·05; χ 2 CV (0·01) = Chi-squared critical value at alpha = 0·01; P = statistical P value; –sites = number of sites under negative selection from SLAC analysis in HyPhy (Kosakovsky Pond and Frost, Reference Kosakovsky Pond and Frost2005). **: P = 0·01.
DISCUSSION
Despite the different genome origins and functional roles of the genes under study among the malaria parasite groups, there is a high degree of evolutionary constraint. This is not altogether surprising given that the proteins derived from each of these genes are integral to pathway function; cyt b and COI as part of the ETC of cellular respiration, Clpc in protein degradation and PurB in purine biosynthesis. There are varying degrees of constraint, however. While it has been suggested that cyt b is critical to the survival of these organisms (Painter et al. Reference Painter, Morrisey, Mather and Vaidya2007), surprisingly, this gene showed the lowest number of negatively selected sites among the four genes examined (Table 4), equivalent to Clpc. In cyt b, the majority of nonsynonymous amino acid substitutions occur in the Leucocytozoon clade (26 of 33 in the avian clade), while only 11 are found in the mammal clade (Table 3). The elevated variability of cyt b in Leucocytozoon may be the result of adaptation to a very different environment (leucocytes vs erythrocytes) and may have allowed this lineage to be successful in colonizing these cells (Valkiunas, Reference Valkiunas2005). COI possesses the greatest number of nonsynonymous amino acid substitutions, and may be the result of this gene potentially undergoing a loss of function (S. Perkins, personal communication). Similar to cyt b, the majority of these nonsynonymous amino acid substitutions are found in the Leucocytozoon clade (23 of 38 in the avian clade vs 13 in the mammal clade; Table 3), again perhaps the result of adaptation to a different environment (see Forrester and Greiner, Reference Forrester, Greiner, Atkinson, Thomas and Hunter2009). While we possess less than half of the gene sequence for PurB, we still find a high degree of nonsynonymous amino acid substitution (39 in the avian clade vs 12 in the mammal clade), but these substitutions are relatively evenly distributed among the seven lineages. The above variation provides indirect evidence for potential adaptability of the constituents within these pathways and/or processes in these organisms (see also Mogi and Kita, Reference Mogi and Kita2010; Salcedo-Sora and Ward, Reference Salcedo-Sora and Ward2013).
The evolutionary tree of malaria parasites has been extensively revised since the first study of patterns of evolution in the genes under study (reviewed in Perkins, Reference Perkins2014). This makes the finding here, that differential patterns of molecular evolution between major groups remains, all the more remarkable, and suggests that different hosts (vertebrate or dipteran) may be a strong selective force on these parasites. Prior to this study, Outlaw and Ricklefs (Reference Outlaw and Ricklefs2010) found putative selection acting on haemosporidian cyt b between bird and mammal parasites. In this study with increased sampling, we find a similar pattern in cyt b, but also in Clpc and PurB in select lineages. In contrast to clade-based analysis of ω (Table 3), when we consider ancestral branches within the phylogeny, we see elevated ω on branches leading to extant clades (Fig. 2). For example, the clade including bird/lizard parasites (all extant+putative ancestor) shows a 1·6-fold increase from background rate ω for the dataset as a whole for cyt b (Table 2). When we isolate the ancestral branch leading to bird/lizard parasites and perform the same analysis, we see a 7·7-fold increase over background ω. Similarly, for the mammal parasite clade as a whole, there is an overall reduction in ω; however, when we analyse the branch leading to mammal parasites, there is a 100-fold increase in ω. For the genus Leucocytozoon, clade-based analysis suggests an ω 2·7-fold larger than background, while the ancestral branch leading to Leucocytozoon returned an ω 3-fold larger. While not as extreme as the two previous examples, there is still a noticeable difference among results depending on how the analysis is structured. This suggests adaptive evolution in the ancestors, which we would have missed had we considered clades alone.
This fine-scale partitioning of rates of evolution across the phylogeny suggests that selection has played an important role in switches between hosts and/or tissues across haemosporidians. Overall analysis of the phylogenies suggests constraint on all four genes, but clade and branch specific analyses of ω suggest a high degree of variation in adaptive evolution in lineages throughout the evolutionary history of these organisms. Hence, it is important that we consider not just the lineages as a whole, but also putative ancestral branches, else we may miss important phylogenetic signals. It is only when we consider the ancestral lineage that we can piece together the evolution of the gene throughout the history of the lineage. Perhaps the most important take-home message from this corroboration is that the patterns of differential evolution evident in prior studies are not an artefact of tree topology, but rather evidence of selection.
Given the variation in life history seen across malaria parasite groups, not to mention the variation in insect vectors, the high degree of heterogeneity in molecular evolution should not be surprising. However, what is surprising is that the greatest amount of putative adaptive molecular evolution appears within parasite groups that do not infect different hosts but rather utilize different tissues, e.g. Leucocytozoon and Hepatocystis. All malaria parasites produce gametocytes in the blood, therefore the differences among blood cell types (e.g. leucocytes vs erythrocytes) may represent distinct ‘ecological’ pressures to which these parasites must adapt. Despite this, we did not observe expected elevated rates of ω with the recent host-shift from birds to mammals (Outlaw and Ricklefs, Reference Outlaw and Ricklefs2011) in the genus Polychromophilus, which involved a switch from nucleated to non-nucleated erythrocytes. Given that this is a relatively recent host-shift, it is possible that there has not been enough time to accumulate sufficient mutations. In all analyses, Polychromophilus parasites exhibit no evidence of elevated ω anywhere in their phylogeny, and in fact suggest further constraint showing lower clade- and branch-specific ω than the remainder of the phylogeny. Perhaps this is due to non-nucleated erythrocytes being unable to mount a viable defence, and therefore there is no selective pressure acting on these parasites in this new environment. On the other hand, Hepatocytis parasites, which have characteristic infection pathologies (see Garnham, Reference Garnham1966) do show evidence of selection, albeit in an unlikely gene, Clpc, whose adaptive function in these malaria parasites remains unknown. Collectively, these findings suggest the importance of the parasites’ adaptation at very fine physiological scales.
Concluding remarks
Overall branch and site specific analyses of molecular evolution show consistency in evolutionary constraint across the genes as a whole. However, when we look at individual branches within the phylogeny, we see evidence of adaptive evolution. Given the marked differences in the environments in which these parasites reproduce, nucleated vs non-nucleated erythrocytes and erythrocytes vs leucocytes, as well as sexual reproduction and development in different groups of insect vectors, it is likely that adaptive evolution is rampant among genes in the metabolic pathways of these organisms. Any attempt to elucidate the extent to which these organisms are undergoing adaptive evolution among metabolic pathway genes will require detailed genomic analysis of all genes, nuclear, mitochondrial and apicoplast, in these pathways (e.g. Salcedo-Sora and Ward, Reference Salcedo-Sora and Ward2013). With the advent of next generation and targeted sequencing methodologies, we should soon be able to determine specific levels of variation among and within genera of malaria parasites to uncover how it is that these parasites have been so successful at switching hosts and achieving a cosmopolitan distribution.
SUPPLEMENTARY MATERIAL
To view supplementary material for this article, please visit http://dx.doi.org/S0031182014001668.
ACKNOWLEDGEMENTS
The authors wish to thank Dr Ronn Altig and two anonymous reviewers for their insight, all of which greatly improved this manuscript.
FINANCIAL SUPPORT
This study was conducted as partial fulfilment for a biology doctoral dissertation at Mississippi State University. Funding for this project provided by an American Ornithologist's Union – Werner and Hildegard Hesse Research Award, Society of Systematic Biologists – Awards for Graduate Student Research, and a Mississippi State University – Biology Student Research Award (R.K.O) and Mississippi State University (D.C.O).