1 Introduction
Longevity risk plays an important role in the study of intertemporal choice. It affects both the level and the evolution of consumption over the life cycle, with implications for saving and the demand for pensions, annuities and insurance products. Most of the work done in this area builds in some way or another on the seminal paper of Yaari (Reference Yaari1965) which assumes that individual preferences take an expected utility form and that lifetime utility is additively separable over time. Economists working on longevity issues, in general, do not realize that such assumptions have important consequences for individual preferences when longevity risk is present. Additivity across time periods leads to an implicit assumption of individual risk neutrality towards the length of life. Risk neutrality towards the length of life implies that, in the absence of time preferences, one should be indifferent between a lottery involving a risky lifetime in which he would live either a ‘short’ life with some probability or a ‘long’ life with the complementary probability, and a lottery involving a certain ‘intermediate’ lifetime as long as the two lotteries yield the same life expectancy. In other words, a mean-preserving spread in longevity does not affect expected utility. Bommier (Reference Bommier2006) proposes a more general formulation of individual preferences (i.e., an increasing transformation of lifetime utility) which would allow to take account of individuals’ attitude towards longevity risk.Footnote 1 Risk aversion towards the length of life implies that the certainty equivalent should be preferred over the risky lottery, while under risk proneness, the first lottery should be preferred.
Choices over alternative longevity scenarios are abundant in real life and the question of whether agents exhibit risk neutrality towards the length of life is paramount to evaluating the costs related to uncertain lifespans (see, for instance, Ried, Reference Ried1998 and Bleichrodt and Quiggin, Reference Bleichrodt and Quiggin1999). It is also crucial for understanding the choices of individuals facing uncertain survival. For example, risk aversion towards the length of life can influence the optimal allocation of wealth between annuities and bonds. Bommier and Le Grand (Reference Bommier and Le Grand2012) show that, in the presence of lifetime risk aversion, agents would always be willing to annuitize less than the present value of their future consumption, even if annuity markets are perfect, and would thus rely more on private savings. This is quite different from the results of the existing literature (see, for instance, Davidoff et al., Reference Davidoff, Brown and Diamond2005), which assumes risk neutrality and obtains that future consumption should completely be financed out of annuitization; bonds, in that situation, would only serve as a way to transfer wealth to heirs. Bommier and Le Grand (Reference Bommier and Le Grand2012) also show that the demand for annuities is decreasing in the level of lifetime risk aversion. Finally, using a calibrated model, they find that the willingness to pay for annuities (i.e., the fraction of non-annuitized wealth an agent would be willing to give up to have access to the annuity market) is much lower under the assumption of risk aversion (1.22%) than under risk neutrality (6.86%) thus providing a possible explanation for the ‘annuity puzzle’.
From a welfare perspective, Bommier et al. (Reference Bommier, Leroux and Lozachmeur2011a, Reference Bommier, Leroux and Lozachmeurb) show that under both assumptions of utilitarianism and risk neutrality towards the length of life, agents with different life expectancy but equal income should retire at the same age and obtain equal consumption flows. Equivalently, their pension contributions should be equal as well as the benefits they receive once retired, implying that optimal lifetime transfers should occur from low- to high-life expectancy agents.Footnote 2 This double assumption indeed implies that one person living in two time periods is equivalent to two persons living for only one period, not taking into account the value of a ‘continuing’ life. In contrast, when risk aversion is introduced, agents with lower life expectancy should retire earlier than high-life expectancy ones, and they should also obtain higher per-period consumption. Equivalently, they should pay lower contributions over a shorter period of activity and receive higher pension benefits. For high levels of risk aversion, optimal lifetime transfers will go from high to low longevity agents.Footnote 3 This paper then clearly shows how the assumption of risk aversion towards the length of life influences policy recommendations and the design of the optimal pension system.Footnote 4 Hence, the question of longevity risk preference is paramount to our understanding of individual behaviour and social welfare.
Although appealing from a theoretical perspective, there is a little empirical evidence on the existence of risk aversion or proneness towards the length of life in the population. We can distinguish two different ways of testing for these preferences. One can use indirect evidence and revealed preferences methods as in Bommier and Villeneuve (Reference Bommier and Villeneuve2012), which show that longevity risk aversion accurately fits the age pattern of the value of a statistical life year reported in Aldy and Viscusi (Reference Aldy and Viscusi2003). Although interesting, such a method requires a complete modelling of the agent's environment over the life-cycle. An alternative method, which is the one we use in this paper, consists in relying on stated preferences.Footnote 5 It enables us to directly test for risk neutrality using choice answers to survey questions asked in the RAND American Life Panel (ALP).Footnote 6 An advantage of this method is that it permits a complete specification of the agent's choice environment and thus focuses on longevity risk.Footnote 7 The ALP is an ongoing internet panel study with broad coverage of the US population. We present respondents with lotteries over the length of life that allow them to express risk neutrality, aversion or proneness. Depending on their answers, we then follow up with ‘switch-point’ questions that allow us to compute their coefficient of risk aversion towards longevity. Following the definition of Bommier (Reference Bommier2006), we specify and estimate a measure of longevity risk attitude and study how it correlates with socio-economic characteristics of households.
Only two other studies rely on stated preferences to investigate this question. Verhoef et al. (Reference Verhoef, De Haan and Van Daal1994) ask 30 women over 40 years old about their preferences over different lotteries of life and from their answers, compute a measure of risk aversion called ‘the proportional match for certainty equivalent’. They find that agents are risk prone in the short term and risk averse in the long term, which goes against the assumption of time discounting but is consistent with prospect theory. Agents would take risks in the short term so as to achieve their aspiration level, that is, the lifespan they expect to enjoy.Footnote 8 Clearly, their objective is different from ours in that they explain variations in attitudes towards longevity risks using the aspiration level argument, while we explain variations in risk attitudes through different socio-demographic backgrounds.Footnote 9 Stiggelbout et al. (Reference Stiggelbout, Kiebert, Kievit, Leer, Stoter and De Haes1994) also study a population of 30 disease-free testicular cancer patients and find that 85% of them are risk averse towards the length of life. They also find that patients who have received chemotherapy are more likely to be risk averse; yet, they do not find any significant correlation between socio-demographic characteristics (age, education and job classification) and risk aversion.Footnote 10
Our results provide strong evidence against risk neutrality for a large fraction of the US population. About a quarter, or 26.5% of respondents, are risk-neutral with respect to the length of life. A slight majority, 38.2% of respondents, are risk averse while, perhaps more surprisingly, 35.4% are prone to risk. When we increase the variance of the risky lottery, more respondents appear to be risk averse: almost 60% prefer the certainty equivalent while only 19.1% prefer the risky lottery. Interestingly, income correlates positively with risk aversion towards the length of life. We could not detect age or education differences in risk aversion.
The paper is structured as follows. In the next section, we first define risk preference with respect to longevity and then derive a simple model so as to emphasize the importance of taking risk attitude into account, in particular for the design of pension systems. In Section 2, we present the survey design. In Section 4, we present the estimation strategy. In Section 5, we discuss the results. Finally, we conclude in section six.
2 Definitions of concepts and motivation
2.1 Longevity risk preferences
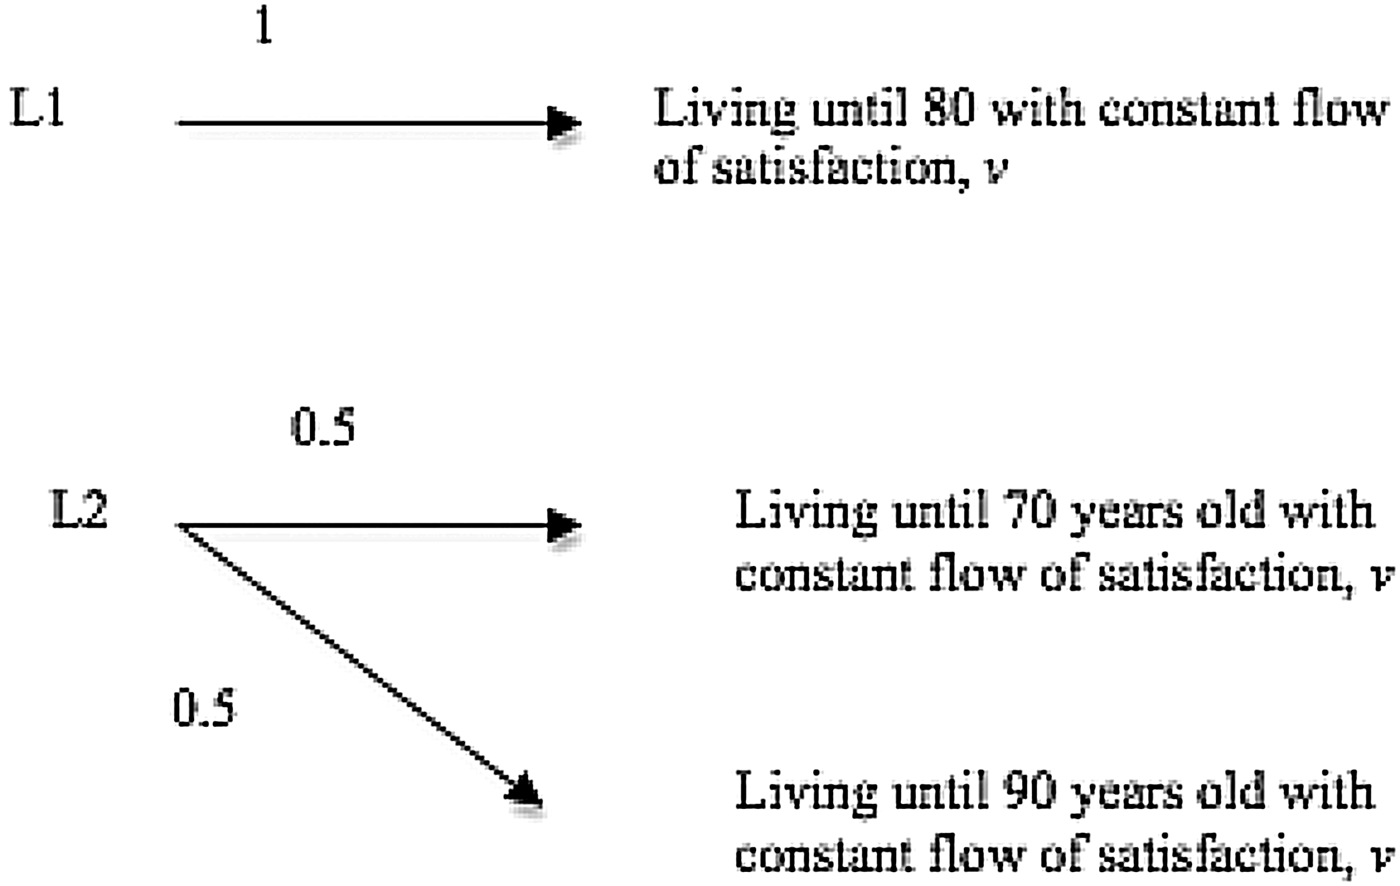
We first use a simple example to define preferences for longevity risk. For the sake of the example, suppose that, each year, an individual of age a derives a constant flow of satisfaction, v. We place no restriction on how discounted utility and consumption vary with age; the only restriction consists in assuming that discounted utility flows, v, are constant.Footnote 11 Suppose that the individual has to choose between the following two lotteries. As shown in Figure 1, with lottery L1, she lives with certainty until 80 years old, while with lottery L2, she would live until 70 years with a probability p = 0.5 and until 90 years with probability 1−p = 0.5. In the two lotteries, the life expectancy is thus the same so that under risk neutrality towards the length of life, she is indifferent between the two. If she is risk averse, she strictly prefers lottery 1, which is less risky in terms of life duration while if she is risk prone, she strictly prefers the second lottery.
Choices over lotteries of life.

Such a lottery choice bears similarities with some of the choices individuals make in real life. For example, an innovative medical treatment may, if it works, increase lifespan but reduce it if it fails. Doing nothing or taking the standard treatment may give the average lifespan. Individuals with different longevity risk preferences may then make different choices. We come back to this point in Section 3.
Let us further define a function G(.) which is an increasing transformation of state utilities. One simple way to model any attitude towards the risk of longevity of this agent then consists in making an increasing transformation of state utilities, G(.), such that the lifetime utility obtained from the lottery L1 is
 $$U({L_1}) = G((80 - a)v),$$
and the one obtained from lottery L2 is
 $$U({L_2}) = 0.5 \times G((70 - a)v) + 0.5 \times G((90 - a)v).$$
If G″(.) = 0, U(L 1)=U(L 2) and the agent is said to be risk neutral towards the length of life. If G″(.)<0, U(L 1)>U(L 2) and the agent is risk averse, whereas if G″(.)>0, U(L 2)>U(L 1) and the agent is prone to risk. In many economic problems involving risky lifetimes (see, for example, Yaari, Reference Yaari1965), G(.) is constrained to be linear. However, as we will see in the next section, there is no reason to believe that agents would be indifferent between these two lotteries of life and to assume G″(.) = 0.
Finally, we specify a measure of risk attitude towards the length of life following Bommier (Reference Bommier2006).Footnote 12 Denoting A, the life expectancy in each lottery L1 and L2 (here, A = 80), Bommier (Reference Bommier2006) defines the coefficient of risk aversion with respect to the age at death, A as:
 $${\alpha _a}(v,A) = \displaystyle{{ - ({\partial ^2}{U_a}(v,A)/\partial {A^2})} \over {(\partial {U_a}(v,A)/\partial A)}}.$$
This coefficient is positive (resp. negative) if the agent is risk averse (resp. prone) towards the length of life.
Hence, in our above example, the utility obtained from the certain lottery L 1 is more generally equal to U(L 1)=G((A−a)v), and the coefficient of risk aversion with respect to the age at death simplifies to
 $${\alpha _a}(v,A) = - \displaystyle{{vG^{\prime \prime}((A - a)v)} \over {G^{\prime}((A - a)v)}}.$$
We estimate this coefficient in Section 4.
Two remarks are in order. First, note that the concept of risk aversion towards the length of life is different from that of time impatience. In the above example and in our survey questions, we assume a constant flow of satisfaction v, which embodies time preferences. Equivalently, we could have assumed that agents have no pure time preferences and equally value present and future consumptions. Here, we consider a constant flow of satisfaction so as to isolate the role of risk aversion towards the length of life from that of pure time preferences.
Admittedly, we show in Appendix A that impatient agents who are risk neutral towards the length of life (which is the standard way of modelling agents’ preferences in intertemporal choice models) would always choose the certain lottery (L1) in the above example. Hence, agents may prefer the certain lottery either because they are impatient, because they are risk averse (the explanation we seek to test), or both. However, in our empirical sections, we will find that some agents are risk prone or neutral towards the length of life. Such behaviour can never be explained by time impatience. We come back to this point in Section 5, when we present our descriptive statistics.
Second, assuming a constant flow of satisfaction implies that, if there are no pure time preferences, per period utility is constant over the life cycle, which enables us to abstract from time-dependent utility considerations and to test directly for the agents’ risk attitude towards death. It is true, however, that if for instance health status were deteriorating over the life cycle, v would be decreasing with time and this would make the agents more eager to choose the certain lottery, independently from their attitude towards the risk of mortality. However, as for pure time preferences, assuming a decreasing quality of life or a decreasing health status would bias our results only in one direction, that is, towards choosing the certain lottery more often (see Appendix A). Again, this is not what we find in our survey as a sizeable share of respondents is found to be either risk prone or risk neutral. We come back to the possibility that health status affects our elicitation strategy in the empirical analysis.
2.2 The importance of longevity risk preferences
Longevity risk preferences may shape the conclusions we obtain from a simple model where the government would like to allocate resources between agents with different lifespans. To illustrate this, we analyse the optimal design of a pension system using a setup adapted from Bommier et al. (Reference Bommier, Leroux and Lozachmeur2011b).Footnote 13
We assume two types of agents, i={1, 2}, who differ only in terms of longevity such that T 2>T 1. Assuming no pure time preferences, the utlity of agent i is written as follows:
 $${U_i} = G({T_i}u({c_i}) - R({z_i})),$$
where c i denotes his per period consumption and z i≤T i, his retirement age. The function u(c) is the utility obtained from per period consumption and is such that u′(.)>0 and u″(.)<0, while R(z) denotes the total disutility of a working period of length z with R′(.)>0 and R″(.)>0. The function G(.) is an increasing cardinal transformation of the individual utility and we set no restriction on the sign of G″(.).
Denoting w the income received by agents for each period of work, the social planner's problem then consists in solving:
 $$\eqalign{\mathop {max}\limits_{{c_1},{c_2},{z_1},{z_2}} & G({T_1}u({c_1}) - R({z_1})) + G({T_2}u({c_2}) - R({z_2})) \cr {\rm s}.\;{\rm to}\; & {T_1}{c_1} + {T_2}{c_2} \le w({z_1} + {z_2}).} $$
First-order conditions are
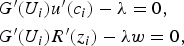 $$\eqalign{& G^{\prime}({U_i})u^{\prime}({c_i}) - {\rm \lambda}= 0, \cr & G^{\prime}({U_i})R^{\prime}({z_i}) - {\rm \lambda} w = 0,} $$
with λ, the Lagrange multiplier associated with the resource constraint. The optimal allocation crucially depends on the form of function G(.). If G ″(.) = 0, i.e., if the agent is risk neutral towards the length of life, it is optimal to set c 1=c 2 and z 1=z 2 and agents with different longevity obtain the same allocation. Equivalently, it is optimal to set uniform contributions and uniform pension benefits and the agent with the higher longevity obtains a higher (and positive) net lifetime benefit, NB i=T ici−wzi from the pension system than the short-lived, simply because he lives longer.
In contrast, if we assume that agents are risk averse towards the length of life, i.e., G″(.)<0, the only possible solution consists in setting c 1>c 2 and z 1<z 2 with U 1<U 2. In such a case, it is optimal to condition pension contributions and benefits on the agent's longevity, and to make the agent with longer prospects pay more contributions, receive less benefit and retire later. For high degrees of risk aversion, it is even possible that the net lifetime benefit obtained by the low-longevity agent becomes positive.
Finally, let us assume that agents are risk prone and that G ″(.)>0. In this case, two solutions are possible, depending on the differences in longevity between the two agents and on the degree of risk aversion. Either c 1>c 2 and z 1<z 2, or c 1<c 2 and z 1>z 2.
A quantitative example best illustrates the implications of the model described above. We set T 1 = 80, T 2 = 90, and w = 50,000US$. We assume the following functional forms,
 $$\eqalign{G(U) = & \displaystyle{{{U^{1 - \rho}}}\over {1 - \rho}},\cr u(c) = & Log(c),\,R(z) = \gamma \displaystyle{{{z^2}} \over 2},} $$
with γ = 0.02 so as to obtain realistic retirement ages. Note that ρ stands here for the coefficient of risk aversion with respect to the age of death defined in the previous section (see equation (1)). Solving numerically for the optimal consumption levels and retirement ages and varying the degree of risk aversion towards the length of life in the population yields the following results (Table 1).
Optimal consumption levels and retirement ages as a function of the risk aversion towards length of life coefficient
With risk neutrality (ρ = 0), consumption and retirement ages should be uniform across the population and equal to US$38,348 and 65.2 years, respectively. In contrast, when we assume a risk aversion coefficient close to 1, the retirement ages should be differentiated and the long-lived agent should work over 3 additional years with respect to the risk neutrality case, while the short-lived one should anticipate retirement by more than 3 years. Also, the former would receive around US$2,000 less per year, while the latter would see his consumption increased by more than US$2,000. Under our specification, when agents are risk prone, those with higher longevity should obtain higher consumption and retire earlier.
Hence, the assumption of risk preference towards the length of life is paramount for the analysis of optimal design of a pension system. Indeed, this implies noticeable differences in terms of retirement ages and of contributions and benefits.
3 Survey design and data
The simple design in Figure 1 is our starting point. We designed a questionnaire which was fielded in the RAND ALP among panel members who were between 40 and 60 years old at the time of the survey (February 2012). We asked two lottery choice questions, the first (Q1) with the parameters of Figure 1, and the second one (Q3) with more risk but the same life expectancy of 80 years: 65 or 95, instead of 70 or 90 years old. We choose to keep the life expectancy of our lotteries equal to 80 years as the average life expectancy at birth across OECD countries was equal to 76.7 years old for men and 82.2 for women in 2009 (OECD, 2011). This therefore seems like a reasonable value and we believe an integer is easier to understand.Footnote 14
For each of these questions, we asked a follow-up question (Q2 and Q4) where we varied, using a table, the age at death in the certain lottery. We kept changing the age until the respondent was willing to switch his answer from the choice of one lottery to the other. For example, suppose the respondent answered he preferred to live for sure until 80 years old in Q1. Keeping the same risky outcomes (70 or 90 years old), we asked in Q2 if he would still prefer the certain outcome if he lived up to 79, 78, 77, and so on until 71 years old. The age at which the respondent switches answer identifies the age at which the respondent becomes indifferent between the two lotteries. As we show below, this ‘switching age’ allows us to estimate the degree of risk aversion. We do something similar for those who exhibit risk proneness.
The text of the questions can be found in the appendix. For each question, we stressed that respondents should assume their standard of living and their health would stay the same each year. Hence, we assume they enjoy a ‘constant flow of satisfaction’ (equivalently, their quality of life does not vary) as defined in the previous section, which allows us to focus on risk attitudes towards the length of life rather than on other forms of time preference or age-dependent utility.
At first glance, such choice scenarios may appear unrealistic. However, choices over longevity risks occur in everyday life. For instance, the introduction of a new drug or the decision to undergo some risky surgery may lead patients to be confronted with comparisons between a relatively certain scenario (early death) and an uncertain scenario in which the drug is effective or not. We decided not to frame the experiment in those terms in order to maintain the potential for external validity. From exit interviews of respondents, we got very few negative comments to those questions which made us (cautiously) confident that the questions were salient to the respondents.
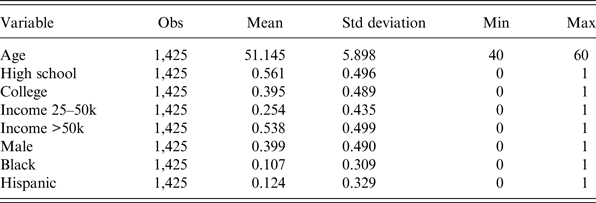
Our sample includes 1425 American respondents between the age of 40 and 60. In addition to data from our survey, we also obtain background information from the core questionnaire of the ALP (gender, income, education, race and ethnicity).Footnote 15 Appendix B includes descriptive statistics on the variables we use. The average age of respondents is 51 years old. A majority of 56% hold a high-school degree, and 39.5% a college degree. A majority of 53.75% earn above US$50,000, and 25.4% earn between US$25,000 and 50,000. Women account for 60%, blacks for 10% and hispanics for 12%.
4 Estimation
Answers to Q1 and Q3 allow us to compute the fraction of respondents who are prone, neutral and averse to risk with respect to length of life. Hence, we can determine the frequency of these types of behaviour. We study the determinants of the probability of being prone, averse or neutral using a multinomial logit model with socio-economic variables as controls.
We also quantify the extent of risk aversion and proneness for those who were not indifferent between the two lotteries. Answers to questions Q2 and Q4 define the switching age a r at which the individual becomes indifferent between the two lotteries. This switching age allows us to pin down the coefficient of risk aversion towards the length of life, defined in equation (1), as follows.
Let a be the age of the respondent and X the risk premium. The agent is ready to pay to avoid the risky outcome, measured in life years. This premium is positive for a risk-averse agent and negative for a risk-prone agent. Respondents report in Q2 and Q4 their certainty equivalent age, a r, at which they become indifferent between the lotteries. Hence, the risk premium is X = 80−a r for both the questions, and it is implicitly defined by the following equality:
 $$G((A - a - X)v) = 0.5G((\underline A - a)v) + 0.5G((\overline A - a)v),$$
where A = 80,  $\underline A = 70$ and
 $\overline A = 90$ in questions Q1–Q2, and A = 80,
 $\underline A = 65$ and
 $\overline A = 95$ in questions Q3–Q4. Making a first order Taylor expansion around (A−a)v of the left-hand side (LHS) and a second-order expansion of the right-hand side (RHS), we can rewrite the above equality, after some simplifications, asFootnote 16
 $$X + 0.5(\underline A + \overline A - 2A) \approx \displaystyle{{{{(\underline A - A)}^2} + {{(\overline A - A)}^2}} \over 4}\left[ { - v\displaystyle{{G^{\prime \prime}((A - a)v)} \over {G^{\prime}((A - a)v)}}} \right].$$
One can then isolate α a(v, A) for an agent expecting to live (A−a) years as follows:
 $${\alpha _a}(v,A) \approx \displaystyle{{4(X + 0.5(\underline A + \overline A - 2A))} \over {{{(\underline A - A)}^2} + {{(\overline A - A)}^2}}}.$$
Replacing with the corresponding values of the switching age for Q1 (Q2), we obtain
 $$\alpha \approx \displaystyle{{(80 - {a_r})} \over {50}}.$$
For question Q3 (Q4), the expression for the coefficient has the following form:
 $$\alpha \approx \displaystyle{{4(80 - {a_r})} \over {450}}.$$
Interestingly, these expressions do not depend either on v or a. Using the answers to Q2, we can thus compute for each respondent the degree of risk aversion and risk proneness with respect to the length of life. We do the same with Q4.
To estimate the determinants of α, we need to deal with right- and left-censoring of the switching age as some respondents never switch. For those choosing the certain lottery (and hence who are risk averse), let α i* be the uncensored measure for respondent i and α i,max be the maximum measure of α if the agent switched at the last age in the list. For those who chose the risky lottery and never switched in Q2 or Q4, let α i,min be the minimum measure of α if the agent switched at the last age in that list.
The uncensored measure is a function of characteristics x i (age, income, education, race and ethnicity) and an unexplained portion εi, normally distributed with variance var(εi):
 $$\alpha_i^{\ast} = {x_i}\beta + {{\rm \varepsilon} _i}.$$
The observed measure, α i, is given by
 $${\alpha _i} = max{\kern 1pt} (min({\alpha _{i,max}},\alpha _i^{\ast} ),{\alpha _{i,min}}).$$
This yields a two-sided tobit model with heterogeneous censoring points. We estimate parameters β and var(εi) by maximum likelihood.
5 Results
5.1 Frequency of deviation from risk neutrality
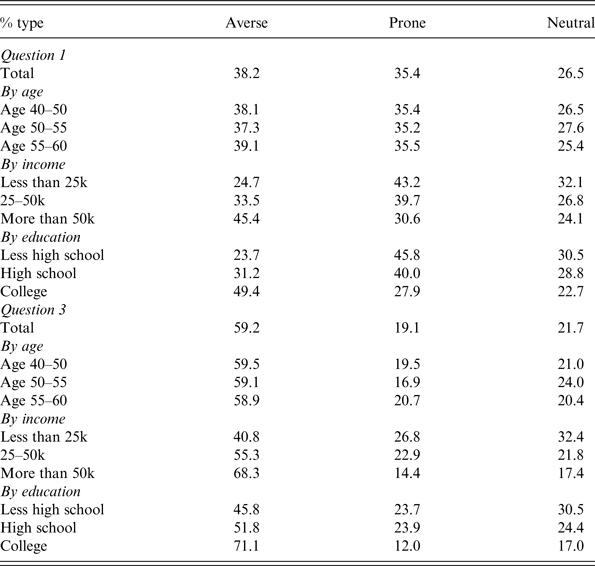
Questions Q1 and Q3 allow us to quantify the frequency of deviation from risk neutrality. In Table 2, we report the fraction of respondents choosing the certain lottery (i.e., those who are risk averse with respect to the length of life), the risky lottery (i.e., the risk-prones), or who report being indifferent (i.e., the risk-neutrals).
Fraction of respondents who prefer lottery L1 (averse), who prefer lottery L2 (prone) and who are indifferent (neutral). Question 1 offers the choice between living for certain until 80 and a lottery with equal chances of living until 70 or 90. Question 3 has a risky lottery with equal chances of living until 65 or 95
Overall, 73.6% of respondents are not indifferent to the lotteries presented in Q1. Only 26.5% of respondents are risk neutral with respect to the length of life. A slight majority, of 38.2% respondents, are risk averse (they prefer the certainty of living to 80), while 35.4% are prone to risk (they prefer a 50% chance of living to 70 or 90). These responses clearly show that all agents are not neutral towards the risk of mortality.
There is very little variation by age in these patterns. However, it appears that those with higher incomes (more than US$50k) and with college degrees are more likely to be averse to the risk of longevity. In contrast with the results obtained for monetary risk aversion, we find a high proportion of agents who are in favour of the risky lottery.Footnote 17 This may be due to the very specific risk we considered, that is a risk on longevity.Footnote 18
When we increase the variance in the second lottery (Q3), more respondents appear to be risk averse. Almost 60% prefer the certainty of living to 80, while only 19.1% prefer the risky lottery. A similar income and education gradient is found as for Q1.
As we have mentioned at the end of Section 2.1, one could question the constant flow of satisfaction assumption (and thus the design of our survey), and could possibly argue that our results – i.e., some agents prefer the certain lottery- are simply driven by time discounting or by the expectation of a decreasing health status over the lifetime (even though we had explicitly mentioned their health status was preserved). However, we find that a non-negligible number of respondents prefer the risky lottery or are indifferent, a pattern which neither time impatience nor a deteriorating health alone can explain.
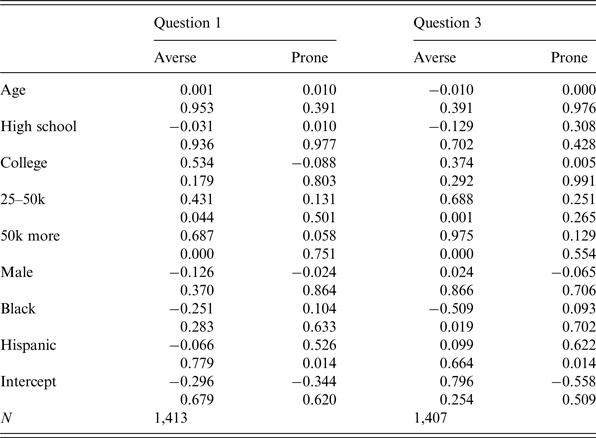
Next, we investigate how socio-economic characteristics, including race and ethnicity, affect these answers by estimating a multinomial logit. The reference option is indifference. Thus, we must interpret the estimates relative to this option. Estimates for each question (Q1 and Q3) along with p-values are reported in Table 3.
Multinomial logit parameter estimates with p-values. The reference outcome is risk neutrality. For covariates, the reference category for education is (less than high school) and (less than 25k) for income
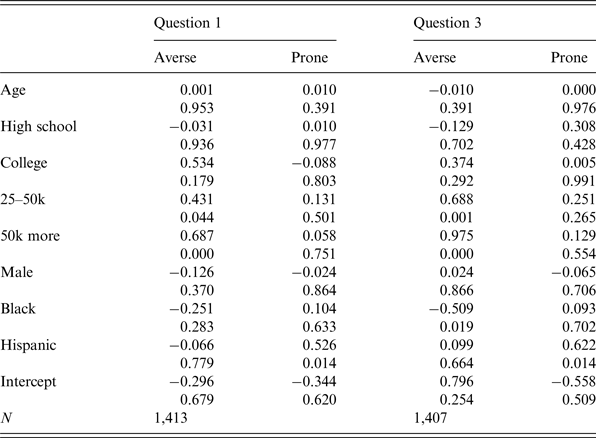
We do not find an age gradient, confirming what was reported in Table 1. This might be due to the fact that the age range (between 40 and 60 years old) is quite limited and that most of our respondents are around 50 years old. Income, but not education, appears to increase the chances of being risk averse with respect to the age at death. Hispanics appear more likely to report being risk-prone, while blacks appear less likely to be risk-averse. This last effect is only statistically significant for Q3. Overall the pattern of estimates is largely stable across questions. Hence, for the rest of the analysis we pool the responses of both sets of lotteries.
Before turning to the next section, let us briefly relate our results on the relation between socio-economic characteristics and risk aversion towards the length of life with what was previously found in the literature on standard risk aversion. Barsky et al. (Reference Barsky, Juster, Miles and Shapiro1997) find that relative risk aversion is inverse U-shaped in income, age and education. They also find that whites are more risk averse than blacks, while hispanics are the least risk averse. Arrondel et al. (Reference Arrondel, Masson and Verger2004), using French data, find that risk aversion is increasing with age but decreasing in income and in education.Footnote 19 In both studies, males are found to be less risk averse. These papers, of course, study a different kind of risk aversion, since they are about individual preferences over monetary risks while our paper focuses on the risk of longevity. Hence, we find that richer agents are more risk averse towards the length of life while the contrary is observed for standard risk aversion. However, our model yields the same results for the link between race and risk aversion as the one observed in the case of standard risk aversion.Footnote 20
5.2 Degree of deviation from risk neutrality
The last section showed some evidence of deviations from neutrality with respect to the longevity risk. We now analyse the degree of deviation by making use of data on ‘switching ages’ to construct the coefficient of risk aversion towards the age at death, α. We pool answers to both questions Q2 and Q4. We set α = 0 for those who were indifferent between the two lotteries and compute α for other responses as shown in Section 4.
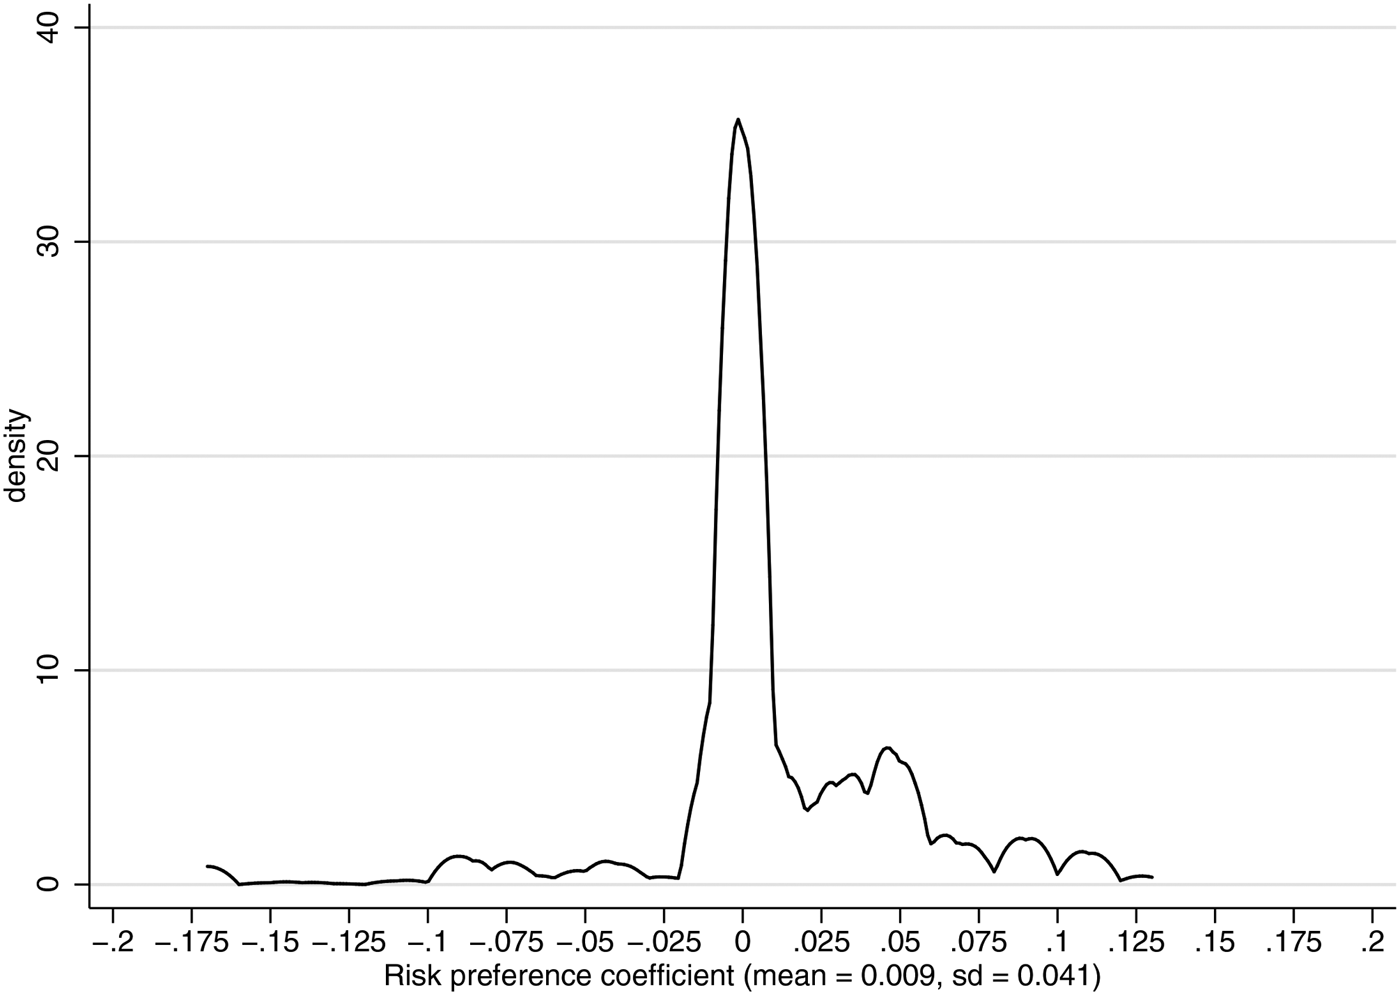
In Figure 2, we report the density of α over both questions Q2 and Q4, excluding censored observations.
Distribution of the risk aversion coefficient to both questions Q1 and Q3. Censored observations are excluded.
Since about one-fourth of respondents were indifferent, there is a peak at zero. The average estimate of relative risk preference is close to zero (0.009) with a standard deviation of 0.041. A t-test rejects the null that the mean is zero (t = 9.92). The distribution is skewed to the left with more mass in the positive domain which reflects risk aversion towards length of life. Note that measures of the risk attitude are strongly correlated across questions: overall, the correlation coefficient is 0.496 (p < 0.001). If we focus on respondents who expressed risk aversion in both Q1 and Q3, the correlation coefficient increases to 0.799 (p < 0.001).
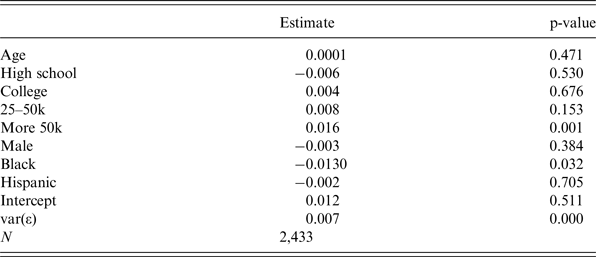
To investigate the correlates of α, we report in Table 4 parameter estimates from the two-sided tobit model developed in Section 4. Parameter estimates suggest that the coefficient of risk aversion towards the age at death is positively correlated with income, but negatively correlated with being black. Age and education do not appear to be correlated with the risk aversion coefficient.Footnote 21
Heterogeneous limit tobit point estimates and p-values
6 Conclusion
In this paper, we test for deviations from risk neutrality towards the length of life. We designed a questionnaire that aimed at detecting and measuring longevity risk aversion. We present evidence that close to three quarters of respondents do not exhibit risk neutrality towards the length of life (which is typically assumed in intertemporal choice models). Roughly, three-fourths of the population from our survey reported to be either risk averse or risk prone. We found that income was positively correlated with risk aversion but that neither age nor education had an impact.
This paper provides a first step towards a better understanding of agents’ preferences towards the length of life. However, there are some limitations to this study. First, following Bommier (Reference Bommier2006), we make the assumption of a constant flow of satisfaction. Accordingly, in the survey, we asked precise questions so as to ensure that respondents abstracted from pure time preference considerations and other time-dependent utility considerations, such as health. Some of our results support the view that respondents abstracted from such considerations for the most part. If only pure time preferences or a decreasing health status were at work, agents should always choose the lottery with no risk. This is clearly not what the results of our survey suggest as we obtain that a non-negligible number of respondents prefer the risky lottery or are indifferent. Second, empirical evidence has shown that richer agents are more patient, which would make them choose the risky lottery more often.Footnote 22 However, we find that richer agents more often choose the lottery without uncertainty.
One potential extension of the methodology developed here would be to jointly estimate pure time preference and longevity risk aversion. In theory, we have two answers to questions with different levels of risk. Hence, we have two restrictions as a function of time preference and the longevity risk aversion coefficient. Thus, it should be possible in theory to disentangle these effects. This may however be more feasible with more rounds of choices among lotteries.
Second, in a future research project, we will experiment with contextual choice situations to assess whether respondents are affected by framing effects. For instance, a few respondents mentioned that it was hard to think about questions on longevity because people hardly decide when they die. Also, we realized that we did not ask further questions which would have been useful for interpreting our results. For example, at question Q.2, we could not determine whether the agents who had not switched at 70 years old would have effectively switched at 70, simply because we did not ask this last question. As a result, we could not find whether these agents understood the question.
Third, we have not shown whether our preference measures correlate with actual decisions made by households, such as the decision to buy annuities or life insurance. This is important for external validity but also for testing whether longevity risk preferences play a role in decision making.
Other than these limitations, one obvious conclusion of this pilot project is that it appears to be possible to ask respondents such questions about risks regarding the length of life. As Bommier and Villeneuve (Reference Bommier and Villeneuve2012) mention in the conclusion of their paper, ‘the key issue is therefore to estimate mortality risk aversion. The difficulty of the task should not be underestimated. (…) This should be rather seen as a long-term objective that will probably require the collection of specific data’.
Appendix
Appendix A – time preferences, decreasing health status and preferences over lotteries
Assume that agents are risk neutral towards the length of life but that they are impatient. For simplicity, we set a = 0 in this example (this does not change the argument). Assuming that per-period utility is equal to u, the utility agents obtain from lottery L1 in Figure 1 is equal to
 $$U({L_1}) = (1 + \beta + {\beta ^2} + \cdots + {\beta ^{79}})u.$$
The expected utility they obtain from lottery L2 described in Figure 1 is
 $$U({L_2}) = 0.5{\kern 1pt} (1 + \beta + {\beta ^2} + \cdots + {\beta ^{69}})u + 0.5(\beta + {\beta ^2} + \cdots + {\beta ^{89}})u.$$
One can rewrite the difference in utilities between the two lotteries as follows:
 $$U({L_1}) - U({L_2}) = 0.5u[({\beta ^{70}} + \cdots + {\beta ^{79}}) - ({\beta ^{80}} + \cdots + {\beta ^{89}})].$$
It is straightforward to see that as long as β≤1, U(L 1)≥U(L 2). These results hold for any p and the corresponding life expectancy.
In the same way, assume that the health status deteriorates at each period so that per period utility at time t is equal to v t=βtu with β≤1 and tÎ[0, 89]. Using the same reasoning as above, we obtain that a risk-neutral agent would always prefer the certain lottery.
Appendix C – survey questionnaire
This survey asks questions about how we think about longevity, or length of life. You will be asked to make some choices that may seem unrealistic at first, but they are in fact similar to the choices we make in real life.
Respondents were then asked the following first question:Footnote 23
Q1: In the following scenarios, imagine that your standard of living and your health condition are preserved no matter how long you live. Please choose between the following options:
(1) You will live until you are 80 years old.
(2) You have a 50% chance of living until you are 70 years old and a 50% chance of living until you are 90 years old.
(3) You are indifferent, or have no preference between options 1 and 2.
If at this question Q1, they answered 1, they were asked Q2.1 while if they answered 2, they were asked Q2.2. These questions are reported below.
Q2.1: In the previous question, you preferred option 1 (you live till you are 80 years old) to option 2 (a 50% chance you live till 70 years old and a 50% chance till 90 years old).
Suppose now that we modify option 1 and keep option 2 the same. For the following possibilities, please indicate whether you still prefer the modified option 1 if you live till you are:
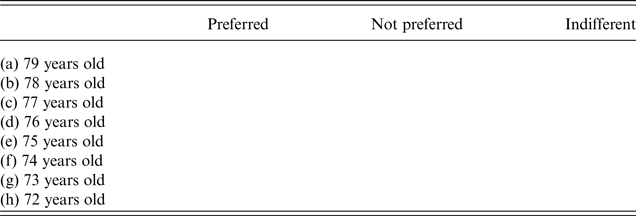
Note that only one answer at each line was possible.
Q2.2: In the previous question you preferred option 2 (a 50% chance you live till 70 years old and a 50% chance till 90 years old) to option 1 (you live till you are 80 years old). Suppose now that we modify option 1 and keep option 2 the same. For the following possibilities, please indicate whether you still prefer option 2 to living till you are:
We further asked a second identical set of questions except for the variance of the uncertain lottery:
Q3: In the following scenarios, imagine that your standard of living and your health condition are preserved no matter how long you live. Please choose between the following options:
(1) You live until you are 80 years old.
(2) You have a 50% chance of living until you are 65 years old and a 50% chance of living until you are 95 years old.
(3) You are indifferent, or have no preference between options 1 and 2.
Depending on what agents answered at question Q.3, we asked a second question, Q4.1 identical to question Q2.1 and Q4.2 identical to Q2.2.