1 Introduction
It has been known from numerical simulations of turbulent flows since the early 1990s (see Piomelli et al. Reference Piomelli, Cabot, Moin and Lee1991; Domaradzki, Liu & Brachet Reference Domaradzki, Liu and Brachet1993; Cerutti & Meneveau Reference Cerutti and Meneveau1998; Aoyama et al. Reference Aoyama, Ishihara, Kaneda, Yokokawa, Itakura and Uno2005; Goto Reference Goto2008; Ishihara, Gotoh & Kaneda Reference Ishihara, Gotoh and Kaneda2009, and references therein) that the interscale energy transfer rate is highly intermittent. Even though the turbulent energy cascades, on average, from large to small scales, the spatio-temporal fluctuations of the interscale energy transfer rate are such that localised regions exist in the flow where the turbulent energy actually cascades from small to large scales, opposite to the average sense. This is often referred to as backscatter.
In statistically stationary and homogeneous turbulence there are no average spatial fluxes and no average time dependence: the average picture of turbulence interscale transfers involves only energy input rate, interscale energy transfer rate, turbulence dissipation and viscous diffusion in scale space. Given that the interscale transfer rate is known to fluctuate widely about its mean, the question arises to know what is hidden behind the average cascade picture. This question is also raised by the fully generalised Kármán–Howarth equation, the Kármán–Howarth–Monin–Hill (KHMH) equation without averaging operations, because it contains a number of local spatial fluxes and a local time-derivative term all of which can be expected to fluctuate too. This equation is a scale-by-scale energy budget local in space and time, directly derived from the incompressible Navier–Stokes equations for the instantaneous velocity field (see Duchon & Robert Reference Duchon and Robert2000; Hill Reference Hill2002) without decomposition (e.g. Reynolds decomposition), without averages (e.g. Reynolds averages) and without any assumption made about the turbulent flow (e.g. homogeneity, isotropy, etc.).
In the next section we present this KHMH equation and the various physical processes included in it. We then introduce in § 3 the direct numerical simulations (DNSs) of forced periodic turbulence which we use to study the various processes involved in the KHMH equation. The KHMH analysis of our simulations confirms the well-known average interscale transfer picture mentioned above and the well-known intense intermittency of the interscale energy transfer rate and related backscatter. Having validated and set the stage for our approach in § 3, we then proceed in § 4 with new results concerning the fluctuations of the various processes in the KHMH equation and their correlations. In § 5 we summarise our conclusions and give some pointers for future research.
2 The KHMH equation: local scale-by-scale energy budget
Various forms of the KHMH equation have already been used to analyse DNS, particle image velocimetry and hot-wire anemometry data of various turbulent flows over the past 15 years or so (see e.g. Marati, Casciola & Piva Reference Marati, Casciola and Piva2004; Danaila et al.
Reference Danaila, Krawczynski, Thiesset and Renou2012; Gomes-Fernandes, Ganapathisubramani & Vassilicos Reference Gomes-Fernandes, Ganapathisubramani and Vassilicos2015; Togni, Cimarelli & Angelis Reference Togni, Cimarelli and Angelis2015; Valente & Vassilicos Reference Valente and Vassilicos2015; Cimarelli et al.
Reference Cimarelli, Angelis, Jiménez and Casciola2016; Alves Portela, Papadakis & Vassilicos Reference Alves Portela, Papadakis and Vassilicos2017). The KHMH equation in its most general form, i.e. without averages and without assumptions about the flow, is the evolution equation for
 $|\unicode[STIX]{x1D6FF}\boldsymbol{u}|^{2}$
, where
 $\unicode[STIX]{x1D6FF}\boldsymbol{u}\equiv \boldsymbol{u}-\boldsymbol{u}^{\prime }$
is the difference of fluid velocities at two separate points
 $\boldsymbol{x}$
and
 $\boldsymbol{x}^{\prime }$
,
 $\boldsymbol{u}\equiv \boldsymbol{u}(\boldsymbol{x},t)$
, and
 $\boldsymbol{u}^{\prime }\equiv \boldsymbol{u}(\boldsymbol{x}^{\prime },t)$
. It is expressed in terms of functions of the centroid position
 $\boldsymbol{X}=(\boldsymbol{x}+\boldsymbol{x}^{\prime })/2$
, the separation vector
 $\boldsymbol{r}=\boldsymbol{x}-\boldsymbol{x}^{\prime }$
and time
 $t$
as follows:
 $$\begin{eqnarray}\displaystyle \frac{\unicode[STIX]{x2202}}{\unicode[STIX]{x2202}t}|\unicode[STIX]{x1D6FF}\boldsymbol{u}|^{2}+\frac{\unicode[STIX]{x2202}}{\unicode[STIX]{x2202}r_{k}}(\unicode[STIX]{x1D6FF}u_{k}|\unicode[STIX]{x1D6FF}\boldsymbol{u}|^{2}) & = & \displaystyle -\frac{\unicode[STIX]{x2202}}{\unicode[STIX]{x2202}X_{k}}\frac{(u_{k}+u_{k}^{\prime })|\unicode[STIX]{x1D6FF}\boldsymbol{u}|^{2}}{2}-\frac{2}{\unicode[STIX]{x1D70C}}\frac{\unicode[STIX]{x2202}}{\unicode[STIX]{x2202}X_{k}}(\unicode[STIX]{x1D6FF}u_{k}\unicode[STIX]{x1D6FF}p)\nonumber\\ \displaystyle & & \displaystyle +\,2\unicode[STIX]{x1D708}\frac{\unicode[STIX]{x2202}^{2}}{\unicode[STIX]{x2202}r_{k}^{2}}|\unicode[STIX]{x1D6FF}\boldsymbol{u}|^{2}+\frac{\unicode[STIX]{x1D708}}{2}\frac{\unicode[STIX]{x2202}^{2}}{\unicode[STIX]{x2202}X_{k}^{2}}|\unicode[STIX]{x1D6FF}\boldsymbol{u}|^{2}\nonumber\\ \displaystyle & & \displaystyle -\left[2\unicode[STIX]{x1D708}\left(\frac{\unicode[STIX]{x2202}u_{j}}{\unicode[STIX]{x2202}x_{k}}\right)^{2}+2\unicode[STIX]{x1D708}\left(\frac{\unicode[STIX]{x2202}u_{j}^{\prime }}{\unicode[STIX]{x2202}x_{k}^{\prime }}\right)^{2}\right]+2\unicode[STIX]{x1D6FF}u_{k}\unicode[STIX]{x1D6FF}f_{k},\end{eqnarray}$$
where
 $\unicode[STIX]{x1D708}$
is the kinematic viscosity,
 $\unicode[STIX]{x1D70C}$
is the fluid density and
 $\unicode[STIX]{x1D6FF}p=p-p^{\prime }$
and
 $\unicode[STIX]{x1D6FF}f_{k}=f_{k}-f_{k}^{\prime }$
are, respectively, the pressure and body force differences across the two points
 $\boldsymbol{x}=\boldsymbol{X}+\boldsymbol{r}/2$
and
 $\boldsymbol{x}^{\prime }=\boldsymbol{X}-\boldsymbol{r}/2$
. This scale-by-scale balance consists of the following eight terms:
(i)
 $4{\mathcal{A}}_{t}(\boldsymbol{X},\boldsymbol{r},t)\equiv \unicode[STIX]{x2202}/\unicode[STIX]{x2202}t|\unicode[STIX]{x1D6FF}\boldsymbol{u}|^{2}$
is the time derivative term;
(ii)
$4\unicode[STIX]{x1D6F1}(\boldsymbol{X},\boldsymbol{r},t)\equiv \unicode[STIX]{x2202}/\unicode[STIX]{x2202}r_{k}(\unicode[STIX]{x1D6FF}u_{k}|\unicode[STIX]{x1D6FF}\boldsymbol{u}|^{2})$
is the interscale energy transfer term;(iii)
$4{\mathcal{T}}(\boldsymbol{X},\boldsymbol{r},t)\equiv -(\unicode[STIX]{x2202}/\unicode[STIX]{x2202}X_{k})((u_{k}+u_{k}^{\prime })|\unicode[STIX]{x1D6FF}\boldsymbol{u}|^{2}/2)$
is the turbulent transport of
$|\unicode[STIX]{x1D6FF}\boldsymbol{u}|^{2}$
along
$\boldsymbol{X}$
;(iv)
$4{\mathcal{T}}_{p}(\boldsymbol{X},\boldsymbol{r},t)\equiv -(2/\unicode[STIX]{x1D70C})(\unicode[STIX]{x2202}/\unicode[STIX]{x2202}X_{k})(\unicode[STIX]{x1D6FF}u_{k}\unicode[STIX]{x1D6FF}p)$
is the pressure–velocity term;(v)
$4{\mathcal{D}}_{\unicode[STIX]{x1D708}}(\boldsymbol{X},\boldsymbol{r},t)\equiv 2\unicode[STIX]{x1D708}(\unicode[STIX]{x2202}^{2}/\unicode[STIX]{x2202}r_{k}^{2})|\unicode[STIX]{x1D6FF}\boldsymbol{u}|^{2}$
is the viscous diffusion in the space of separation vectors
$\boldsymbol{r}$
;(vi)
$4{\mathcal{D}}_{X,\unicode[STIX]{x1D708}}(\boldsymbol{X},\boldsymbol{r},t)\equiv (\unicode[STIX]{x1D708}/2)(\unicode[STIX]{x2202}^{2}/\unicode[STIX]{x2202}X_{k}^{2})|\unicode[STIX]{x1D6FF}\boldsymbol{u}|^{2}$
is the viscous diffusion in physical space;(vii)
$4\unicode[STIX]{x1D716}^{\ast }(\boldsymbol{X},\boldsymbol{r},t)\equiv [2\unicode[STIX]{x1D708}(\unicode[STIX]{x2202}u_{j}/\unicode[STIX]{x2202}x_{k})^{2}+2\unicode[STIX]{x1D708}(\unicode[STIX]{x2202}u_{j}^{\prime }/\unicode[STIX]{x2202}x_{k}^{\prime })^{2}]$
is the sum of turbulent kinetic energy dissipations at
$\boldsymbol{x}$
and
$\boldsymbol{x}^{\prime }$
;(viii)
$4{\mathcal{I}}(\boldsymbol{X},\boldsymbol{r},t)\equiv 2\unicode[STIX]{x1D6FF}u_{k}\unicode[STIX]{x1D6FF}f_{k}$
is the energy input rate at separation
$\boldsymbol{r}$
.














Note that
 $4\unicode[STIX]{x1D6F1}$
,
 $4{\mathcal{T}}_{p}$
,
 $4{\mathcal{D}}_{\unicode[STIX]{x1D708}}$
,
 $4{\mathcal{D}}_{X,\unicode[STIX]{x1D708}}$
,
 $4\unicode[STIX]{x1D716}^{\ast }$
,
 $4{\mathcal{I}}$
and
 $4{\mathcal{A}}_{t}-4{\mathcal{T}}$
are all Galilean invariant. The KHMH equation (2.1) is for fluid velocities and fluid velocity differences, but in the particular case of homogeneous turbulence it remains exactly the same for turbulent fluctuating velocities (which are Galilean invariant) and turbulent fluctuating velocity differences if written in the frame moving uniformly with the mean flow velocity. This is a natural frame in homogeneous turbulence and
 $4{\mathcal{A}}_{t}$
and
 $4{\mathcal{T}}$
are separately meaningful in this case, as well as
 $4{\mathcal{A}}_{t}-4{\mathcal{T}}$
.
In this paper we study periodic turbulence which is forced so as to be statistically stationary in time. We use periodic boundary conditions because, by virtue of the Gauss divergence theorem, they set spatial averages (over
 $\boldsymbol{X}$
) of divergence terms such as
 $4{\mathcal{T}}(\boldsymbol{X},\boldsymbol{r},t)$
,
 $4{\mathcal{T}}_{p}(\boldsymbol{X},\boldsymbol{r},t)$
and
 $4{\mathcal{D}}_{X,\unicode[STIX]{x1D708}}(\boldsymbol{X},\boldsymbol{r},t)$
to zero. Statistical stationarity implies that the time average of
 $4{\mathcal{A}}_{t}(\boldsymbol{X},\boldsymbol{r},t)$
is also zero. Under these conditions, the spatio-temporal average of (2.1) reduces to
 $$\begin{eqnarray}\displaystyle \langle \unicode[STIX]{x1D6F1}\rangle =\langle {\mathcal{D}}_{\unicode[STIX]{x1D708}}\rangle -\langle \unicode[STIX]{x1D716}^{\ast }\rangle +\langle {\mathcal{I}}\rangle , & & \displaystyle\end{eqnarray}$$
where the brackets
 $\langle \cdot \rangle$
signify a spatio-temporal average (i.e. over
 $\boldsymbol{X}$
and
 $t$
). As mentioned in the introduction, the spatio-temporal-average picture of turbulence interscale transfers in statistically stationary periodic turbulence involves only energy input rate
 ${\mathcal{I}}$
, interscale energy transfer rate
 $\unicode[STIX]{x1D6F1}$
, turbulence dissipation
 $\unicode[STIX]{x1D716}^{\ast }$
and viscous diffusion in scale space
 ${\mathcal{D}}_{\unicode[STIX]{x1D708}}$
. However, the question naturally arises whether and to what extent the zero averages of
 $4{\mathcal{T}}(\boldsymbol{X},\boldsymbol{r},t)$
,
 $4{\mathcal{T}}_{p}(\boldsymbol{X},\boldsymbol{r},t)$
,
 $4{\mathcal{D}}_{X,\unicode[STIX]{x1D708}}(\boldsymbol{X},\boldsymbol{r},t)$
and
 $4{\mathcal{A}}_{t}(\boldsymbol{X},\boldsymbol{r},t)$
are in any way representative of the actual interscale and interspace energy transfer physics. These terms are all present in the local and instantaneous balance equation (2.1), and if
 $\unicode[STIX]{x1D6F1}$
fluctuates significantly, as is well known from various previous studies, then all the other terms in this equation must also be expected to fluctuate in both space and time. Could it be that the spatio-temporal average, when applied to interscale transfer and cascade dynamics, actually conceals the really significant physics of this dynamics?
In the following section we describe our DNS of statistically stationary periodic turbulence and validate it by confirming our existing knowledge of the average and fluctuating interscale transfer. In § 4 we use our DNS and the local and instantaneous KHMH equation (2.1) to access the dynamics which is hiding behind the spatio-temporal averages.
3 DNS of body-forced periodic turbulence
We perform direct numerical simulations (DNSs) of body-forced periodic turbulence using a pseudo-spectral method. We numerically solve the incompressible vorticity equation
 $$\begin{eqnarray}\displaystyle \frac{\unicode[STIX]{x2202}\unicode[STIX]{x1D74E}}{\unicode[STIX]{x2202}t}=\unicode[STIX]{x1D735}\times (\boldsymbol{u}\times \unicode[STIX]{x1D74E})+\unicode[STIX]{x1D708}\unicode[STIX]{x1D6FB}^{2}\unicode[STIX]{x1D74E}+\unicode[STIX]{x1D735}\times \boldsymbol{f}, & & \displaystyle\end{eqnarray}$$
with the continuity equation
 $$\begin{eqnarray}\displaystyle \unicode[STIX]{x1D735}\boldsymbol{\cdot }\boldsymbol{u}=0, & & \displaystyle\end{eqnarray}$$
where
 $\boldsymbol{u}$
is the velocity field,
 $\unicode[STIX]{x1D74E}$
is the vorticity field and
 $\boldsymbol{f}$
is the body force. The boundary conditions are triply periodic, i.e.
 $$\begin{eqnarray}\displaystyle \boldsymbol{u}(x_{1},x_{2},x_{3})=\boldsymbol{u}(x_{1}+2\unicode[STIX]{x03C0},x_{2},x_{3})=\boldsymbol{u}(x_{1},x_{2}+2\unicode[STIX]{x03C0},x_{3})=\boldsymbol{u}(x_{1},x_{2},x_{3}+2\unicode[STIX]{x03C0}). & & \displaystyle\end{eqnarray}$$
The forcing method employed here is a negative damping forcing (see e.g. Linkmann & Morozov Reference Linkmann and Morozov2015; McComb et al. Reference McComb, Linkmann, Berera, Yoffe and Jankauskas2015):
 $$\begin{eqnarray}\displaystyle \tilde{\boldsymbol{f}}(\boldsymbol{k},t) & = & \displaystyle (\unicode[STIX]{x1D716}_{W}/2K_{f})\tilde{\boldsymbol{u}}(\boldsymbol{k},t),\quad \text{for}~0<|\boldsymbol{k}|<k_{f},\nonumber\\ \displaystyle & = & \displaystyle 0,\qquad \qquad \qquad ~~\text{otherwise},\end{eqnarray}$$
where
 $\tilde{\boldsymbol{f}}(\boldsymbol{k},t)$
and
 $\tilde{\boldsymbol{u}}(\boldsymbol{k},t)$
are the Fourier coefficients of
 $\boldsymbol{f}(\boldsymbol{x},t)$
and
 $\boldsymbol{u}(\boldsymbol{x},t)$
respectively,
 $\unicode[STIX]{x1D716}_{W}$
is the energy input rate per unit mass,
 $k_{f}$
is the cutoff wavenumber and
 $K_{f}$
is the total kinetic energy per unit mass contained in the forcing band
 $0<|\boldsymbol{k}|<k_{f}$
. (We have also tried various other forcing methods without significant changes to our results all of which involve an average over two-point orientations, as explained in the penultimate paragraph of this section, and are therefore insensitive to any potential anisotropies introduced by forcing.) In our simulations, we set
 $\unicode[STIX]{x1D716}_{W}=0.1$
and
 $k_{f}=2.5$
. While
 $\unicode[STIX]{x1D716}_{W}$
is set constant in time, the total kinetic energy per unit mass
 $K(t)$
and the total energy dissipation per unit mass
 $\unicode[STIX]{x1D716}(t)$
fluctuate around constant values. We run two simulations and therefore use two mesh sizes,
 $128^{3}$
and
 $512^{3}$
, with respective kinematic viscosities
 $\unicode[STIX]{x1D708}=0.003$
and
 $0.00072$
. Using these parameters, the simulations are run for approximately 82 and 35 eddy turnover times
 $\langle L\rangle _{t}/\sqrt{2/3\langle K\rangle _{t}}$
respectively, where
 $L$
is the integral length scale calculated from the three-dimensional energy spectrum
 $E(k,t)$
, i.e.
 $L(t)=(3\unicode[STIX]{x03C0}/4)\int _{0}^{\infty }k^{-1}E(k,t)\,\text{d}k/K(t)$
. Throughout this work, suitably converged time averages
 $\langle \cdot \rangle _{t}$
are calculated over 30 eddy turnover times for the
 $128^{3}$
simulation and over 8.63 eddy turnover times for the
 $512^{3}$
simulation, i.e. from
 $t=25\langle L\rangle _{t}/\sqrt{2/3\langle K\rangle _{t}}$
to
 $t=55\langle L\rangle _{t}/\sqrt{2/3\langle K\rangle _{t}}$
for
 $128^{3}$
and from
 $t=8.86\langle L\rangle _{t}/\sqrt{2/3\langle K\rangle _{t}}$
to
 $t=17.49\langle L\rangle _{t}/\sqrt{2/3\langle K\rangle _{t}}$
for
 $512^{3}$
. The time-averaged Taylor length scale Reynolds numbers (based on the Taylor length
 $\unicode[STIX]{x1D706}=\sqrt{10\unicode[STIX]{x1D708}K/\unicode[STIX]{x1D716}}$
) are
 $\langle Re_{\unicode[STIX]{x1D706}}\rangle _{t}=80.9$
and
 $\langle Re_{\unicode[STIX]{x1D706}}\rangle _{t}=178$
respectively. The average spatial resolution
 $k_{max}\langle \unicode[STIX]{x1D702}\rangle _{t}$
equals
 $1.37$
for
 $128^{3}$
and
 $1.89$
for
 $512^{3}$
with respective standard deviations
 $0.0189$
and
 $0.0426$
, where
 $\unicode[STIX]{x1D702}$
is the Kolmogorov length. The time-average integral length scale is related to
 $k_{f}$
by
 $2\unicode[STIX]{x03C0}/k_{f}=2.28\langle L\rangle _{t}$
and
 $2\unicode[STIX]{x03C0}/k_{f}=2.35\langle L\rangle _{t}$
respectively and the standard deviations of
 $\unicode[STIX]{x1D706}$
and
 $L$
are 3.4 % of
 $\langle \unicode[STIX]{x1D706}\rangle _{t}$
and 5.9 % of
 $\langle L\rangle _{t}$
in the
 $128^{3}$
case and 5.2 % of
 $\langle \unicode[STIX]{x1D706}\rangle _{t}$
and 7.8 % of
 $\langle L\rangle _{t}$
in the
 $512^{3}$
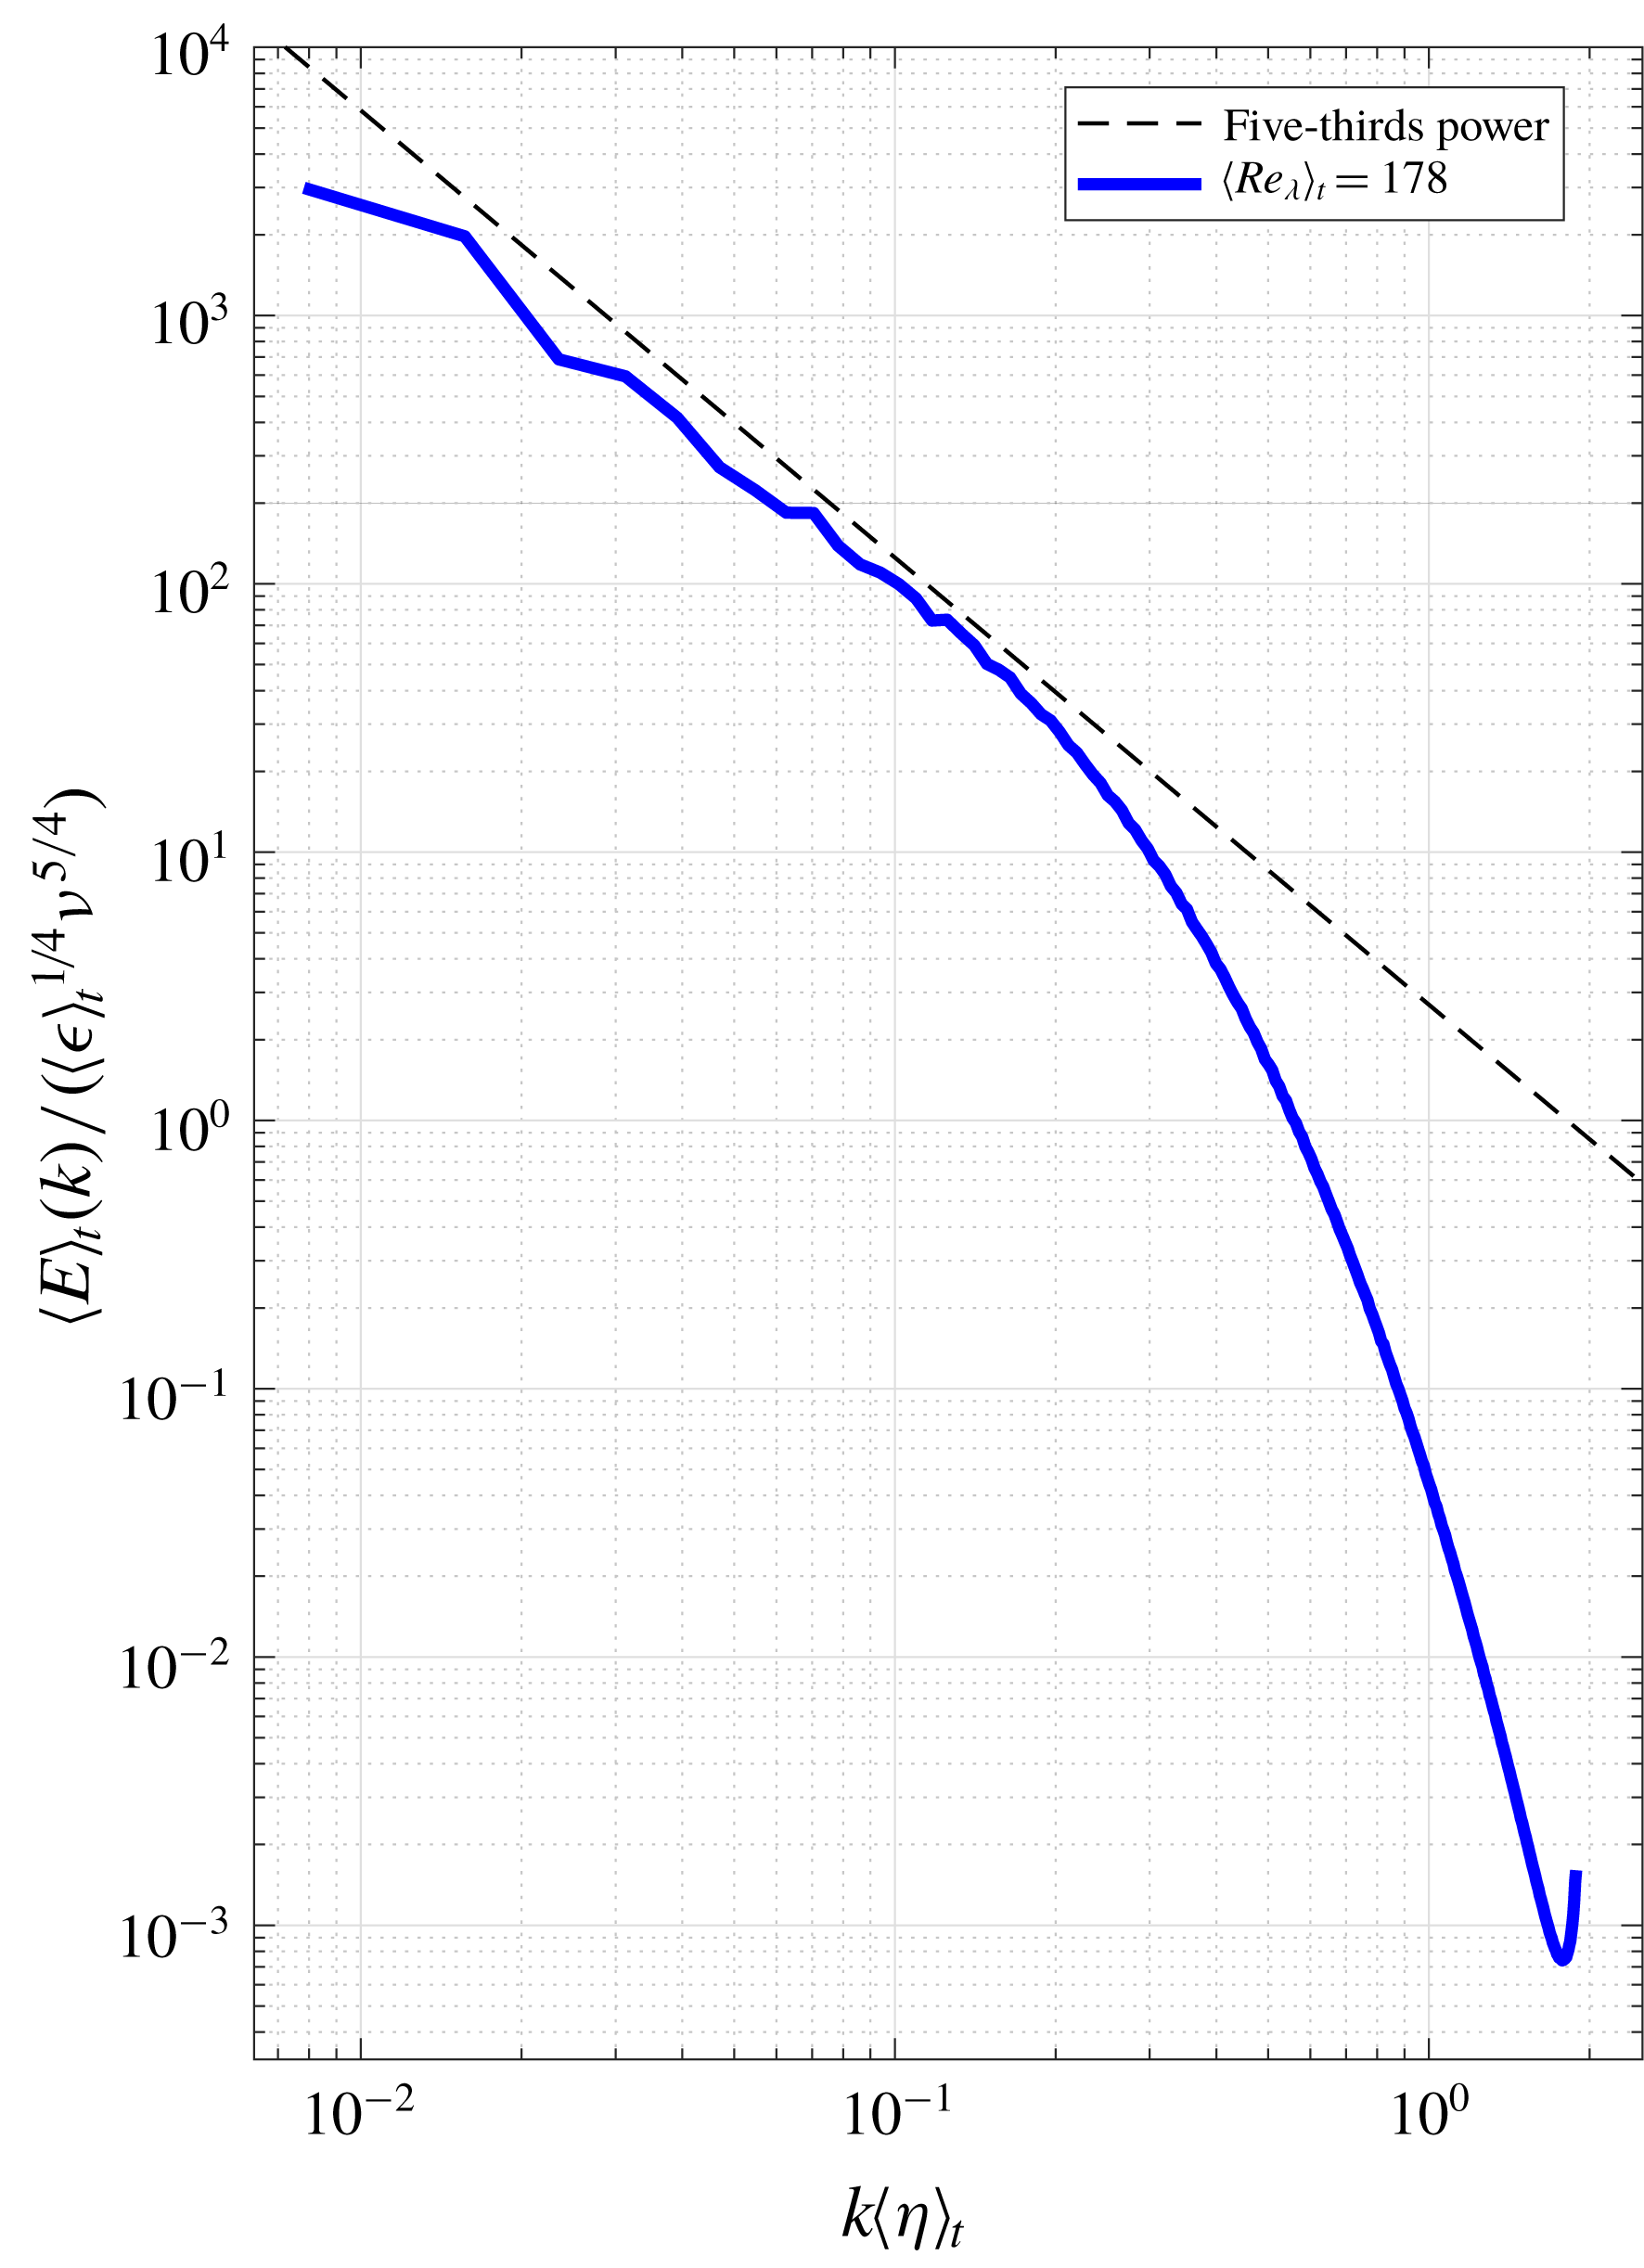
case. In figure 1 the three-dimensional energy spectrum is plotted for the
 $512^{3}$
case.
Time-average three-dimensional energy spectrum of forced periodic turbulence. The dashed line indicates the
 $-5/3$
slope for reference.

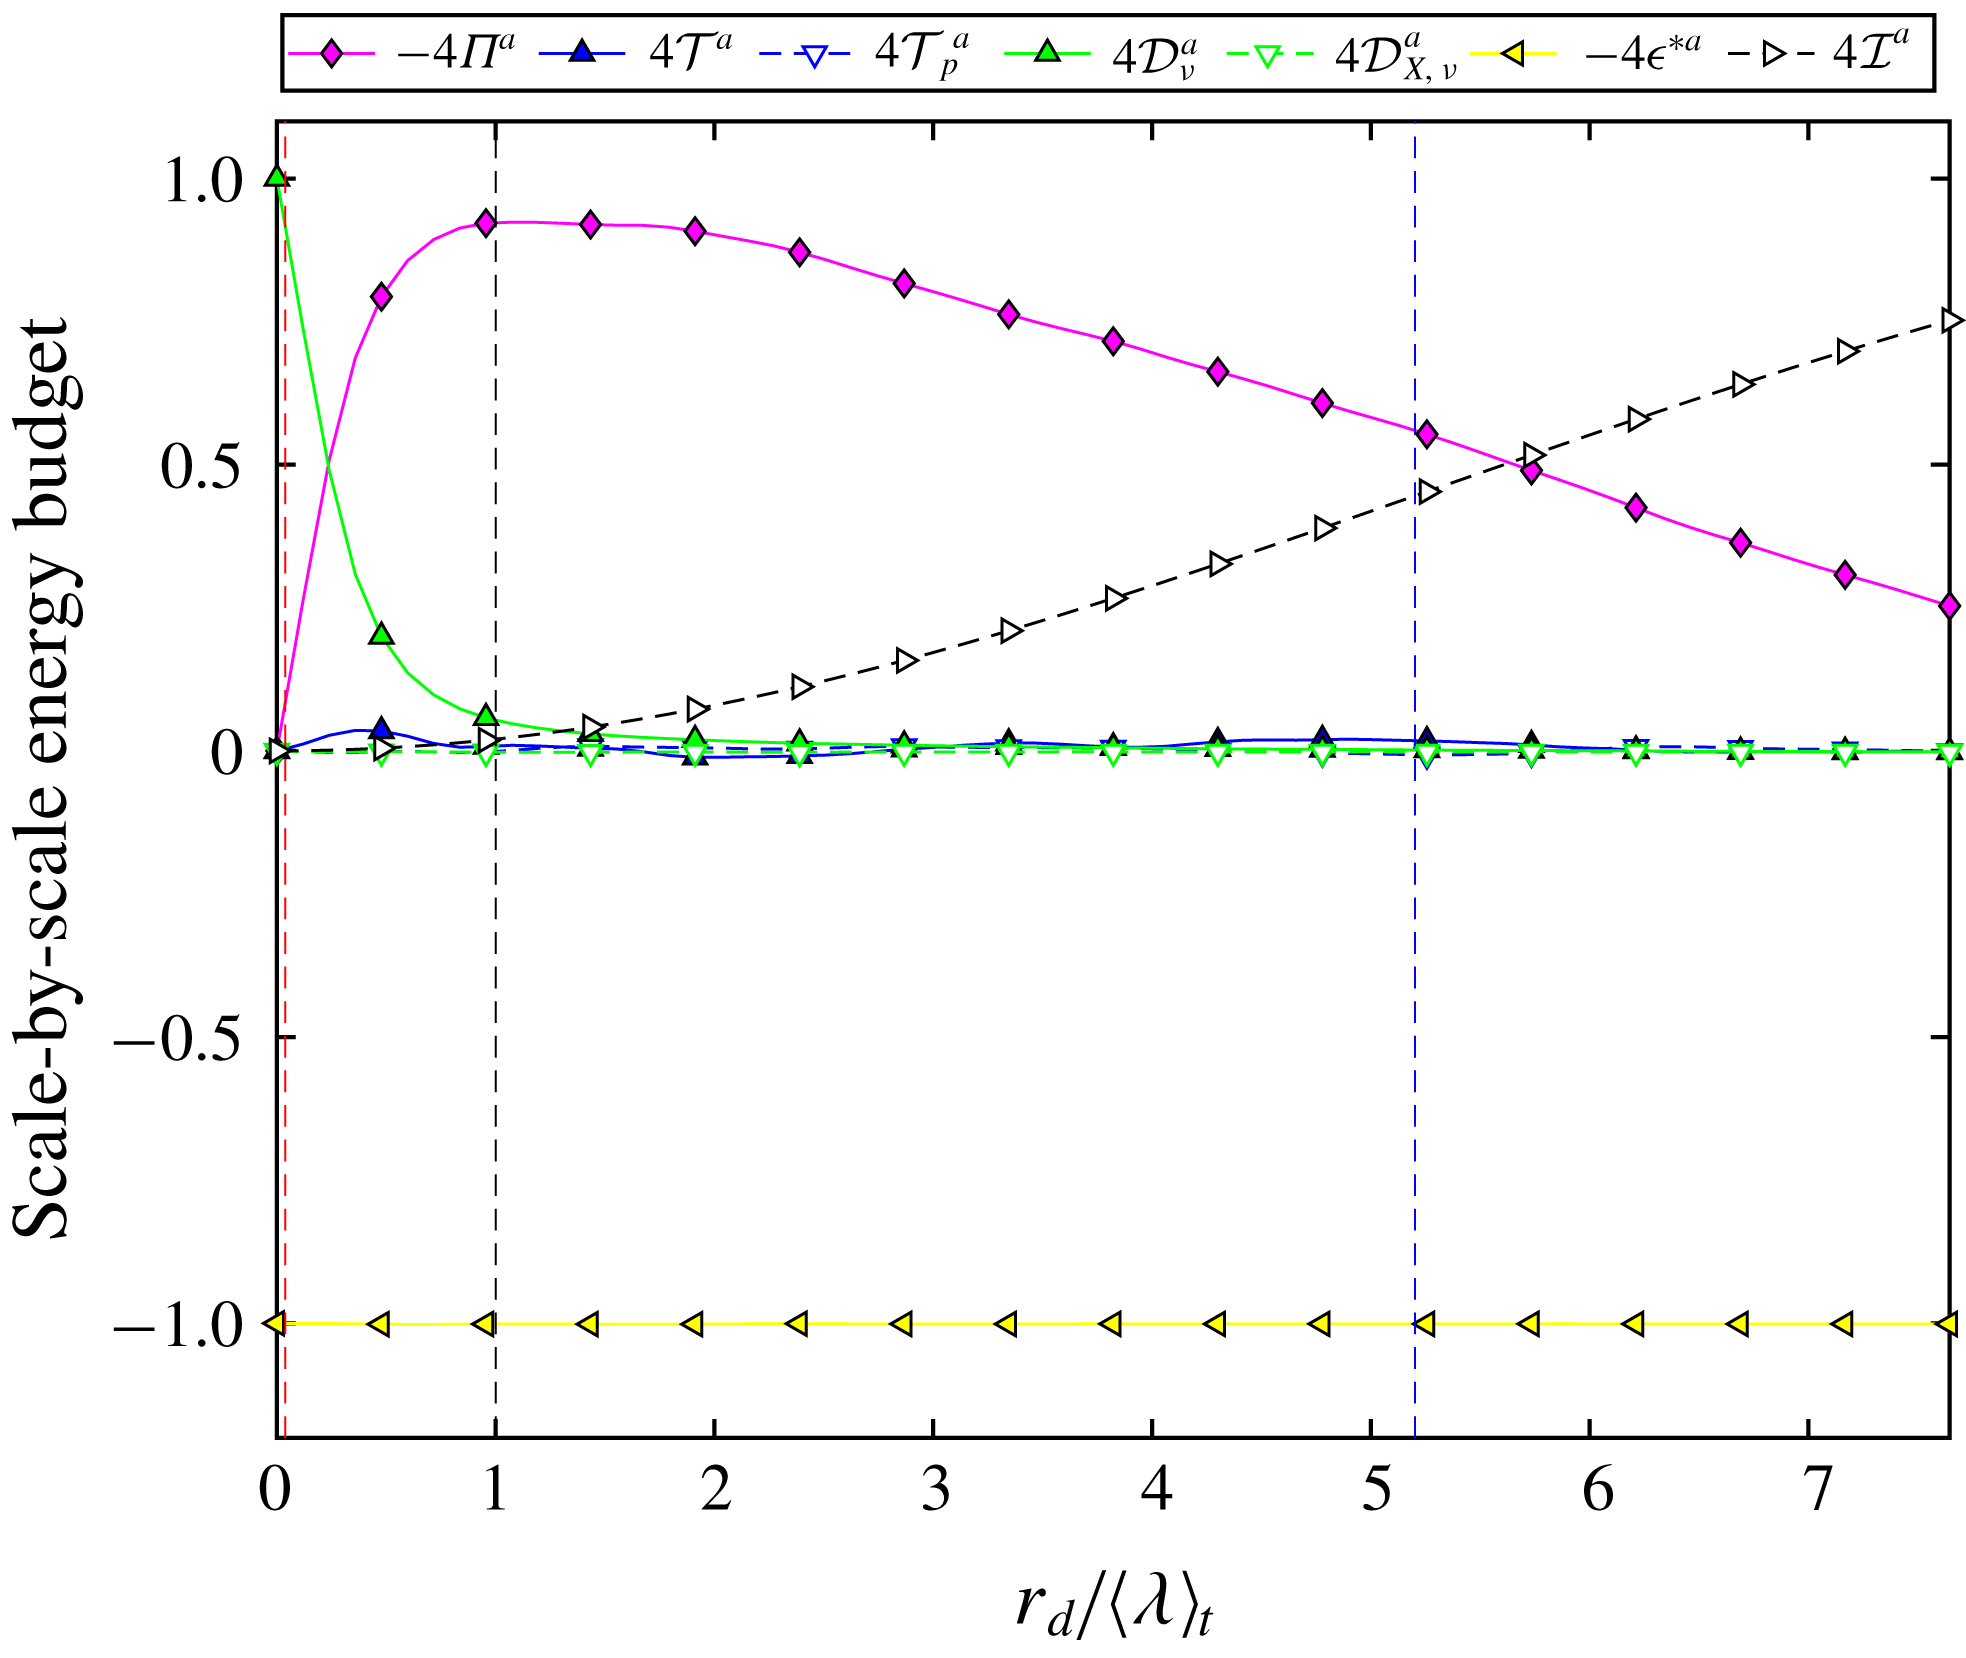
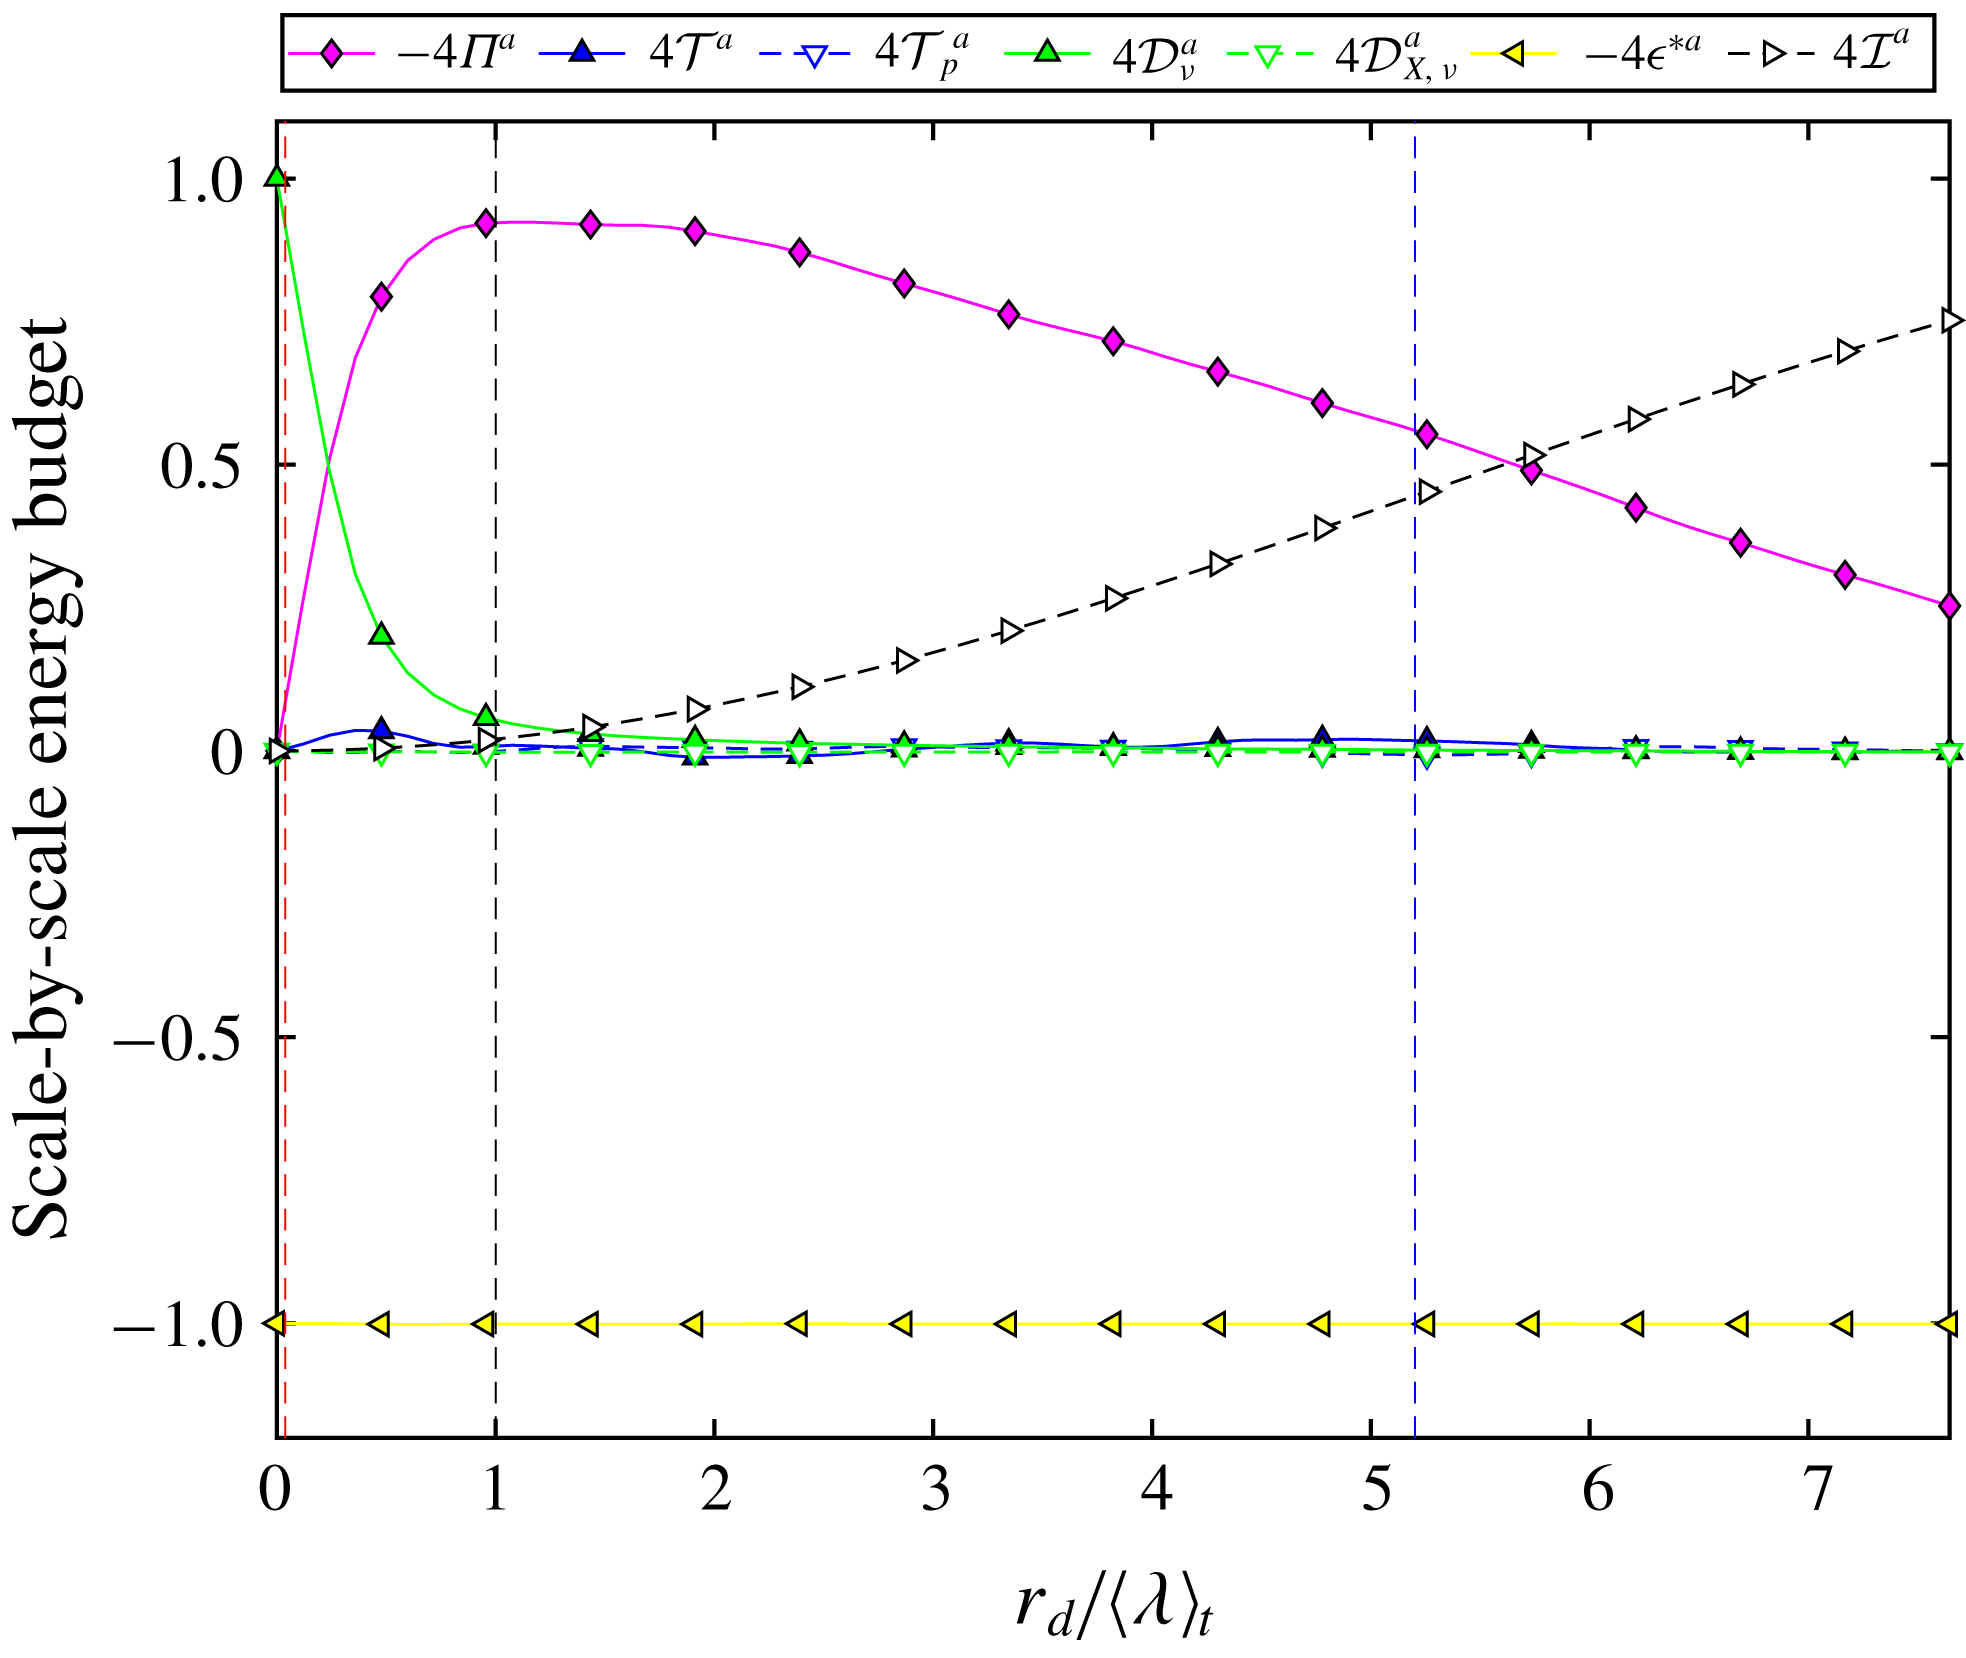
Average scale-by-scale energy budget for statistically stationary periodic turbulence (
 $\langle Re_{\unicode[STIX]{x1D706}}\rangle _{t}=178$
): plots of
 $\langle Q^{a}\rangle (r_{d})$
normalised by
 $\langle 4\unicode[STIX]{x1D716}^{\ast a}\rangle$
versus
 $r_{d}/\langle \unicode[STIX]{x1D706}\rangle _{t}$
for the terms, generically referred to as
 $Q$
in this caption, in (2.1). The actual list of these terms is at the top of the plot. Vertical red, black, blue dashed lines denote the Kolmogorov scale
 $\langle \unicode[STIX]{x1D702}\rangle _{t}$
, the Taylor micro-scale
 $\langle \unicode[STIX]{x1D706}\rangle _{t}$
and the integral scale
 $\langle L\rangle _{t}$
, respectively. Similar results (not plotted here) are obtained for
 $\langle Re_{\unicode[STIX]{x1D706}}\rangle _{t}=80.9$
except that the maximum value of
 $-4\unicode[STIX]{x1D6F1}^{a}$
is smaller and the decrease of
 $-4\unicode[STIX]{x1D6F1}^{a}$
from
 $r_{d}=\langle \unicode[STIX]{x1D706}\rangle _{t}$
to
 $r_{d}=\langle L\rangle _{t}$
is steeper because this range of scales is also smaller (
 $\langle L\rangle _{t}/\langle \unicode[STIX]{x1D706}\rangle _{t}\approx 2.7$
for
 $\langle Re_{\unicode[STIX]{x1D706}}\rangle _{t}=80.9$
).
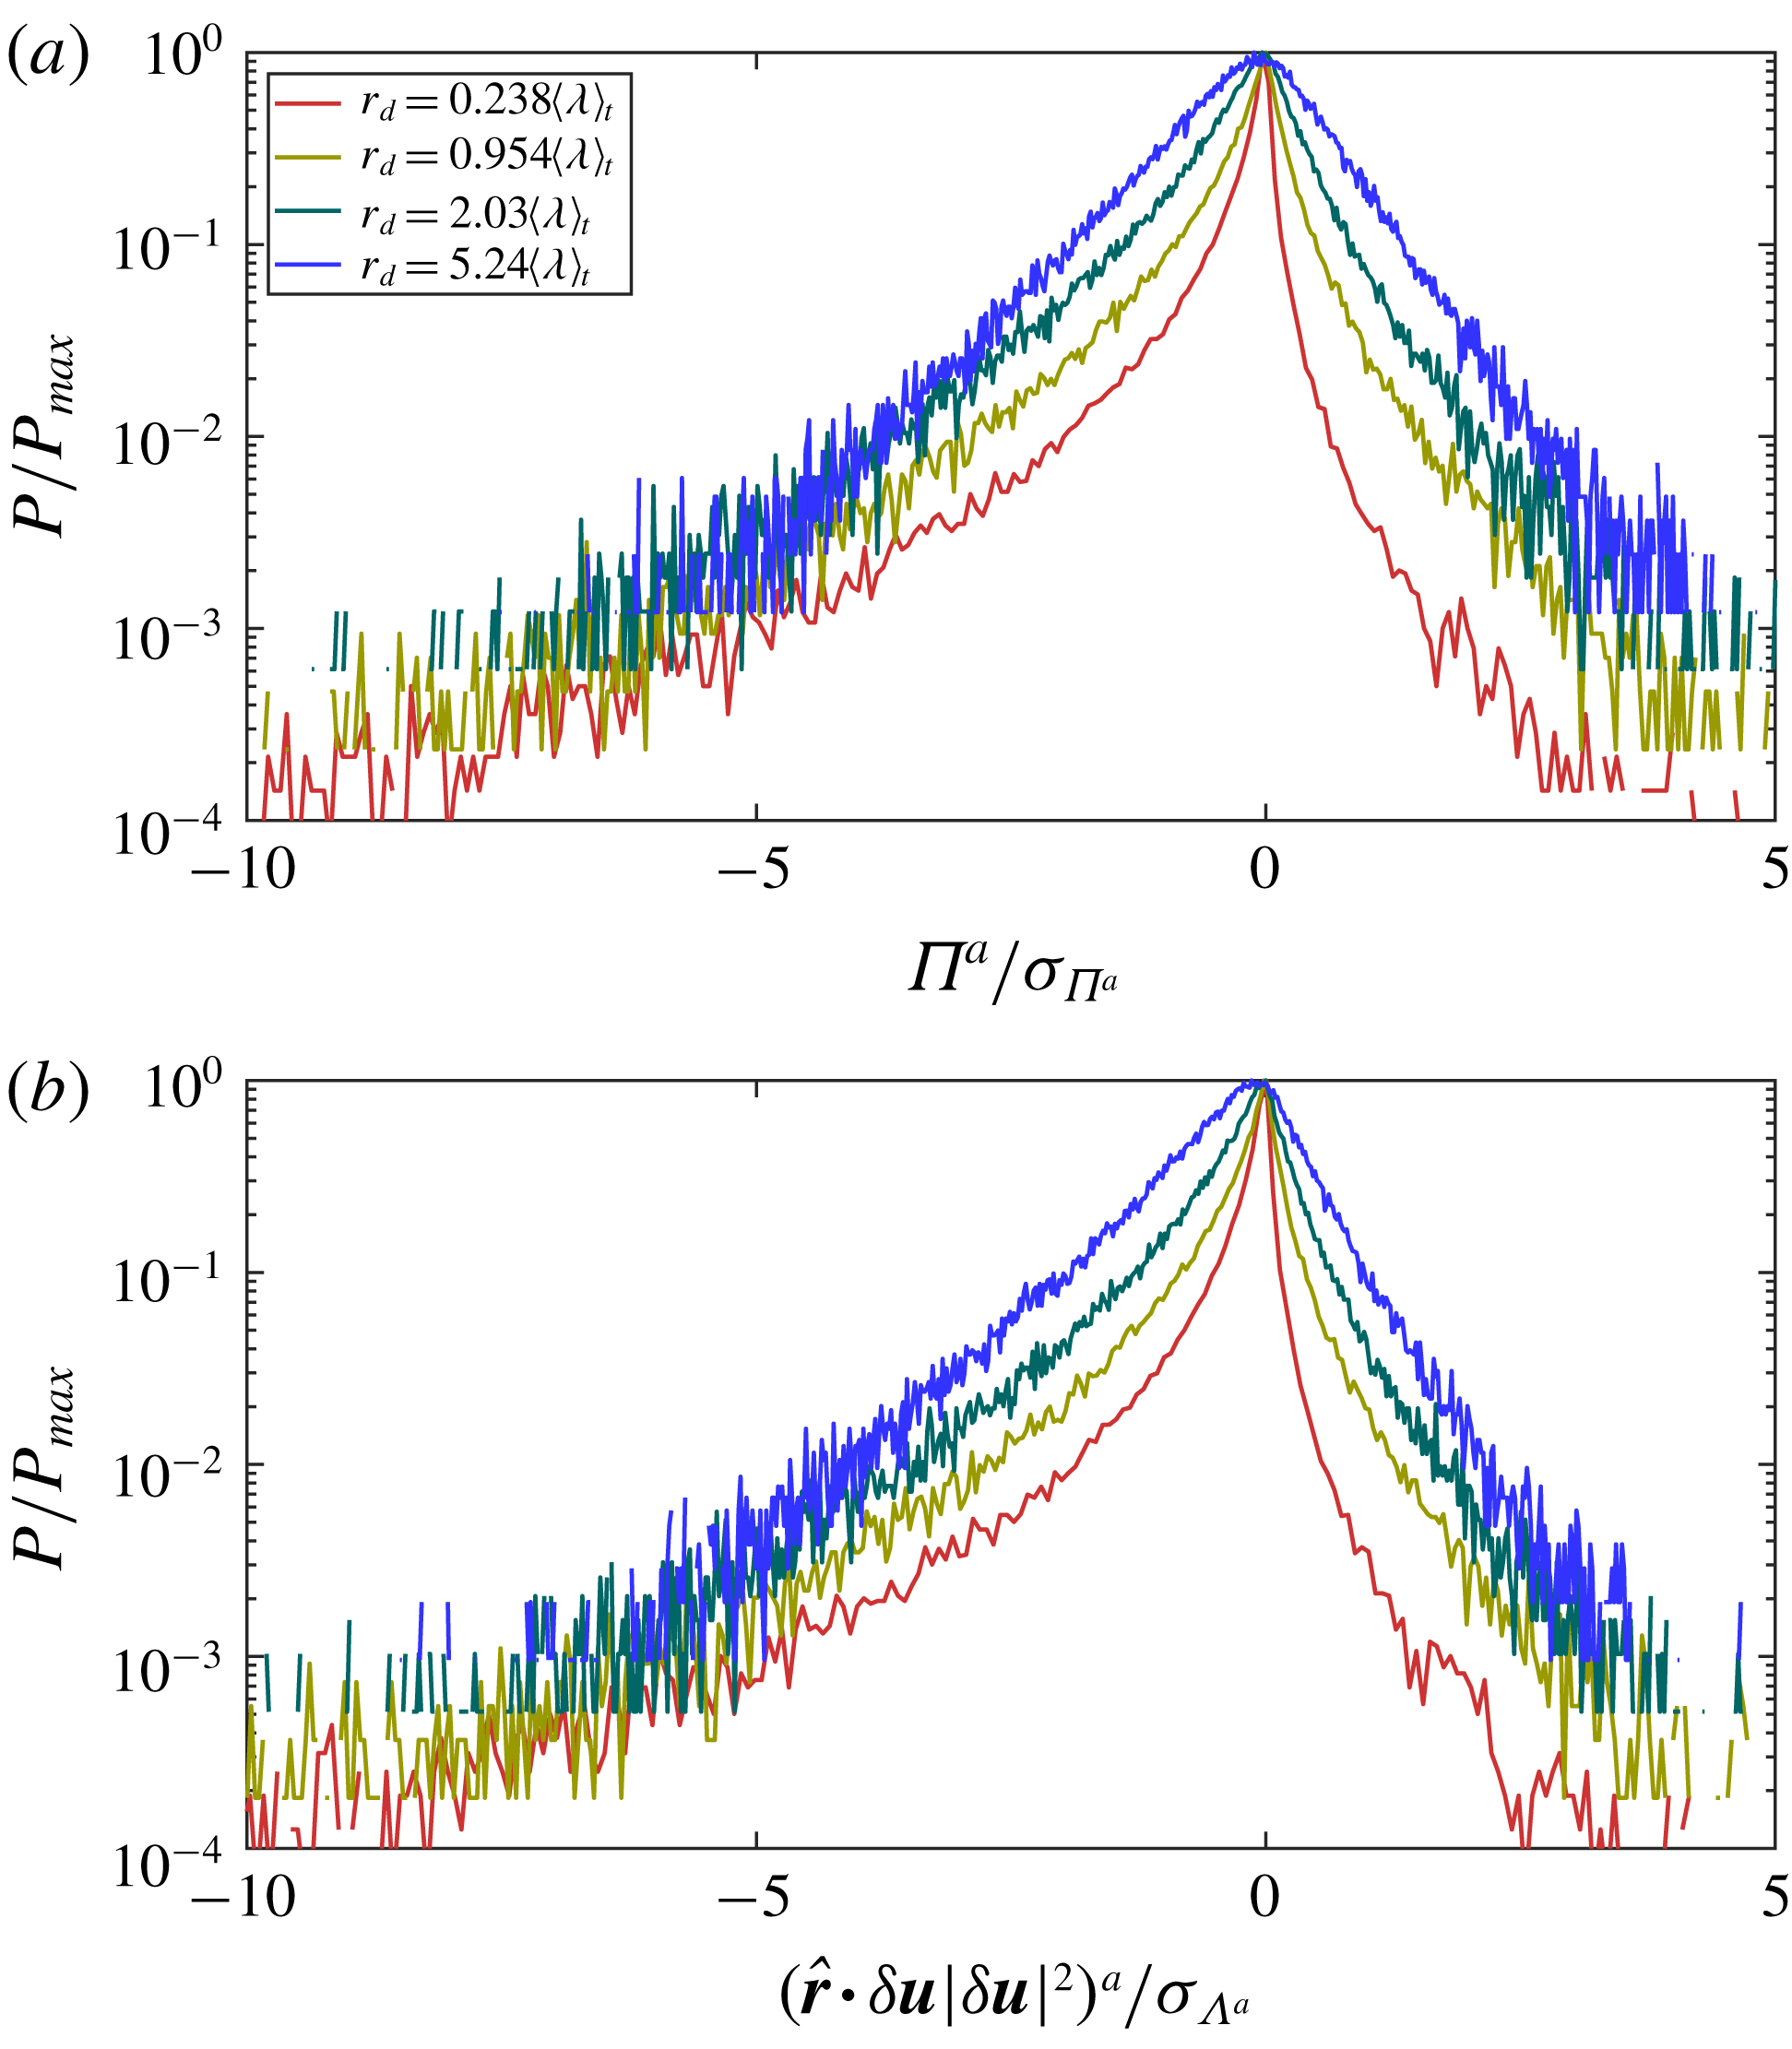
(a) PDFs of
 $\unicode[STIX]{x1D6F1}^{a}$
obtained by sampling through both space and time and plotted versus
 $\unicode[STIX]{x1D6F1}^{a}/\unicode[STIX]{x1D70E}_{\unicode[STIX]{x1D6F1}^{a}}$
where
 $\unicode[STIX]{x1D6F1}^{a}(r_{d})\equiv (\unicode[STIX]{x03C0}r_{d}^{2})^{-1}\iiint _{|\boldsymbol{r}|=r_{d}}\unicode[STIX]{x1D6F1}(\boldsymbol{r})\,\text{d}\boldsymbol{r}$
and
 $\unicode[STIX]{x1D70E}_{\unicode[STIX]{x1D6F1}^{a}}$
is the standard deviation of
 $\unicode[STIX]{x1D6F1}^{a}$
. (b) PDFs of
 $(\hat{\boldsymbol{r}}\boldsymbol{\cdot }\unicode[STIX]{x1D6FF}\boldsymbol{u}|\unicode[STIX]{x1D6FF}\boldsymbol{u}|^{2})^{a}\equiv (\unicode[STIX]{x03C0}r_{d}^{2})^{-1}\iiint _{|\boldsymbol{r}|=r_{d}}\hat{\boldsymbol{r}}\boldsymbol{\cdot }\unicode[STIX]{x1D6FF}\boldsymbol{u}|\unicode[STIX]{x1D6FF}\boldsymbol{u}|^{2}\,\text{d}\boldsymbol{r}$
obtained by sampling through both space and time and plotted versus
 $(\hat{\boldsymbol{r}}\boldsymbol{\cdot }\unicode[STIX]{x1D6FF}\boldsymbol{u}|\unicode[STIX]{x1D6FF}\boldsymbol{u}|^{2})^{a}/\unicode[STIX]{x1D70E}_{\unicode[STIX]{x1D6EC}^{a}}$
where
 $\unicode[STIX]{x1D70E}_{\unicode[STIX]{x1D6EC}^{a}}$
is the standard deviation of
 $(\hat{\boldsymbol{r}}\boldsymbol{\cdot }\unicode[STIX]{x1D6FF}\boldsymbol{u}|\unicode[STIX]{x1D6FF}\boldsymbol{u}|^{2})^{a}$
.
 $\langle Re_{\unicode[STIX]{x1D706}}\rangle _{t}=178$
but the plots are similar for
 $\langle Re_{\unicode[STIX]{x1D706}}\rangle _{t}=80.9$
. Red, yellow, green and blue lines correspond to
 $r_{d}=0.238\langle \unicode[STIX]{x1D706}\rangle _{t}$
,
 $0.954\langle \unicode[STIX]{x1D706}\rangle _{t}$
,
 $2.03\langle \unicode[STIX]{x1D706}\rangle _{t}$
and
 $5.24\langle \unicode[STIX]{x1D706}\rangle _{t}$
, where
 $\unicode[STIX]{x1D706}$
is the Taylor micro-scale and
 $\langle \cdot \rangle _{t}$
denotes a long-term average.

We now use our DNS to illustrate the average scale-by-scale energy budget (2.2). As this budget holds for arbitrary separation vector
 $\boldsymbol{r}$
, we calculate surface averages over spheres of diameter
 $r_{d}$
in
 $\boldsymbol{r}$
-space and define
 $Q^{a}(r_{d})\equiv (\unicode[STIX]{x03C0}r_{d}^{2})^{-1}\iiint _{|\boldsymbol{r}|=r_{d}}Q(\boldsymbol{r})\,\text{d}\boldsymbol{r}$
for any term
 $Q$
in (2.1). In figure 2 we plot all the spatio-temporal average terms
 $\langle Q^{a}\rangle (r_{d})$
normalised by
 $\langle 4\unicode[STIX]{x1D716}^{\ast a}\rangle$
as functions of
 $r_{d}/\langle \unicode[STIX]{x1D706}\rangle _{t}$
, where
 $\langle \unicode[STIX]{x1D706}\rangle _{t}$
is the time-average Taylor micro-scale. The only non-zero terms are indeed those present in the average balance (2.2). We recover the kinematic constraints (i)
 $\langle {\mathcal{D}}_{\unicode[STIX]{x1D708}}^{a}\rangle =\langle \unicode[STIX]{x1D716}^{\ast a}\rangle$
at
 $r_{d}=0$
and (ii) that
 $\langle {\mathcal{D}}_{\unicode[STIX]{x1D708}}^{a}\rangle$
is negligible compared to
 $\langle \unicode[STIX]{x1D716}^{\ast a}\rangle$
for
 $r_{d}$
smaller than the Taylor micro-scale (Valente & Vassilicos Reference Valente and Vassilicos2015). At scales
 $r_{d}$
larger than the Taylor micro-scale,
 $\langle \unicode[STIX]{x1D6F1}^{a}\rangle \approx -\langle \unicode[STIX]{x1D716}^{\ast a}\rangle +\langle {\mathcal{I}}^{a}\rangle$
, see (2.2), and one can see from figure 2 that the direct influence of the large-scale energy input rate diminishes as
 $r_{d}$
decreases below the integral length scale and towards the Taylor micro-scale. One might imagine that, as the Reynolds number increases above the values in the present DNS, the direct influence of the large-scale forcing might disappear in much of the inertial range of scales between
 $\langle \unicode[STIX]{x1D706}\rangle _{t}$
and
 $\langle L\rangle _{t}$
leading to
 $\langle \unicode[STIX]{x1D6F1}^{a}\rangle \approx -\langle \unicode[STIX]{x1D716}^{\ast a}\rangle$
in much of that range. This approximate equality encapsulates the Kolmogorov equilibrium cascade. This is an average cascade where the turbulent energy cascades from large to small inertial scales at constant rate approximately equal to the dissipation rate.
This average picture is punctuated by the known fact (Piomelli et al.
Reference Piomelli, Cabot, Moin and Lee1991; Domaradzki et al.
Reference Domaradzki, Liu and Brachet1993; Cerutti & Meneveau Reference Cerutti and Meneveau1998; Aoyama et al.
Reference Aoyama, Ishihara, Kaneda, Yokokawa, Itakura and Uno2005; Goto Reference Goto2008; Ishihara et al.
Reference Ishihara, Gotoh and Kaneda2009) that the interscale energy transfer rate
 $\unicode[STIX]{x1D6F1}$
is highly intermittent, as indeed confirmed by our DNS. In figure 3 we plot the PDFs (probability density functions) of
 $\unicode[STIX]{x1D6F1}^{a}$
and of
 $(\hat{\boldsymbol{r}}\boldsymbol{\cdot }\unicode[STIX]{x1D6FF}\boldsymbol{u}|\unicode[STIX]{x1D6FF}\boldsymbol{u}|^{2})^{a}$
for two length scales
 $r_{d}$
in the approximately inertial range of our simulation,
 $r_{d}/\langle \unicode[STIX]{x1D706}\rangle _{t}\approx 2$
and
 $5$
, and two length scales
 $r_{d}$
in the dissipation range at and below
 $\langle \unicode[STIX]{x1D706}\rangle _{t}$
. Figure 3(a) is qualitatively similar to figure 6 in Ishihara et al. (Reference Ishihara, Gotoh and Kaneda2009) and, along with figure 3(b), reveals very clearly the highly intermittent and non-Gaussian nature of
 $\unicode[STIX]{x1D6F1}^{a}$
and
 $(\hat{\boldsymbol{r}}\boldsymbol{\cdot }\unicode[STIX]{x1D6FF}\boldsymbol{u}|\unicode[STIX]{x1D6FF}\boldsymbol{u}|^{2})^{a}$
given the very heavy tails of their PDFs. The equality between the volume integral
 $\iiint _{|\boldsymbol{r}|\leqslant r_{d}}4\unicode[STIX]{x1D6F1}(\boldsymbol{X},\boldsymbol{r},t)\,\text{d}\boldsymbol{r}$
and the surface integral
 $\iiint _{|\boldsymbol{r}|=r_{d}}\unicode[STIX]{x1D6FF}\boldsymbol{u}\boldsymbol{\cdot }\hat{\boldsymbol{r}}|\unicode[STIX]{x1D6FF}\boldsymbol{u}|^{2}\,\text{d}\boldsymbol{r}$
implies that compression events, where
 $\unicode[STIX]{x1D6FF}\boldsymbol{u}\boldsymbol{\cdot }\hat{\boldsymbol{r}}<0$
, contribute to the forward cascade from large to small scales whereas stretching events, where
 $\unicode[STIX]{x1D6FF}\boldsymbol{u}\boldsymbol{\cdot }\hat{\boldsymbol{r}}>0$
, contribute to backscatter, i.e. from small to large scales. We also found a significant positive correlation between
 $\unicode[STIX]{x1D6F1}^{a}$
and
 $(\hat{\boldsymbol{r}}\boldsymbol{\cdot }\unicode[STIX]{x1D6FF}\boldsymbol{u}|\unicode[STIX]{x1D6FF}\boldsymbol{u}|^{2})^{a}$
; their correlation coefficient (calculated by averaging over both space and time) is close to 1 near
 $r_{d}=0$
and decreases gently with increasing
 $r_{d}$
reaching values approximately equal to 0.9 at
 $r_{d}\approx \langle \unicode[STIX]{x1D706}\rangle _{t}$
and 0.6 at
 $r_{d}\approx \langle L\rangle _{t}$
(for
 $\langle Re_{\unicode[STIX]{x1D706}}\rangle _{t}=178$
). Hence, positive/negative values of
 $\unicode[STIX]{x1D6F1}^{a}$
correlate with forward/backscatter cascade events and figure 3 confirms that backscatter and extreme forward cascade events exist with much higher probability than for a normal distribution. In fact, these rare but powerful forward and inverse cascade events are so very significant that 50 % of the average values
 $\langle \unicode[STIX]{x1D6F1}^{a}\rangle$
and
 $\langle (\hat{\boldsymbol{r}}\boldsymbol{\cdot }\unicode[STIX]{x1D6FF}\boldsymbol{u}|\unicode[STIX]{x1D6FF}\boldsymbol{u}|^{2})^{a}\rangle$
are contributed by events whose probabilities are lower than
 $0.0157P_{max}^{\unicode[STIX]{x1D6F1}}$
and
 $0.0145P_{max}^{\unicode[STIX]{x1D6EC}}$
respectively at
 $r_{d}=0.977\langle \unicode[STIX]{x1D706}\rangle _{t}$
; lower than
 $0.0350P_{max}^{\unicode[STIX]{x1D6F1}}$
and
 $0.0299P_{max}^{\unicode[STIX]{x1D6EC}}$
respectively at
 $r_{d}=2.03\langle \unicode[STIX]{x1D706}\rangle _{t}$
; and lower than
 $0.0801P_{max}^{\unicode[STIX]{x1D6F1}}$
and
 $0.0738P_{max}^{\unicode[STIX]{x1D6EC}}$
respectively at
 $r_{d}=5.24\langle \unicode[STIX]{x1D706}\rangle _{t}$
which is close to
 $\langle L\rangle _{t}$
. These probabilities are given for
 $\langle Re_{\unicode[STIX]{x1D706}}\rangle _{t}=178$
and are even lower than for
 $\langle Re_{\unicode[STIX]{x1D706}}\rangle _{t}=80.9$
(e.g. for
 $\langle Re_{\unicode[STIX]{x1D706}}\rangle _{t}=80.9$
, 50 % of the average value
 $\langle \unicode[STIX]{x1D6F1}^{a}\rangle$
is contributed by events whose probabilities are lower than
 $0.0235P_{max}^{\unicode[STIX]{x1D6F1}}$
if
 $r_{d}=0.977\langle \unicode[STIX]{x1D706}\rangle _{t}$
and lower than
 $0.0467P_{max}^{\unicode[STIX]{x1D6F1}}$
if
 $r_{d}=1.95\langle \unicode[STIX]{x1D706}\rangle _{t}$
).
 $P_{max}^{\unicode[STIX]{x1D6F1}}$
and
 $P_{max}^{\unicode[STIX]{x1D6EC}}$
are the probabilities of the most likely events which are, respectively,
 $\unicode[STIX]{x1D6F1}^{a}=0$
and
 $(\hat{\boldsymbol{r}}\boldsymbol{\cdot }\unicode[STIX]{x1D6FF}\boldsymbol{u}|\unicode[STIX]{x1D6FF}\boldsymbol{u}|^{2})^{a}=0$
, i.e. no interscale energy transfer whatsoever. The asymmetry of the PDFs in figure 3 ensures that
 $\langle \unicode[STIX]{x1D6F1}^{a}\rangle$
is negative on average and that the average picture is therefore one of forward interscale energy transfer. However, this average picture requires extreme events, both forward and backward, to fully emerge. As mentioned in the introduction, the extreme intermittency of
 $\unicode[STIX]{x1D6F1}^{a}$
raises the question of the fluctuations of all the other terms in the KHMH equation, particularly those which average out to zero and could therefore be thought of as unimportant. Having presented and validated our DNS and KHMH approach in this section, we now move to the new results of this paper.
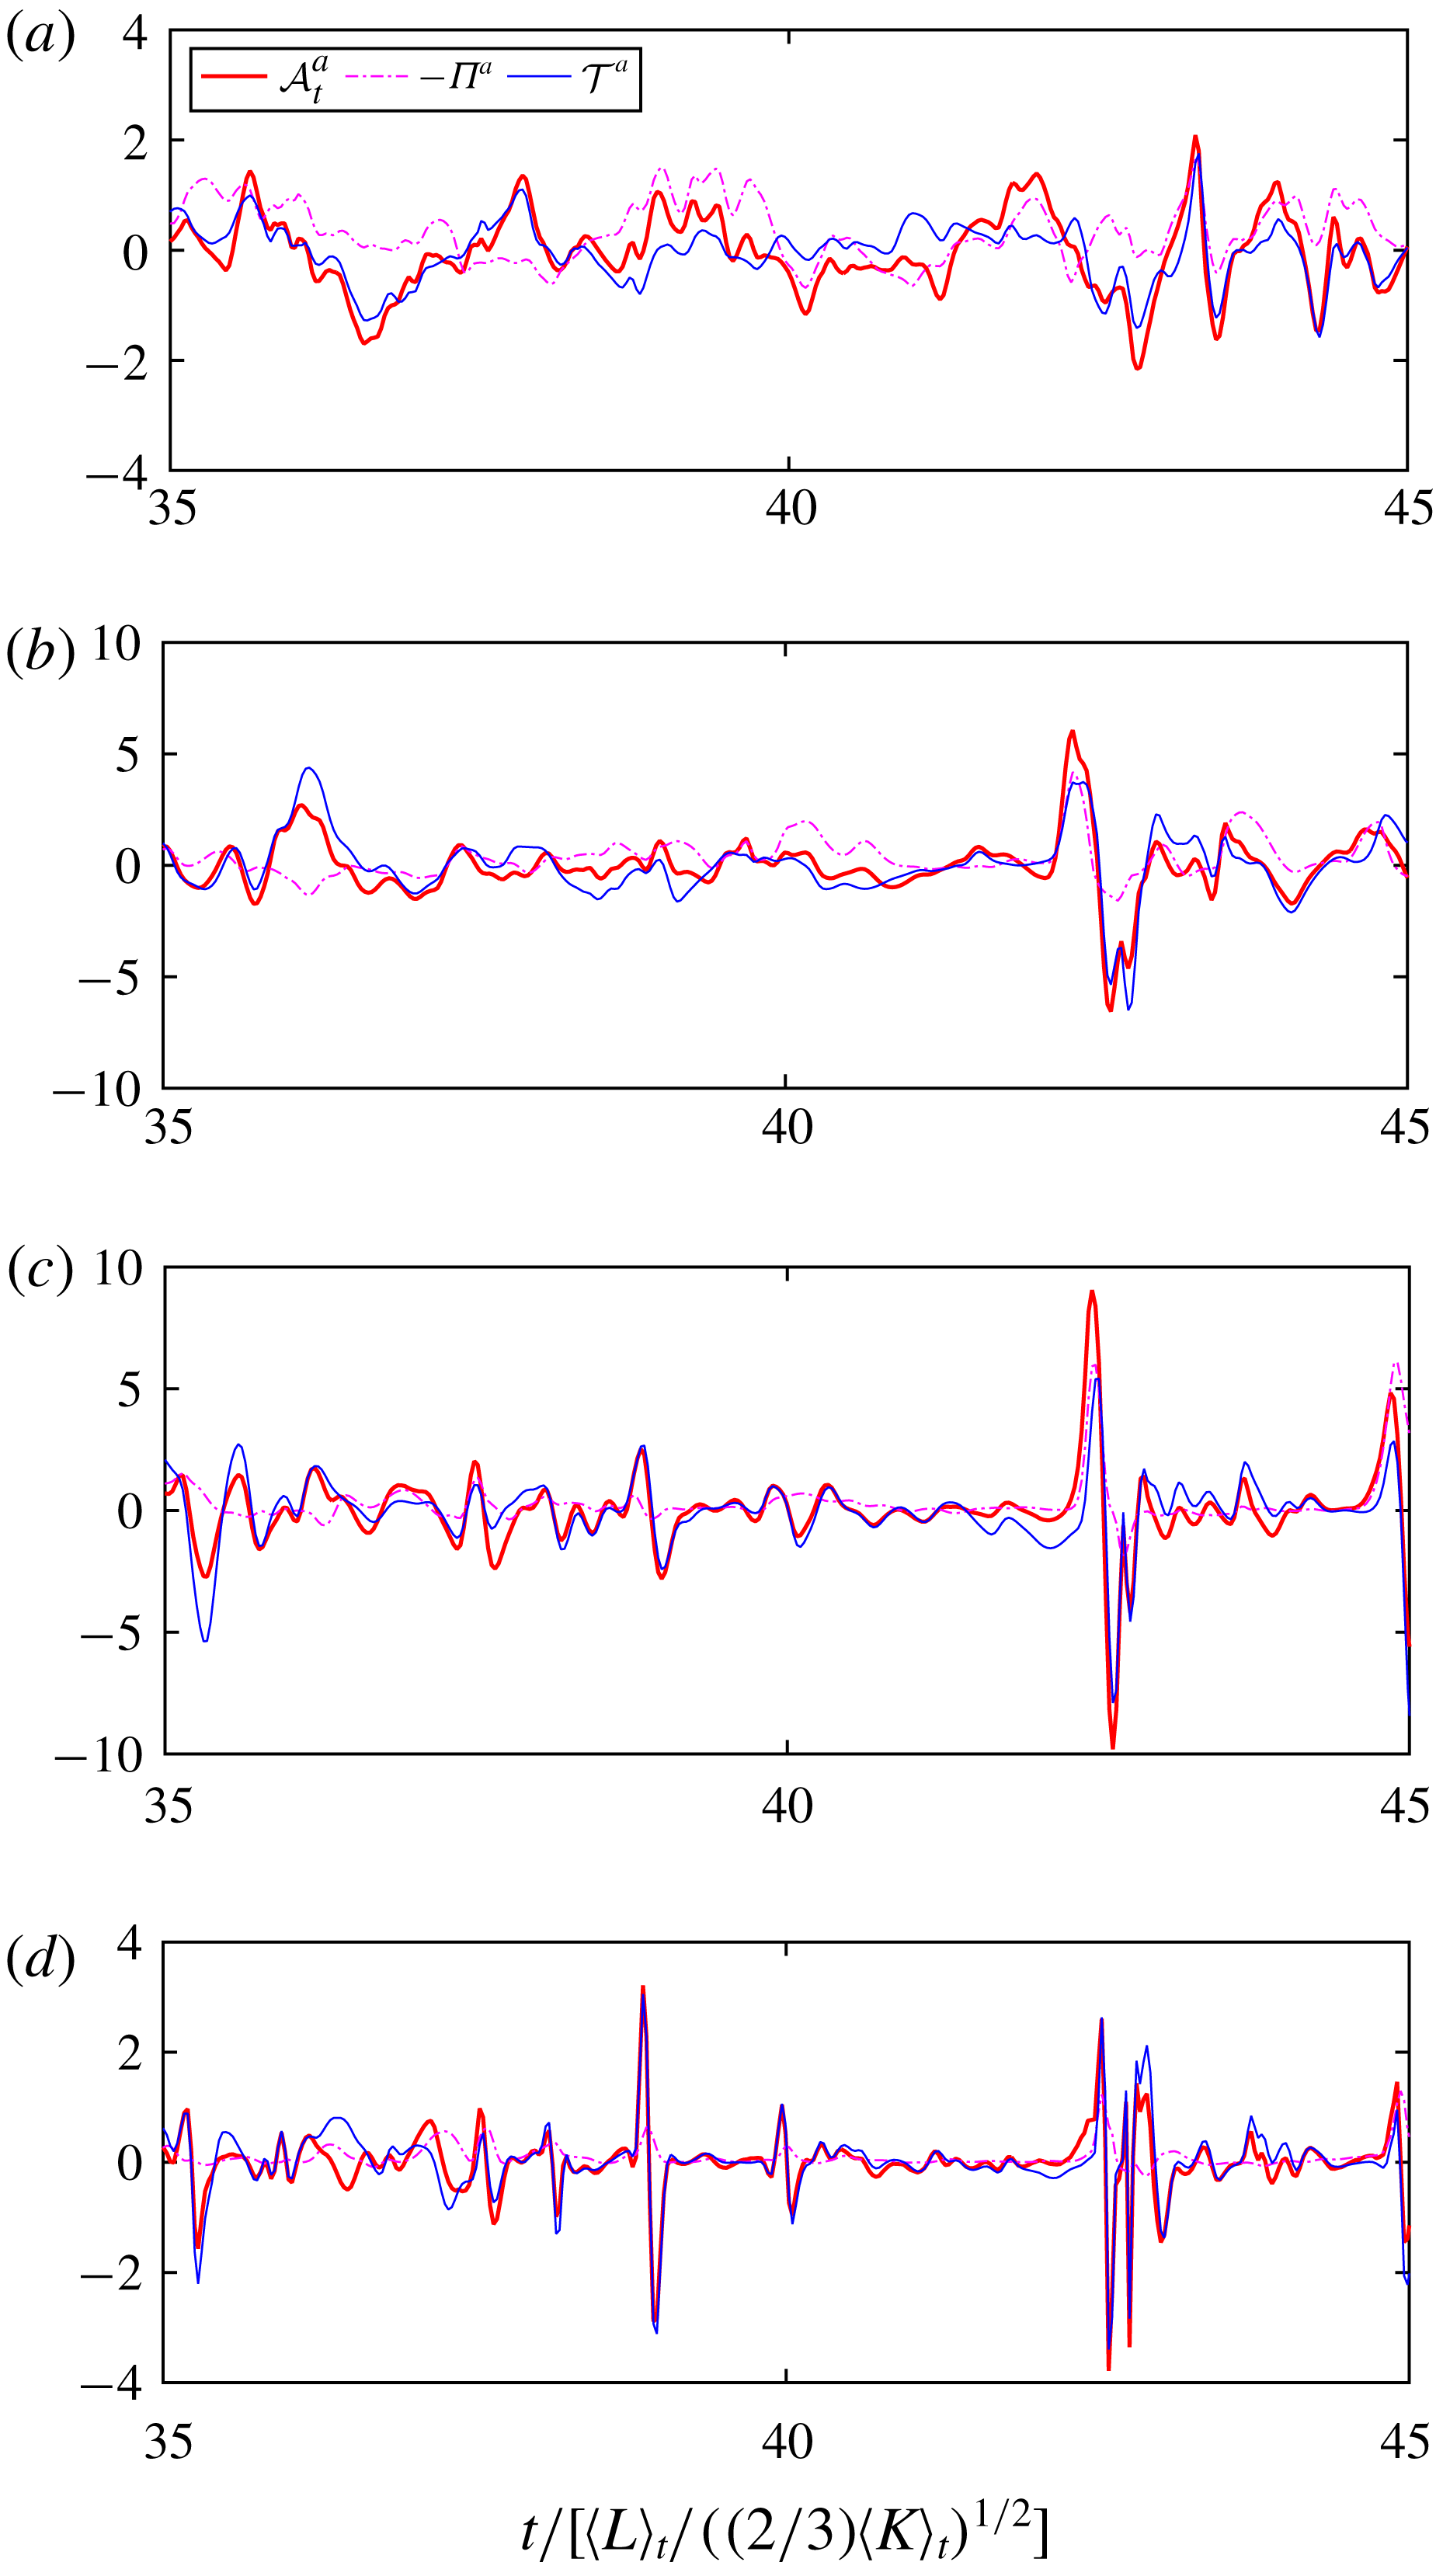
Time evolutions of
 ${\mathcal{A}}_{t}^{a}$
,
 $-\unicode[STIX]{x1D6F1}^{a}$
and
 ${\mathcal{T}}^{a}$
at a random location
 $\boldsymbol{X}$
and four different scales.
 $\langle Re_{\unicode[STIX]{x1D706}}\rangle _{t}=80.9$
. Red, magenta, blue lines represent
 ${\mathcal{A}}_{t}^{a}$
,
 $-\unicode[STIX]{x1D6F1}^{a}$
,
 ${\mathcal{T}}^{a}$
, respectively. (a)
 $r_{d}=3.91\langle \unicode[STIX]{x1D706}\rangle _{t}$
, (b)
 $1.95\langle \unicode[STIX]{x1D706}\rangle _{t}$
, (c)
 $0.977\langle \unicode[STIX]{x1D706}\rangle _{t}$
, (d)
 $0.244\langle \unicode[STIX]{x1D706}\rangle _{t}$
.

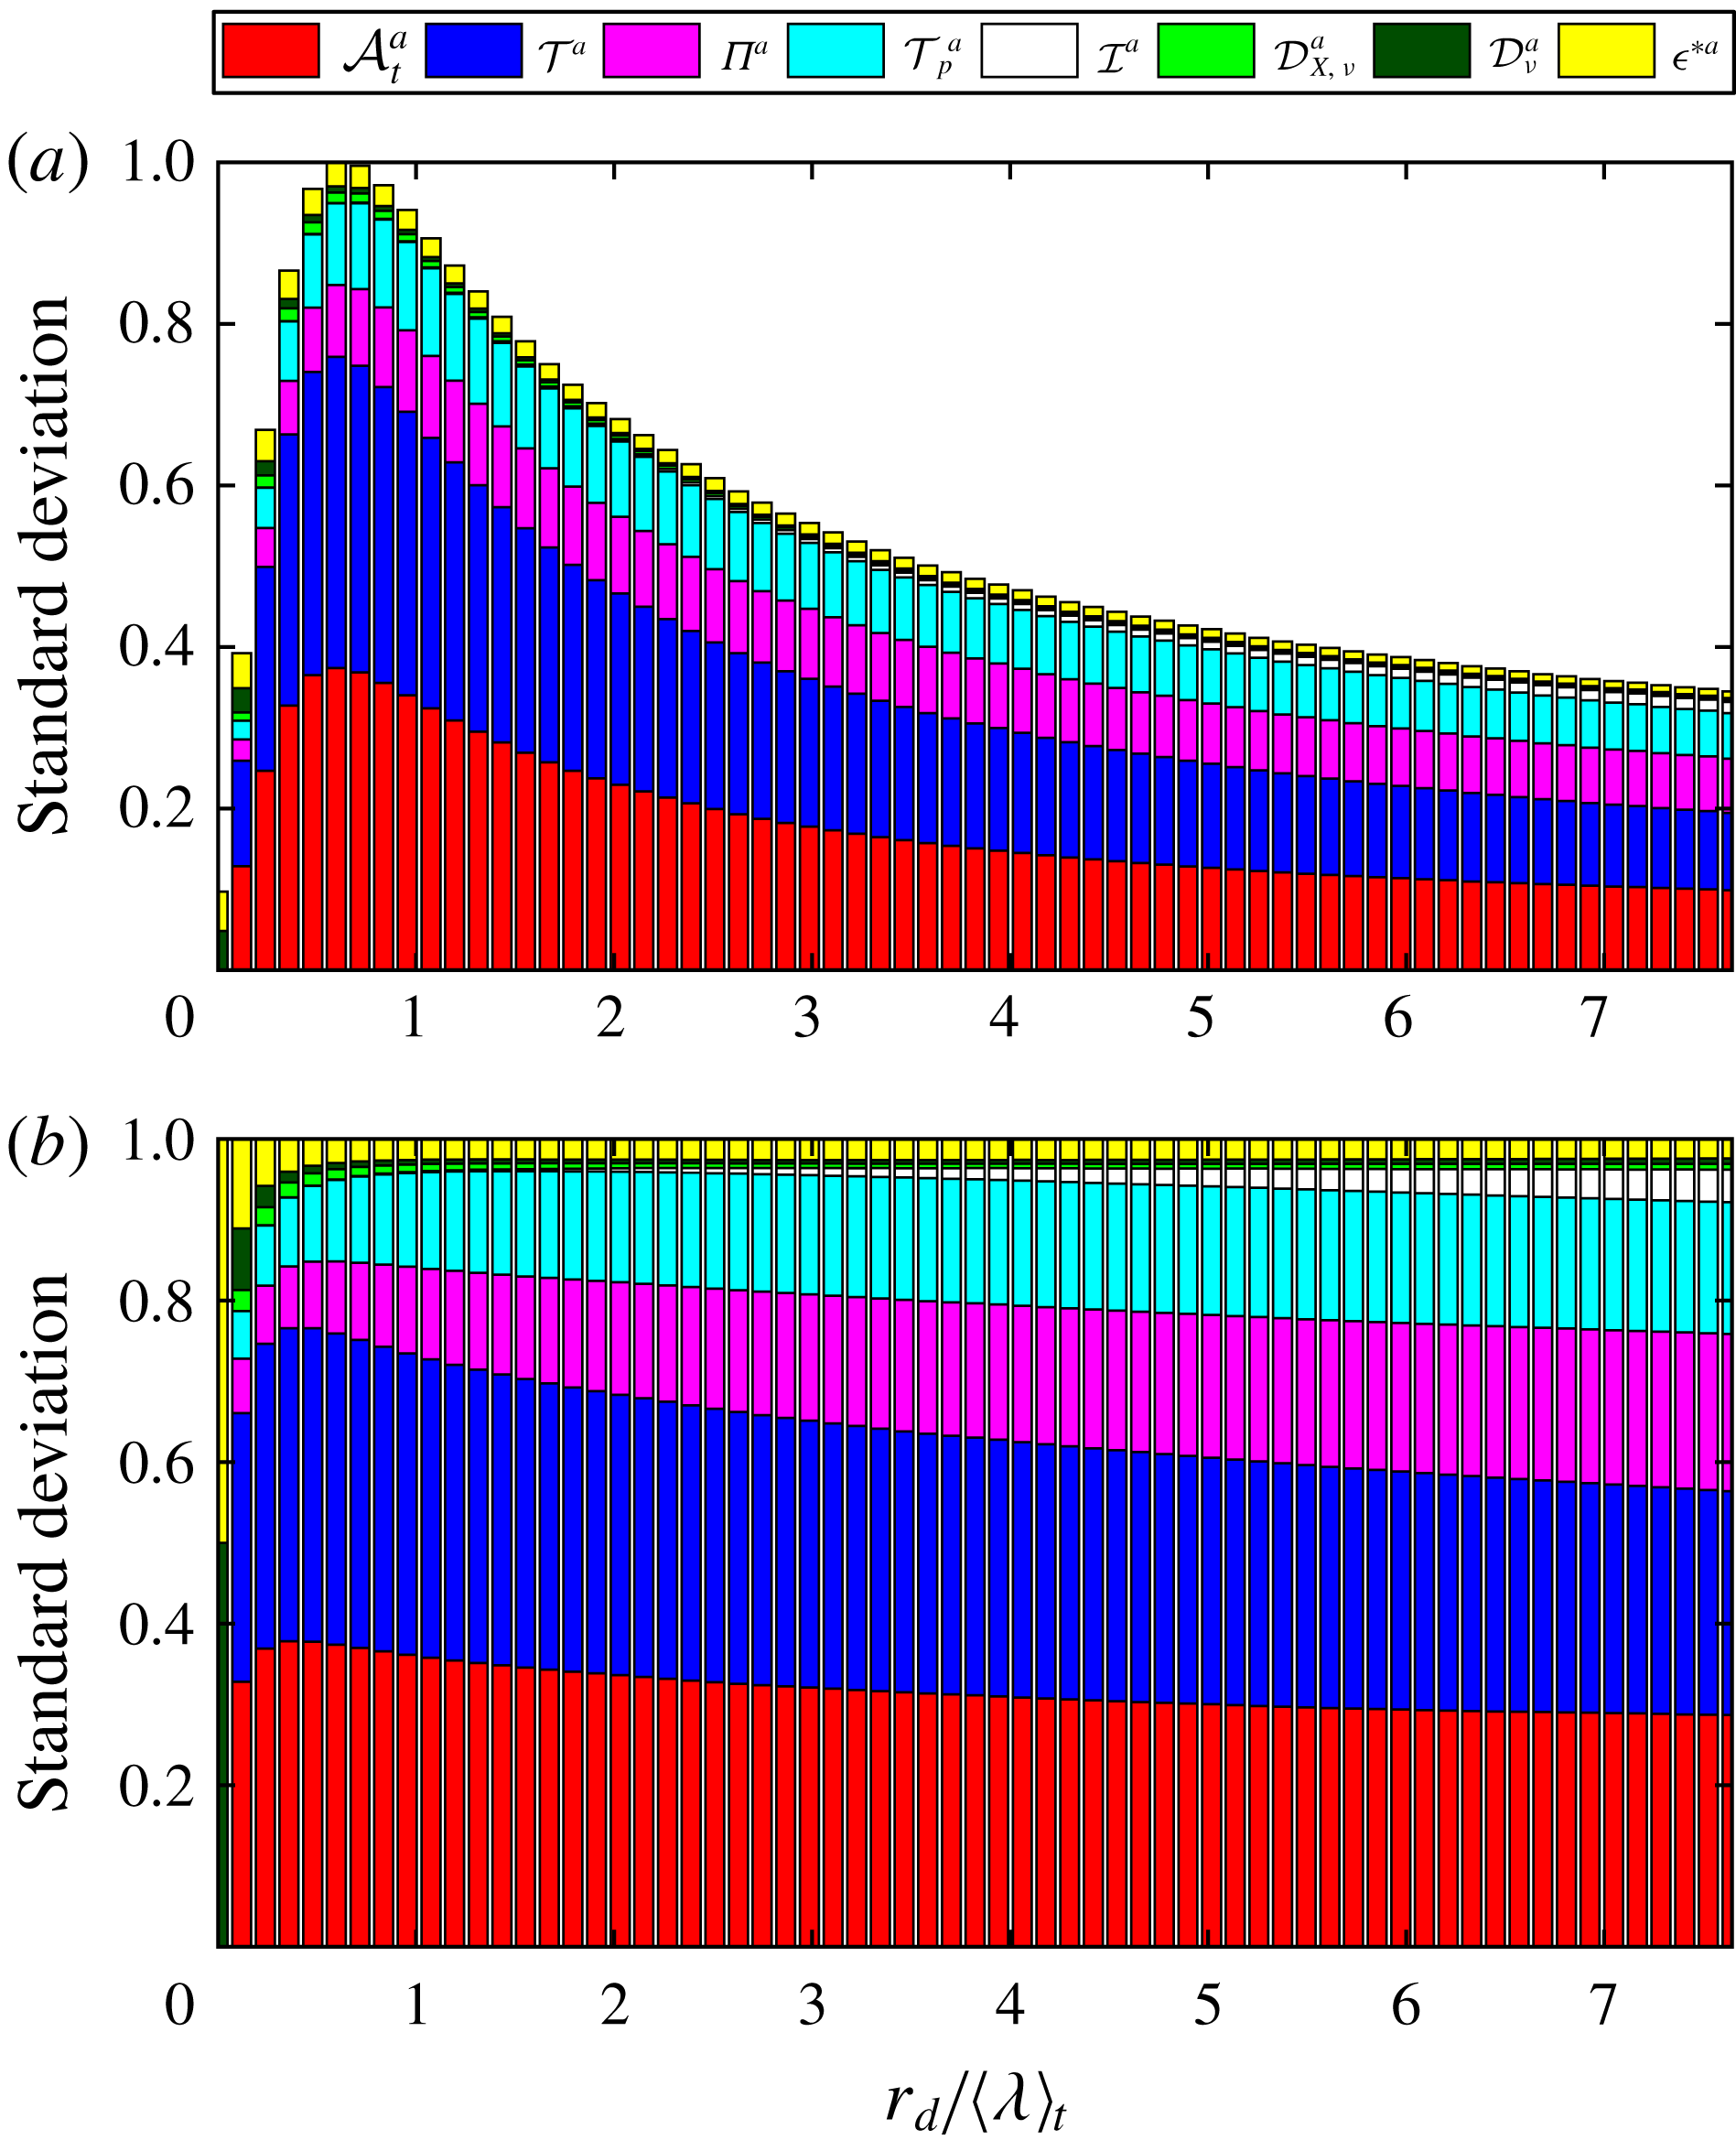
Stacked column chart of standard deviations of KHMH terms as a function of
 $r_{d}/\langle \unicode[STIX]{x1D706}\rangle _{t}$
. Vertical axis is normalised by (a) the total height of the largest stacked column and (b) the total height of each stacked column.
 $\langle Re_{\unicode[STIX]{x1D706}}\rangle _{t}=178$
but similar results are obtained for
 $\langle Re_{\unicode[STIX]{x1D706}}\rangle _{t}=80.9$
.

4 Fluctuating and correlated interscale and interspace energy transfer dynamics
In figure 4 we plot representative examples of time evolutions of some orientation-averaged KHMH terms at a randomly selected location
 $\boldsymbol{X}$
, specifically
 ${\mathcal{A}}_{t}^{a}$
,
 ${\mathcal{T}}^{a}$
and
 $-\unicode[STIX]{x1D6F1}^{a}$
, for four different values of
 $r_{d}$
(
 $r_{d}/\langle \unicode[STIX]{x1D706}\rangle _{t}=3.91,1.95,0.977,0.224$
). We chose to plot only a few of the zero-average KHMH terms for clarity of exposition and we plot them alongside
 $-\unicode[STIX]{x1D6F1}^{a}$
to compare fluctuations. We also chose to show plots in figure 4 which have been obtained for
 $\langle Re_{\unicode[STIX]{x1D706}}\rangle _{t}=80.9$
but very similar plots are also obtained for
 $\langle Re_{\unicode[STIX]{x1D706}}\rangle _{t}=178$
. Plots of the same terms at a randomly selected time
 $t$
but as functions of
 $X_{1}$
,
 $X_{2}$
or
 $X_{3}$
rather than as functions of
 $t$
for a randomly selected
 $\boldsymbol{X}=(X_{1},X_{2},X_{3})$
, look similar to those in figure 4 and lead to the same observations.
At the largest
 $r_{d}$
in figure 4 (which is 1.47
 $\langle L\rangle _{t}$
) the fluctuations of all three quantities are comparable and one can even detect a correlation between them (figure 4
a). With decreasing
 $r_{d}$
, all three signals become increasingly intermittent; all three PDFs exhibit increasingly heavy tails (not all shown here for economy of space) with decreasing
 $r_{d}$
as in figure 3, except that the PDFs of
 ${\mathcal{A}}_{t}^{a}$
and
 ${\mathcal{T}}^{a}$
are symmetric whereas the PDF of
 $-\unicode[STIX]{x1D6F1}^{a}$
is skewed (see figure 3). The fluctuations of
 ${\mathcal{A}}_{t}^{a}$
and
 ${\mathcal{T}}^{a}$
grow in magnitude with decreasing
 $r_{d}$
whereas those of
 $-\unicode[STIX]{x1D6F1}^{a}$
do not so significantly. Furthermore, the correlation between
 ${\mathcal{A}}_{t}^{a}$
and
 ${\mathcal{T}}^{a}$
strengthens whereas the correlation of
 $-\unicode[STIX]{x1D6F1}^{a}$
with the other two signals weakens.
The observations concerning fluctuation magnitudes are quantified in terms of standard deviations of all orientation-averaged KHMH terms, namely the standard deviations of
 ${\mathcal{A}}_{t}^{a}$
,
 ${\mathcal{T}}^{a}$
,
 $\unicode[STIX]{x1D6F1}^{a}$
,
 ${\mathcal{T}}_{p}^{a}$
,
 ${\mathcal{I}}^{a}$
,
 ${\mathcal{D}}_{X,\unicode[STIX]{x1D708}}^{a}$
,
 ${\mathcal{D}}_{\unicode[STIX]{x1D708}}^{a}$
and
 $\unicode[STIX]{x1D716}^{\ast a}$
. These standard deviations are calculated by averaging over position
 $\boldsymbol{X}$
and time
 $t$
and are presented in two stacked column charts in figure 5 for
 $r_{d}/\langle \unicode[STIX]{x1D706}\rangle _{t}$
between
 $0$
and
 $7.65$
for the
 $\langle Re_{\unicode[STIX]{x1D706}}\rangle _{t}=178$
case. In figure 5(a) the standard deviations are normalised by the sum of all standard deviations at the value of
 $r_{d}/\langle \unicode[STIX]{x1D706}\rangle _{t}$
where this sum is maximal. This shows that all fluctuations increase with decreasing
 $r_{d}$
and reach their most intense level at
 $r_{d}/\langle \unicode[STIX]{x1D706}\rangle _{t}\approx 1$
, the value of
 $r_{d}$
where
 $-\langle \unicode[STIX]{x1D6F1}^{a}\rangle$
is maximal (see figure 2). In figure 5(b) the standard deviations at a given
 $r_{d}$
are normalised by the sum of all standard deviations at that
 $r_{d}$
. This makes it clear that at any given scale
 $r_{d}$
the most intense fluctuations are those of
 ${\mathcal{A}}_{t}^{a}$
and
 ${\mathcal{T}}^{a}$
followed closely by the fluctuations of
 $\unicode[STIX]{x1D6F1}^{a}$
and
 ${\mathcal{T}}_{p}^{a}$
. These fluctuations are much more intense than those of
 ${\mathcal{I}}^{a}$
,
 ${\mathcal{D}}_{X,\unicode[STIX]{x1D708}}^{a}$
,
 ${\mathcal{D}}_{\unicode[STIX]{x1D708}}^{a}$
and
 $\unicode[STIX]{x1D716}^{\ast a}$
except in the deep dissipation range where the fluctuations of
 ${\mathcal{D}}_{\unicode[STIX]{x1D708}}^{a}$
and
 $\unicode[STIX]{x1D716}^{\ast a}$
increase in relative terms. All these observations are the same for
 $\langle Re_{\unicode[STIX]{x1D706}}\rangle _{t}=80.9$
with the additional observation that the fluctuations of
 ${\mathcal{A}}_{t}^{a}$
and
 ${\mathcal{T}}^{a}$
are appreciably more intense relative to the other KHMH terms at
 $\langle Re_{\unicode[STIX]{x1D706}}\rangle _{t}=178$
than at
 $\langle Re_{\unicode[STIX]{x1D706}}\rangle _{t}=80.9$
.
4.1 Correlations between different fluctuations
Having found that the fluctuating and intermittent nature of the scale-by-scale energy budget is not limited to the interscale energy transfer rate but that the pressure–velocity term is equally fluctuating and the time derivative and turbulent transport terms are fluctuating even more intensely, we now move to the correlations between different fluctuating terms which we detected qualitatively in figure 4.
To quantify correlations between pairs of fluctuating terms
 $Q_{1}$
and
 $Q_{2}$
in the KHMH equation, we use the correlation coefficient
 $\text{corr}(Q_{1},Q_{2})=\langle (Q_{1}-\langle Q_{1}\rangle _{all})(Q_{2}-\langle Q_{2}\rangle _{all})\rangle _{all}/(\unicode[STIX]{x1D70E}_{Q_{1}}\unicode[STIX]{x1D70E}_{Q_{2}})$
where the averages
 $\langle \cdot \rangle _{all}$
and the standard deviations
 $\unicode[STIX]{x1D70E}_{Q_{1}}$
of
 $Q_{1}$
and
 $\unicode[STIX]{x1D70E}_{Q_{2}}$
of
 $Q_{2}$
are calculated by sampling over space
 $\boldsymbol{X}$
, time
 $t$
and all orientations
 $\hat{\boldsymbol{r}}$
for a given
 $r_{d}$
such that
 $\boldsymbol{r}=r_{d}\hat{\boldsymbol{r}}$
. We plot these correlation coefficients in figure 6 as functions of
 $r_{d}$
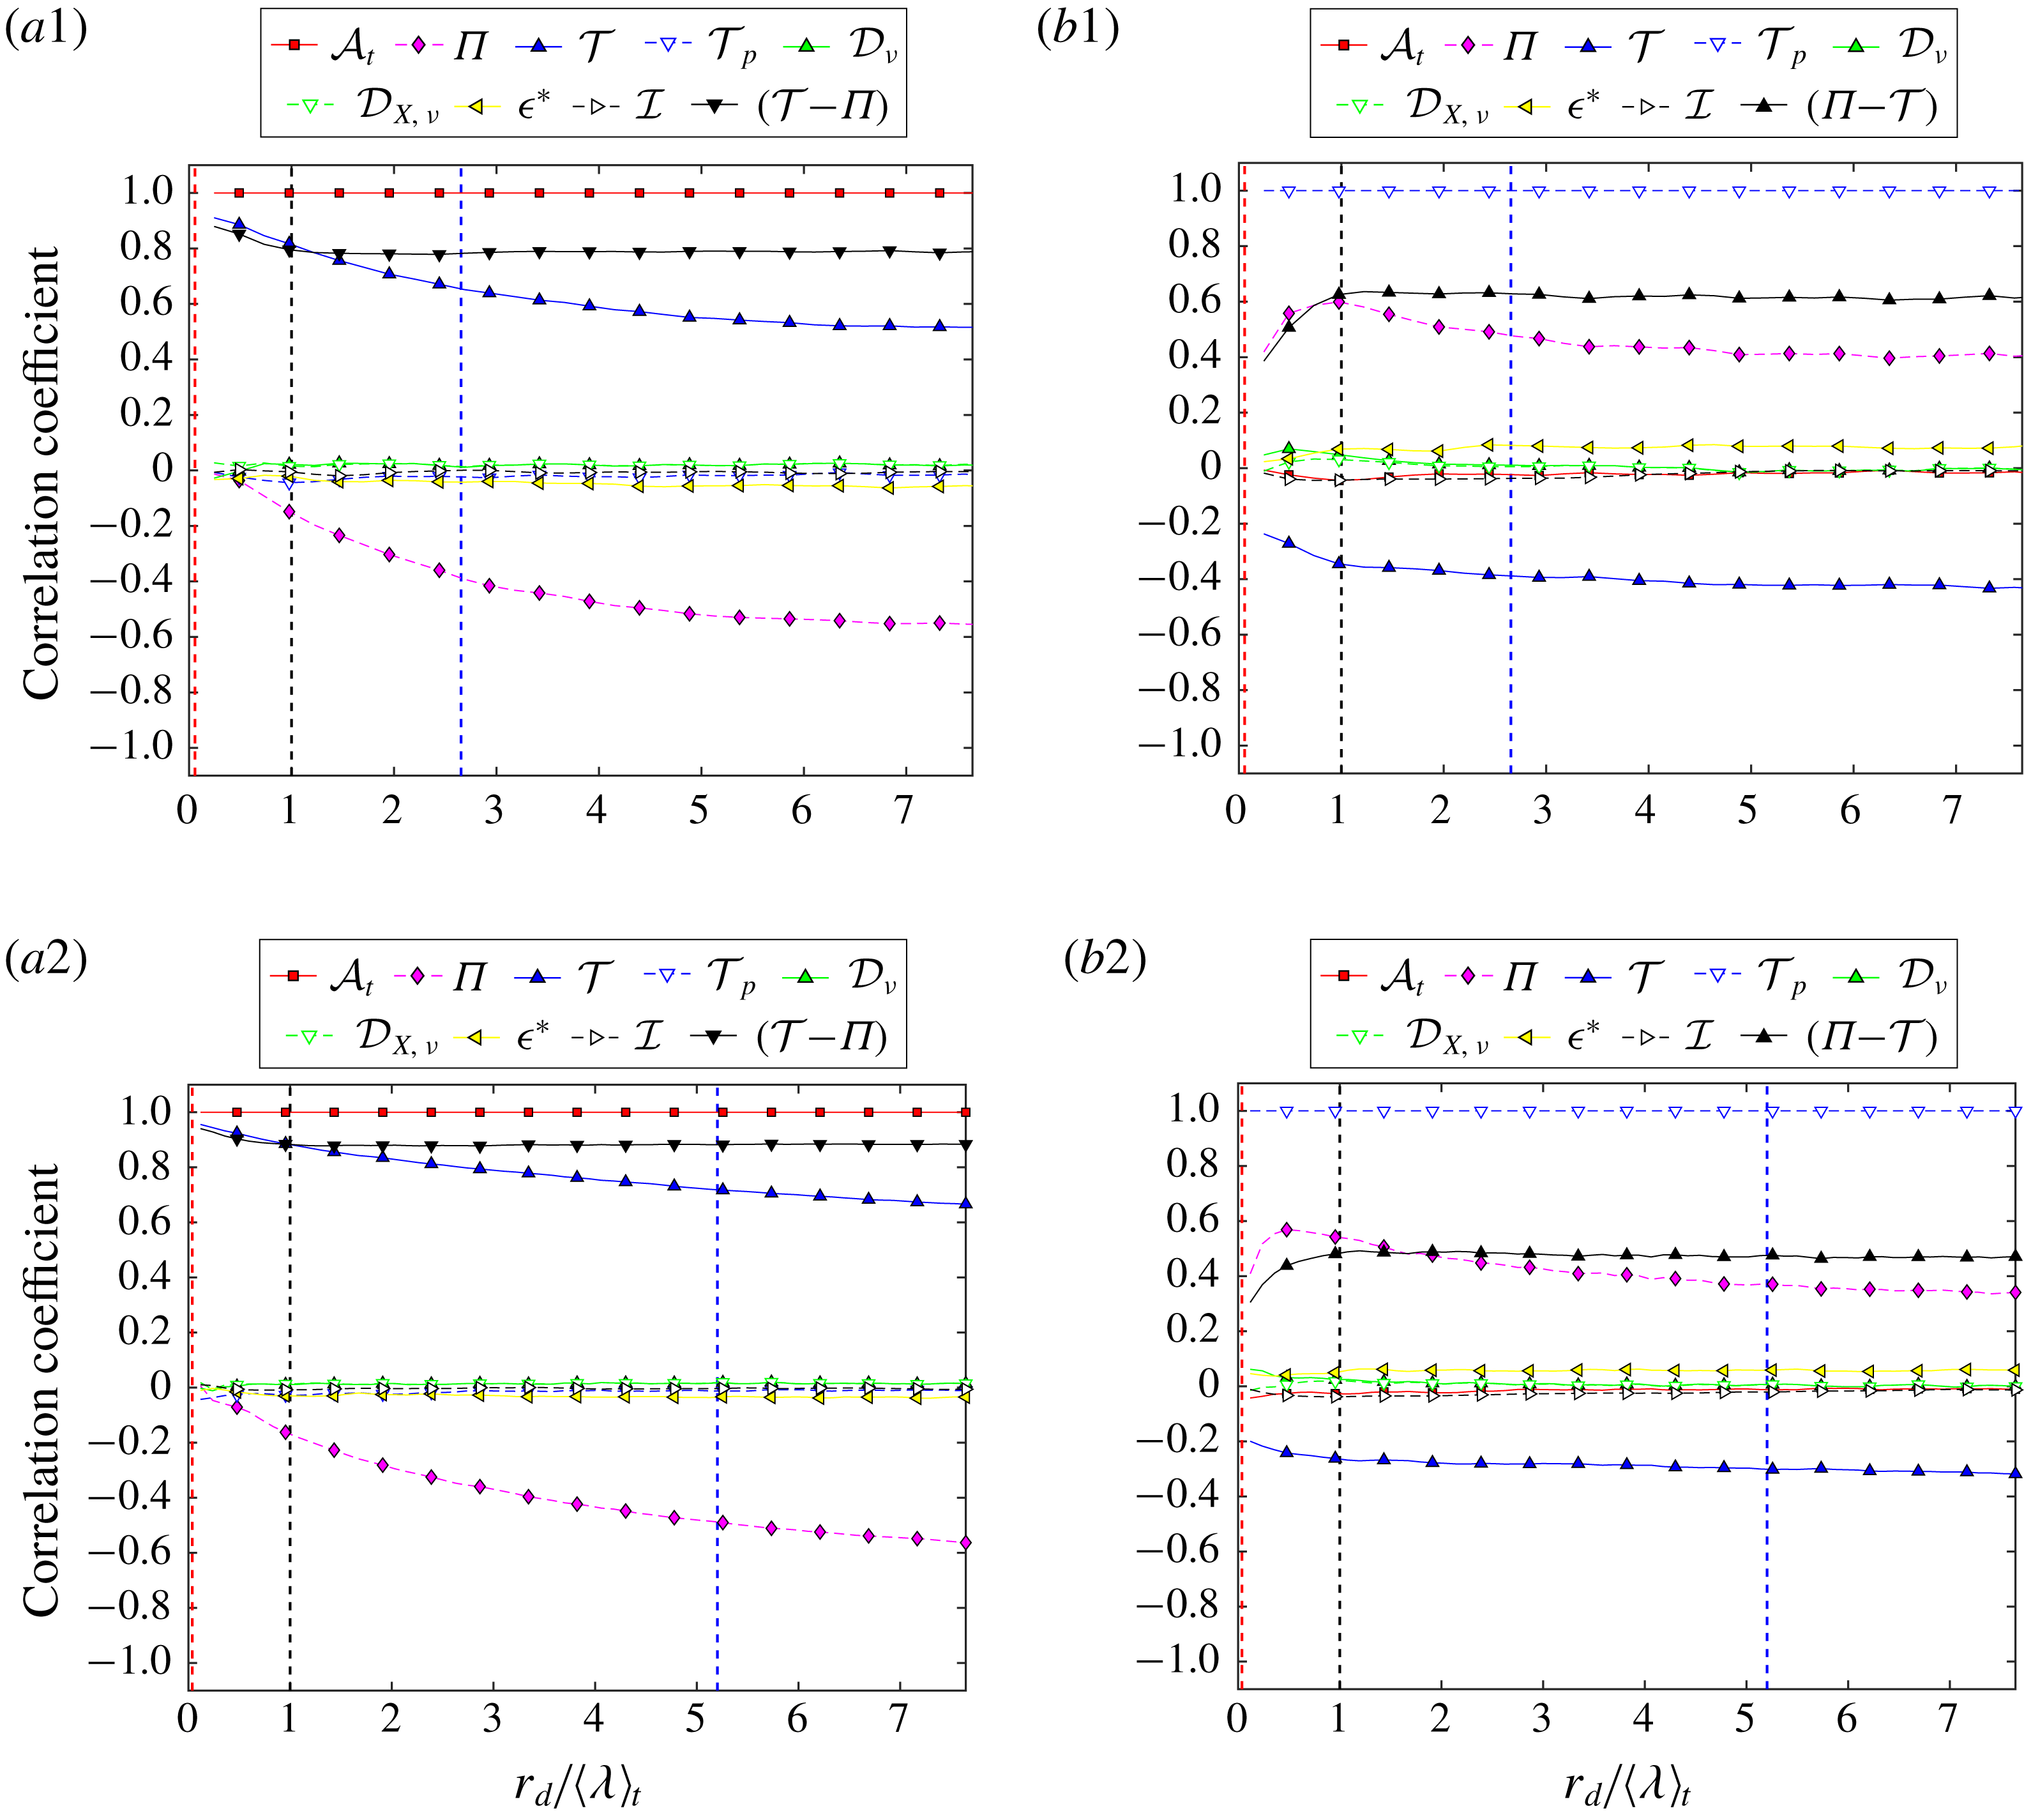
. The most notable correlations at length scales
 $r_{d}$
larger than
 $\langle \unicode[STIX]{x1D706}\rangle _{t}$
are between:
(i)
$Q_{1}={\mathcal{A}}_{t}$
and
$Q_{2}={\mathcal{T}}-\unicode[STIX]{x1D6F1}$
;
$Q_{1}={\mathcal{A}}_{t}$
and
$Q_{2}={\mathcal{T}}$
;
$Q_{1}={\mathcal{A}}_{t}$
and
$Q_{2}=-\unicode[STIX]{x1D6F1}$
;(ii)
$Q_{1}={\mathcal{T}}_{p}$
and
$Q_{2}=\unicode[STIX]{x1D6F1}-{\mathcal{T}}$
;
$Q_{1}={\mathcal{T}}_{p}$
and
$Q_{2}=\unicode[STIX]{x1D6F1}$
;
$Q_{1}={\mathcal{T}}_{p}$
and
$Q_{2}=-{\mathcal{T}}$
.


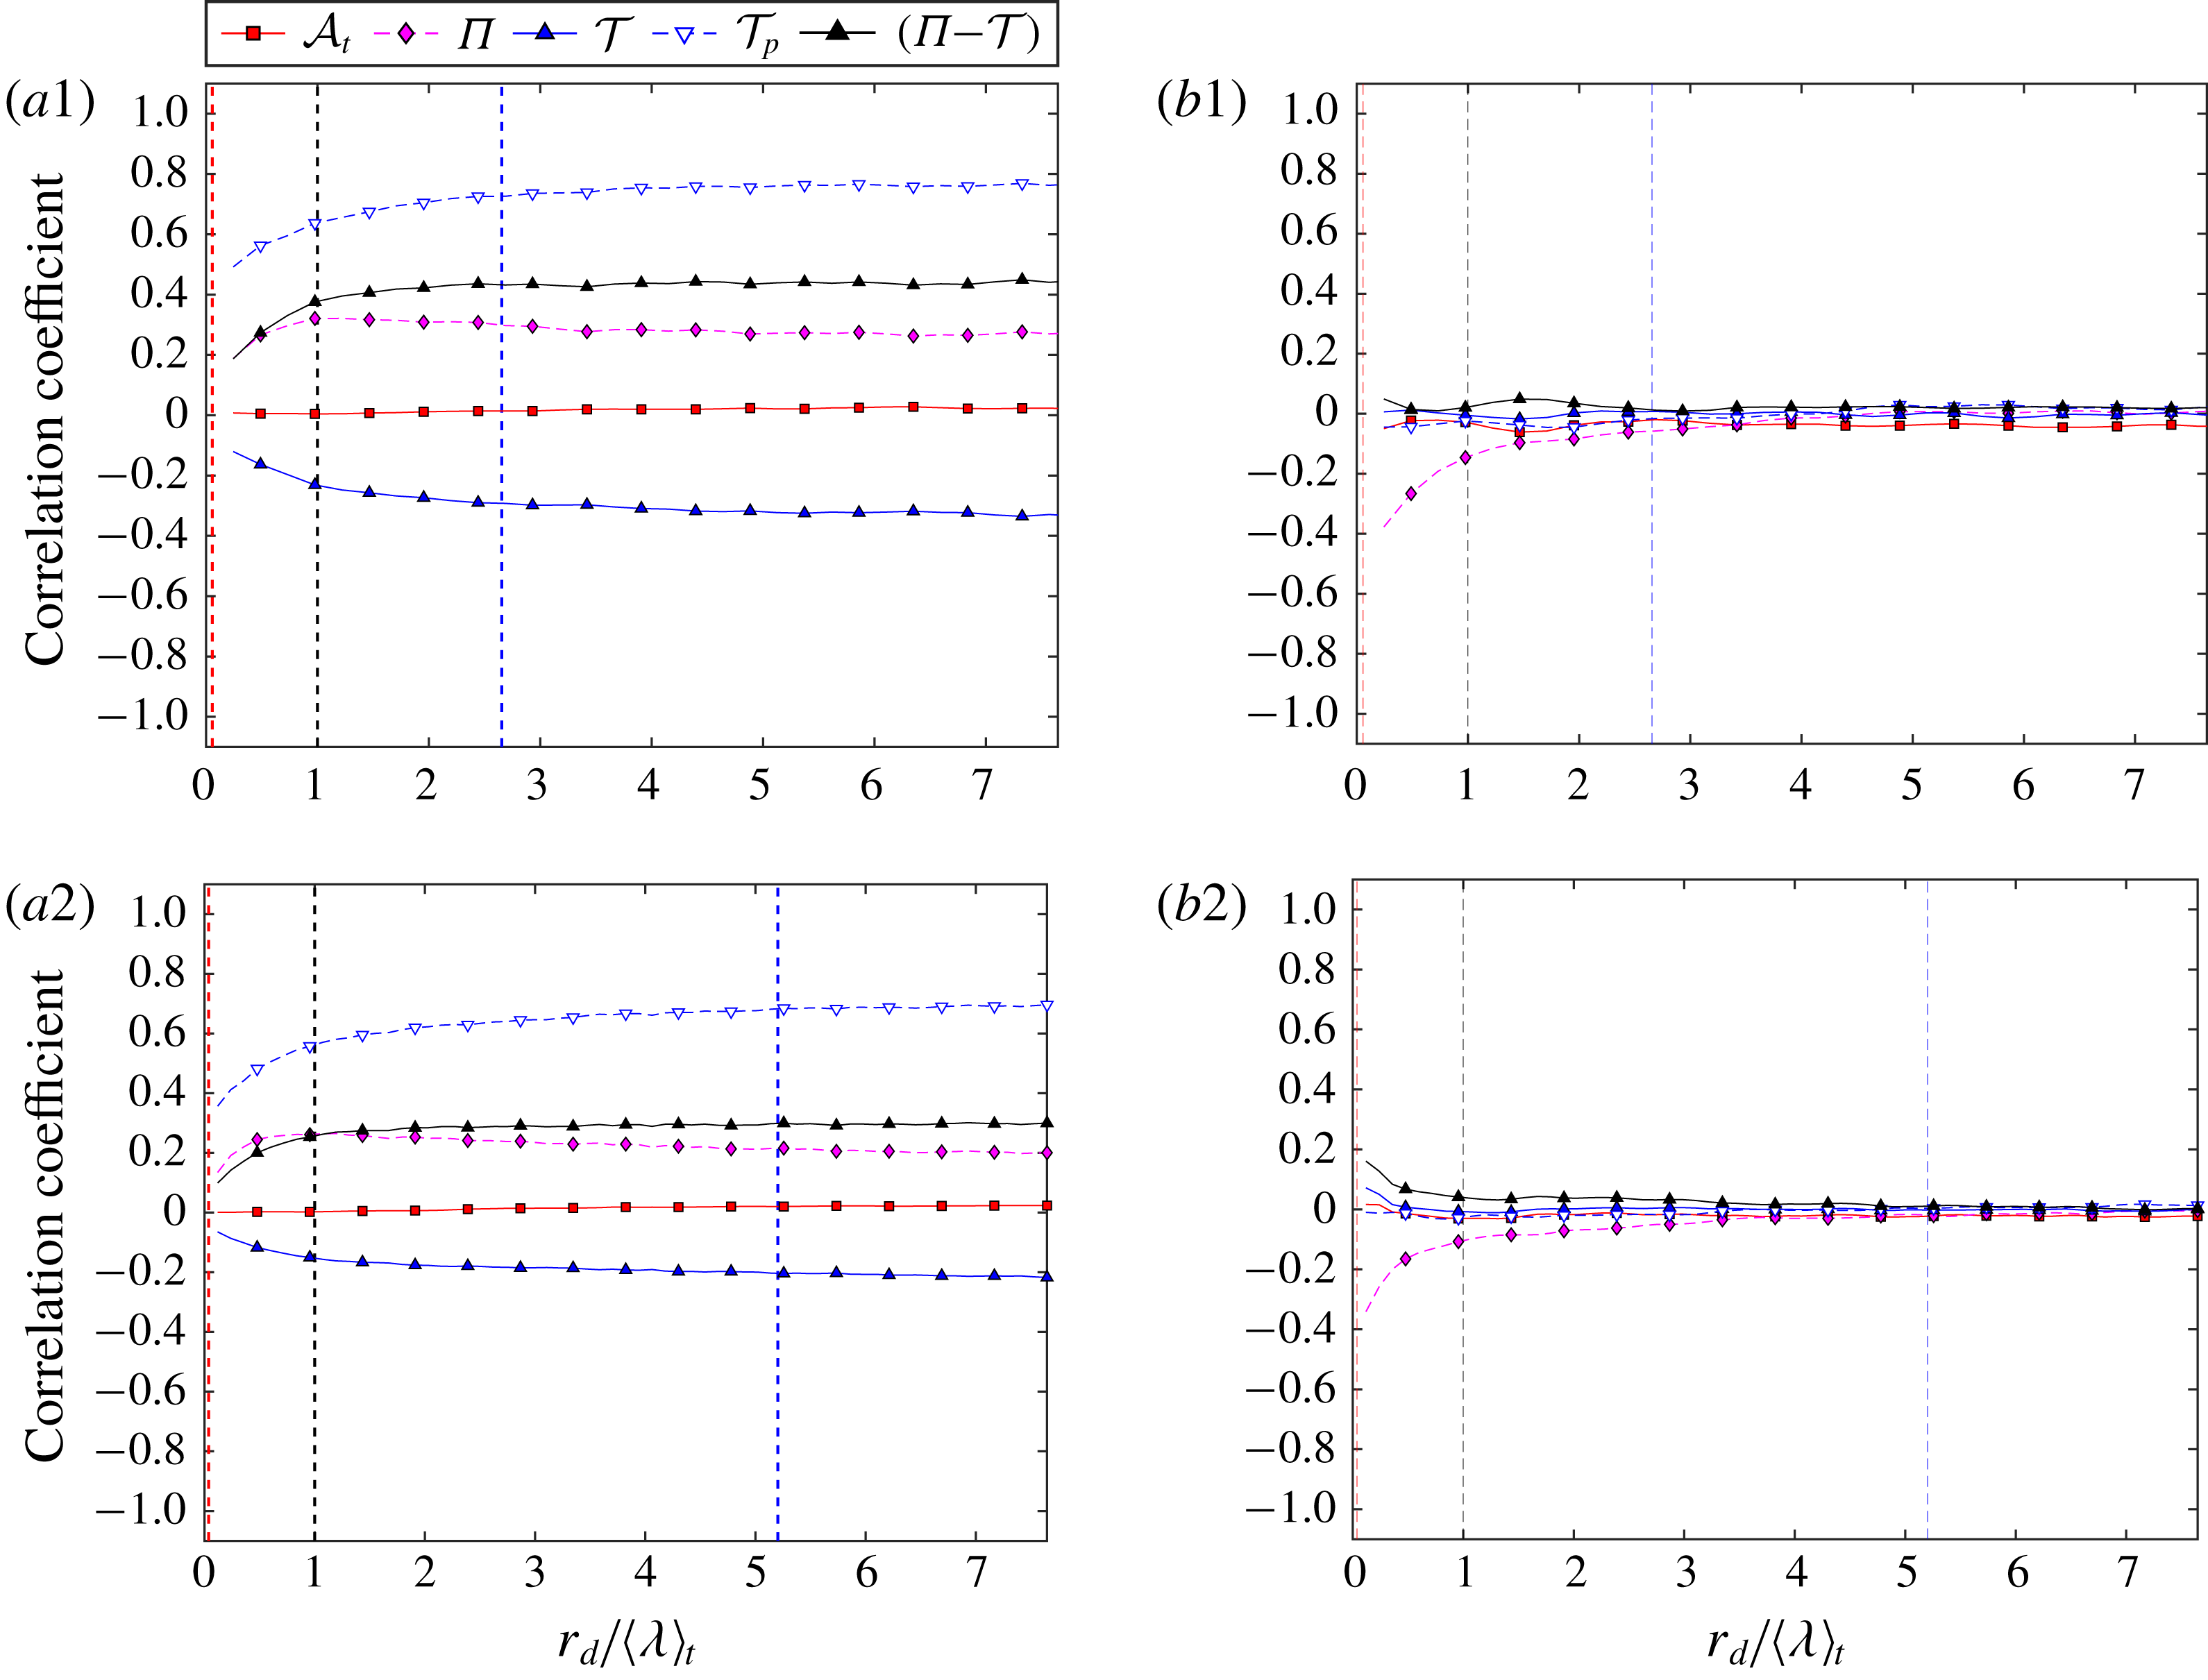
Correlation coefficients
 $\text{corr}(Q_{1},Q_{2})$
(defined in the second paragraph of § 4.1) for the nine
 $Q_{2}$
terms indicated above the plots and (a1)
 $Q_{1}={\mathcal{A}}_{t}$
and
 $\langle Re_{\unicode[STIX]{x1D706}}\rangle _{t}=80.9$
, (a2)
 $Q_{1}={\mathcal{A}}_{t}$
and
 $\langle Re_{\unicode[STIX]{x1D706}}\rangle _{t}=178$
, (b1)
 $Q_{1}={\mathcal{T}}_{p}$
and
 $\langle Re_{\unicode[STIX]{x1D706}}\rangle _{t}=80.9$
, (b2)
 $Q_{1}={\mathcal{T}}_{p}$
and
 $\langle Re_{\unicode[STIX]{x1D706}}\rangle _{t}=178$
. These correlation coefficients are calculated by sampling over space
 $\boldsymbol{X}$
, time
 $t$
and orientations
 $\hat{\boldsymbol{r}}$
for a given
 $r_{d}$
such that
 $\boldsymbol{r}=r_{d}\hat{\boldsymbol{r}}$
. They are plotted as functions
 $r_{d}$
and normalised by
 $\langle \unicode[STIX]{x1D706}\rangle _{t}$
. The red, black and blue dashed vertical straight lines indicate the time-average Kolmogorov scale
 $\langle \unicode[STIX]{x1D702}\rangle _{t}$
, Taylor micro-scale
 $\langle \unicode[STIX]{x1D706}\rangle _{t}$
and integral scale
 $\langle L\rangle _{t}$
, respectively.

The strongest correlation is between
 ${\mathcal{A}}_{t}$
and
 ${\mathcal{T}}-\unicode[STIX]{x1D6F1}$
(see figure 6
a1,a2), equally so over the entire range of scales
 $r_{d}>\langle \unicode[STIX]{x1D706}\rangle _{t}$
. This range includes the embryonic approximately inertial range between
 $\langle \unicode[STIX]{x1D706}\rangle _{t}$
and
 $\langle L\rangle _{t}$
as well as scales larger than
 $\langle L\rangle _{t}$
. This strong correlation is a reflection of the sweeping effect (see Tsinober Reference Tsinober2014) whereby the local acceleration
 $(\unicode[STIX]{x2202}/\unicode[STIX]{x2202}t)\boldsymbol{u}$
and the convective acceleration
 $\boldsymbol{u}\boldsymbol{\cdot }\unicode[STIX]{x1D735}\boldsymbol{u}$
have a tendency to approximately cancel each other. The direct mathematical consequence on the KHMH equation is that
 ${\mathcal{A}}_{t}$
and
 ${\mathcal{T}}-\unicode[STIX]{x1D6F1}$
would tend to cancel each other too, and the strong correlation seen in figure 6(a1,a2) between these two terms is a direct confirmation of this cancellation tendency. Note that this correlation seems to strengthen with increasing
 $\langle Re_{\unicode[STIX]{x1D706}}\rangle _{t}$
.
The correlations between
 ${\mathcal{A}}_{t}$
and
 ${\mathcal{T}}$
on the one hand, and between
 ${\mathcal{A}}_{t}$
and
 $-\unicode[STIX]{x1D6F1}$
on the other are weaker. However, the correlation between
 ${\mathcal{A}}_{t}$
and
 ${\mathcal{T}}$
strengthens whereas the correlation between
 ${\mathcal{A}}_{t}$
and
 $-\unicode[STIX]{x1D6F1}$
weakens and tends to
 $0$
with decreasing
 $r_{d}$
, particularly in the range
 $r_{d}\leqslant \langle L\rangle _{t}$
, see figure 6(a1,a2). It is significant that the interscale energy transfer term decorrelates from the sweeping effect as the scale decreases within the inertial range. Note also that the correlation between
 ${\mathcal{A}}_{t}$
and
 ${\mathcal{T}}$
is slightly stronger for our higher
 $\langle Re_{\unicode[STIX]{x1D706}}\rangle _{t}$
values.
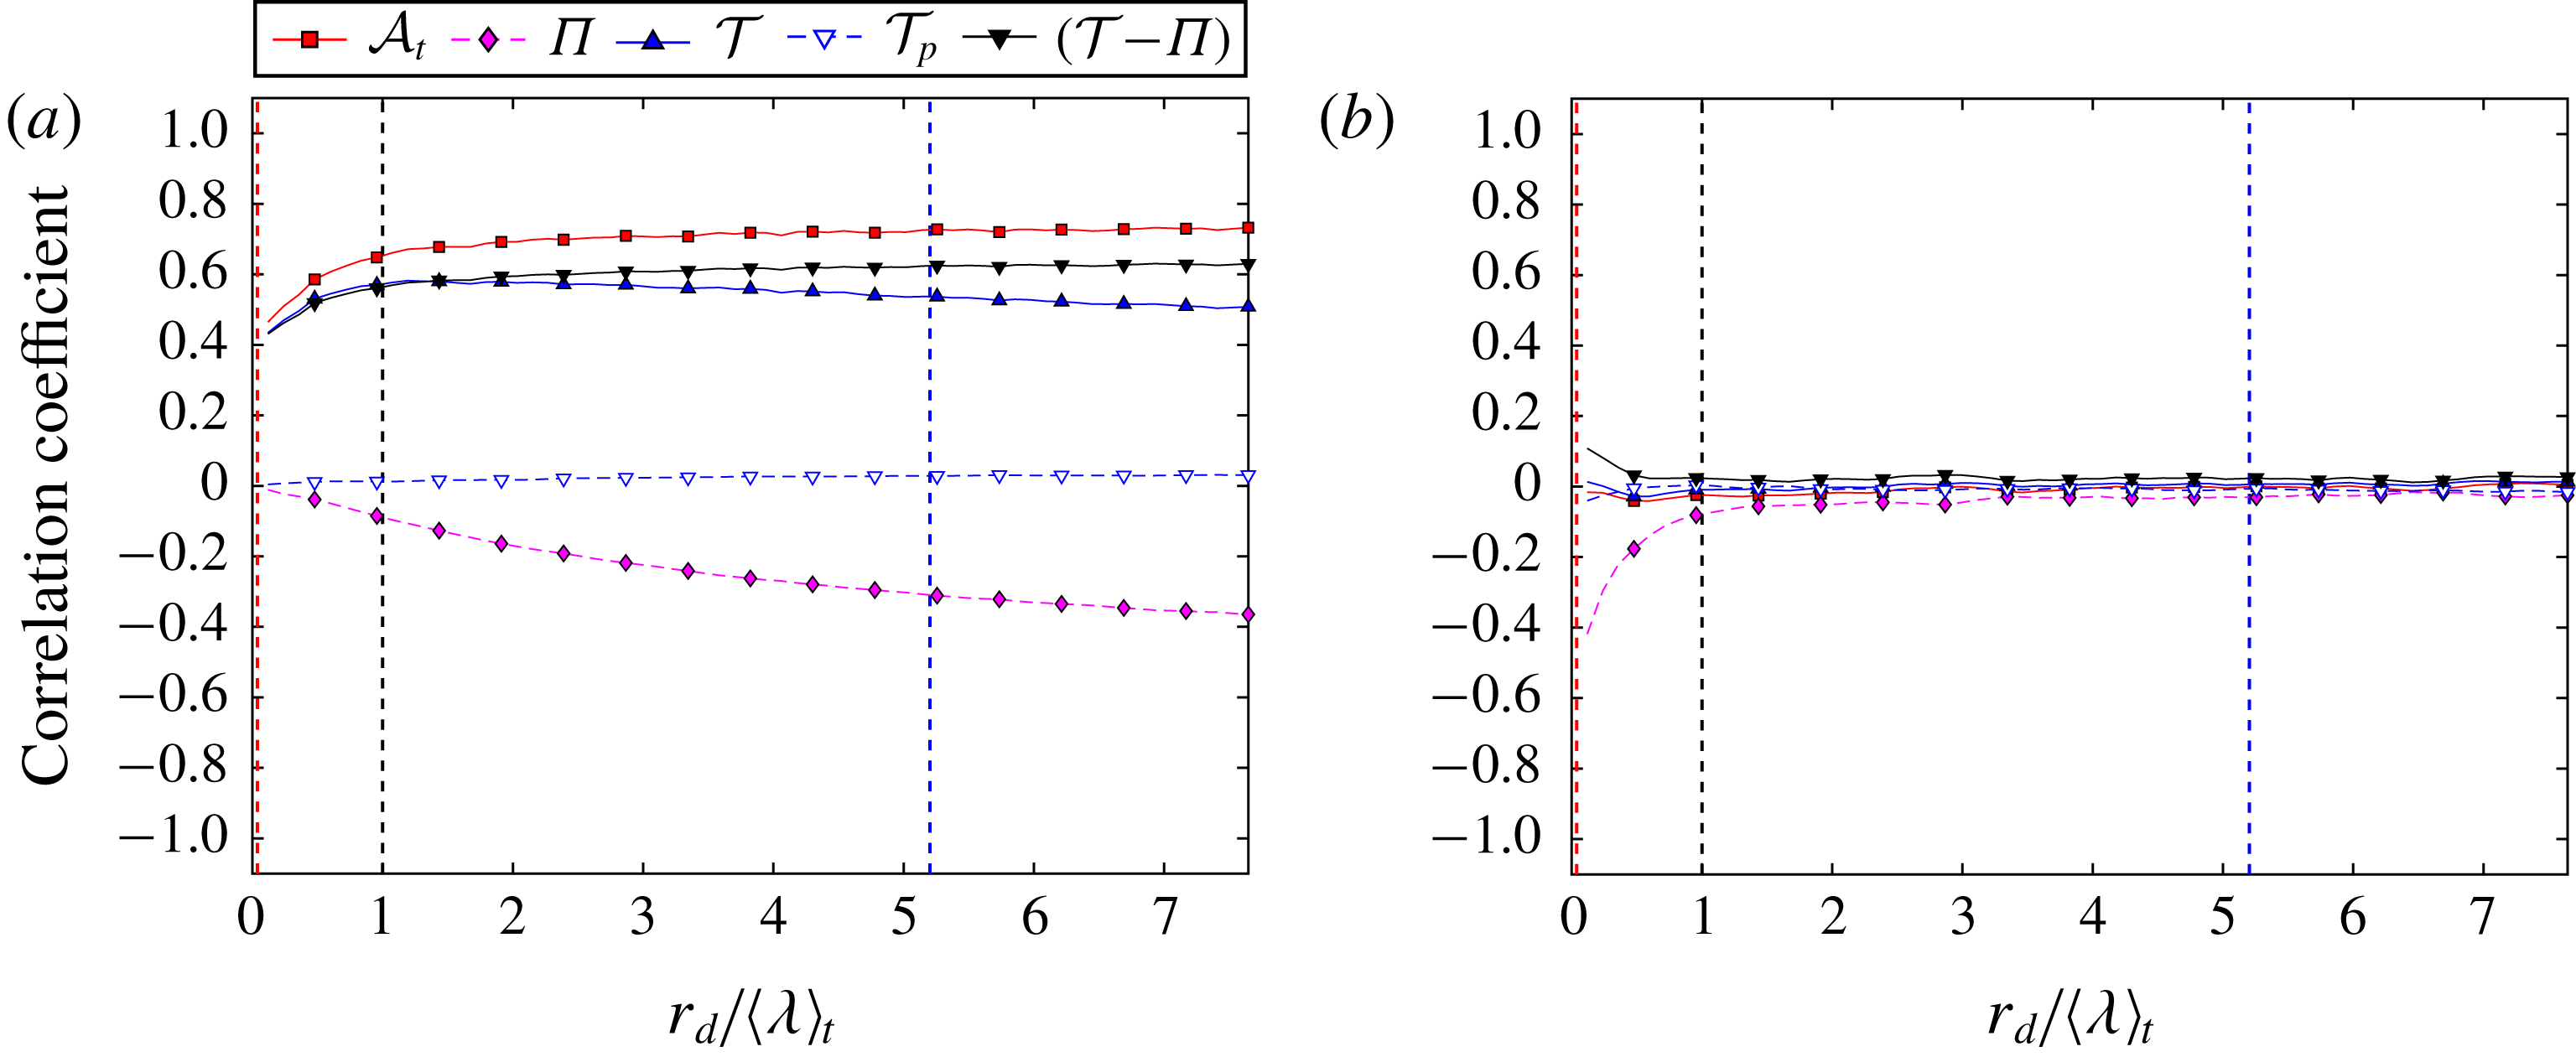
(a) Correlation coefficients
 $\text{corr}(Q_{1},Q_{2})$
(defined in the second paragraph of § 4.1) for
 $Q_{1}=\cos \unicode[STIX]{x1D703}$
and
 $Q_{2}=$
 ${\mathcal{A}}_{t}$
,
 $\unicode[STIX]{x1D6F1}$
,
 ${\mathcal{T}}$
,
 ${\mathcal{T}}_{p}$
and
 ${\mathcal{T}}-\unicode[STIX]{x1D6F1}$
. (b) Correlation coefficients
 $\text{corr}(Q_{1},Q_{2})$
for
 $Q_{1}=|\unicode[STIX]{x1D6FF}\boldsymbol{u}||\unicode[STIX]{x1D6FF}(\unicode[STIX]{x2202}/\unicode[STIX]{x2202}t)\boldsymbol{u}|$
and
 $Q_{2}={\mathcal{A}}_{t}$
,
 $\unicode[STIX]{x1D6F1}$
,
 ${\mathcal{T}}$
,
 ${\mathcal{T}}_{p}$
and
 ${\mathcal{T}}-\unicode[STIX]{x1D6F1}$
. The correlation coefficients in these two plots are calculated and plotted as explained in the caption of figure 6, and the red, black and blue dashed vertical straight lines are the same as in figure 6.
 $\langle Re_{\unicode[STIX]{x1D706}}\rangle _{t}=178$
but these plots are very similar for
 $\langle Re_{\unicode[STIX]{x1D706}}\rangle _{t}=80.9$
.

4.2 Geometrical statistics
The sweeping effect goes some considerable way in explaining the set (i) of correlations above. However more insight can be obtained with a geometrical approach in terms of the angle
 $\unicode[STIX]{x1D703}(\boldsymbol{X},\boldsymbol{r},t)$
between the two-point vectors
 $\unicode[STIX]{x1D6FF}\boldsymbol{u}$
and
 $\unicode[STIX]{x1D6FF}(\unicode[STIX]{x2202}/\unicode[STIX]{x2202}t)\boldsymbol{u}$
. In terms of this angle, the term
 ${\mathcal{A}}_{t}$
reads
 $$\begin{eqnarray}\displaystyle 4{\mathcal{A}}_{t}=2|\unicode[STIX]{x1D6FF}\boldsymbol{u}|\left|\unicode[STIX]{x1D6FF}\frac{\unicode[STIX]{x2202}}{\unicode[STIX]{x2202}t}\boldsymbol{u}\right|\cos \unicode[STIX]{x1D703}, & & \displaystyle\end{eqnarray}$$
and its correlations with
 $|\unicode[STIX]{x1D6FF}\boldsymbol{u}||\unicode[STIX]{x1D6FF}(\unicode[STIX]{x2202}/\unicode[STIX]{x2202}t)\boldsymbol{u}|$
and
 $\cos \unicode[STIX]{x1D703}$
separately are plotted in figure 7. The correlation is strong with
 $\cos \unicode[STIX]{x1D703}$
(figure 7
a) but inexistent with
 $|\unicode[STIX]{x1D6FF}\boldsymbol{u}||\unicode[STIX]{x1D6FF}(\unicode[STIX]{x2202}/\unicode[STIX]{x2202}t)\boldsymbol{u}|$
(figure 7
b). Given that
 $\langle {\mathcal{A}}_{t}\rangle _{all}=0$
and that
 $\langle \cos \unicode[STIX]{x1D703}\rangle _{all}$
is also effectively zero for all
 $r_{d}$
(see figure 8
a) we conclude that
 $|\unicode[STIX]{x1D6FF}\boldsymbol{u}||\unicode[STIX]{x1D6FF}(\unicode[STIX]{x2202}/\unicode[STIX]{x2202}t)\boldsymbol{u}|$
and
 $\cos \unicode[STIX]{x1D703}$
are uncorrelated at all scales (a fact that we confirmed against our data for all
 $r_{d}$
) and that the sign of
 ${\mathcal{A}}_{t}$
is therefore purely dictated by the sign of
 $\cos \unicode[STIX]{x1D703}$
independently from the value of
 $|\unicode[STIX]{x1D6FF}\boldsymbol{u}||\unicode[STIX]{x1D6FF}(\unicode[STIX]{x2202}/\unicode[STIX]{x2202}t)\boldsymbol{u}|$
. This is reflected in the strong correlation between
 ${\mathcal{A}}_{t}$
and
 $\cos \unicode[STIX]{x1D703}$
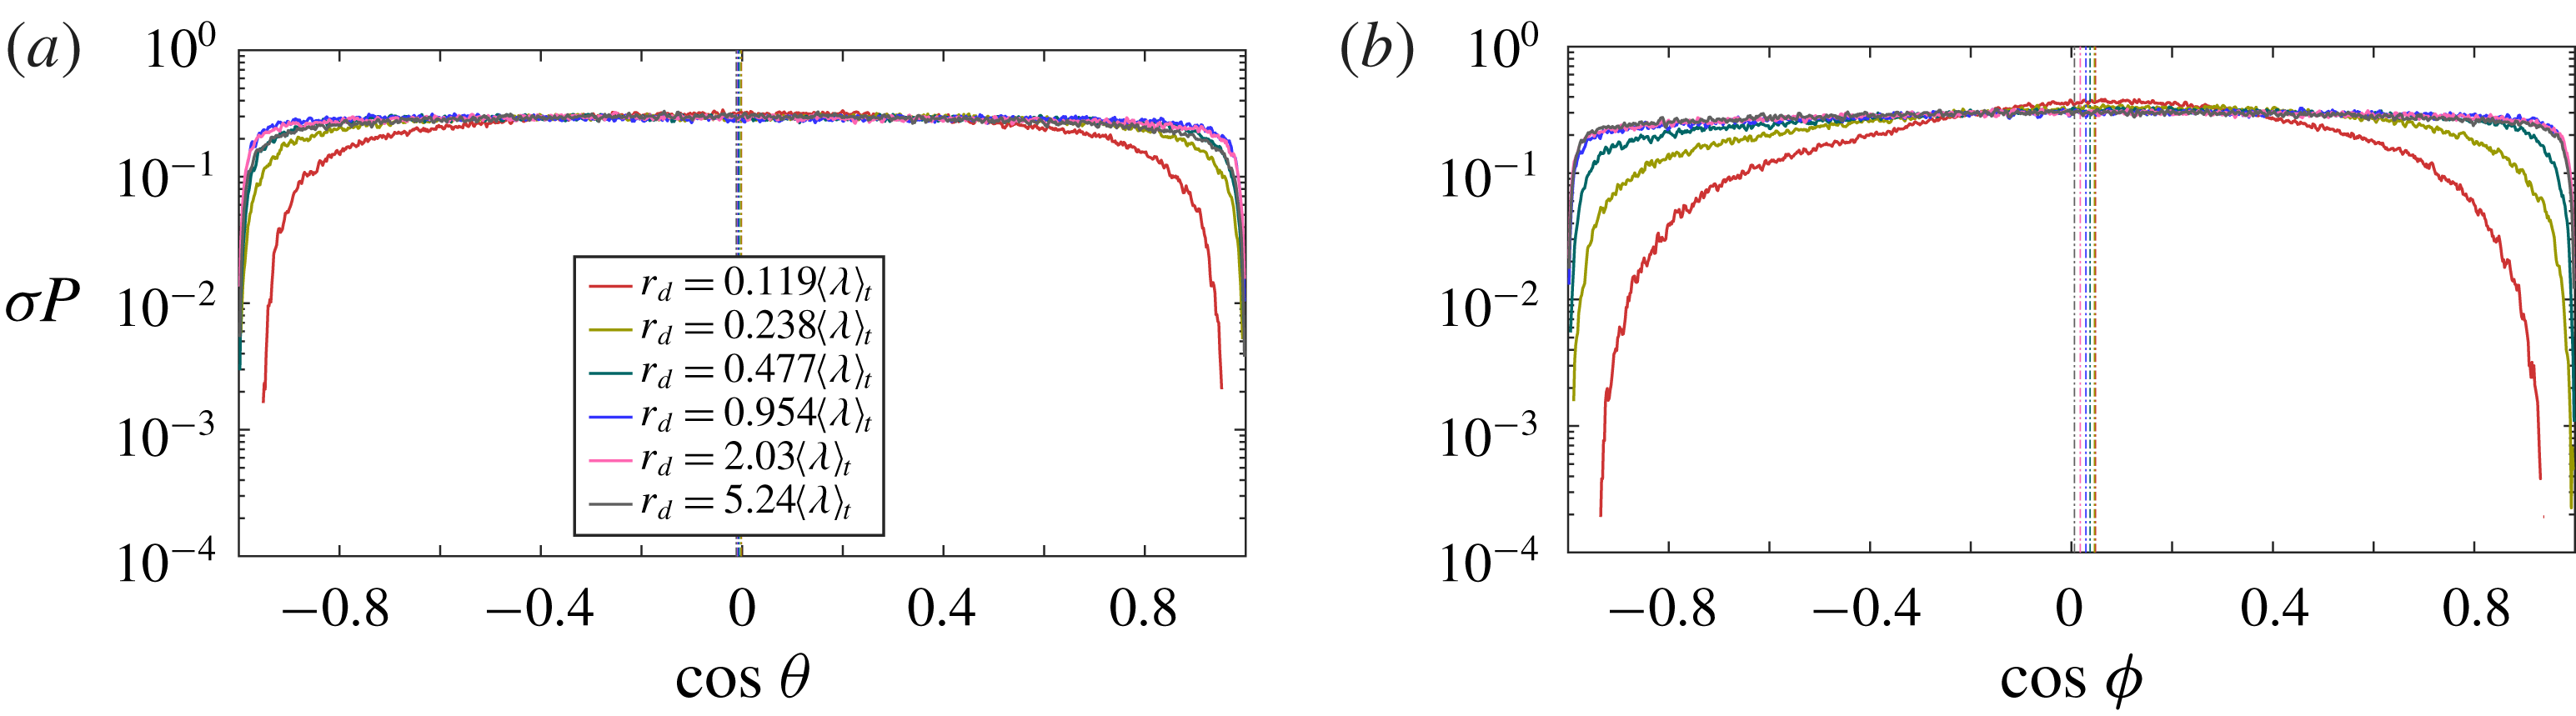
in figure 7(a). Note that the probability of
 $\cos \unicode[STIX]{x1D703}$
is in fact equally distributed, with the exception of perfect or near-perfect alignments or anti-alignments between
 $\unicode[STIX]{x1D6FF}\boldsymbol{u}$
and
 $\unicode[STIX]{x1D6FF}(\unicode[STIX]{x2202}/\unicode[STIX]{x2202}t)\boldsymbol{u}$
which are particularly unlikely (see figure 8
a).
PDFs of cosines of angles obtained from sampling over
 $\boldsymbol{X}$
,
 $t$
and
 $\hat{\boldsymbol{r}}$
for a given
 $r_{d}=|\boldsymbol{r}|$
. Different curves correspond to different values of
 $r_{d}$
as shown in the inset. (a) PDFs of
 $\cos \unicode[STIX]{x1D703}$
multiplied by the standard deviation of
 $\cos \unicode[STIX]{x1D703}$
. The vertical line indicates the average
 $\langle \cos \unicode[STIX]{x1D703}\rangle _{all}$
(average over
 $\boldsymbol{X}$
,
 $t$
and
 $\hat{\boldsymbol{r}}$
) which is effectively
 $0$
for all
 $r_{d}$
. (b) PDFs of
 $\cos \unicode[STIX]{x1D719}$
multiplied by the standard deviation of
 $\cos \unicode[STIX]{x1D719}$
. The vertical lines indicate the average
 $\langle \cos \unicode[STIX]{x1D719}\rangle _{all}$
for different values of
 $r_{d}$
from
 $0.119\langle \unicode[STIX]{x1D706}\rangle _{t}$
to
 $5.24\langle \unicode[STIX]{x1D706}\rangle _{t}$
. The average of
 $\cos \unicode[STIX]{x1D719}$
is very close to
 $0$
for
 $r_{d}\leqslant 5.24\langle \unicode[STIX]{x1D706}\rangle _{t}$
(
 ${\approx}\langle L\rangle _{t}$
); in the range below
 $5.24\langle \unicode[STIX]{x1D706}\rangle _{t}$
, it increases monotonically with decreasing
 $r_{d}$
till it reaches
 ${\approx}0.05$
at
 $r_{d}=0.119\langle \unicode[STIX]{x1D706}\rangle _{t}$
.
 $\langle Re_{\unicode[STIX]{x1D706}}\rangle _{t}=178$
but these plots are very similar for
 $\langle Re_{\unicode[STIX]{x1D706}}\rangle _{t}=80.9$
.

(a1,a2) Correlation coefficients
 $\text{corr}(Q_{1},Q_{2})$
(defined in the second paragraph of § 4.1) for
 $Q_{1}=\cos \unicode[STIX]{x1D719}$
and
 $Q_{2}={\mathcal{A}}_{t}$
,
 $\unicode[STIX]{x1D6F1}$
,
 ${\mathcal{T}}$
,
 ${\mathcal{T}}_{p}$
and
 $\unicode[STIX]{x1D6F1}-{\mathcal{T}}$
: (a1) for
 $\langle Re_{\unicode[STIX]{x1D706}}\rangle _{t}=80.9$
, (a2) for
 $\langle Re_{\unicode[STIX]{x1D706}}\rangle _{t}=178$
. (b1,b2) Correlation coefficients
 $\text{corr}(Q_{1},Q_{2})$
for
 $Q_{1}=|\unicode[STIX]{x1D6FF}\boldsymbol{u}||\unicode[STIX]{x1D6FF}\boldsymbol{f}_{\boldsymbol{p}}|$
(where
 $\boldsymbol{f}_{\boldsymbol{p}}=-\unicode[STIX]{x1D735}p$
) and
 $Q_{2}={\mathcal{A}}_{t}$
,
 $\unicode[STIX]{x1D6F1}$
,
 ${\mathcal{T}}$
,
 ${\mathcal{T}}_{p}$
and
 $\unicode[STIX]{x1D6F1}-{\mathcal{T}}$
; (b1) for
 $\langle Re_{\unicode[STIX]{x1D706}}\rangle _{t}=80.9$
, (b2) for
 $\langle Re_{\unicode[STIX]{x1D706}}\rangle _{t}=178$
. The correlation coefficients in these plots are calculated and plotted as explained in the caption of figure 6, and the red, black and blue dashed vertical straight lines are the same as in figure 6.

Figure 7(b) shows that
 ${\mathcal{T}}$
and
 ${\mathcal{T}}_{p}$
are also totally uncorrelated with
 $|\unicode[STIX]{x1D6FF}\boldsymbol{u}||\unicode[STIX]{x1D6FF}(\unicode[STIX]{x2202}/\unicode[STIX]{x2202}t)\boldsymbol{u}|$
at all scales and that the same holds for
 $-\unicode[STIX]{x1D6F1}$
and
 ${\mathcal{T}}-\unicode[STIX]{x1D6F1}$
except for very small correlations with
 $|\unicode[STIX]{x1D6FF}\boldsymbol{u}||\unicode[STIX]{x1D6FF}(\unicode[STIX]{x2202}/\unicode[STIX]{x2202}t)\boldsymbol{u}|$
at scales
 $r_{d}$
below
 $\langle L\rangle _{t}$
.
Figure 7(a) reveals that the set (i) of correlations caused by the sweeping effect between
 ${\mathcal{A}}_{t}$
and each one of the terms
 ${\mathcal{T}}-\unicode[STIX]{x1D6F1}$
,
 ${\mathcal{T}}$
and
 $-\unicode[STIX]{x1D6F1}$
translates into correlations between
 $\cos \unicode[STIX]{x1D703}$
and each one of these terms, albeit a little weaker. In agreement with the observation made at the end of the previous subsection, the correlation between
 $\cos \unicode[STIX]{x1D703}$
and
 ${\mathcal{T}}$
strengthens whereas the correlation between
 $\cos \unicode[STIX]{x1D703}$
and
 $-\unicode[STIX]{x1D6F1}$
weakens and tends to
 $0$
with decreasing
 $r_{d}$
, particularly in the range
 $\langle \unicode[STIX]{x1D706}\rangle _{t}\leqslant r_{d}\leqslant \langle L\rangle _{t}$
, see figure 7(a) and compare with figure 6(a). The interscale energy transfer term decorrelates from the sweeping alignment as the scale decreases within the inertial range and as the correlation between the turbulent transport term and
 $\cos \unicode[STIX]{x1D703}$
strengthens.
Finally, note the zero correlation between
 ${\mathcal{T}}_{p}$
and
 $\cos \unicode[STIX]{x1D703}$
in figure 7(a), in agreement with the zero-correlation between
 ${\mathcal{T}}_{p}$
and
 ${\mathcal{A}}_{t}$
in figure 6(a1,a2). However, the pressure–velocity term
 ${\mathcal{T}}_{p}$
is central in the set (ii) of correlations (figure 6
b) mentioned in the previous subsection. The very significant correlation between
 $\unicode[STIX]{x1D6F1}-{\mathcal{T}}$
and
 ${\mathcal{T}}_{p}$
at all scales
 $r_{d}\geqslant \langle \unicode[STIX]{x1D706}\rangle _{t}$
reflects the intimate relation between the convective nonlinearity and the pressure gradient non-locality in incompressible Navier–Stokes flow. It is also interesting that, whilst this correlation remains constant (at about 0.6 for
 $\langle Re_{\unicode[STIX]{x1D706}}\rangle _{t}=80.9$
and a little under 0.5 for
 $\langle Re_{\unicode[STIX]{x1D706}}\rangle _{t}=178$
) throughout the range
 $\langle \unicode[STIX]{x1D706}\rangle _{t}$
to
 $\langle L\rangle _{t}$
and beyond, the correlation between
 ${\mathcal{T}}_{p}$
and
 $\unicode[STIX]{x1D6F1}$
increases whereas the correlation between
 ${\mathcal{T}}_{p}$
and
 ${\mathcal{T}}$
decreases with decreasing
 $r_{d}$
in this range. It appears that the correlation between
 $\unicode[STIX]{x1D6F1}$
and
 ${\mathcal{T}}_{p}$
increases as
 $\unicode[STIX]{x1D6F1}$
tends to assume its cascade role in an increasingly exclusive way with diminishing interference from the sweeping effect. This is clearer at our higher Reynolds number because, whilst the correlation between
 ${\mathcal{T}}_{p}$
and
 $\unicode[STIX]{x1D6F1}$
is approximately the same for the two Reynolds numbers, the correlation between
 ${\mathcal{T}}_{p}$
and
 $-{\mathcal{T}}$
seems to decrease with increasing
 $\langle Re_{\unicode[STIX]{x1D706}}\rangle _{t}$
.
For further insight we define the angle
 $\unicode[STIX]{x1D719}(\boldsymbol{X},\boldsymbol{r},t)$
between the two-point vectors
 $\unicode[STIX]{x1D6FF}\boldsymbol{u}$
and
 $-\unicode[STIX]{x1D6FF}\unicode[STIX]{x1D735}p$
and write
 $$\begin{eqnarray}\displaystyle 4{\mathcal{T}}_{p}\equiv \frac{2}{\unicode[STIX]{x1D70C}}\unicode[STIX]{x1D6FF}u_{i}\left(-\unicode[STIX]{x1D6FF}\frac{\unicode[STIX]{x2202}p}{\unicode[STIX]{x2202}x_{i}}\right)=\frac{2}{\unicode[STIX]{x1D70C}}|\unicode[STIX]{x1D6FF}\boldsymbol{u}||\unicode[STIX]{x1D6FF}\unicode[STIX]{x1D735}p|\cos \unicode[STIX]{x1D719}. & & \displaystyle\end{eqnarray}$$
Figure 9 shows that
 ${\mathcal{T}}_{p}$
is quite highly correlated with
 $\cos \unicode[STIX]{x1D719}$
but is not correlated with
 $|\unicode[STIX]{x1D6FF}\boldsymbol{u}||\unicode[STIX]{x1D6FF}\unicode[STIX]{x1D735}p|$
. Furthermore, as we report in figure 8(b) and its caption and also in figure 11,
 $\langle \cos \unicode[STIX]{x1D719}\rangle _{all}$
is not zero for scales
 $r_{d}$
smaller than
 $\langle L\rangle _{t}$
. This implies that there must be a correlation between
 $|\unicode[STIX]{x1D6FF}\boldsymbol{u}||\unicode[STIX]{x1D6FF}\unicode[STIX]{x1D735}p|$
and
 $\cos \unicode[STIX]{x1D719}$
at these scales. However, we checked that this correlation is small which agrees with the observation that
 $\langle \cos \unicode[STIX]{x1D719}\rangle _{all}$
is small too (see caption of figure 8). The sign of
 ${\mathcal{T}}_{p}$
is therefore mainly determined by the sign of
 $\cos \unicode[STIX]{x1D719}$
without significant interference from
 $|\unicode[STIX]{x1D6FF}\boldsymbol{u}||\unicode[STIX]{x1D6FF}\unicode[STIX]{x1D735}p|$
, as can be seen in the strong correlation between
 ${\mathcal{T}}_{p}$
and
 $\cos \unicode[STIX]{x1D719}$
in figure 9(a). Note in figure 8 the slight tendency for a preference in angle
 $\unicode[STIX]{x1D719}$
as
 $r_{d}$
decreases in the range below
 $\langle L\rangle _{t}$
; this statistical preference is for slightly positive values of
 $\cos \unicode[STIX]{x1D719}$
. One cannot help thinking that there may be a relation with the slight tendency for a negative value of
 $\unicode[STIX]{x1D6F1}$
in figure 3. There is definitely a significant role of the fluctuating pressure in the interscale energy transfer dynamics expressed by the correlations between
 ${\mathcal{T}}_{p}$
and
 $\unicode[STIX]{x1D6F1}$
.
Figure 9(b) shows that, like
 ${\mathcal{T}}_{p}$
,
 ${\mathcal{T}}$
is uncorrelated with
 $|\unicode[STIX]{x1D6FF}\boldsymbol{u}||\unicode[STIX]{x1D6FF}\unicode[STIX]{x1D735}p|$
at all scales too;
 $\unicode[STIX]{x1D6F1}$
and
 $\unicode[STIX]{x1D6F1}-{\mathcal{T}}$
are also uncorrelated with
 $|\unicode[STIX]{x1D6FF}\boldsymbol{u}||\unicode[STIX]{x1D6FF}\unicode[STIX]{x1D735}p|$
except at scales below
 $\langle L\rangle _{t}$
and increasingly so with decreasing
 $r_{d}$
. These small correlations are similar to those between
 $|\unicode[STIX]{x1D6FF}\boldsymbol{u}||\unicode[STIX]{x1D6FF}(\unicode[STIX]{x2202}/\unicode[STIX]{x2202}t)\boldsymbol{u}|$
and either
 $\unicode[STIX]{x1D6F1}$
or
 $\unicode[STIX]{x1D6F1}-{\mathcal{T}}$
in figure 7(b). They both seem to have their origin in small-scale inertial and dissipation range correlations between
 $|\unicode[STIX]{x1D6FF}\boldsymbol{u}|$
and
 $\unicode[STIX]{x1D6F1}$
.
The KHMH terms
 $\unicode[STIX]{x1D6F1}-{\mathcal{T}}$
,
 $-{\mathcal{T}}$
and
 $\unicode[STIX]{x1D6F1}$
exhibit some significant correlation with
 $\cos \unicode[STIX]{x1D719}$
whereas
 ${\mathcal{A}}_{t}$
, which is mostly affected by the sweeping, does not (see figure 9
a). The lack of correlation between
 $\cos \unicode[STIX]{x1D719}$
and
 ${\mathcal{A}}_{t}$
and the significant correlation between
 $\cos \unicode[STIX]{x1D719}$
and
 $\unicode[STIX]{x1D6F1}$
are consistent with the lack of correlation between
 ${\mathcal{T}}_{p}$
and
 ${\mathcal{A}}_{t}$
and the significant correlation between
 ${\mathcal{T}}_{p}$
and
 $\unicode[STIX]{x1D6F1}$
(figure 6). In the previous subsection we saw how, as
 $r_{d}$
decreases within the inertial range, the sweeping effect is progressively expressed exclusively by the strengthening correlation between
 ${\mathcal{T}}$
and
 ${\mathcal{A}}_{t}$
as
 $\unicode[STIX]{x1D6F1}$
progressively decorrelates from
 ${\mathcal{A}}_{t}$
. The slightly increasing positive correlation that
 $\unicode[STIX]{x1D6F1}$
has with
 $\cos \unicode[STIX]{x1D719}$
(figure 9
a1,a2) as
 $r_{d}$
decreases for both
 $\langle Re_{\unicode[STIX]{x1D706}}\rangle _{t}$
values reflect the same, albeit stronger, effect between
 $\unicode[STIX]{x1D6F1}$
and
 ${\mathcal{T}}_{p}$
(figure 6
b). A contributing factor to this effect being weaker in figure 9(a1,a2) than in figure 6(b) is that both
 $-{\mathcal{T}}$
and
 $\unicode[STIX]{x1D6F1}-{\mathcal{T}}$
tend to reduce their correlation with
 $\cos \unicode[STIX]{x1D719}$
as
 ${\mathcal{T}}$
assumes more of its sweeping effect role by correlating further with
 ${\mathcal{A}}_{t}$
both with decreasing
 $r_{d}$
below
 $\langle L\rangle _{t}$
and with increasing
 $\langle Re_{\unicode[STIX]{x1D706}}\rangle _{t}$
. Even so, there seems to be an interference of the pressure gradient fluctuations and their geometrical alignments with the dynamics of interscale energy transfer.
Some further insight into the interactions between fluctuating pressure gradient and fluctuating interscale energy transfer can be gleaned by using
 $$\begin{eqnarray}\displaystyle \cos \unicode[STIX]{x1D719}=(\widehat{\unicode[STIX]{x1D6FF}\boldsymbol{u}}\boldsymbol{\cdot }\hat{\boldsymbol{r}})(\widehat{\unicode[STIX]{x1D6FF}\boldsymbol{f}_{p}}\boldsymbol{\cdot }\hat{\boldsymbol{r}})+(\widehat{\unicode[STIX]{x1D6FF}\boldsymbol{u}}\times \hat{\boldsymbol{r}})\boldsymbol{\cdot }(\widehat{\unicode[STIX]{x1D6FF}\boldsymbol{f}_{p}}\times \hat{\boldsymbol{r}}), & & \displaystyle\end{eqnarray}$$
where
 $\boldsymbol{f}_{p}\equiv -\unicode[STIX]{x1D735}p$
,
 $\widehat{\unicode[STIX]{x1D6FF}\boldsymbol{f}_{p}}$
is the unit vector in the direction of
 $\unicode[STIX]{x1D6FF}\boldsymbol{f}_{p}$
and
 $\widehat{\unicode[STIX]{x1D6FF}\boldsymbol{u}}$
is the unit vector in the direction of
 $\unicode[STIX]{x1D6FF}\boldsymbol{u}$
. The interest of the decomposition (4.3) stems from the equality between the volume integral
 $\iiint _{|\boldsymbol{r}|\leqslant r_{d}}4\unicode[STIX]{x1D6F1}(\boldsymbol{X},\boldsymbol{r},t)\,\text{d}\boldsymbol{r}$
and the surface integral
 $\iiint _{|\boldsymbol{r}|=r_{d}}\unicode[STIX]{x1D6FF}\boldsymbol{u}\boldsymbol{\cdot }\hat{\boldsymbol{r}}|\unicode[STIX]{x1D6FF}\boldsymbol{u}|^{2}\,\text{d}\boldsymbol{r}$
which implies that compression events where
 $\unicode[STIX]{x1D6FF}\boldsymbol{u}\boldsymbol{\cdot }\hat{\boldsymbol{r}}<0$
contribute to the forward cascade from large to small scales whereas stretching events where
 $\unicode[STIX]{x1D6FF}\boldsymbol{u}\boldsymbol{\cdot }\hat{\boldsymbol{r}}>0$
contribute to backscatter, i.e. from small to large scales. Hence, the sign of
 $(\widehat{\unicode[STIX]{x1D6FF}\boldsymbol{u}}\boldsymbol{\cdot }\hat{\boldsymbol{r}})(\widehat{\unicode[STIX]{x1D6FF}\boldsymbol{f}_{p}}\boldsymbol{\cdot }\hat{\boldsymbol{r}})$
in the decomposition (4.3) indicates whether the pressure force does or does not act locally in the same way as the local cascade event:
 $(\widehat{\unicode[STIX]{x1D6FF}\boldsymbol{u}}\boldsymbol{\cdot }\hat{\boldsymbol{r}})(\widehat{\unicode[STIX]{x1D6FF}\boldsymbol{f}_{p}}\boldsymbol{\cdot }\hat{\boldsymbol{r}})$
is positive when the pressure force and the cascade are both compressing or stretching and is negative when one of the two is compressing and the other stretching.
The other term in the decomposition relates to energy exchanges from one direction to another in
 $\boldsymbol{r}$
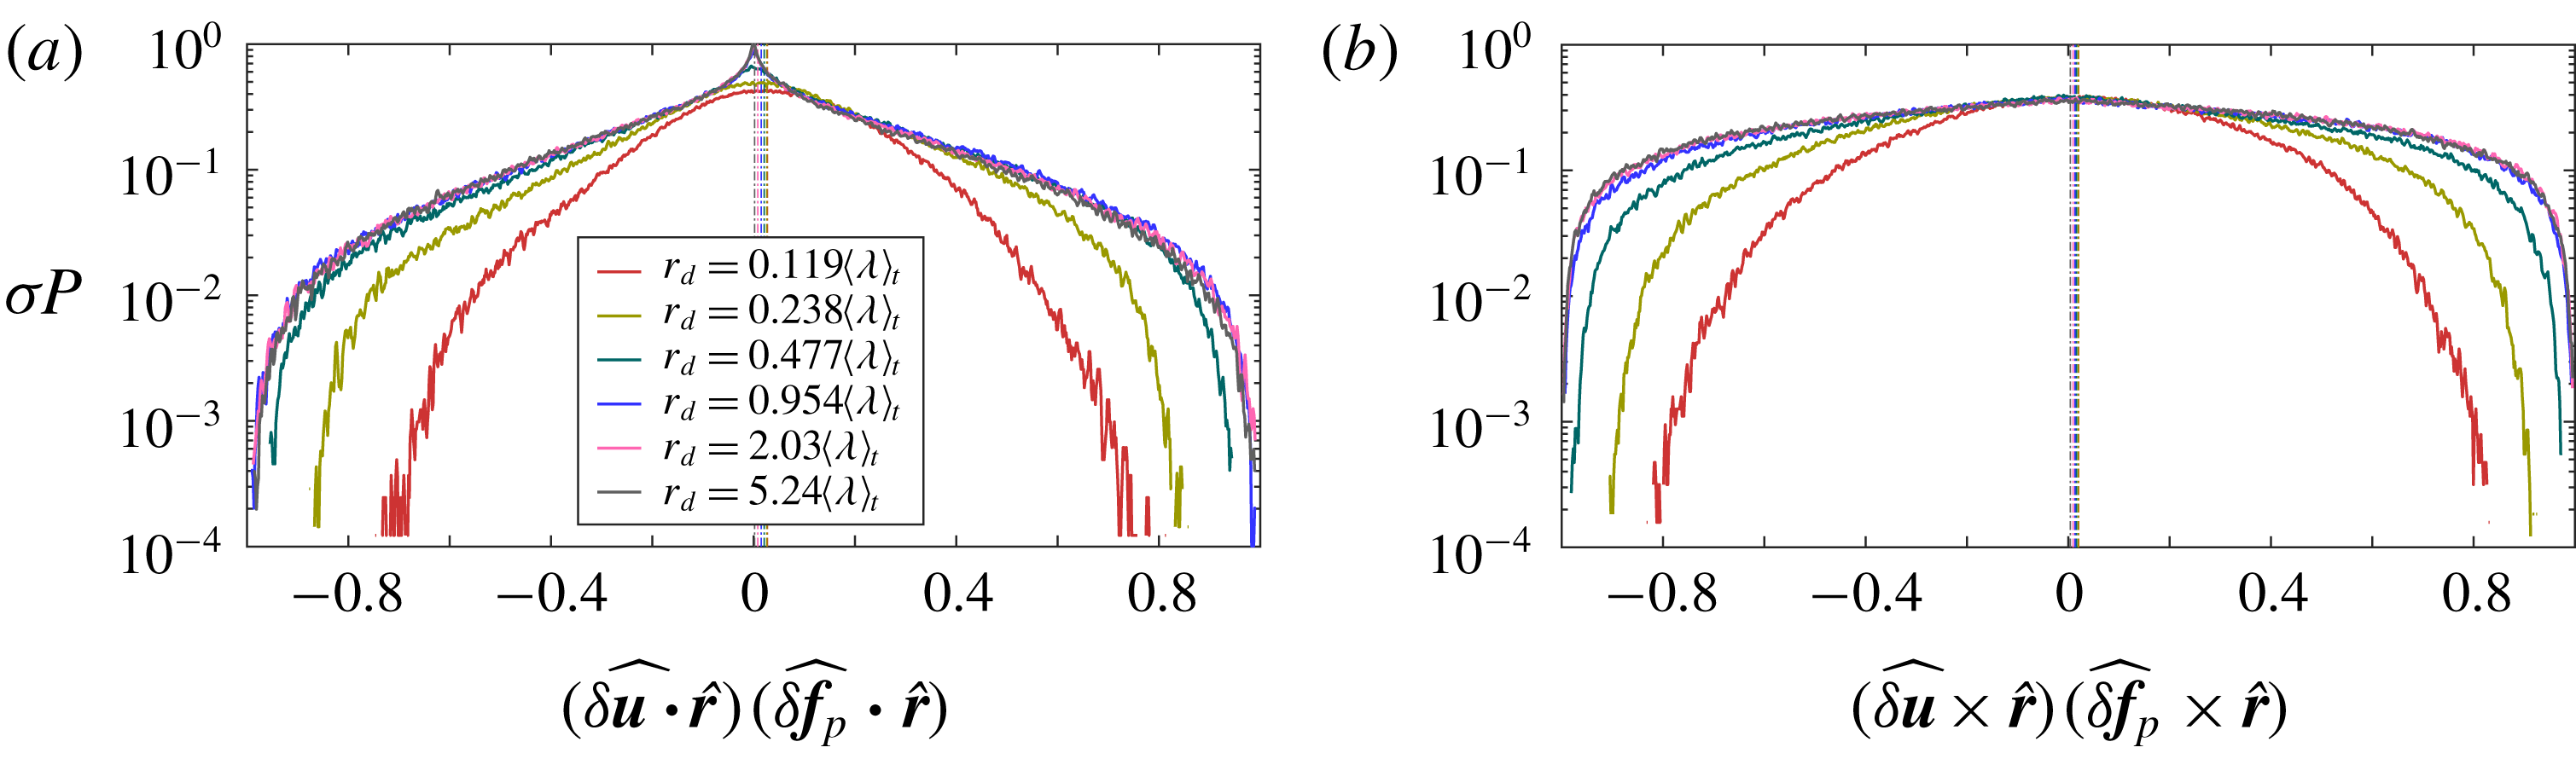
-space and is therefore not directly related to the cascade. In figure 10 we plot the PDFs of the two terms on the right-hand side of (4.3). The overall shape of the PDF of
 $\cos \unicode[STIX]{x1D719}$
in figure 8(b) is reflected in the shape of the PDF of
 $(\widehat{\unicode[STIX]{x1D6FF}\boldsymbol{u}}\times \hat{\boldsymbol{r}})\boldsymbol{\cdot }(\widehat{\unicode[STIX]{x1D6FF}\boldsymbol{f}_{p}}\times \hat{\boldsymbol{r}})$
rather than the PDF of
 $(\widehat{\unicode[STIX]{x1D6FF}\boldsymbol{u}}\boldsymbol{\cdot }\hat{\boldsymbol{r}})(\widehat{\unicode[STIX]{x1D6FF}\boldsymbol{f}_{p}}\boldsymbol{\cdot }\hat{\boldsymbol{r}})$
. Hence, the wide variability in
 $\cos \unicode[STIX]{x1D719}$
values and also the gradual reduction of this variability with decreasing length scales
 $r_{d}$
within the inertial and dissipation ranges seem to mostly reflect directional rather than interscale effects in
 $\boldsymbol{r}$
-space.
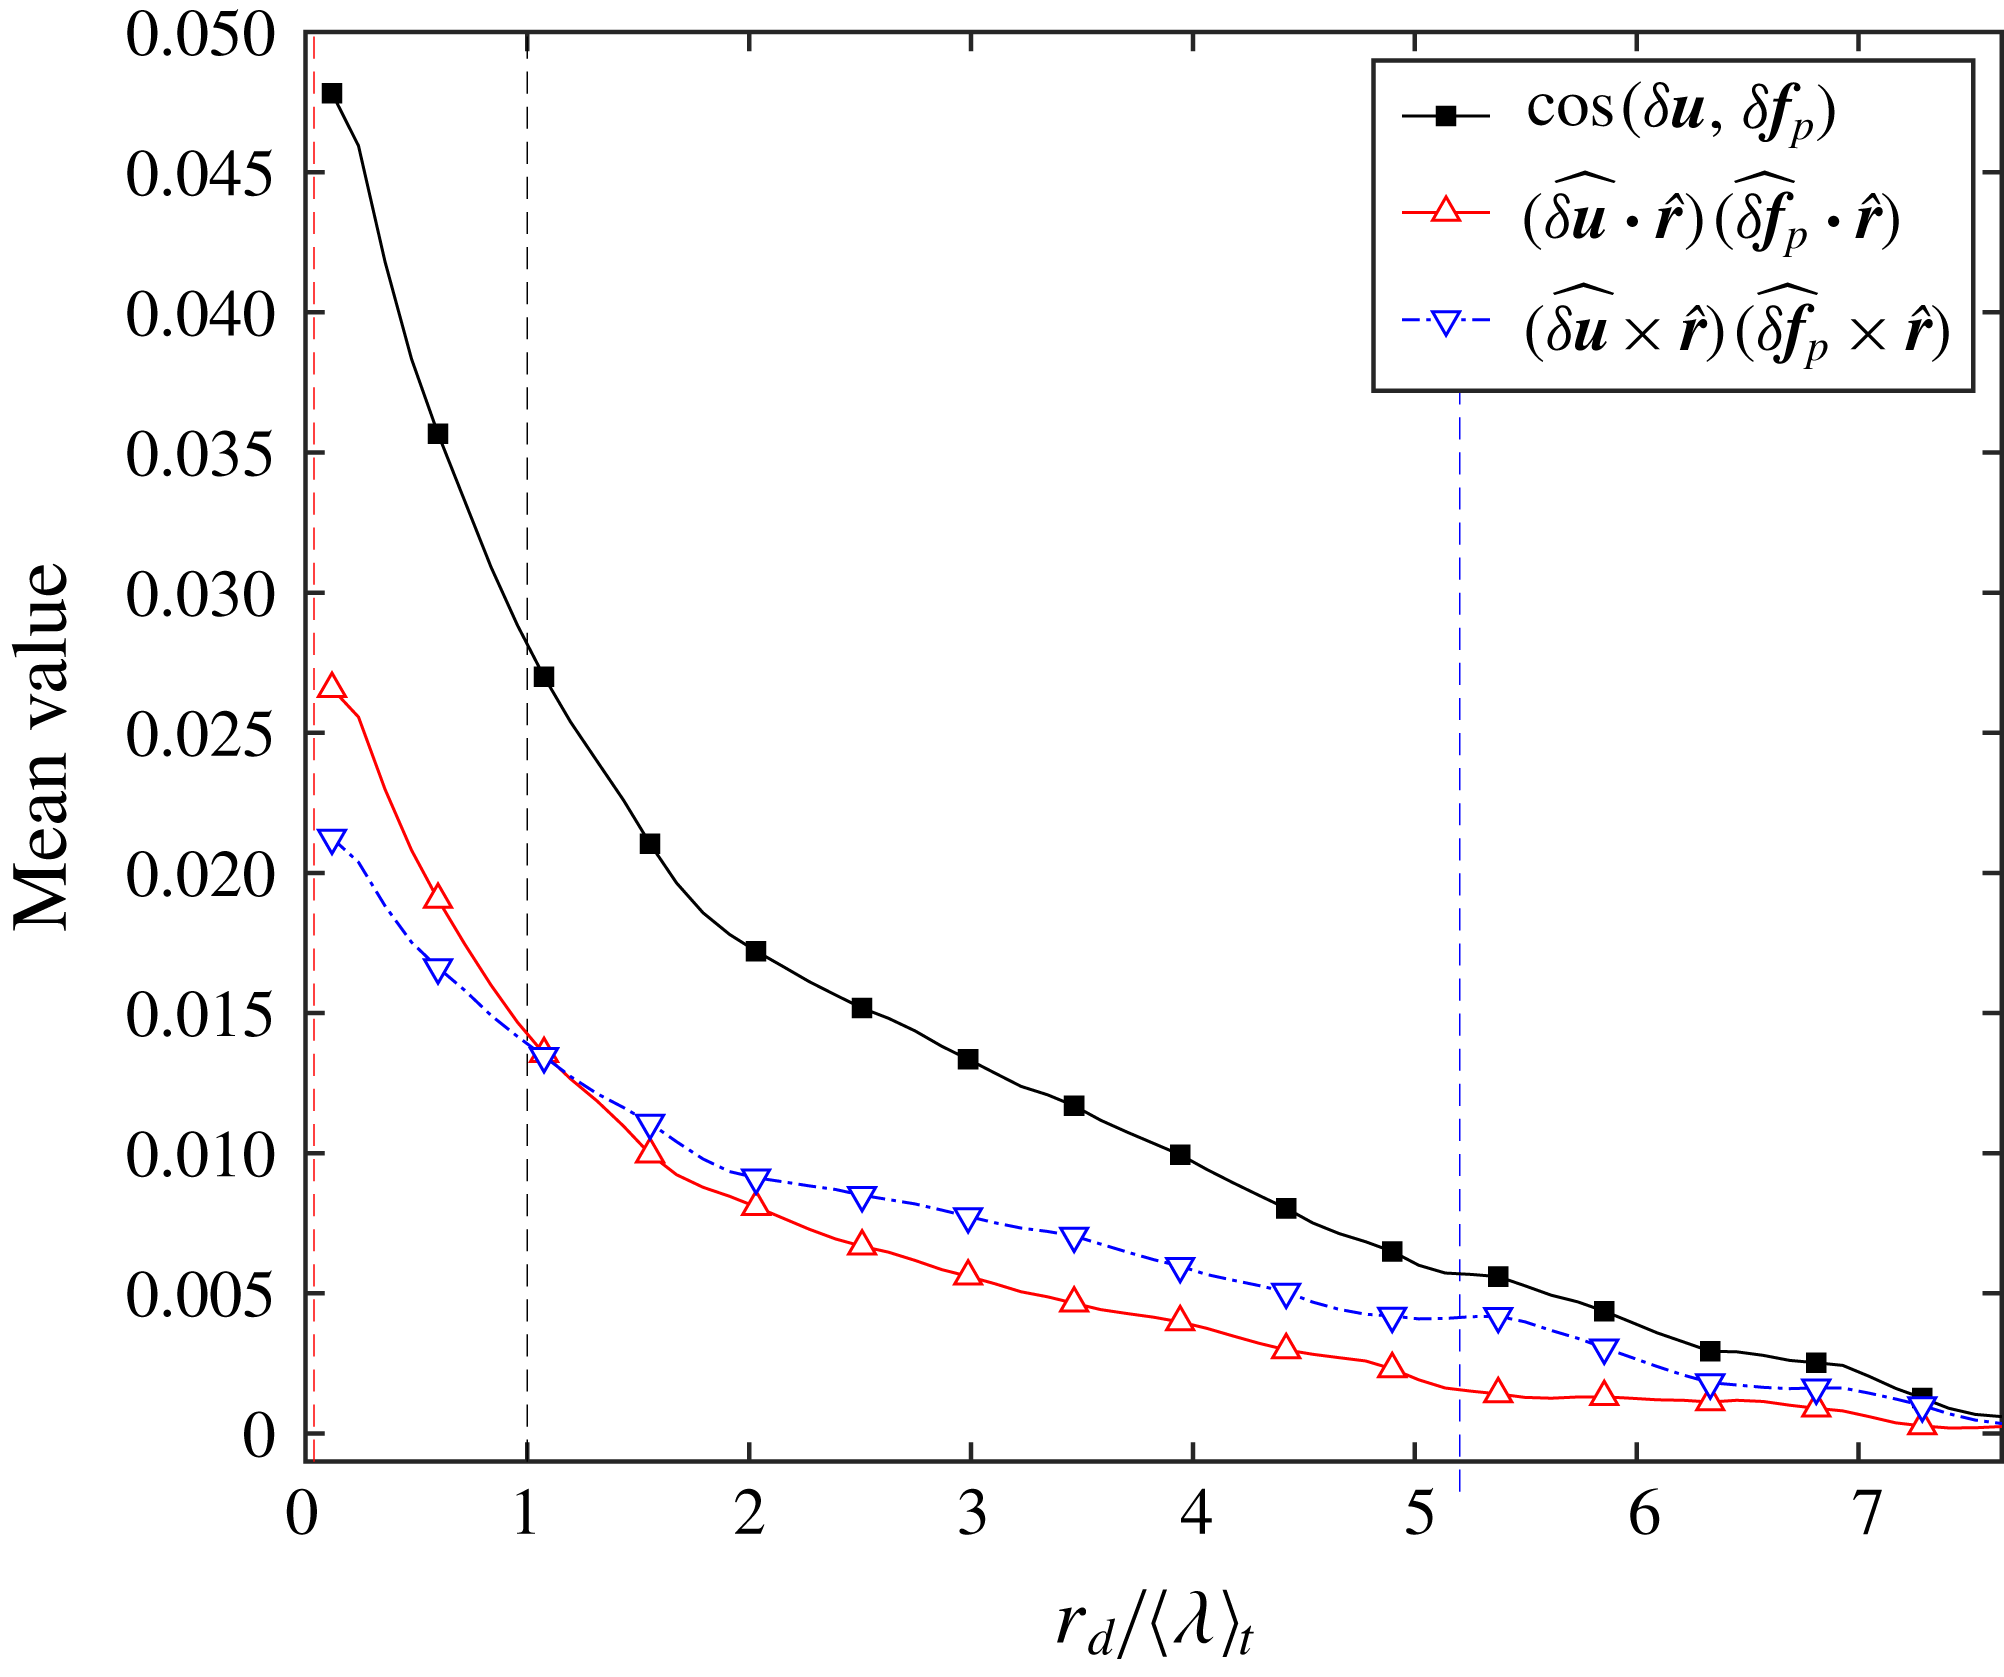
The mean values
 $\langle (\widehat{\unicode[STIX]{x1D6FF}\boldsymbol{u}}\boldsymbol{\cdot }\hat{\boldsymbol{r}})(\widehat{\unicode[STIX]{x1D6FF}\boldsymbol{f}_{p}}\boldsymbol{\cdot }\hat{\boldsymbol{r}})\rangle _{all}$
and
 $\langle (\widehat{\unicode[STIX]{x1D6FF}\boldsymbol{u}}\times \hat{\boldsymbol{r}})\boldsymbol{\cdot }(\widehat{\unicode[STIX]{x1D6FF}\boldsymbol{f}_{p}}\times \hat{\boldsymbol{r}})\rangle _{all}$
are both positive at all scales
 $r_{d}$
smaller than
 $\langle L\rangle _{t}$
, and are in fact increasing with decreasing scale in this range (see figure 11). It is clear that the small positive value of
 $\langle \cos \unicode[STIX]{x1D719}\rangle _{all}$
results from small positive values of both
 $\langle (\widehat{\unicode[STIX]{x1D6FF}\boldsymbol{u}}\boldsymbol{\cdot }\hat{\boldsymbol{r}})(\widehat{\unicode[STIX]{x1D6FF}\boldsymbol{f}_{p}}\boldsymbol{\cdot }\hat{\boldsymbol{r}})\rangle _{all}$
and
 $\langle (\widehat{\unicode[STIX]{x1D6FF}\boldsymbol{u}}\times \hat{\boldsymbol{r}})\boldsymbol{\cdot }(\widehat{\unicode[STIX]{x1D6FF}\boldsymbol{f}_{p}}\times \hat{\boldsymbol{r}})\rangle _{all}$
, the former being significantly larger than the latter. The fact that
 $\langle (\widehat{\unicode[STIX]{x1D6FF}\boldsymbol{u}}\boldsymbol{\cdot }\hat{\boldsymbol{r}})(\widehat{\unicode[STIX]{x1D6FF}\boldsymbol{f}_{p}}\boldsymbol{\cdot }\hat{\boldsymbol{r}})\rangle _{all}$
is small but positive means that there is a small tendency for the pressure force to act in accordance with the local interscale energy transfer on average, i.e. it has a compressing effect when the interscale transfer is down the scales and a stretching effect when the interscale transfer is up the scales. The opposite happens too, but slightly less often. This small imbalance creates an average picture for the terms in equation (4.3) which, when combined with the negative average value of
 $\unicode[STIX]{x1D6F1}$
, suggests an average interscale energy transfer from large to small scales that is accompanied by a small compressive effect by the pressure forces.
The fluctuating picture, however, is once again significantly different as can be seen from the positive correlation between the fluctuations of
 $\cos \unicode[STIX]{x1D719}$
and the fluctuations of
 $\unicode[STIX]{x1D6F1}$
in figure 9. We found similar positive correlations (as functions of
 $r_{d}/\langle \unicode[STIX]{x1D706}\rangle _{t}$
) between
 $(\widehat{\unicode[STIX]{x1D6FF}\boldsymbol{u}}\boldsymbol{\cdot }\hat{\boldsymbol{r}})(\widehat{\unicode[STIX]{x1D6FF}\boldsymbol{f}_{p}}\boldsymbol{\cdot }\hat{\boldsymbol{r}})$
and
 $\unicode[STIX]{x1D6F1}$
on the one hand and between
 $(\widehat{\unicode[STIX]{x1D6FF}\boldsymbol{u}}\times \hat{\boldsymbol{r}})\boldsymbol{\cdot }(\widehat{\unicode[STIX]{x1D6FF}\boldsymbol{f}_{p}}\times \hat{\boldsymbol{r}})$
and
 $\unicode[STIX]{x1D6F1}$
on the other (not plotted here for economy of space). Even though the average of every term in (4.3) is positive (albeit small) and the average of
 $\unicode[STIX]{x1D6F1}$
is negative (albeit also small compared to the fluctuations of
 $\unicode[STIX]{x1D6F1}$
), there is some correlation between negative/positive localised values of
 $\unicode[STIX]{x1D6F1}$
and negative/positive localised values of
 $\cos \unicode[STIX]{x1D719}$
,
 $(\widehat{\unicode[STIX]{x1D6FF}\boldsymbol{u}}\boldsymbol{\cdot }\hat{\boldsymbol{r}})(\widehat{\unicode[STIX]{x1D6FF}\boldsymbol{f}_{p}}\boldsymbol{\cdot }\hat{\boldsymbol{r}})$
and
 $(\widehat{\unicode[STIX]{x1D6FF}\boldsymbol{u}}\times \hat{\boldsymbol{r}})\boldsymbol{\cdot }(\widehat{\unicode[STIX]{x1D6FF}\boldsymbol{f}_{p}}\times \hat{\boldsymbol{r}})$
. The fluctuating picture is therefore, partly, opposite to the average one because it contains instances of events with negative
 $\unicode[STIX]{x1D6F1}$
which correlate with negative values of every term in (4.3), in other words a significant number of cases where the pressure force has a stretching effect even though the interscale transfer is most likely down the scales. This is opposite to the average picture presented at the end of the previous paragraph.
PDFs of (a)
 $(\widehat{\unicode[STIX]{x1D6FF}\boldsymbol{u}}\boldsymbol{\cdot }\hat{\boldsymbol{r}})(\widehat{\unicode[STIX]{x1D6FF}\boldsymbol{f}_{p}}\boldsymbol{\cdot }\hat{\boldsymbol{r}})$
and (b)
 $(\widehat{\unicode[STIX]{x1D6FF}\boldsymbol{u}}\times \hat{\boldsymbol{r}})\boldsymbol{\cdot }(\widehat{\unicode[STIX]{x1D6FF}\boldsymbol{f}_{p}}\times \hat{\boldsymbol{r}})$
obtained from sampling over
 $\boldsymbol{X}$
,
 $t$
and
 $\hat{\boldsymbol{r}}$
for a given
 $r_{d}=|\boldsymbol{r}|$
. The PDFs are normalised by
 $1/\unicode[STIX]{x1D70E}$
where
 $\unicode[STIX]{x1D70E}$
is the standard deviation of the quantity plotted on the abscissa. Different curves correspond to different values of
 $r_{d}$
as shown in the inset. The vertical line indicates the average (a)
 $\langle (\widehat{\unicode[STIX]{x1D6FF}\boldsymbol{u}}\boldsymbol{\cdot }\hat{\boldsymbol{r}})(\widehat{\unicode[STIX]{x1D6FF}\boldsymbol{f}_{p}}\boldsymbol{\cdot }\hat{\boldsymbol{r}})\rangle _{all}$
and (b)
 $\langle (\widehat{\unicode[STIX]{x1D6FF}\boldsymbol{u}}\times \hat{\boldsymbol{r}})\boldsymbol{\cdot }(\widehat{\unicode[STIX]{x1D6FF}\boldsymbol{f}_{p}}\times \hat{\boldsymbol{r}})\rangle _{all}$
.
 $\langle Re_{\unicode[STIX]{x1D706}}\rangle _{t}=178$
but these plots are very similar for
 $\langle Re_{\unicode[STIX]{x1D706}}\rangle _{t}=80.9$
.

Values of
 $\langle \cos \unicode[STIX]{x1D719}\rangle _{all}$
,
 $\langle (\widehat{\unicode[STIX]{x1D6FF}\boldsymbol{u}}\boldsymbol{\cdot }\hat{\boldsymbol{r}})(\widehat{\unicode[STIX]{x1D6FF}\boldsymbol{f}_{p}}\boldsymbol{\cdot }\hat{\boldsymbol{r}})\rangle _{all}$
and
 $\langle (\widehat{\unicode[STIX]{x1D6FF}\boldsymbol{u}}\times \hat{\boldsymbol{r}})\boldsymbol{\cdot }(\widehat{\unicode[STIX]{x1D6FF}\boldsymbol{f}_{p}}\times \hat{\boldsymbol{r}})\rangle _{all}$
as functions of
 $r_{d}/\langle \unicode[STIX]{x1D706}\rangle _{t}$
. The three dashed vertical lines indicate the positions on the abscissa of
 $\langle \unicode[STIX]{x1D702}\rangle _{t}$
,
 $\langle \unicode[STIX]{x1D706}\rangle _{t}$
and
 $\langle L\rangle _{t}$
.
 $\langle Re_{\unicode[STIX]{x1D706}}\rangle _{t}=178$
but this plot is very similar for
 $\langle Re_{\unicode[STIX]{x1D706}}\rangle _{t}=80.9$
.

5 Conclusions
The average picture of interscale energy transfers in statistically stationary periodic turbulence is very different from the fluctuating picture which hides behind it. Whereas only the interscale energy transfer rate, the energy input rate, the turbulence dissipation rate and the viscous diffusion in two-point separation space feature in the average picture, the fluctuating picture contains intense and intermittent fluctuations of all the terms in the KHMH equation (2.1), including the time derivative, transport and pressure–velocity terms, all of which average out to zero. In fact the most intense fluctuations are those of the time derivative and the transport terms, followed closely by the fluctuations of the interscale energy transfer rate and the pressure–velocity terms (figure 5). The fluctuations of each one of these four terms are much more intense than the fluctuations of the turbulence dissipation rate which has been known to be highly intermittent since the 1950s (Batchelor & Townsend Reference Batchelor and Townsend1949; Kolmogorov Reference Kolmogorov1962; Vincent & Meneguzzi Reference Vincent and Meneguzzi1991; Frisch Reference Frisch1995).
More importantly, perhaps, many of these fluctuations are correlated. These correlations result from the sweeping effect and the link between nonlinearity and non-locality. The sweeping effect introduces correlations between the time-derivative term
 ${\mathcal{A}}_{t}$
and terms having their origin in the convective nonlinearity of the Navier–Stokes equation, namely the transport term
 ${\mathcal{T}}$
, the interscale energy transfer rate (with a minus sign for a positive correlation)
 $-\unicode[STIX]{x1D6F1}$
and
 ${\mathcal{T}}-\unicode[STIX]{x1D6F1}$
. It is important to realise that the interscale energy transfer and related cascade dynamics expressed by
 $\unicode[STIX]{x1D6F1}$
decorrelate from the sweeping effect with decreasing length scales and increasing Reynolds number. In these limits, the sweeping effect’s partial cancellation is assumed mainly or exclusively through the correlation between
 ${\mathcal{A}}_{t}$
and
 ${\mathcal{T}}$
.
The link between nonlinearity and non-locality which exists in incompressible Navier–Stokes flow is expressed in the significant correlations between the pressure–velocity term
 ${\mathcal{T}}_{p}$
and each of
 $\unicode[STIX]{x1D6F1}$
,
 ${\mathcal{T}}$
and
 $\unicode[STIX]{x1D6F1}-{\mathcal{T}}$
. The sweeping and the nonlinear/non-local link effects are separate in that
 ${\mathcal{A}}_{t}$
and
 ${\mathcal{T}}_{p}$
are uncorrelated at all scales. In the limit of small length scales larger than the average Taylor micro-scale (i.e. within what might be termed the inertial range at high enough Reynolds number values) and also as the Reynolds number grows, the correlation with the pressure fluctuations via
 ${\mathcal{T}}_{p}$
is increasing with the interscale transfer rate
 $\unicode[STIX]{x1D6F1}$
and diminishing with the transport term
 ${\mathcal{T}}$
. The fluctuating pressure has therefore an important role to play in the interscale energy transfer and the energy cascade.
The role of the two-point fluctuating pressure force difference on energy exchanges in
 $\boldsymbol{r}$
-space and interscale energy transfers in particular is manifest in the geometrical alignments that it has with the two-point fluctuating velocity difference. These alignments can be decomposed in two parts (see (4.3)), one directly concerned with interscale, including cascade, events and the other with reorientation events in
 $\boldsymbol{r}$
-space. The fluctuating pressure force is involved in both processes and can have a compressing or a stretching effect on either backscatter or forward cascade events in a way that contributes to correlation statistics and even mean values such as those of figure 11.
It is clear that the average picture of the cascade and interscale exchanges in
 $\boldsymbol{r}$
-space does not represent much of the actual physical processes involved even in statistically stationary periodic turbulence. It makes little sense to try to model an unrepresentative average picture rather than attempt to directly model the underlying physics which appear when the clouding effects of averages are lifted. In the case of large eddy simulations, for example, it will be important to supplement existing subgrid modelling approaches, which may have some realism in only part of the flow, with models based on conditional statistics and cross-scale correlations involving various processes, including fluctuating pressure forces. Our results concerning fluctuations, intermittency and the presence of relatively rare but powerful events also suggest the need for further studies of two-point correlations between fluctuating velocity gradients, pressure gradients and fluctuating velocities. Such studies directly impact on correlations between fluctuating velocities and fluctuating pressure forces which need to be modelled in Reynolds stress transport models.
Acknowledgements
We thank Professor S. Goto for letting us use his parallelised pseudo-spectral DNS code for periodic turbulence. We also acknowledge support from ERC Advanced Grant no. 320560.