1. Introduction
The Cretaceous (145–66 Ma) represents the greenhouse period in Earth’s geological history (Huber et al. Reference Huber, Norris and MacLeod2002; Sketon et al. Reference Sketon, Spicer, Kelly and Gilmour2003; Sames et al. Reference Sames, Wagreich, Wendler, Haq, Conrad, Melinte-Dobrinescu, Hu, Wendler, Wolfgring, Yilmaz and Zorina2016; Hay, Reference Hay2017; O’Brien et al. Reference O’Brien, Robinson, Pancost, Damsté, Schouten, Lunt, Alsenz, Bornemann, Bottini, Brassell, Farnsworth, Forster, Huber, Inglis, Jenkyns, Linnert, Litter, Markwick, McAnena, Mutterlose, Naafs, Püttmann, Sluijs, Van Helmonde, Vellekoop, Wagner and Wrobel2017; Xi et al. Reference Xi, Wan, Li and Li2019). Sea levels have been relatively high for the past 250 Ma (Haq, Reference Haq2014). The Cretaceous Period witnessed a series of major global geological and ecological events, such as the emplacement of major igneous provinces (Jones & Jenkyns, Reference Jones and Jenkyns2001; Wu et al. Reference Wu, Lin, Wilde, Zhang and Yang2005; He et al. Reference He, Wang, Jin, Zhou, Wang, Yang, Ding, Boven and Zhu2006; Zhang et al. Reference Zhang, Chen, Yu, Dong, Yang, Pang and Batt2011, Reference Zhang, Zhou, Zhou, Yu, He and Gao2018; Jiang et al. Reference Jiang, Bagas and Liang2015; Li & Matsuka, Reference Li and Matsuoka2015; Li & Bengtson, Reference Li and Bengtson2018), oceanic anoxic events (Leckie et al. Reference Leckie, Bralower and Cashman2002; Wang et al. Reference Wang, Hu, Sarti, Scott and Li2005; Jenkyns, Reference Jenkyns2010), biomass evolution and extinction of clusters (Hardenbol et al. Reference Hardenbol, Thierry, Farley, Jacquint, de Graciansky, Vail, de Graciansky, Hardenbol, Jacquin and Vail1998; Wan et al. Reference Wan, Wignall and Zhao2003; Ogg & Hinnov, Reference Ogg, Hinnov, Gradstein, Ogg and Schmitz2012; Haq, Reference Haq2014; Ogg et al. Reference Ogg, Ogg and Gradstein2016; Zhang et al. Reference Zhang, Zhou, Zhou, Yu, He and Gao2018). In addition, the global source rocks were formed predominantly in this period (Irving et al. Reference Irving, North and Couillard1974; Klemme & Ulmishek, Reference Klemme and Ulmishek1991; Wang & Hu, Reference Wang and Hu2005). The Cretaceous Period has therefore been a research hotspot for global academic community. Eastern China underwent extensive tectonic activity during the Cretaceous Period; the formation of oil and gas resources and metallic minerals in the region has further focused research (Zhou et al. Reference Zhou, Yang and Zhang2003, Reference Zhou, Zhang, Liang, Li and Yue2015, Reference Zhou, Zhou, Ma, Zhang, Dong, Gu, Yin, Li and Liang2018; Zhai et al. Reference Zhai, Zhu, Liu, Meng, Hou, Hu, Liu, Li and Zhang2004; Wu et al. Reference Wu, Lin, Wilde, Zhang and Yang2005; Qiu et al. Reference Qiu, Ren, Cao and Zhang2010; Lü et al. Reference Lü, Wang and Zhang2011; Wang et al. Reference Wang, Chang, Lü and Zhang2014 a; Zhang et al. Reference Zhang, Li, Yan, Zeng, Lu, Zhang, Hui, Jin and Tang2017 b; Zhang, Reference Zhang2017; Xie et al. Reference Xie, Tang, Xia, Wang, Li, Yang and Sun2019).
The sedimentary rocks along the eastern coast of Shandong Province are dominated by clastic and volcanoclastic sediments, thereby receiving increased attention in recent years (Zhai et al. Reference Zhai, Zhu, Liu, Meng, Hou, Hu, Liu, Li and Zhang2004; Lü et al. Reference Lü, Wang and Zhang2011; Wang et al. Reference Wang, Chang, Lü and Zhang2014 a; Zhou et al. Reference Zhou, Zhang, Liang, Li and Yue2015, Reference Zhou, Zhou, Ma, Zhang, Dong, Gu, Yin, Li and Liang2018). These sedimentary strata are bordered by the Qingdao–Wulian Fault Zone to the west and are adjacent to the Jiaolai Basin; they therefore been regarded as the continental strata of the Jiaolai Basin. The clastic rocks had initially been assumed to have belonged to the Laiyang Group and the volcanoclastic rocks to the Qingshan Group (SDGM, 1991). However, Zhou et al. (Reference Zhou, Zhang, Liang, Li and Yue2015) indicated that the sedimentary rocks along the eastern coast of Shandong Province were formed in a distinct coastal rift basin setting, namely the Riqingwei Basin.
The study of the Cretaceous strata deposited in the coastal rift basin (Zhou et al. Reference Zhou, Zhang, Liang, Li and Yue2015) of Shandong Province in eastern China, located along the junction of North China and Yangtze Cratons, is conducive to revealing the sedimentary, tectono-magmatic evolution and resource prospects in this area. Lingshan Island is located towards the SW of the rift basin. Lü et al. (Reference Lü, Wang and Zhang2011) first discovered the Early Cretaceous flysch deposits and collapsing folds on the island and proposed that they represented a residual ocean basin situated between the Yangtze Block and North China Block. Since then, many scholars have carried out extensive research on the formational ages (Zhang et al. Reference Zhang, Lü, Li, Wang, Zhang, Dong, Zhang, Huang, Shu and Ren2013; Wang et al. Reference Wang, Chang, Lü and Zhang2014 a; Zhou et al. Reference Zhou, Zhang, Liang, Li and Yue2015), sedimentary characteristics (Lü et al. Reference Lü, Wang and Zhang2011, Reference Lü, Zhang, Wang, Dong, Dong and Zhang2012; Zhong, Reference Zhong2012; Shao et al. Reference Shao, Zhong, Li, Mao, Liu, Ni, Tian, Cui, Liu, Wang, Li and Lin2014; Zhou et al. Reference Zhou, Zhang, Liang, Li and Yue2015; Yang et al. Reference Yang, Cao, Friis, Liu and Wang2018 b; Yuan et al. Reference Yuan, Xie, Dong, Shan, Zhou, Wu, Yu and Zhong2019), tectonic characteristics (Lü et al. Reference Lü, Wang and Zhang2011; Zhou et al. Reference Zhou, Zhang, Liang, Li and Yue2015, Reference Zhou, Zhou, Ma, Zhang, Dong, Gu, Yin, Li and Liang2018), soft sedimentary deformational structures (Yang et al. Reference Yang, Fan, Han and Van Loon2016; Ge & Zhong, Reference Ge and Zhong2018; Liang et al. Reference Liang, Zhou and Van Loon2018; Yang et al. Reference Yang, Cao, Friis, Liu and Wang2018 b; Li et al. Reference Li, Zhu, Li, Gong and Pan2019), palaeontology (Zhang et al. Reference Zhang, Cheng and Liu2001; Lü et al. Reference Lü, Wang and Zhang2011, Reference Lü, Zhang, Wang, Dong, Dong and Zhang2012; Li et al. Reference Li, Zhang, Zhao, Sun, Zhang, Zhang, Xu, Wei and Liu2017) and geochemistry (Zhang et al. Reference Zhang, Zhou, Peng, Yu, Yue, Zhou and Liu2017 c) of the outcrops on Lingshan Island. Only the upper portions of the Laiyang Group are exposed on Lingshan Island while the majority remain buried, rendering it difficult to conduct studies on the provenance, tectonic setting and palaeo-environment of these sections. Despite the research so far, the depositional environment of the sedimentary strata on Lingshan Island still remains controversial. The depositional environment can be classified into two categories: marine depositional environment (Lü et al. Reference Lü, Wang and Zhang2011; Zhang et al. Reference Zhang, Lü, Li, Wang, Zhang, Dong, Zhang, Huang, Shu and Ren2013; Zhou et al. Reference Zhou, Zhang, Liang, Li and Yue2015; Yang et al. Reference Yang, Fan, Han and Van Loon2016, Reference Yang, Fan, Han and Van Loon2017, Reference Yang, Fan, Van Loon, Han and Zavala2018 a) and continental depositional environment (Shao et al. Reference Shao, Zhong, Li, Mao, Liu, Ni, Tian, Cui, Liu, Wang, Li and Lin2014; Li et al. Reference Li, Zhang, Zhao, Sun, Zhang, Zhang, Xu, Wei and Liu2017, Reference Li, Zhu, Li, Gong and Pan2019; Gao & Li, Reference Gao and Li2019; Zhang et al. Reference Zhang, Li, Yan, Wang and Geng2019).
Previously published research has been mainly focused on basin evolution and sedimentology. There are also still many controversies regarding the palaeo-environmental conditions of Riqingwei Basin. This study is therefore designed to conduct research through geochemical analytical methods to clarify the provenance, tectonic setting, palaeoclimate and palaeoredox conditions in the study area. The geochemistry of the clastic rocks is constrained by the composition of the source area, weathering conditions, transport mechanisms, sedimentary environments and post-depositional processes (Johnsson, Reference Johnsson1993). The content, characteristic ratios and relative discriminative functions of major and trace elements in clastic rocks can therefore be used to analyse the source area, revealing the ancient weathering conditions and sedimentary environment of the source area (Middleton, Reference Middleton1962; Potter, Reference Potter1978; Nesbitt & Young, Reference Nesbitt and Young1982; Bhatia, Reference Bhatia1983; Bhatia & Crook, Reference Bhatia and Crook1986; Roser & Korsch, Reference Roser and Korsch1986, Reference Roser and Korsch1988; Floyd & Leveridge, Reference Floyd and Leveridge1987; McLennan et al. Reference McLennan, Taylor, McCulloch and Maynard1990, Reference McLennan, Hemming, McDaniel and Hanson1993; Toyoda et al. Reference Toyoda, Nakamura and Masuda1990; Arthur & Sageman, Reference Arthur and Sageman1994; Cox et al. Reference Cox, Lowe and Cullers1995; Hayashi et al. Reference Hayashi, Fujisawa, Holland and Ohmoto1997; Young & Nesbitt, Reference Young and Nesbitt1999; Singh & Rajamani, Reference Singh and Rajamani2001; Cao et al. Reference Cao, Wu, Chen, Hu, Bian, Wang and Zhang2012; Armstrong-Altrin et al. Reference Armstrong-Altrin, Nagarajan, Madhavaraju, Rosalea-Hoz, Lee, Balaram, Cruz-Martínez and Avila-Ramírez2013, Reference Armstrong-Altrin, Machain-Castillo, Rosales-Hoz, Carranza-Edwards, Sanchez-Cabeza and Ruiz-Fernandez2015 a, b, Reference Armstrong-Altrin, Lee, Kasper-Zubillaga and Trejo-Ramírez2017). In this study, the geochemical data describing siltstones and mudstones from outcrops and Lingke-1 core, deposited in the Laiyang Group on Lingshan Island, have been analysed to understand the general geology (e.g. provenance, tectonic setting and palaeo-environment) of the group.
2. Geological setting
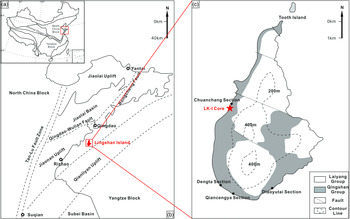
Lingshan Island, situated in the western region of the Yellow Sea (35° 45' 1.45'' N, 120° 09' 48.39'' E), approximately 40.7 km SE of Qingdao City, Shandong Province, eastern China (Fig. 1a, b) (Liang et al. Reference Liang, Zhou and Van Loon2018), lies adjacent to the Riqingwei Basin, a newly discovered eastern Shandong offshore basin (Zhou et al. Reference Zhou, Zhang, Liang, Li and Yue2015). The island has an area and altitude of approximately 7.66 km2 and 513.6 m, respectively (Yang et al. Reference Yang, Cao, Liu, Zhou and Jin2019; Zhang et al. Reference Zhang, Li, Yan, Wang and Geng2019). Lingshan Island, originated from compression and tilt (Luan et al. Reference Luan, Li, Wang, Li and Xie2010), is marked by a set of thick rhyolites developed in the middle of Lingshan Island. The lower part of the rhyolite is the Lower Cretaceous Laiyang Group, and the Qingshan Group developed above the rhyolite (Wang et al. Reference Wang, Chang, Lü and Zhang2014 a; Zhou et al. Reference Zhou, Zhang, Liang, Li and Yue2015; Zhang et al. Reference Zhang, Zhou, Peng, Yu, Yue, Zhou and Liu2017 c, Reference Zhou, Zhou, Ma, Zhang, Dong, Gu, Yin, Li and Liang2018).
Tectonic map and stratigraphic distribution of Lingshan Island, and grological position of the Lingke-1 core (LK-1 core). (a) Simplified map of China showing major blocks and its boundaries (modified after Yang et al. Reference Yang, Cao, Liu, Zhou and Jin2019). (b) Geological map of east Shandong (modified after Zhang et al. Reference Zhang, Zhou, Zhou, Yu, He and Gao2018). (c) Geological map of Lingshan Island with distributions of Lingke-1 core and outcrops (modified after Yang et al. Reference Yang, Cao, Liu, Zhou and Jin2019).

The Riqingwei Basin, formed during Late Mesozoic time, is characterized by thick gravity-flow deposits (Zhou et al. Reference Zhou, Zhang, Liang, Li and Yue2015; Zhang et al. Reference Zhang, Zhou, Zhou, Yu, He and Gao2018). NE–SW-trending, it is separated from the Jiaolai Basin by the Wulian–Qingdao Fault to the north, from the North China Block by the Tan–Lu Fault to the west, and from the Qianliyan Uplift by the Qianliyan Fault to the south (Fig. 1b). The tectonic activity of the Riqingwei Basin can be divided into four stages (Zhou et al. Reference Zhou, Zhang, Liang, Li and Yue2015, Reference Zhou, Zhou, Ma, Zhang, Dong, Gu, Yin, Li and Liang2018; Yang et al. Reference Yang, Cao, Liu, Zhou and Jin2019): (1) an initial stage of rifting and subsidence along the NW–SE direction in the early and middle periods of Early Cretaceous time (Laiyang Group sedimentary period); (2) a further rifting stage with large-scale volcanic activity in the middle and late stages of Early Cretaceous time (Qingshan Group sedimentary period); (3) a stage of uplift in which the lower Wangshi Group was subjected to denudation during late Early Cretaceous time and early Late Cretaceous time; and (4) a final stage of regional compressional intensification leading to rifted basin development during 85–58 Ma. The two main stratigraphic units exposed on Lingshan Island are, from the bottom up, the Laiyang Group and the Qingshan Group. The Laiyang Group is mainly composed of interbedded grey mudstones and deepwater sediment gravity-flow siltstones and sandstones of varying thickness, and the Qingshan Group is composed of rhyolites and pyroclastic rocks (Zhou et al. Reference Zhou, Zhang, Liang, Li and Yue2015, Reference Zhou, Zhou, Ma, Zhang, Dong, Gu, Yin, Li and Liang2018; Zhang et al. Reference Zhang, Zhou, Peng, Yu, Yue, Zhou and Liu2017 c, Reference Zhou, Zhou, Ma, Zhang, Dong, Gu, Yin, Li and Liang2018; Liang et al. Reference Liang, Zhou and Van Loon2018; Yang et al. Reference Yang, Cao, Liu, Zhou and Jin2019).
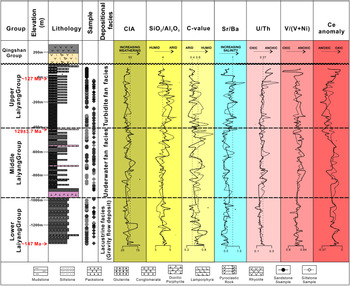
The Lingke-1 core (35° 45' 41.36'' N, 120° 09' 16.31'' E) (Fig. 1c) was drilled in 2018 to further clarify the overall geological characteristics of the Laiyang Group deposited on Lingshan Island. The 1352-m-deep core comprises extremely thick interbedded mudstones, siltstones and fine-grained sandstones, and two sets of basal intrusive rocks developed at 418–430.4 m and 923.1–979.3 m. Ongoing magnetostratigraphic and cyclostratigraphic research show that the age of deepest stratigraphy of the Lingke-1 may be 147 Ma, which also means that bottom strata in the core contain part of the Upper Jurassic strata. The secondary-ion mass spectrometry (SIMS) U–Pb zircon age analysis of Lamprophyres, identified at a depth of 420 m, assigns an age of 129 ± 3.7 Ma to the upper middle Laiyang Group. The SIMS U–Pb zircon age of sediments at a depth of 20 m is about 125 Ma. On the outcrops, the boundary between Laiyang Group and Qingshan Group was formed at 126–125 Ma (Zhou et al. Reference Zhou, Zhang, Liang, Li and Yue2015). Based on the location of the two sets of basic intrusive rocks, the sedimentary sequences in the well can be divided into fan delta facies, underwater fan facies and turbidite fan facies (Yuan et al. Reference Yuan, Xie, Dong, Shan, Zhou, Wu, Yu and Zhong2019) (Fig. 2).
Schematic stratigraphy and depositional environment of the Lingke-1 core, including vertical variations of some related parameters (e.g. CIA, SiO2/Al2O3, C-value, Sr/Ba, U/Th, V/(V+Ni) and Ce anomaly). Sample depths are indicated on the columns. The horizontal dashed lines represent the boundaries among the lower part, the middle part and the upper part of the Laiyang Group. Dots represent siltstone samples and rhomboids represent mudstone samples.

3. Analytical methods
A total of 144 bulk samples were collected from the Lingke-1 core, which was drilled by the Eighth Institute of Geology and Mineral Exploration of Shandong Province, over a depth interval of 0–1350.5 m. Twelve representative siltstone samples were also collected from the four fresh outcrops on Lingshan Island: Diaoyutai, Dengta, Qiancengyan and Chuanchang sections. A total of 166 unweathered samples were selected, among which 90 were siltstones and 76 were mudstones. All samples belong to the Laiyang Group. Elemental analyses of the siltstones and mudstones were conducted at the laboratory of the Eighth Institute of Geology and Mineral Exploration of Shandong Province. The samples were first sawed into small chips to expose the inner uncracked fresh parts of the rocks. All samples were powdered to a size less than 200 meshes using an agate mortar. The major elements were mixed with cosolvent and oxidant and melted, and were then measured by PANanalytical AXIOS X-ray fluorescence spectrometry (XRF) with the relative standard deviation (RSD) of major oxides being less than 5%. For trace-element analysis, sample powders were dissolved using a mixture of HF and HNO3. After samples were heated to 190°C for 48 hours, the trace elements and rare earth elements (REEs) were determined by a Thermo Scientific inductively coupled plasma mass spectrometer (ICP-MS, equipment model ICAP Qc). The RSD of trace elements was observed to be within 10%. Standard samples for the analysis of major- and trace-element composition are Chinese national rock standards (GBW07106, GBW07107, GBW07108, GBW07120, GBW07302a, GBW07304a and GBW07308a). The major and trace elements were analysed as per procedures described by Kimura (Reference Kimura1998) and Qi et al. (Reference Qi, Hu and Gregoire2000), respectively. The major- and trace-element compositions of the siltstones and mudstones are listed in online Supplementary Tables S1–S6 (available at http://journals.cambridge.org/geo).
4. Results
Based on the grain sizes and mud contents, the samples were divided into two groups: siltstones and mudstones. The elemental geochemistry of the two types of rocks is discussed in the following sections.
4.a. Major elements
Online Supplementary Tables S1 and S2 provide a comparison of major elemental concentrations of the study samples with the Post-Archean Australian Average Shale (PAAS) (Taylor & McLennan, Reference Taylor and McLennan1985). The siltstones and mudstones are found to be enriched with major elements, Si and Al, which is in agreement with the abundance of quartz, feldspar and clay minerals in the thin-sections of the samples. For siltstones, the SiO2 content ranges from 43.56 to 69.77 wt% with a median value of 57.14 wt%, and for mudstones ranges from 44.52 to 67.58 wt% with a median of 55.53 wt%. Al2O3 content ranges from 9.10 to 21.56 wt% with a median value of 13.47 wt%, and from 7.81 to 16.37 wt% with a median of 13.75 wt%, for siltstones and mudstones, respectively (online Supplementary Tables S1 and S2). The siltstones have higher contents of TFe2O3, CaO, Na2O and MgO compared with PAAS. Mudstones have TFe2O3, CaO, Na2O and MgO contents similar to siltstones. For siltstones and mudstones, the content of K2O (1.66–6.70 wt% and 1.76–5.48 wt%, respectively) is slightly lower than PAAS. The other oxides, including TiO2, P2O5 and MnO, have contents lower than 1 wt%.
4.b. Trace elements
Twenty-one trace elements with concentrations lower than 0.1 wt% (1000 ppm) are listed in online Supplementary Tables S3 and S4. The elements abundant in siltstones and mudstones (> 100 μg g–1) are Ba, Sr, Zr and Rb.
The concentrations of REEs (including Y), light rare earth elements (LREEs), heavy rare earth elements (HREEs), LREE/HREE, ΣREE and Eu and Ce anomalies are listed in online Supplementary Tables S5 and S6. The LREEs include the series La to Eu, and HREEs include the series Gd to Eu. The REE concentrations of siltstones and mudstones generally vary from 0.197 to 138.532 μg g–1 and from 0.189 to 116.312 μg g–1, respectively, with median values of 14.825 μg g–1 and 15.346 μg g–1, and are lower in value than those of PAAS (211.76 μg g–1) (Taylor & McLennan, Reference Taylor and McLennan1985) and North American Shale Composite (167.4 μg g–1) (Gromet et al. Reference Gromet, Dymek, Haskin and Korotev1984). The abundance of LREEs in samples from Lingke-1 core are apparently higher than those of the HREEs, with the LREE/HREE ratios for siltstones and mudstones ranging over 8.33–14.41 (average of 11.46) and 9.17–13.20 (average of 11.01), respectively.
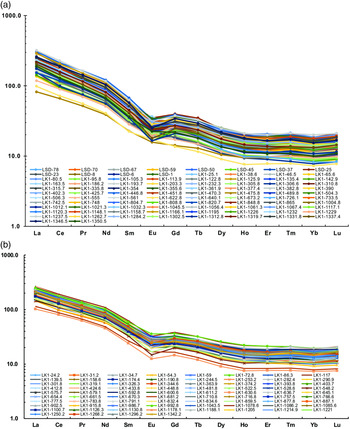
In this study, the siltstones and mudstones were chondrite-normalized to show the REE distribution patterns (Fig. 3) (Sun & McDonough, Reference Sun and McDonough1989). The LREE patterns show a significantly inclined trend, whereas the HREEs exhibit a flat trend. The siltstones demonstrate the significantly negative Eu anomaly (Eu anomalies = log[2×EuN/(SmN+GdN)]) fluctuating from −0.27 to 0.03 in siltstones, with a median of −0.13. Eu anomalies in mudstone vary from −0.30 to −0.01, with a median value of −0.15. Moreover, as seen in Figure 2, the siltstones exhibit slightly negative Ce anomalies (Ce anomalies = log[2×CeN/(LaN+PrN)]) (−0.08 to 0.00, average, −0.04). Ce anomalies in the mudstones show the same trend as those in the siltstones (−0.07 to −0.01, average, −0.03). The siltstones yield LaN/YbN, LaN/SmN and GdN/YbN ratios (where N represents chondrite-normalized element) of 8.28–23.37 (average, 15.77), 3.50–6.27 (average, 4.66) and 1.43–2.87 (average, 2.04), respectively; the corresponding ratios for mudstones are 11.13–19.80 (average, 14.57), 4.11–5.16 (average, 4.50) and 1.57–2.47 (average, 1.96), respectively. These parameters indicate that the samples are LREE enriched and HREE depleted.
Chondrite-normalized pattern of REEs of (a) siltstones and (b) mudstones from Lingke-1 core. Chondrite values are from Sun & McDonough (Reference Sun and McDonough1989).

4.c. Enrichment factor
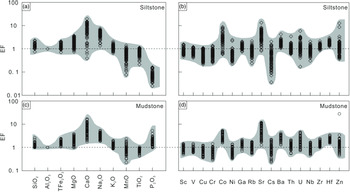
The enrichment factor (EF), defined as (X/Al)sample/(X/Al)PAAS, where X and PAAS represent the element content and Post-Archean Australian Shale, respectively, can be used to estimate the degree of enrichment of elements in sediments. EF > 1 indicates an enrichment of elements, whereas EF < 1 indicates a depletion relative to PAAS. Major-element EF values of siltstones and mudstones from Lingke-1 core are depicted in Figure 4. Both the siltstones and mudstones show enrichment in Si, Fe, Mg, Ca, Na and K elements. Low TiO2 contents show different values in siltstones and mudstones (0.15–1.15 wt%, average, 0.44 wt%; 0.27–0.78 wt%, average, 0.57 wt%, respectively) along with EF values of TiO2 indicating depletion (EFsiltstone = 0.21–1.07 and EFmudstone = 0.43–1.03).
(a, c) Major- and (b, d) trace-element enrichment factors (EF) of siltstones and mudstones from Lingke-1 core.

A few selected trace-element EF values for siltstones and mudstones are shown in Figure 4. Trace elements detected in siltstones and mudstones samples include Co, Ga, Ba, Th, U, Zr and Hf; all samples exhibit average EF > 1. Furthermore, the trace elements in siltstones and mudstones (Sc, V, Cu, Cr, Ni, Rb, Cs and Nb) have average EF ≤ 1. Other elements (Sr and Zn) have a wider EF range. The trace-element variation patterns of the siltstones are similar to the variation patterns of the mudstones.
5. Discussion
5.a. Provenance
5.a.1. Type of source rocks
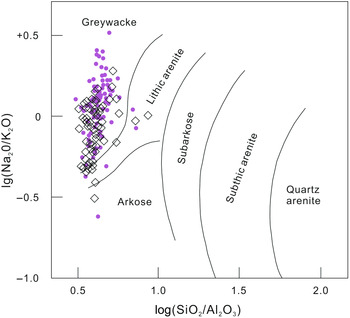
Major elements were employed for chemical classification of sedimentary rocks in the region (Pettijohn & Potter, Reference Pettijohn and Potter1972; Das et al. Reference Das, Al-Mikhlafi and Kaur2006). The SiO2/Al2O3 ratio (Potter, Reference Potter1978) reflects the abundance of quartz, clay and feldspars, whereas the Na2O/K2O ratio provided an index of chemical maturity (Pettijohn & Potter, Reference Pettijohn and Potter1972). The bivariate diagram log(Na2O/K2O) versus log(SiO2/Al2O3) reveals the rock types of sediments (Pettijohn & Potter, Reference Pettijohn and Potter1972). In this diagram, siltstones and mudstones from Lingke-1 core dominantly plot on the graywacke field, with a few plots on the lithic arenite and arkose field (Fig. 5). Based on these results, the lithology of the samples in the study area is inferred to be graywacke.
Geochemical diagrams of rock types for samples from the Lingke-1 core. Dots represent siltstone samples, and rhomboids represent mudstone samples. (Base map: Pettijohn and Potter, Reference Pettijohn and Potter1972).

The geochemical characteristics of sediments provide valuable information about their provenance (Wilson et al. Reference Wilson, Jenkyns, Elderfield and Larson1998; Verma & Armstrong-Altrin, Reference Verma and Armstrong-Altrin2013, Reference Verma and Armstrong-Altrin2016; Armstrong-Altrin et al. Reference Armstrong-Altrin, Nagarajan, Balaram and Natalhy-Pineda2015 b, Reference Armstrong-Altrin, Lee, Kasper-Zubillaga and Trejo-Ramírez2017; Madhavaraju, Reference Madhavaraju2015; Wang et al. Reference Wang, Wilde, Li and Yang2015, Reference Wang, Fu, Feng, Song, Wang, Chen and Zeng2017 a, b, c, Reference Wang, Wang, Fu, Zhan, Armstrong-Altrin, Yu, Feng, Song, Chen and Zeng2018, Reference Wang, Yang, Siebel, Zhang, Zhang and Chen2020; Gholami et al. Reference Gholami-Zadeh, Adabi, Hisada, Hosseini-Barzi, Sadeghi and Ghassemi2017; Gao et al. Reference Gao, Feng, Zhang, Zhou, Jiao and Qin2018; Zhang et al. Reference Zhang, Zhou, Zhou, Yu, He and Gao2018; Ji et al. Reference Ji, Meng, Wan, Zhu, Ge, Zhang, Yang, Dong and Jing2019; Zeng et al. Reference Zeng, Wang, Chen, Fu, Feng, Song, Wang and Sun2019).
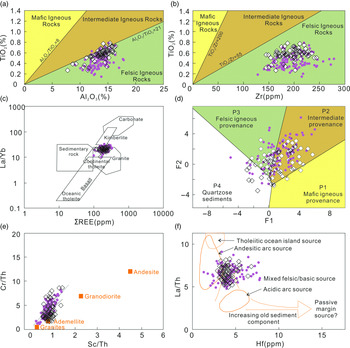
The ratios of major elements in clastic sediments have been used as an indicator for deducing the source-rock composition in previous research (Hayashi et al. Reference Hayashi, Fujisawa, Holland and Ohmoto1997; Armstrong-Altrin et al. Reference Armstrong-Altrin, Machain-Castillo, Rosales-Hoz, Carranza-Edwards, Sanchez-Cabeza and Ruiz-Fernandez2015 a, b; Bai et al. Reference Bai, Liu, Sun, Liu, Hu, Zhao and Xu2015; Ma et al. Reference Ma, Wang, Wang, Wu and Wei2015; Moradi et al. Reference Moradi, Sari and Akkaya2016; Wang et al. Reference Wang, Fu, Feng, Song, Wang, Chen and Zeng2017 a, b, c; Zeng et al. Reference Zeng, Wang, Chen, Fu, Feng, Song, Wang and Sun2019; Zhao et al. Reference Zhao, Dai, Nechaev, Nechaeva, Graham and French2019). For instance, Hayashi et al. (Reference Hayashi, Fujisawa, Holland and Ohmoto1997) reported that the mafic igneous rock provenances display Al2O3/TiO2 ratios varying from 3 to 8, whereas the intermediate igneous and felsic igneous rocks display ratios ranging over 8–21 and 21–70, respectively. The Al2O3/TiO2 ratios of siltstones and mudstones from Lingke-1 core exhibit similar geochemical characteristics, ranging over 18.69–94.70 (average, 34.47) and 18.39–43.75 (average, 24.91), respectively (online Supplementary Tables S7 and S8). The bivariate diagram of TiO2 versus Al2O3 (Fig. 6a) reveals that the samples in this study mainly originated from felsic igneous rocks. Moreover, the TiO2/Zr ratios display different traits in different igneous rocks. Mafic, intermediate and felsic igneous rocks are characterized by TiO2/Zr ratios of < 55, 55–220 and > 220, respectively (Hayashi et al. Reference Hayashi, Fujisawa, Holland and Ohmoto1997). TiO2/Zr ratios for siltstones and mudstones range over 6.77–56.60 (average, 22.43) and 13.40–41.73 (average, 26.93), respectively, indicating a uniform source area consisting of felsic igneous rocks (Fig. 6b) (online Supplementary Tables S7 and S8). The provenance of samples from Lingke-1 core can be estimated by the main element discriminative diagram F2–F1, proposed by Roser & Korsch (Reference Roser and Korsch1988). The diagram divides the properties of sediments into four categories, namely P1, P2, P3 and P4, which represent basic, intermediate, felsic and quartzose sediments, respectively. Samples in the study area dominantly plot in the P2 and P3 fields, meaning that the samples have been primarily derived from felsic and intermediate rocks (Fig. 6d).
Geochemical diagrams of source rocks for samples from the Lingke-1 core. Dots represent siltstone samples and rhomboids represent mudstone samples. Base map sources: (a, b) Hayashi et al. (Reference Hayashi, Fujisawa, Holland and Ohmoto1997); (c, d) Roser & Korsch (Reference Roser and Korsch1988); (e) Condie & Wronkiewicz (Reference Condie and Wronkiewicz1990); (f) Floyd & Leveridge (Reference Floyd and Leveridge1987). (d) F1 = (1.773TiO2) + (0.0607Al2O3) + (0.760TFe2O3) + (–1.500MgO) + (0.616CaO) + (0.509Na2O) + (–1.224K2O) + (–9.090); F2 = (0.445TiO2) + (0.070Al2O3) + (–0.25TFe2O3) + (–1.142MgO) + (0.438CaO) + (1.475Na2O) + (1.426K2O) + (–6.681).

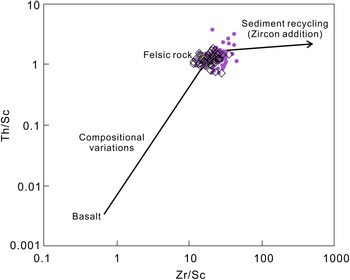
Trace elements (e.g. La, Th, Co, Sc, Cr and Hf) in clastic sediments remain unaffected by diagenesis and metamorphism because of immobility, thereby explaining the sediment sources (Bhatia & Crook, Reference Bhatia and Crook1986; Floyd & Leveridge, Reference Floyd and Leveridge1987; Condie & Wronkiewicz, Reference Condie and Wronkiewicz1990; Long et al. Reference Long, Sun, Yuan, Xiao and Cai2008; Sun et al. Reference Sun, Gui and Chen2012; Tao et al. Reference Tao, Sun, Wang, Yang and Jiang2014; Bai et al. Reference Bai, Liu, Sun, Liu, Hu, Zhao and Xu2015; Ma et al. Reference Ma, Wang, Wang, Wu and Wei2015; Moradi et al. Reference Moradi, Sari and Akkaya2016; Armstrong-Altrin et al. Reference Armstrong-Altrin, Lee, Kasper-Zubillaga and Trejo-Ramírez2017; Wang et al. Reference Wang, Fu, Feng, Song, Wang, Chen and Zeng2017 a, b, c). Element ratios and bivariate diagrams based on these elements can therefore effectively discriminate sediment sources. In addition, it has been considered that the elements La and Th are concentrated more in felsic rocks than in the mafic rocks, whereas the Co, Sc and Cr elements are concentrated more in the mafics than in the felsics (Armstrong-Altrin et al. Reference Armstrong-Altrin, Lee, Verma and Ramasamy2004, Reference Armstrong-Altrin, Lee, Kasper-Zubillaga and Trejo-Ramírez2017; Wang et al. Reference Wang, Wang, Fu, Zhan, Armstrong-Altrin, Yu, Feng, Song, Chen and Zeng2018). The Cr/Th, Co/Th, Sc/Th and La/Sc ratios therefore provide credible evidence for the provenance analysis of clastic sediments because of the substantial differences in felsic and mafic rocks (Condie & Wronkiewicz, Reference Condie and Wronkiewicz1990; Bai et al. Reference Bai, Liu, Sun, Liu, Hu, Zhao and Xu2015; Ma et al. Reference Ma, Wang, Wang, Wu and Wei2015; Wang et al. Reference Wang, Wang, Fu, Feng, Wang, Song, Chen and Zeng2017 b, c, Reference Wang, Wang, Fu, Zhan, Armstrong-Altrin, Yu, Feng, Song, Chen and Zeng2018). The bivariate diagram (Fig. 6e) of Cr/Th versus Sc/Th ratios shows that the siltstones and mudstones from Lingke-1 core plot within the felsic igneous rock area between the granites and granodiorites and adjacent to the PAAS (online Supplementary Tables S7 and S8). The Cr/Th ratios of all samples largely correlate with Sc/Th ratios and show a linear relationship, which indicates that: (1) the Cr/Th ratios are mainly controlled by the source; and (2) there may be mixed felsic source rocks revealing detrital input domination (Condie & Wronkiewicz, Reference Condie and Wronkiewicz1990). The La/Th versus Hf diagram proposed by Floyd & Leveridge (Reference Floyd and Leveridge1987) is widely used for interpreting the type of source rocks (Long et al. Reference Long, Sun, Yuan, Xiao and Cai2008; Sun et al. Reference Sun, Gui and Chen2012; Tao et al. Reference Tao, Sun, Wang, Yang and Jiang2014; Bai et al. Reference Bai, Liu, Sun, Liu, Hu, Zhao and Xu2015; Moradi et al. Reference Moradi, Sari and Akkaya2016; Armstrong-Altrin et al. Reference Armstrong-Altrin, Lee, Kasper-Zubillaga and Trejo-Ramírez2017; Wang et al. Reference Wang, Wang, Fu, Zhan, Yu, Feng, Song, Chen and Zeng2017 c; Zhang et al. Reference Zhang, Zhou, Zhou, Yu, He and Gao2018; Fan et al. Reference Fan, Sun, Yang, Zhang, De, Nenzhelele, Li, Liu, Zhou and Yuan2019; Hippertt et al. Reference Hippertt, Caxito, Uhlein, Nalini, Sial, Abreu and Nogueira2019). Siltstones and mudstones from Lingke-1 core plot on the field of mixed felsic/basic source rocks on this diagram (Fig. 6f; online Supplementary Tables S7 and S8). The La/Yb versus ΣREE diagram proposed by Roser & Korsch (Reference Roser and Korsch1988) has also been applied to deduce the source-rock type (Bai et al. Reference Bai, Liu, Sun, Liu, Hu, Zhao and Xu2015; Wang et al. Reference Wang, Wang, Fu, Zhan, Yu, Feng, Song, Chen and Zeng2017 c, Reference Wang, Zhang, Lin, He, Kou and Zhou2019). The diagram for this study indicates that siltstones and mudstones from Lingke-1 core predominantly originated from granitic source rocks (Fig. 6c) (online Supplementary Tables S7 and S8). The cross-plot of Zr/Sc and Th/Sc (Fig. 7) also shows that the samples have been chiefly derived from felsic rocks. Furthermore, the sources of sedimentary rocks can be inferred from the relative REE patterns and the size of the Eu anomaly (Taylor & McLennan, Reference Taylor and McLennan1985; Wronkiewicz & Condie, Reference Wronkiewicz and Condie1989). Felsic igneous rocks correspond to higher LREE/HREE ratios and negative Eu anomalies, whereas mafic igneous rocks correspond to lower LREE/HREE ratios and slightly positive Eu anomalies (Cullers, Reference Cullers1994; Cullers & Podkovyrov, Reference Cullers and Podkovyrov2000; Roddaz et al. Reference Roddaz, Viers, Brusset, Baby, Boucayrand and Herail2006; Kasanzu et al. Reference Kasanzu, Maboko and Manya2008; Moradi et al. Reference Moradi, Sari and Akkaya2016; Armstrong-Altrin et al. Reference Armstrong-Altrin, Lee, Kasper-Zubillaga and Trejo-Ramírez2017; Wang et al. Reference Wang, Wang, Fu, Zhan, Yu, Feng, Song, Chen and Zeng2017 c). Siltstones and mudstones from Lingke-1 core contain higher LREE/HREE ratios (8.33–14.41, average, 11.46; and 9.17–13.20, average, 11.01, respectively) and significant Eu anomalies (−0.27 to 0.03, average, −0.13; and −0.30 to −0.01, average, −0.15, respectively), supporting a possible felsic igneous rock source.
Geochemical diagram of sedimentary recycling for samples from the Lingke-1 core. Dots represent siltstone samples and rhomboids represent mudstone samples. Base map source: McLennan et al. (Reference McLennan, Hemming, McDaniel and Hanson1993).

All the results indicate that the siltstones and mudstones from Lingke-1 core have been derived from felsic igneous rocks, with a possible mixture with intermediate igneous rocks. In addition, the gravels in the conglomerates have been identified as metamorphic rocks from the outfield. The original rocks of the samples may therefore also be of metamorphic origin.
Our data are consistent with existing provenance research, which reflects a distinct mixture of Sulu and Jiaobei terrane (Wang et al. Reference Wang, Chang, Lü and Zhang2014 a; Zhang et al. Reference Zhang, Zhou, Peng, Yu, Yue, Zhou and Liu2017 c). Moreover, the Precambrian metamorphic basement in this area is also one of the sources of the Riqingwei Basin. These materials enter the basin and produce different sedimentary facies with the evolution of the Riqingwei Basin (see details in Section 5.d.3).
5.a.2. Sedimentary recycling
Sedimentary sorting and recycling can lead to the enrichment of heavy minerals. Evaluating the trace elements mainly hosted by heavy minerals (e.g. Zr in zircon) is therefore a useful way to analyse sedimentary processes (McLennan et al. Reference McLennan, Hemming, McDaniel and Hanson1993; Ghosh & Sarkar, Reference Ghosh and Sarkar2010; Long et al. Reference Long, Yuan, Sun, Xiao, Wang, Cai and Jiang2012; Ma et al. Reference Ma, Wang, Wang, Wu and Wei2015; Zeng et al. Reference Zeng, Wang, Chen, Fu, Feng, Song, Wang and Sun2019). The Zr/Sc and Th/Sc ratios are used as useful parameters of the changes in heavy-mineral enrichment, sorting level and sediment composition (McLennan, Reference McLennan1993); in this study, these have served as indicators of the sorting and recycling of the provenance materials (McLennan et al. Reference McLennan, Hemming, McDaniel and Hanson1993) (Fig. 7). The Zr/Sc ratio of the siltstones and mudstones range from 12.19 to 44.77 (average, 23.64) and from 11.77 to 35.48 (average, 19.75), respectively (online Supplementary Tables S7 and S8). The Th/Sc ratio of the siltstones and mudstones vary from 0.72 to 3.69 (average, 1.36) and from 0.71 to 1.80 (average, 1.22), respectively. The cross-plot of Zr/Sc and Th/Sc (Fig. 7) ratios shows that the sorting and recycling of the sediments in the Laiyang Group was considerably less during the depositional processes, indicating that fine-grained clastic fractions in the sediments either originated from the older sedimentary units or experienced long-distance transportation (McLennan et al. Reference McLennan, Hemming, McDaniel and Hanson1993). The immature features of the samples and the related research that has been carried out (Zhang et al. Reference Zhang, Zhou, Peng, Yu, Yue, Zhou and Liu2017 c) indicate that the sediment on Lingshan Island experienced short-distance transportation. The provenance of Laiyang Group in Lingshan Island may therefore be the adjacent sedimentary units.
5.b. Tectonic setting
Previous studies have shown that major- and trace-element discrimination diagrams can allow the investigation of the tectonic setting of sedimentary basins (Middleton, Reference Middleton1962; Bhatia, Reference Bhatia1983; Roser & Korsch, Reference Roser and Korsch1986; Roy & Smykatz-Kloss, Reference Roy and Smykatz-Kloss2007; Ghosh & Sarkar, Reference Ghosh and Sarkar2010; Verma & Armstrong-Altrin, Reference Verma and Armstrong-Altrin2013, Reference Verma and Armstrong-Altrin2016; Wang et al. Reference Wang, Liu, Gao and Zhang2014 b).
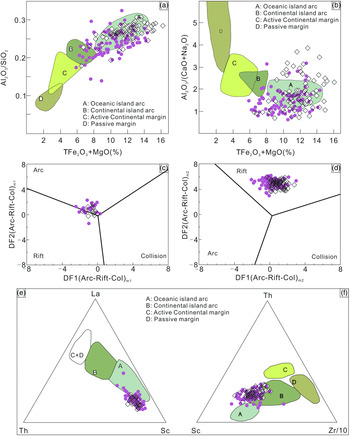
Major element composition bivariate diagrams of samples, such as K2O/Na2O versus SiO2, Al2O3/SiO2 versus (TFe2O3+MgO) and Al2O3/(CaO+Na2O) versus (TFe2O3+MgO), are extensively used to determine the tectonic setting of the source area (Bhatia, Reference Bhatia1983; Roser & Korsch, Reference Roser and Korsch1986). In the K2O/Na2O versus SiO2 diagram, the majority of the siltstone and mudstone samples from Lingke-1 core plot on the field of active continental margin (ACM) (Fig. 8a). However, in the Al2O3/SiO2 versus (TFe2O3+MgO) and Al2O3/(CaO+Na2O) versus (TFe2O3+MgO) diagrams, maximum samples in this study plot around the area of oceanic island arc (OIA) and a few around the ACM field (Fig. 8b).
Geochemical diagrams of tectonic setting for samples from the Lingke-1 core. Dots represent siltstone samples and rhomboids represent mudstone samples. (a) Al2O3/SiO2 versus TFe2O3 + MgO (Bhatia, Reference Bhatia1983). (b) Al2O3/(CaO+Na2O) versus TFe2O3 + MgO (Bhatia, Reference Bhatia1983). (c) Multi-major elements discriminant diagram for the high-silica sediments (Verma & Armstrong-Altrin, Reference Verma and Armstrong-Altrin2013). (d) Multi-major elements discriminant diagram for the low-silica sediments (Verma & Armstrong-Altrin, Reference Verma and Armstrong-Altrin2013). (e, f) La–Th–Sc, Th–Sc–(Zr/10) discriminant plots (Bhatia & Crook, Reference Bhatia and Crook1986). (d) Low-silica types: DF1(Arc-Rift-Col) = [0.608×ln(TiO2/SiO2)adj]+ [–1.854×ln(Al2O3/SiO2)adj] + [0.299×ln(TFe2O3/SiO2)adj] + [–0.550×ln(MnO/SiO2)adj] + [0.120×ln(MgO/SiO2)adj] + [0.194×ln(CaO/SiO2)adj] + [–1.510×ln(Na2O/SiO2)adj] + [1.941×ln(K2O/SiO2)adj] + [0.003×ln(P2O5/SiO2)adj] – 0.294; DF2(Arc-Rift-Col) = [–0.554×ln(TiO2/SiO2)adj] + [–0.995×ln(Al2O3/SiO2)adj] + [0.299×ln(TFe2O3/SiO2)adj] + [–1.391×ln(MnO/SiO2)adj] + [–1.034×ln(MgO/SiO2)adj] + [0.225×ln(CaO/SiO2)adj] + [0.713×ln(Na2O+SiO2)adj] + [0.330×ln(K2O/SiO2)adj] + [0.637×ln(P2O5/SiO2)adj] – 3.631. High-silica types: DF1(Arc-Rift-Col) = [–0.263×ln(TiO2/SiO2)adj] + [0.604×ln(Al2O3/SiO2)adj] + [–1.725×ln(TFe2O3/SiO2)adj] + [0.660×ln(MnO/SiO2)adj] + [2.191×ln(MgO/SiO2)adj] + [0.144×ln(CaO/SiO2)adj] + [–1.304×ln(Na2O/SiO2)adj] + [0.054×ln(K2O/SiO2)adj] + [–0.330×ln(P2O5/SiO2)adj] + 1.588; DF2(Arc-Rift-Col) = [–1.196×ln(TiO2/SiO2)adj] + [1.064×ln(Al2O3/SiO2)adj] + [0.303×ln(TFe2O3/SiO2)adj] + [0.436×ln(MnO/SiO2)adj] + [0.838×ln(MgO/SiO2)adj] + [–0.407×ln(CaO/SiO2)adj] + [1.021×ln(Na2O/SiO2)adj] + [–1.706×ln(K2O/SiO2)adj] + [–0.126×lnP2O5/SiO2)adj] – 1.068.

Identification diagrams based on major elements, proposed by Bhatia & Crook (Reference Bhatia and Crook1986) and Roser & Korsch (Reference Roser and Korsch1988), have been widely applied to discriminate the tectonic background of sedimentary basins. However, because of their low success rate for tectonic setting recognition, these traditional identification diagrams are now being used with extreme caution (Armstrong-Altrin & Verma, Reference Armstrong-Altrin and Verma2005; Verma & Armstrong-Altrin, Reference Verma and Armstrong-Altrin2013, Reference Verma and Armstrong-Altrin2016; Armstrong-Altrin et al. Reference Armstrong-Altrin, Nagarajan, Balaram and Natalhy-Pineda2015 b; Moradi et al. Reference Moradi, Sari and Akkaya2016; Wang et al. Reference Wang, Wang, Fu, Feng, Wang, Song, Chen and Zeng2017 b, c, Reference Wang, Wang, Fu, Zhan, Armstrong-Altrin, Yu, Feng, Song, Chen and Zeng2018). Recently, Verma & Armstrong-Altrin (Reference Verma and Armstrong-Altrin2013) proposed two new discriminant-function-based diagrams for tectonic setting discrimination based on the major-element compositions of Neogene–Quaternary sediments. Two functions were used for two different types of sediments: high silica ((SiO2)adj = 63–95%) and low silica ((SiO2)adj = 35–63%) (Verma & Armstrong-Altrin, Reference Verma and Armstrong-Altrin2013). (SiO2)adj refers to the SiO2 value obtained after the volatile-free adjustment to 100 wt% of ten major elements. The diagram divides the tectonic backgrounds of sediments into three categories: island arc, rift and collision. In this series of diagrams, high-silica siltstones and mudstones from Lingke-1 core dominantly plot within the field of arc and a few plot within the field of rift; all low-silica samples plot within the field of rift (Fig. 8c, d).
The La–Th–Sc and Th–Sc–(Zr/10) discriminatory plots were used in this study to further determine the tectonic background of the samples. In the La–Th–Sc ternary diagram, most of the samples plot around the field of OIA (Fig. 8e); however, in the Th–Sc–(Zr/10) ternary diagram, most samples plot around the field of continental island arc (Fig. 8f).
The Cretaceous Period witnessed important tectonic transformations in eastern China. Three main extensional and compressional movements occurred in the eastern part of Shandong Province during this period (Zhang et al. Reference Zhang, Li, Zhang, Dong and Yuan2008; Zhou et al. Reference Zhou, Zhang, Liang, Li and Yue2015, Reference Zhou, Zhou, Ma, Zhang, Dong, Gu, Yin, Li and Liang2018). Under the tectonic setting of ACM, basins developed trenches, foreland basins, intra-arc basins, back-arc basins and pull-apart basins associated with strike-slip faults. Under the tectonic setting of island arc (IA), sedimentary basins included front-arc basins, intra-arc basins and back-arc basins; their sediments were mainly derived from felsic igneous rocks (Bhatia & Crook, Reference Bhatia and Crook1986). The subducting Izanagi and Pacific plates had a great influence in eastern Shandong on the Laiyang Group. The combined effect of the WNW-subducting Izanagi Plate and the de-rooted Sulu Orogenic Belt led to lithospheric gravity isostatic adjustments, thereby forming the Riqingwei Basin (Zhang et al. Reference Zhang, Zhou, Zhou, Yu, He and Gao2018). Numerous Upper Jurassic and Lower Cretaceous igneous rocks have been discovered in the study area that display characteristic trends along the eastern margin of Eurasian Plate, from the eastern Siberian Block in the north to the eastern Yangtze Block in the south (Yang & Li, Reference Yang and Li2008; Reichow et al. Reference Reichow, Litvinovsky, Parrish and Saunders2010; Kim et al. Reference Kim, Yi, Jeong and Cheong2011; Donskaya et al. Reference Donskaya, Gladkochub, Mazukabzov and Ivano2013; Huang et al. Reference Huang, Li, Li and Li2013; Dong et al. Reference Dong, Zhang, Zhang, Cui, Chen, Zhang, Chen, Zhang, Miao, Li, Shi, Li, Huang and Li2015; Zhang et al. Reference Zhang, Zhou, Zhou, Yu, He and Gao2018). Various research has shown that these felsic igneous rocks were generated in the ACM setting (Liu et al. Reference Liu, Hu and Gao2008; Ma et al. Reference Ma, Jiang and Hofmann2014; Xue et al. Reference Xue, Santosh, Tsunogae and Yang2019).
Based on the above research we suggest that the Riqingwei Basin is a rift basin developed within IA and ACM settings. The presence of IA properties is an indication of the complex tectonic settings of this area, which also indicates a possible origin in marine basin.
5.c. Sources of rare earth elements
REEs are a class of elements with extremely similar chemical properties and low solubility. In addition, they exhibit extreme stability during weathering, erosion, transportation, deposition and early diagenesis. REEs can therefore be used as reliable parameters to trace the sediment sources and reveal the palaeo-environment (Toyoda et al. Reference Toyoda, Nakamura and Masuda1990; Singh & Rajamani, Reference Singh and Rajamani2001; Zhang et al. Reference Zhang, Li, Yan, Zeng, Lu, Zhang, Hui, Jin and Tang2017 a). The Ce anomaly is commonly applied as a proxy for seawaters; seawaters are enriched in LREE and HREE, but have low total REE concentrations (Murray et al. Reference Murray, ten Brink, Jones, Gerlach and Russ1990; Birk & White, Reference Birk and White1991; Xiao et al. Reference Xiao, Zhuang, Yi and Mao2012; Bai et al. Reference Bai, Liu, Sun, Liu, Hu, Zhao and Xu2015; Wang et al. Reference Wang, Wang, Fu, Zhan, Armstrong-Altrin, Yu, Feng, Song, Chen and Zeng2018). The REE abundances of siltstones and mudstones in this study are listed in online Supplementary Tables S5 and S6. Samples from Lingke-1 core exhibit slight Ce anomalies, indicating a possible marine origin.
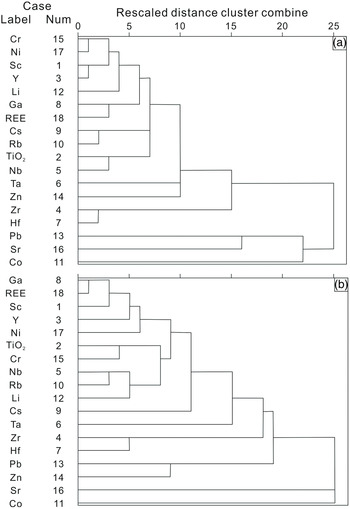
Siltstone and mudstone samples have similar chondrite-normalized REE patterns that show LREE enrichment, HREE depletion, and negative Eu and Ce anomalies, indicating that these samples have similar REE sources. Results from correlation analyses between REE, terrigenous (e.g. Rb, Ga, Cs, Ba, Th and U) and non-terrigenous elements (e.g. Cu, Ni and Sr) show a certain degree of correlation between ΣREE and the above elements. Mudstones show significant correlation between ΣREE and Ga element (R 2 = 0.69; n = 76). The REE may therefore have both marine and continental sources. To further substantiate the results, cluster analyses of REE with terrigenous (Li, Co, Zn and Cr), non-terrigenous elements (Sr and Ni), high-field-strength elements (HFSEs) (Sc, Ti, Y, Zr, Nb, Hf and Ta) and selected large-ion lithophile elements (LILEs) (e.g. Rb, Ga, Cs and Pb) were performed (Fig. 9). Previous studies show that the abovementioned HFSEs and LILEs were inactive during weathering processes and became mixed with REEs, followed by transportation and deposition (Taylor & McLennan, Reference Taylor and McLennan1985; Singh & Rajamani, Reference Singh and Rajamani2001; Bai et al. Reference Bai, Liu, Sun, Liu, Hu, Zhao and Xu2015). The results for siltstone samples (Fig. 9a) show that the ΣREEs have closer affinities with LILEs (e.g. Ga, Rb, Cs and Pb), HFSEs (e.g. Sc, Y and Ti) and terrigenous elements (e.g. Li and Cr), whereas results for mudstones (Fig. 9b) show that the ΣREE have closer affinities with LILEs (e.g. Ga), HFSEs (e.g. Sc and Y) and non-terrigenous elements (e.g. Ni). The combined analyses therefore indicate that the REEs in the siltstones and mudstones from Lingke-1 core have both marine and continental origins.
Cluster analysis of (a) siltstone and (b) mudstone samples from the Lingke-1 core.

5.d. Palaeo-environmental conditions
5.d.1. Palaeo-climatic conditions
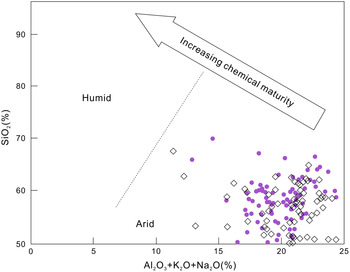
The degree of chemical weathering is attributed to the climatic conditions of source areas and can potentially be regarded as a method to study palaeoclimatic variations (Young & Nesbitt, Reference Young and Nesbitt1999). The proxy, CIA, has been extensively applied to reconstruct the palaeoclimatic conditions (Yan et al. Reference Yan, Chen, Wang and Wang2010; Bai et al. Reference Bai, Liu, Sun, Liu, Hu, Zhao and Xu2015; Fu et al. Reference Fu, Wang, Chen, Feng, Wang, Song and Zeng2015; Ma et al. Reference Ma, Wang, Wang, Wu and Wei2015; Wang et al. Reference Wang, Fu, Feng, Song, Wang, Chen and Zeng2017 a, b, c; Zeng et al. Reference Zeng, Wang, Chen, Fu, Feng, Song, Wang and Sun2019). The CIA values in the ranges 50–65, 65–85 and 85–100 correspond to cold and dry climate during low chemical weathering, warm and humid climate during moderate weathering, and hot and humid climate during strong chemical weathering, respectively (Nesbitt & Young, Reference Nesbitt and Young1982; Bock et al. Reference Bock, McLennan and Hanson1998; McLennan, Reference McLennan1993). The CIA values for siltstones and mudstones from Lingke-1 core are 23.74–60.97 (average, 40.18) and 26.53–54.55 (average, 42.16), respectively, indicating a cold and dry climate during low chemical weathering. The bivariate plot of SiO2 wt% versus (Al2O3 + K2O + Na2O) wt% can also be used to determine the climatic conditions during the sedimentation of the Laiyang Group (Suttner & Dutta, Reference Suttner and Dutta1986). In Figure 10, all the samples plot under the arid region.
Geochemical diagrams of palaeoclimate condition for samples from the Lingke-1 core. Dots represent siltstone samples and rhomboids represent mudstone samples. Base map source: Suttner & Dutta (Reference Suttner and Dutta1986).

To further validate the palaeoclimate during the Laiyang Group deposition, the SiO2/Al2O3 ratio and C-value (defined below) were used as palaeoclimate proxies (Zhang et al. Reference Zhang, Mu, Cui, Feng and Yang2007; Zhao et al. Reference Zhao, Zhao, Wang, Liao and Liu2007; Meng et al. Reference Meng, Liu, Bruch, Liu and Hu2012; Jia et al. Reference Jia, Liu, Bechtel, Strobl and Sun2013; Liang et al. Reference Liang, Tang, Xu, Tao, Li and Gou2014; Cao et al. Reference Cao, Guo, Shan, Ma and Sun2015; Fu et al. Reference Fu, Wang, Chen, Feng, Wang, Song and Zeng2016, Reference Fu, Li, Xu and Niu2018; Zhang, Reference Zhang2017). Combining the field observations and existing research (Yuan et al. Reference Yuan, Xie, Dong, Shan, Zhou, Wu, Yu and Zhong2019), the vertical profile developed for the Lingke-1 core can be divided into three parts: the lacustrine-facies lower Laiyang Group, the underwater-fan-facies middle Laiyang Group and the turbidite-fan-facies upper Laiyang Group. The SiO2/Al2O3 ratio and C-value display a sawtoothed pattern in the vertical profile. The SiO2/Al2O3 ratios of < 4 represent humid conditions with strong weathering, whereas those > 4 indicate arid conditions. The SiO2/Al2O3 ratios show a slight downwards trend in the lower part, an upwards trend in the middle part and a conspicuous downwards trend in the upper part (Fig. 2). This indicates a shift from arid conditions to humid conditions in the lower Laiyang Group; the climatic conditions later changed from humid to arid in the middle Laiyang Group and finally back to humid in the upper Laiyang Group.
Palaeoclimatic conditions can be successfully evaluated by quantitatively determining the C-value (Zhao et al. Reference Zhao, Zhao, Wang, Liao and Liu2007; Zhang, Reference Zhang2017; Zhang et al. Reference Zhang, Zhou, Zhou, Yu, He and Gao2018) as Σ(Fe+Mn+Cr+Ni+V+Co)/Σ(Ca+Mg+Sr+Ba+K+Na). C-values of < 0.2, 0.2–0.4, 0.4–0.6, 0.6–0.8 and > 0.8 indicate arid, semi-arid, semi-arid–semi-humid, semi-humid and humid conditions, respectively (Fig. 2; online Supplementary Tables S7 and S8); similar conditions are indicated from the values of the SiO2/Al2O3 ratio.
In conclusion, the palaeoclimatic conditions of the lower Laiyang Group transitioned from arid to humid, whereas those of the middle Laiyang Group were tending towards drought and back to humid conditions during the deposition of the upper Laiyang Group. According to Steuber et al. (Reference Steuber, Rauch, Masse, Graaf and Malkoč2005), the temperature increased sharply at the end of Barremian Age until reaching its maximum value at the boundary between the Barremian and Aptian ages, and then plunged sharply during the beginning of the Aptian Age. Consequently, the humid climate exhibited during the deposition of the upper Laiyang Group may be related to the variations in palaeotemperature.
5.d.2. Palaeoweathering
The weathering intensity of the source area can be quantitatively evaluated using the indicators such as CIA (Nesbitt & Young, Reference Nesbitt and Young1982; McLennan et al. Reference McLennan, Taylor, McCulloch and Maynard1990) and plagioclase index of alternation (PIA) (Fedo et al. Reference Fedo, Nesbitt and Young1995); these have been widely used in recent studies to estimate palaeoweathering conditions (McLennan et al. Reference McLennan, Hemming, McDaniel and Hanson1993; Armstrong-Altrin et al. Reference Armstrong-Altrin, Lee, Verma and Ramasamy2004, Reference Armstrong-Altrin, Nagarajan, Madhavaraju, Rosalea-Hoz, Lee, Balaram, Cruz-Martínez and Avila-Ramírez2013; Long et al. Reference Long, Yuan, Sun, Xiao, Wang, Cai and Jiang2012; Ma et al. Reference Ma, Wang, Wang, Wu and Wei2015; Verma & Armstrong-Altrin, Reference Verma and Armstrong-Altrin2016; Wang et al. Reference Wang, Fu, Feng, Song, Wang, Chen and Zeng2017 a, b, c, Reference Wang, Wang, Fu, Zhan, Armstrong-Altrin, Yu, Feng, Song, Chen and Zeng2018; Zhang et al. Reference Zhang, Zhou, Zhou, Yu, He and Gao2018; Zeng et al. Reference Zeng, Wang, Chen, Fu, Feng, Song, Wang and Sun2019). The proxies CIA and PIA are determined using mole proportions as follows:
 $${\rm{CIA}} = \left[ {{\rm{A}}{{\rm{l}}_{\rm{2}}}{{\rm{O}}_{\rm{3}}}/\left( {{\rm{A}}{{\rm{l}}_{\rm{2}}}{{\rm{O}}_{\rm{3}}} + {\rm{CaO}}* + {\rm{N}}{{\rm{a}}_{\rm{2}}}{\rm{O}} + {{\rm{K}}_{\rm{2}}}{\rm{O}}} \right)} \right] \times {\rm{1}}00$$
 $$\begin{align*}{\rm{PIA}} &= \left[ {\left( {{\rm{A}}{{\rm{l}}_{\rm{2}}}{{\rm{O}}_{\rm{3}}}-{{\rm{K}}_{\rm{2}}}{\rm{O}}} \right)/\left( {{\rm{A}}{{\rm{l}}_{\rm{2}}}{{\rm{O}}_{\rm{3}}}-{{\rm{K}}_{\rm{2}}}{\rm{O}} + {\rm{CaO}}* + {\rm{N}}{{\rm{a}}_{\rm{2}}}{\rm{O}}} \right)} \right]\\ &\quad \times {\rm{100}}\end{align*}$$
where CaO* represents the CaO abundance derived from silicate fraction (i.e. corrected for seawater salt). So far, there is no direct method available to quantify and distinguish the CaO content present in the silicate and non-silicate portions (Wang et al. Reference Wang, Fu, Feng, Song, Wang, Chen and Zeng2017 a, c; Zeng et al. Reference Zeng, Wang, Chen, Fu, Feng, Song, Wang and Sun2019). The CaO* content has been defined here as CaO* = CaO–(P2O5/3), adopting the definition of McLennan et al. (Reference McLennan, Hemming, McDaniel and Hanson1993). As per this principle, CaO* should be assumed to be the Na2O content when CaO* is lower than Na2O. The CIA values of siltstones and mudstones range over 23.74–60.97 (average, 40.18) and 26.53–54.55 (average, 42.16), respectively, which are less than that of PAAS (CIA = 70–75; online Supplementary Tables S7 and S8). The PIA reflects the weathering intensity of plagioclase. The PIA values of siltstones and mudstones in Lingke-1 core vary over 18.98–79.56 (average, 39.04) and 23.03–60.80 (average, 40.61), respectively, and are less than that of PAAS (PIA = 86; online Supplementary Tables S7 and S8). The CIA and PIA values therefore indicate a low degree of source weathering.
The index of compositional variability (ICV) also reflects the maturity of the source material for sedimentary rocks (Cox et al. Reference Cox, Lowe and Cullers1995). The proxy ICV is defined as follows:
 $${{\rm{ICV}} = \left( {{\rm{F}}{{\rm{e}}_{\rm{2}}}{{\rm{O}}_{\rm{3}}} + {{\rm{K}}_{\rm{2}}}{\rm{O}} + {\rm{N}}{{\rm{a}}_{\rm{2}}}{\rm{O}} + {\rm{CaO}} + {\rm{MgO}} + {\rm{MnO}} + {\rm{Ti}}{{\rm{O}}_{\rm{2}}}} \right)/{\rm{A}}{{\rm{l}}_{\rm{2}}}{{\rm{O}}_{\rm{3}}}}$$
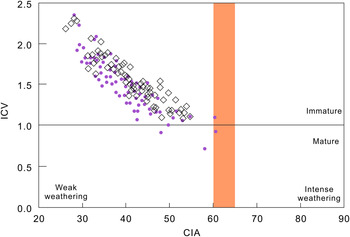
Clay minerals, which have lower ICV values, have higher Al2O3 and lower K2O, Na2O and CaO contents than non-clay minerals (such as feldspar) (Cox et al. Reference Cox, Lowe and Cullers1995). Clastic sedimentary rocks with low ICV values (ICV < 0.84) may therefore suggest mature provenances with a high percentage of clay minerals, which may further indicate recycled sediments in stable tectonic backgrounds (Van de Kamp & Leake, Reference Van de Kamp and Leake1985; Long et al. Reference Long, Yuan, Sun, Xiao, Wang, Cai and Jiang2012). In contrast, high ICV values (ICV > 0.84) represent an immature source in active margin settings. The ICV values of siltstones and mudstones were found to be in the ranges of 0.72–2.64 (average, 1.50) and 1.09–2.31 (average, 1.53), respectively, indicating an immature source (online Supplementary Tables S7 and S8). The ICV–CIA bivariate diagram of samples (Fig. 11) from the Lingke-1 core has been used to demonstrate the maturity and intensity of sediment weathering (Long et al. Reference Long, Yuan, Sun, Xiao, Wang, Cai and Jiang2012). In the ICV–CIA diagram (Fig. 11), the samples predominantly plot in the area formed by immaturity and weak weathering, indicating immature sediments and a low degree of source weathering. Comparing the EF results with PAAS, Fu et al. (Reference Fu, Wang, Tan, Feng, Wang and Song2012) suggested that the depletion of some trace elements (e.g. Sc, V, Cu, Cr, Ni, Rb, Cs and Nb) may be related to the chemical weathering of source rocks because they mainly exist in clay minerals.
Geochemical diagram of palaeoweathering for samples from the Lingke-1 core. Dots represent siltstone samples and rhomboids represent mudstone samples. Base map source: Long et al. (Reference Long, Yuan, Sun, Xiao, Wang, Cai and Jiang2012).

5.d.3. Palaeosalinity
The discriminant index, 100×MgO/Al2O3, can be used as an indicator to determine the palaeosalinity of the basins (Zhang, Reference Zhang1988; Zhang et al. Reference Zhang, Zhou, Zhou, Yu, He and Gao2018). An index of value < 1, 1–10 and > 10 denotes a freshwater environment, transitional environment and marine environment, respectively. The siltstones and mudstones from the Lingke-1 core contain high 100×MgO/Al2O3 values of 8.30–43.41 (average, 21.63) and 11.23–43.55 (average, 22.82), respectively, indicating that the sedimentary environment of Laiyang Group on Lingshan Island may be marine (online Supplementary Tables S7 and S8). The trace element V can also be applied as an indicator to estimate the palaeosalinity of the environment (Chen et al. Reference Chen, Chen and Zhang1997). A V concentration of < 86 ppm represents a marine depositional environment, whereas one of > 110 ppm represents a continental depositional environment. The V concentrations of the siltstones and mudstones vary over 37.99–130.76 ppm (median, 71.93 ppm) and 51.15–114.92 ppm (median, 83.36 ppm), respectively, indicating a marine depositional environment.
Conventionally, the Sr/Ba ratio has been used as a proxy to reconstruct the palaeosalinity of water columns (Chen et al. Reference Chen, Chen and Zhang1997; Zheng & Liu, Reference Zheng and Liu1999; Xu et al. Reference Xu, Ding, Wang and Liu2011; Cao et al. Reference Cao, Wu, Chen, Hu, Bian, Wang and Zhang2012; Meng et al. Reference Meng, Liu, Bruch, Liu and Hu2012; Yang et al. Reference Yang, Fan, Van Loon, Han and Zavala2018 a). The Sr/Ba ratio for sediments deposited in low-salinity water column is lower than 0.5, whereas that for sediments deposited in high-salinity water column is greater than 1 (Yue et al. Reference Yue, Dong, Zhang, Mu, Wang, Chen, Yuan, Liu and Wei2011; Zhong, Reference Zhong2012; Wang et al. Reference Wang, Fu, Feng, Song, Wang, Chen and Zeng2017 a). The Sr/Ba ratios of the siltstones and mudstones range over 0.14–1.91 (median, 0.63) and 0.15–1.89 (median, 0.64), respectively, suggesting a brackish-water depositional environment (online Supplementary Tables S7 and S8). In the vertical profile of the Lingke-1 core (Fig. 2), the curve of Sr/Ba displays a sawtooth shape. The inferences from the sedimentological and tectonic research suggest that the Riqingwei Basin started rifting along with the deposition of the lower Laiyang Group and reached the maximum degree of rifting during the deposition of the upper Laiyang Group. Based on the above research and the increasing trend of Sr/Ba, the sedimentary environment of the basin changed gradually from lacustrine to marine facies. According to the palaeosalinity changes indicated by Sr/Ba ratio, the Riqingwei Basin likely transformed into a marine basin during the deposition of the upper Laiyang Group. As Sr leached, the Sr/Ba ratio significantly decreased in the outcrop profile.
According to EF values, CaO and Na2O contents show enrichment, which may correspond to the abundance of dolomites, calcites and feldspars in the samples (Fu et al. Reference Fu, Wang, Tan, Feng, Wang and Song2012). EF values of TiO2 may imply the presence of low concentrations of heavy minerals such as Ti-bearing biotites in the samples. Geochemical characteristics of these elements are similar to those of modern seawater.
According to field observations, numerous salt crystals and high amounts of Na content have been precipitated in the lower sections of the well, which may have been the result of high-salinity protorocks or late hydrothermal brine metasomatism. The poor correlation between Na2O and Sr/Ba indicates that this phenomenon is independent of the high-salinity protorocks. It also confirms that the sedimentary environment of the lower strata in the well may be lacustrine. The 100×MgO/Al2O3 index, V concentrations and Sr/Ba ratios are mostly constant, suggesting a sedimentary environment with increasing salinity and a marine depositional environment for upper Laiyang Group.
Fish (Lecoptera sinensis Woodward) and conchostracan (Yanjiestheria Chen) fossils were discovered from Lower Cretaceous sedimentary strata of Lingshan Island, which are two typical elements of the Jehol Biota representing continental lacustrine fauna in North China (Li et al. Reference Li, Zhang, Zhao, Sun, Zhang, Zhang, Xu, Wei and Liu2017). The rock masses where continental lacustrine fossils were found are mainly exposed in the Dengta section and the surrounding areas on Lingshan Island. However, according to the sedimentary characteristics and syndepositional structures, they belong to the continental delta deposits surrounding the Riqingwei Basin. After the rock masses were affected by tectonic movement or sea-level changes, they slid down into the deepwater area of the Riqingwei Basin along an incised valley. Only continental fossils are therefore produced in the slip block area, while other areas are still marine sedimentary environments. Moreover, marine plant fossils were found in the Lower Cretaceous Laiyang Group in Lingshan Island (Lü et al. Reference Lü, Wang and Zhang2011, Reference Lü, Zhang, Wang, Dong, Dong and Zhang2012). Some specimens of Dasycladaceae, including Actinoporella podolica Alth, Salpingoporella sp., Dissocladella cretica Ott and Trinocladus perplexus Elliott were discovered in the Laiyang Group of Jiaonan region of southern Shandong Province, representing marine sedimentary environment (Zhang et al. Reference Zhang, Cheng and Liu2001).
5.d.4. Palaeoredox conditions
Manganese, due to its high sensitivity to redox conditions, has been conventionally used as a redox indicator (Quinby-Hunt & Wilde, Reference Quinby-Hunt and Wilde1994; Algeo & Maynard, Reference Algeo and Maynard2004; Pattan et al. Reference Pattan, Pearce and Mislankar2005; Tribovillard et al. Reference Tribovillard, Algeo, Lyons and Riboulleau2006; Wang et al. Reference Wang, Fu, Feng, Song, Wang, Chen and Zeng2017 a, c). Based on the iron, manganese and vanadium contents, four groups of redox conditions were proposed by Quinby-Hunt & Wilde (Reference Quinby-Hunt and Wilde1994). In Group 2, Mn reduces to soluble Mn2+ under anoxic conditions, resulting in the decline of Mn content, and its concentrations mainly change from 300 to 1300 ppm. The Mn concentrations of the siltstones and mudstones from the Lingke-1 core vary from 164.09 ppm to 1700.00 ppm (average, 772.72 ppm) and from 211.18 to 1560.71 ppm (average, 695.44 ppm), respectively (online Supplementary Tables S1 and S2), denoting an anoxic condition.
Through EF analysis, P2O5 contents in siltstones are significantly lower than PAAS, but show apparent enrichment in mudstones. This phenomenon may be related to biological activities. Ji et al. (Reference Ji, Yang, Zhu and Kang2021) show that phosphorus enrichment is closely related to an anoxic environment and organic matter flux. It is speculated that organisms play an indirect role in the phosphorus accumulation process.
In addition, trace elements such as U, V and Ni become enriched in anoxic conditions (Arthur & Sageman, Reference Arthur and Sageman1994; Algeo & Maynard, Reference Algeo and Maynard2004; Tribovillard et al. Reference Tribovillard, Algeo, Lyons and Riboulleau2006; Yuri et al. Reference Yuri, Eder and Zamirailova2008; Lézin et al. Reference Lézin, Andreu, Pellenard, Bouchez, Emmanuel, Fauré and Landrein2013; Zeng et al. Reference Zeng, Wang, Fu, Chen, Feng, Wang, Song and Wang2015; Wang et al. Reference Wang, Wang, Fu, Zhan, Armstrong-Altrin, Yu, Feng, Song, Chen and Zeng2018); trace-element ratios such as U/Th and V/(V+Ni) can be used as credible redox indicators (Hatck & Leventhal, Reference Hatck and Leventhal1992; Jones & Manning, Reference Jones and Manning1994; Wignall & Twitchett, Reference Wignall and Twitchett1996; Rimmer, Reference Rimmer2004). The U/Th ratios for sediments deposited in oxic conditions have values < 0.27, whereas those deposited in dysoxic conditions and anoxic environments have values of 0.27–0.50 and > 0.50, respectively (Wignall & Twitchett, Reference Wignall and Twitchett1996). The U/Th ratios of the siltstones and mudstones from the Lingke-1 core range over 0.06–0.57 (median, 0.25) and 0.15–0.67 (median, 0.26), respectively, indicating oxic–dyoxic conditions (online Supplementary Tables S7 and S8). Trace-element V/(V+Ni) ratios can also be applied to identify the palaeoredox conditions (Jones & Manning, Reference Jones and Manning1994; Rimmer, Reference Rimmer2004). Sediments deposited in a reducing environment have V/(V+Ni) ratios > 0.46, whereas those deposited in oxidizing conditions have ratios < 0.46 (Hatck & Leventhal, Reference Hatck and Leventhal1992). The U/Th ratios of the siltstones and mudstones from the Lingke-1 core range from 0.51 to 0.87 (average, 0.76) and from 0.63 to 0.82 (average, 0.75), respectively, suggesting that the sedimentary environments were anoxic (online Supplementary Tables S7 and S8). Vertical profiles of U/Th ratios and V/(V+Ni) ratios are illustrated in Figure 2 to further substantiate the changes in depositional environments in the study area. In this diagram, the U/Th and V/(V+Ni) ratios show a weak rise in the lower and middle Laiyang Group, while the U/Th ratios display a rise in the upper Laiyang Group and the V/(V+Ni) ratios exhibit a slightly declining trend in the upper Laiyang Group. It can be inferred from the U/Th ratios that the oxygen content gradually reduced during the formation of Laiyang Group. Furthermore, the results from the V/(V+Ni) ratios indicate that the palaeo-environmental conditions were anoxic, and the oxygen contents reached their minimum during the deposition of the top part of the middle Laiyang Group. The increase in U/Th may be related to the tectonic conditions during that period. The upper part of the Laiyang Group experienced intense tectonic uplift, resulting in large amounts of land-based materials being added to the basin and a rapidly increasing U/Th content.
The Ce anomaly in sediments is used as an indicator to trace palaeoredox conditions in water columns (German & Elderfield, Reference German and Elderfield1990; Wilde et al. Reference Wilde, Quinby-Hunt and Erdtmann1996; Shields & Stille, Reference Shields and Stille2001; Pattan et al. Reference Pattan, Pearce and Mislankar2005; Guo et al. Reference Guo, Shields, Liu, Strauss, Zhu, Pi, Goldberg and Yang2007). Positive Ce anomaly represents oxic depositional environments, whereas negative Ce anomaly represents suboxic/anoxic sedimentary environments (Nath et al. Reference Nath, Roelandts, Sudhakar and Pluger1992; Banakar & Jauhari, Reference Banakar and Jauhari1994; Pattan & Banakar, Reference Pattan and Banakar1997; Banakar et al. Reference Banakar, Parthiban, Pattan and Jauhari1998; Pattan & Jauhari, Reference Pattan and Jauhari2001; Pattan et al. Reference Pattan, Pearce and Mislankar2005). All samples in this study show negative Ce anomalies, indicating anoxic depositional environments that likely resulted from aridity (Wright et al. Reference Wright, Schrader and Holser1987; Och et al. Reference Och, Müller, Wichser, Ulrich, Vologina and Sturm2014). The declining trend of the Ce anomaly, as seen in Figure 2, is consistent with the increasing trend of U/Th and V/(V+Ni) ratios in the lower and middle Laiyang Group; the increasing trend of Ce anomaly is consistent with the declining trend of U/Th and V/(V+Ni) ratios in the upper Laiyang Group. The Latest Hauterivian Faraoni event, considered as an ocean anoxic event (OAE), occurred in the Tethys and Atlantic oceans and possibly further afield (Cecca et al. Reference Cecca, Marini, Pallini, Baudin and Begouen1993; Baudin, Reference Baudin2005; Bodin et al. Reference Bodin, Godet, Matera, Steinmann, Vermeulen, Gardin, Adatte, Coccioni and Föllmi2007; Jenkyns, Reference Jenkyns2010). Based on the age of the Lingke-1 core (129 ± 3.7 Ma) and geochemical characteristics such as the U/Th and V/(V+Ni) ratios, and Ce anomaly, we infer that the Latest Hauterivian anoxic event may be related to the reducing depositional environment that prevailed during the deposition of the middle and upper Laiyang Group.
6. Conclusions
-
(1) Siltstones and mudstones from the Lower Cretaceous Laiyang Group, deposited in the Riqingwei Basin, comprise fine-grained clastic fractions, indicating long-distance transportation. Weak chemical weathering conditions have been inferred in the source area from the chemical compositions.
-
(2) Siltstones and mudstones from the Lower Cretaceous sedimentary successions on Lingshan Island were likely derived from felsic igneous rocks and metamorphic rocks, along with minor proportions from intermediate igneous rocks.
-
(3) The Riqingwei Basin is a rift basin that developed between the island arc and active continental margin. This indicates that the area was part of a marine basin.
-
(4) The palaeoclimatic conditions inferred from the Lower Cretaceous sedimentary successions on Lingshan Island suggest two cycles transitioning from arid to humid. The sedimentary environment of the Riqingwei Basin transformed from lacustrine facies for the lower Laiyang Group to marine facies for the upper Laiyang Group, and finally to a lacustrine environment at the end of the deposition of the Laiyang Group.
-
(5) An anoxic environment prevailed during the deposition of the middle Laiyang Group and dominantly during the deposition of the upper Laiyang Group. This environment may be attributed to the Latest Hauterivian anoxic event.
Acknowledgements
This work was financially supported by the Major Scientific and Technological Innovation Project of Shandong (grant no. 2017CXGC1608), the National Natural Science Foundation of China (grant no. 41772190), the Sinopec Science and Technology Department Project (grant no. 05N20010298), Teacher Innovation Project (grant no. 19CX05004A) and the Graduate Innovation Project of China University of Petroleum (East China) (grant no. YCX2020013 and YCX20210006). We thank all colleagues who worked on the Lingke-1 Drilling Project. We are grateful to the anonymous reviewers for their constructive, careful and stimulating reviews.
Declaration of competing interests
The authors declare that they have no known competing financial interests or personal relationships that could have appeared to influence the work reported in this paper.
Supplementary material
To view supplementary material for this article, please visit https://doi.org/10.1017/S0016756821000819