Introduction
To improve the economic return of animal reproduction, in vitro fertilization (IVF) is a viable biotechnology. In Brazil reproduction systems, this technique is gratefully used mostly because in tropical climatic conditions, as in Brazil, cross-breed species from Bos taurus taurus and Bos taurus indicus subspecies crossing is an economically advantageous way of improving the particularities in the low yield of each subspecies. (Slade Oliveira et al., Reference Oliveira, de Barros, Monteiro, Rosa, Leal, Serapião and Camargo2019). However, the reduced Bos taurus indicus cattle IVF rates are still the main difficulty in applying this tool. In vitro fertilization success rates are mostly dependent on oocyte quality (Lonergan et al., Reference Lonergan, Dinnyes, Fair, Yang and Boland2000, Reference Lonergan, Rizos, Gutierrez-Adan, Fair and Boland2003), usually estimated by morphological classification of oocyte cytoplasm and cumulus cells (number of layers, density and integrity; de Loos et al., Reference de Loos, van Maurik, van Beneden and Kruip1992). Additionally, COC assessment analyzes cumulus cells and oocyte cytoplasm as a single unit (de Loos et al., Reference de Loos, van Vliet, van Maurik and Kruip1989), and we could not find studies isolating the cytoplasmic morphology effect on oocyte competence.
Bovine species display several similarities with human reproductive physiology, including ovulatory regulation, late embryonic genome activation, embryonic lipid content and metabolism (Langbeen et al., Reference Langbeen, De Porte, Bartholomeus, Leroy and Bols2015). Additionally, ∼70–80% of recovered human oocytes have cytoplasmic abnormalities (Ashrafi et al., Reference Ashrafi, Karimian, Eftekhari-Yazdi, Hasani, Arabipoor, Bahmanabadi and Akhond2015; Faramarzi et al., Reference Faramarzi, Khalili and Ashourzadeh2017). Cytoplasmic dysmorphism can be caused by excessive ovarian stimulation with hormonal protocols (Tulay et al., Reference Tulay, Arslan, Buran and Koprulu2019). It may occur at different times during oogenesis (Van Blerkom and Henry, Reference Van Blerkom and Henry1992), or even during follicular aspiration (Van Blerkom, Reference Van Blerkom1990). Dysmorphisms are often correlated with genetic aneuploidies (Van Blerkom et al., Reference Van Blerkom, Davis, Merriam and Sinclair1995) and fertilization failure in oocytes (Faramarzi et al., Reference Faramarzi, Khalili and Ashourzadeh2017). Cytoplasmic granules, a cytoplasmic dimorphism class often found in mammalian oocytes, may represent refractory bodies, dark incorporations, fragments, dense granules, lipid droplets, lipofuscin, and even clusters of smooth endoplasmic reticulum (Rienzi et al., Reference Rienzi, Vajta and Ubaldi2011).
Our hypothesis was that cytoplasmic granules did affect oocyte quality, and possibly reflected embryo development in bovine. We aimed to investigate if cell death pathways (Oliveira et al., Reference Oliveira, de Barros, Monteiro, Rosa, Leal, Serapião and Camargo2019), oocyte–cumulus cell communication (Thomas et al., Reference Thomas, Armstrong and Gilchrist2004; Uyar et al., Reference Uyar, Torrealday and Seli2013) and gene expression of oocyte competence biomarkers (Biase et al., Reference Biase, Everts, Oliveira, Santos-Biase, Fonseca Merighe, Smith, Martelli, Lewin and Meirelles2014) would be affected by a highly heterogeneous cytoplasm. Here we present results confirming that granules on oocytes did not decrease their developmental capacity and discuss if granulated oocyte use is appropriate for bovine IVF routines.
Materials and methods
Reagents were purchased from Sigma Chemical Co. (St. Louis, USA), unless otherwise stated. Procedures followed ethical guidelines for animal experimentation and were approved by a local committee (CEUA/EGL-3956180316). All animals used in this study were maintained on Brachiaria decumbens pasture with ad libitum access to water and mineral supplements.
Experimental design
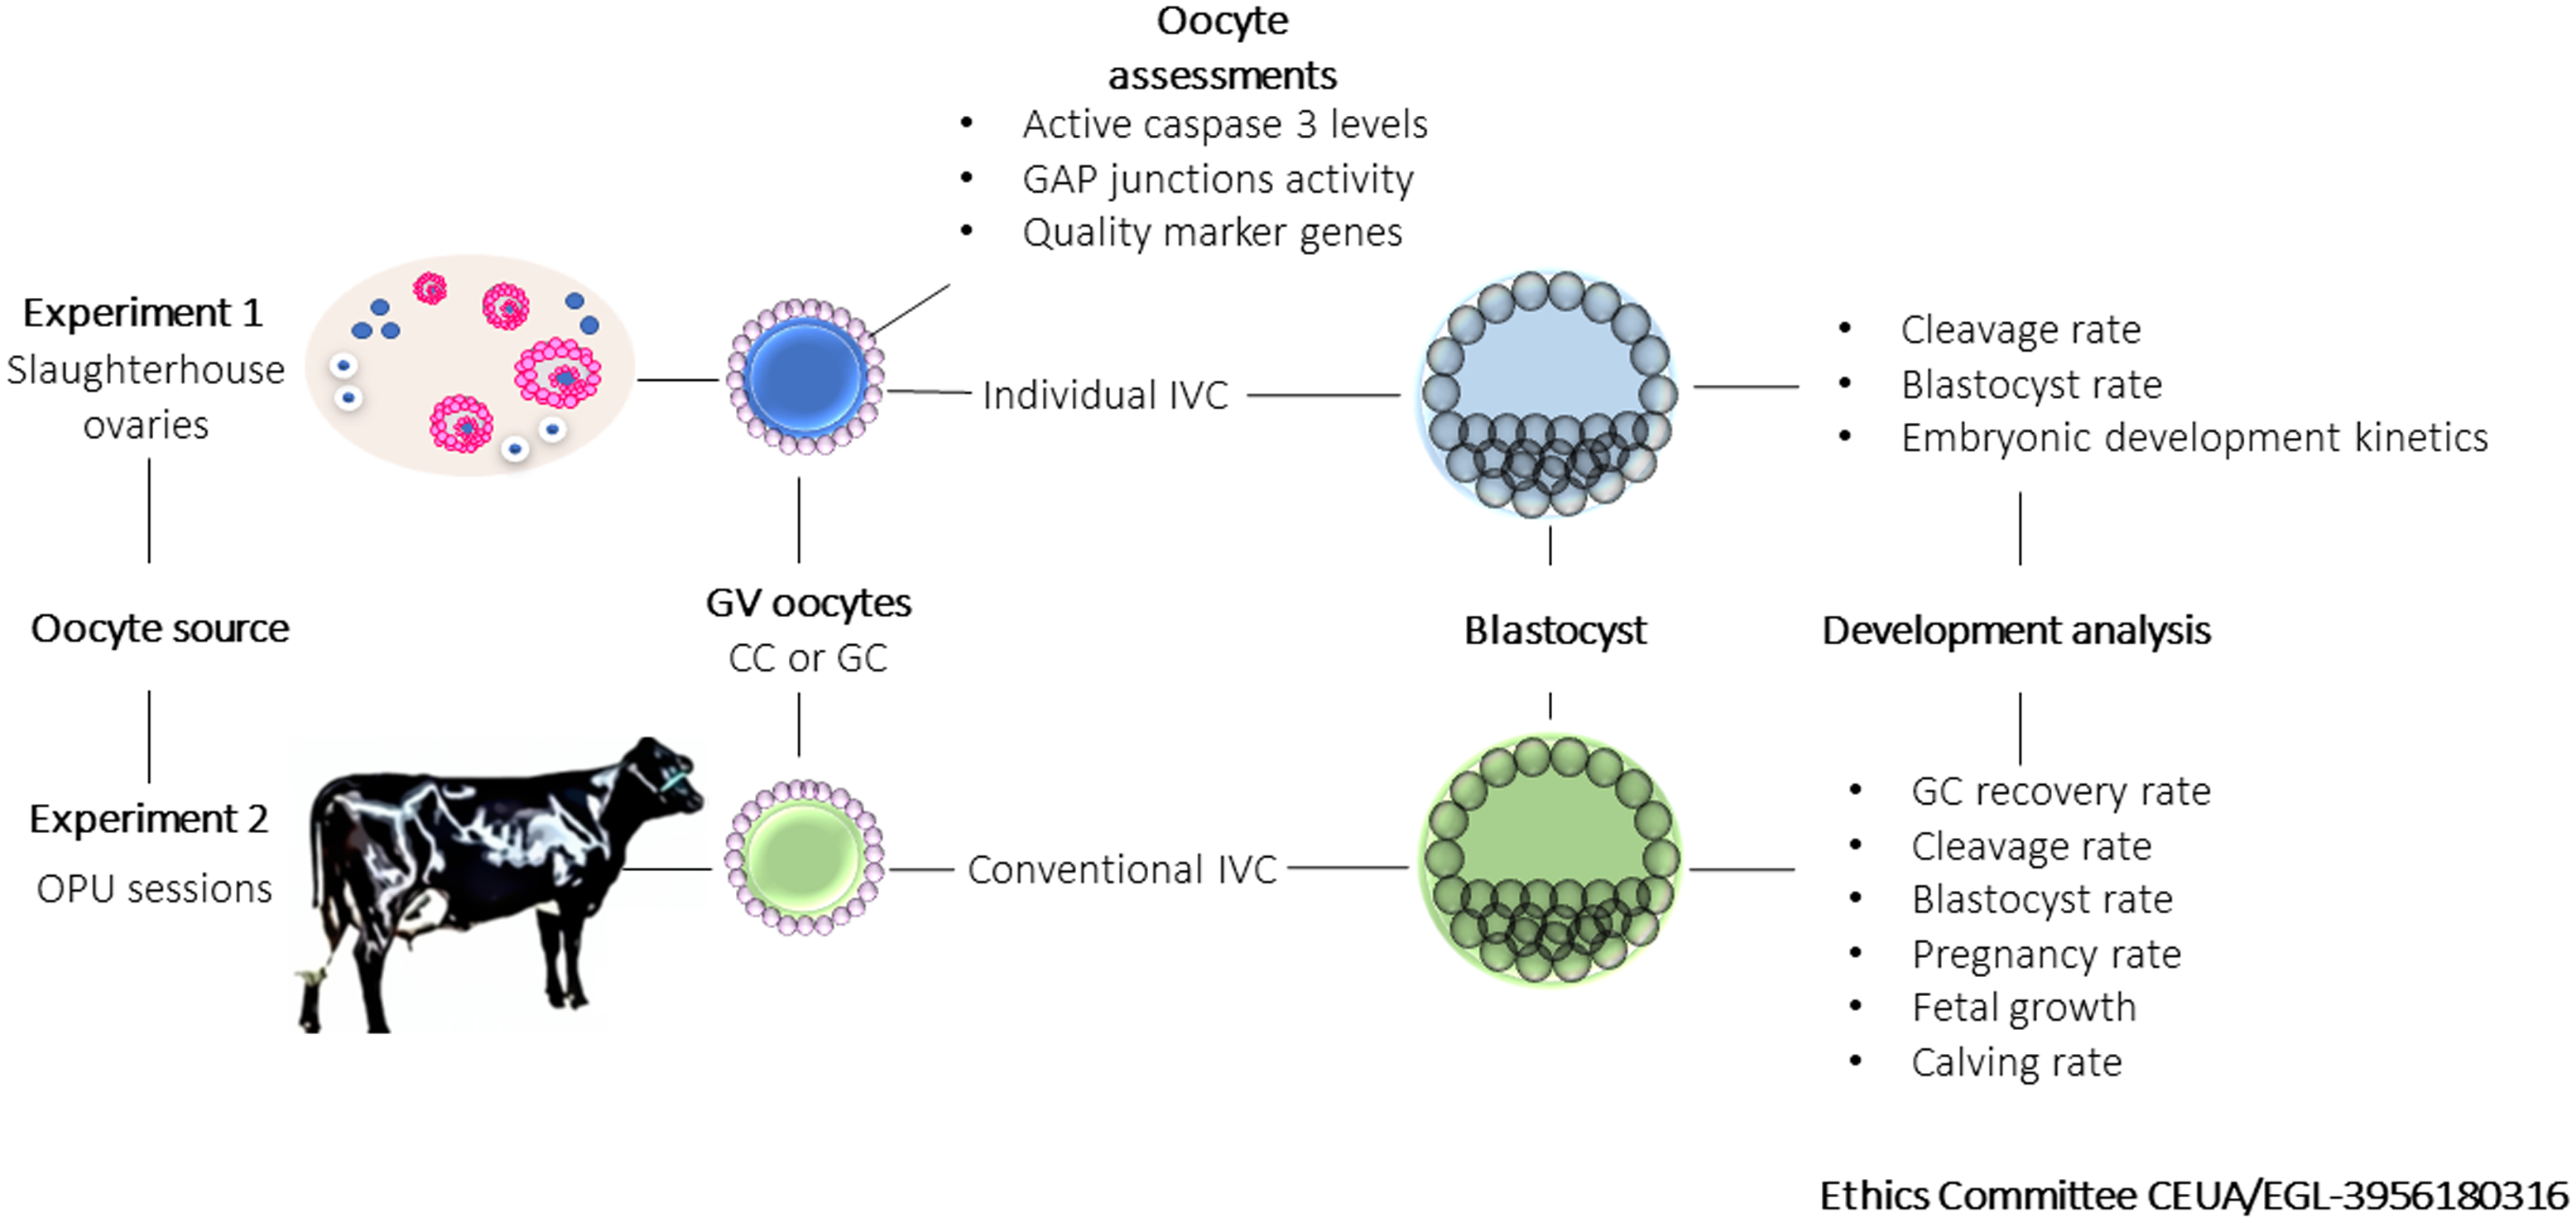
We aimed to compare granular cytoplasm (GC) oocytes and control cytoplasm (CC) oocytes. The experimental design is summarized in Figure 1. In Experiment 1, COCs were recovered from slaughterhouse ovaries, morphologically classified, and separated into GC and CC groups. COCs with oocytes displaying slightly heterogeneous cytoplasm or less than three layers of dense cumulus cells were discarded. Active caspase 3 (Ac3) immunofluorescence, calcein staining for GAP junction activity assessment, and MATER, ZAR1, ENY2, and PPP2R1A gene expression assays were performed on immature oocytes after cumulus cell removal. Cumulus cells were used for BMP15 and IGF2 gene expression assay. Early embryo development after IVF was evaluated by cleavage and blastocyst rates and developmental kinetics.
Experimental design. In Experiment 1, part of oocytes (GV; CC or CG) recovered from slaughterhouse ovaries were submitted to molecular analysis (active caspase 3 levels, GAP junction activity and quality marker genes expression). Oocytes were matured, fertilized and after individual culture, blastocysts were used for developmental analysis (cleavage and blastocyst rate, and embryonic developmental kinetics). In Experiment 2, oocytes (GV; CC or GC) recovered from OPU sessions were used for IVF and blastocysts were produced and transferred for recipients for early (cleavage and blastocyst) and late (pregnancy rate, fetal growth and calving rate) embryonic developmental analysis.

In Experiment 2, COCs were recovered from (n = 11) Girolando cows aspirated on a random day of the oestrous cycle. GC and CC oocytes were submitted to IVF, and blastocysts (168 h post insemination, hpi) were transferred to recipient heifers. Early (cleavage and blastocyst rates) and late [pregnancy and calving rate, and fetal growth-embryonic vesicle diameter (EVD), biparietal diameter (BPD), and crown–rump length (CRL)] embryonic development were assessed.
Oocyte recovery
Ovum pick-up sessions
Girolando F1 cows (326.75 ± 26 kg and 33.72 ± 8.31 months) were used for COC recovery by ovum pick-up (OPU) as previously described (Slade Oliveira et al., Reference Oliveira, de Barros, Monteiro, Rosa, Leal, Serapião and Camargo2019). Briefly, the follicular wave was synchronized by dominant follicle aspiration 72 h prior to OPU, when 2–8 mm follicles were punctured with 18G needles using a transvaginal device guiding both a needle and a 7.5 MHz convex transducer coupled to ultrasound equipment (Mindray DP2200). Follicular fluid was aspirated through a vacuum system (90 mmHg) in a tube containing 50 ml of Dulbecco’s PBS supplemented with 50 UI heparin and 1% fetal bovine serum (FBS) solution at 37°C. The follicular fluid was filtered, and the COCs were selected under a stereomicroscope.
Slaughterhouse ovaries
Slaughterhouse ovaries were transported to the laboratory in a thermal bottle containing 0.9% NaCl solution (34–37°C) and processed up to 3 h after slaughter. Follicles (2–8 mm) were punctured manually using a 20-ml syringe and 25G needle and follicular fluid was transferred to a 50-ml conical tube. After 10 min of incubation at 37°C, 2 ml of the pellet formed for cellular content deposition was recovered for COC selection on a stereomicroscope.
Oocyte selection and recovery rate
Recovered COCs were classified morphologically as follows:
-
• CC group: COCs presenting evidently homogeneous cytoplasm without signs of alteration such as granulations.
-
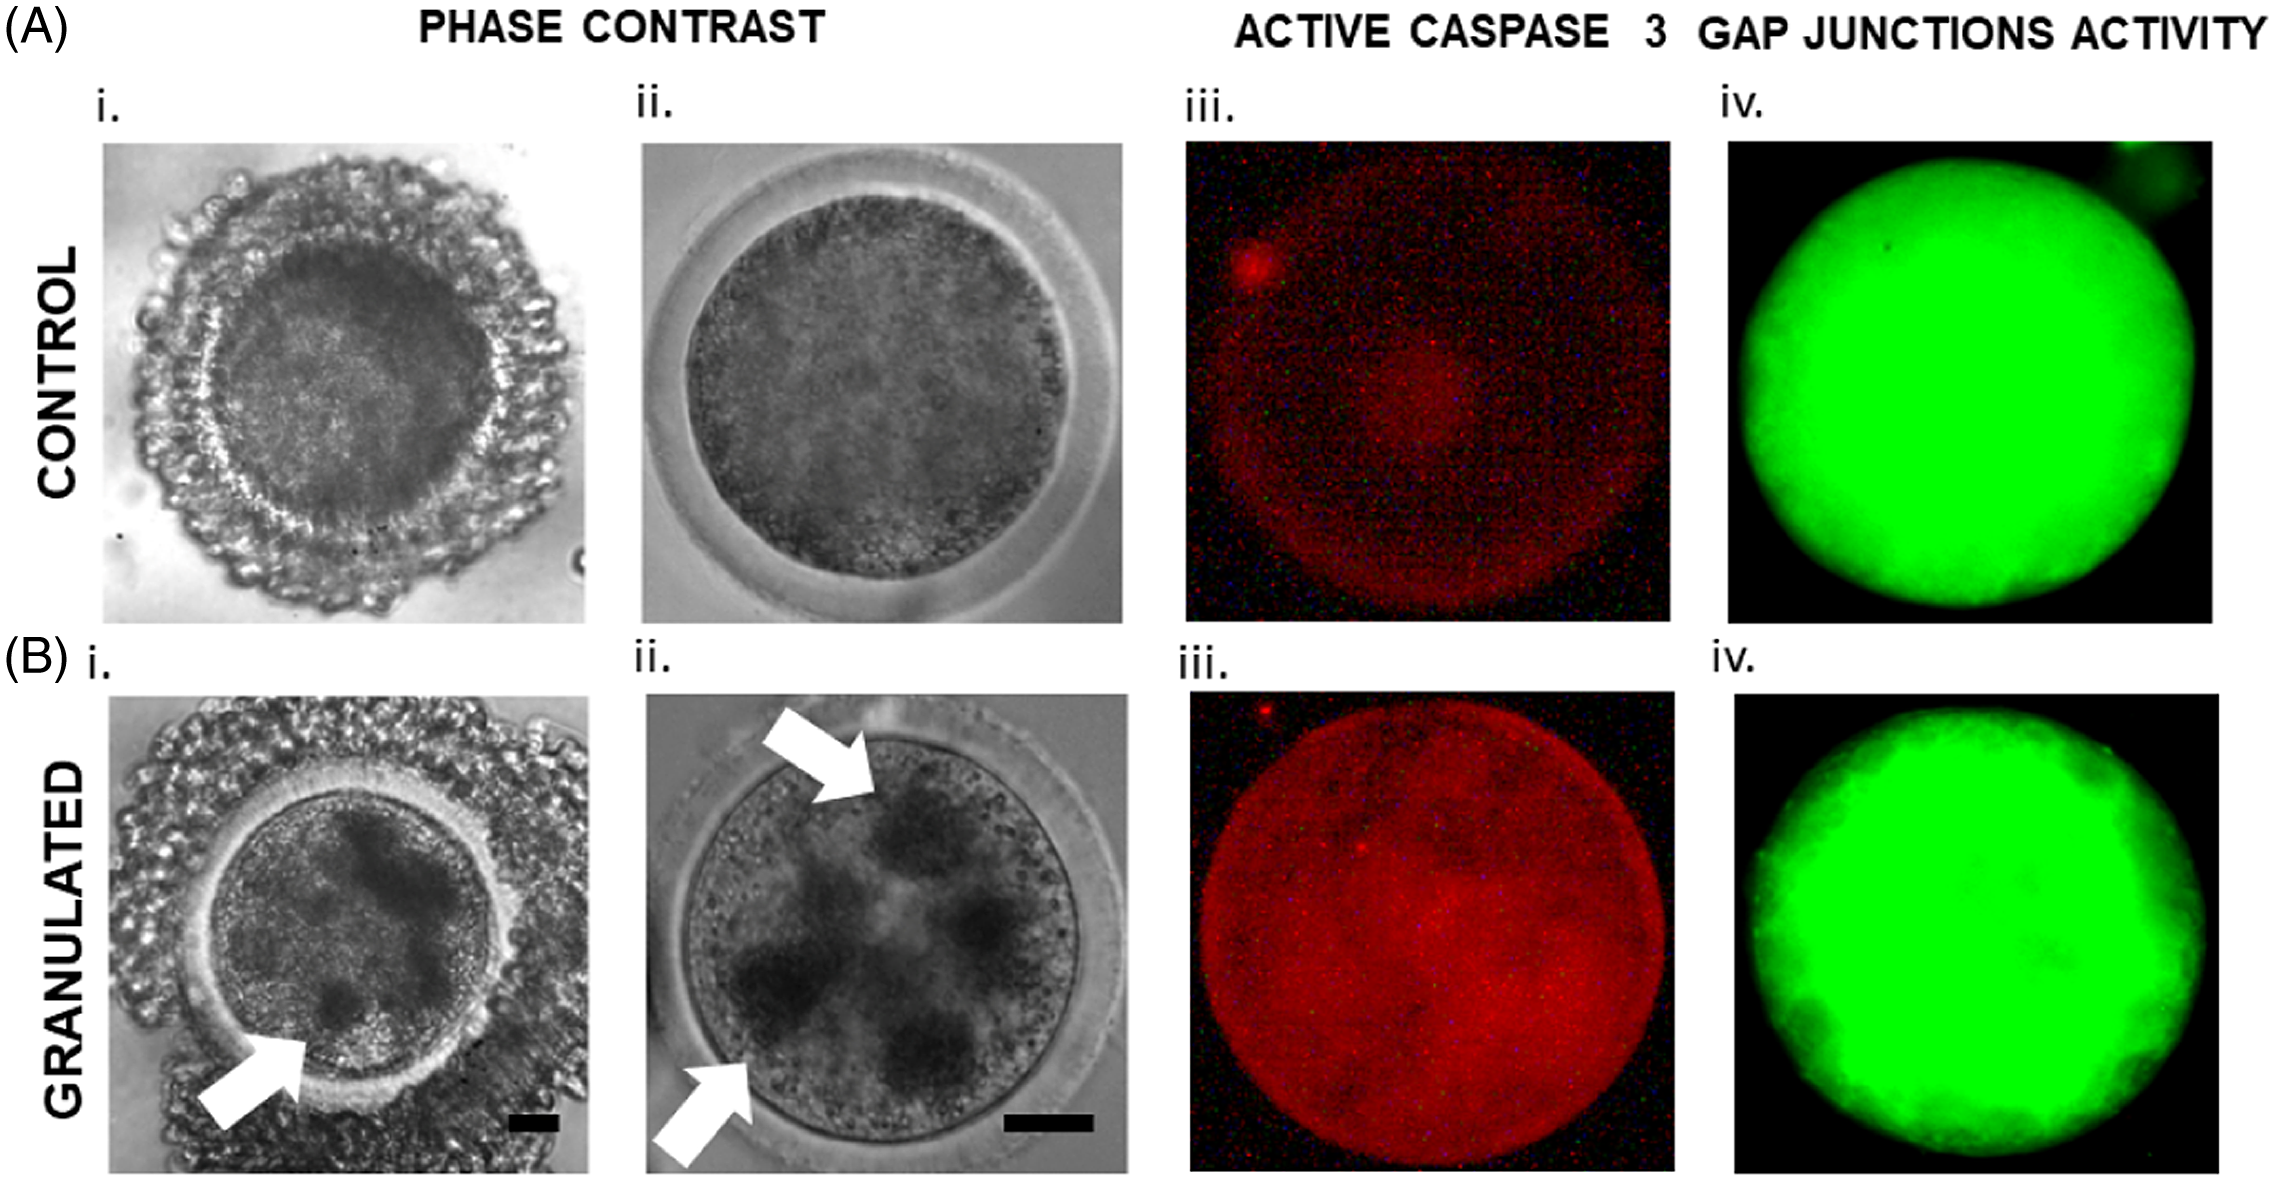
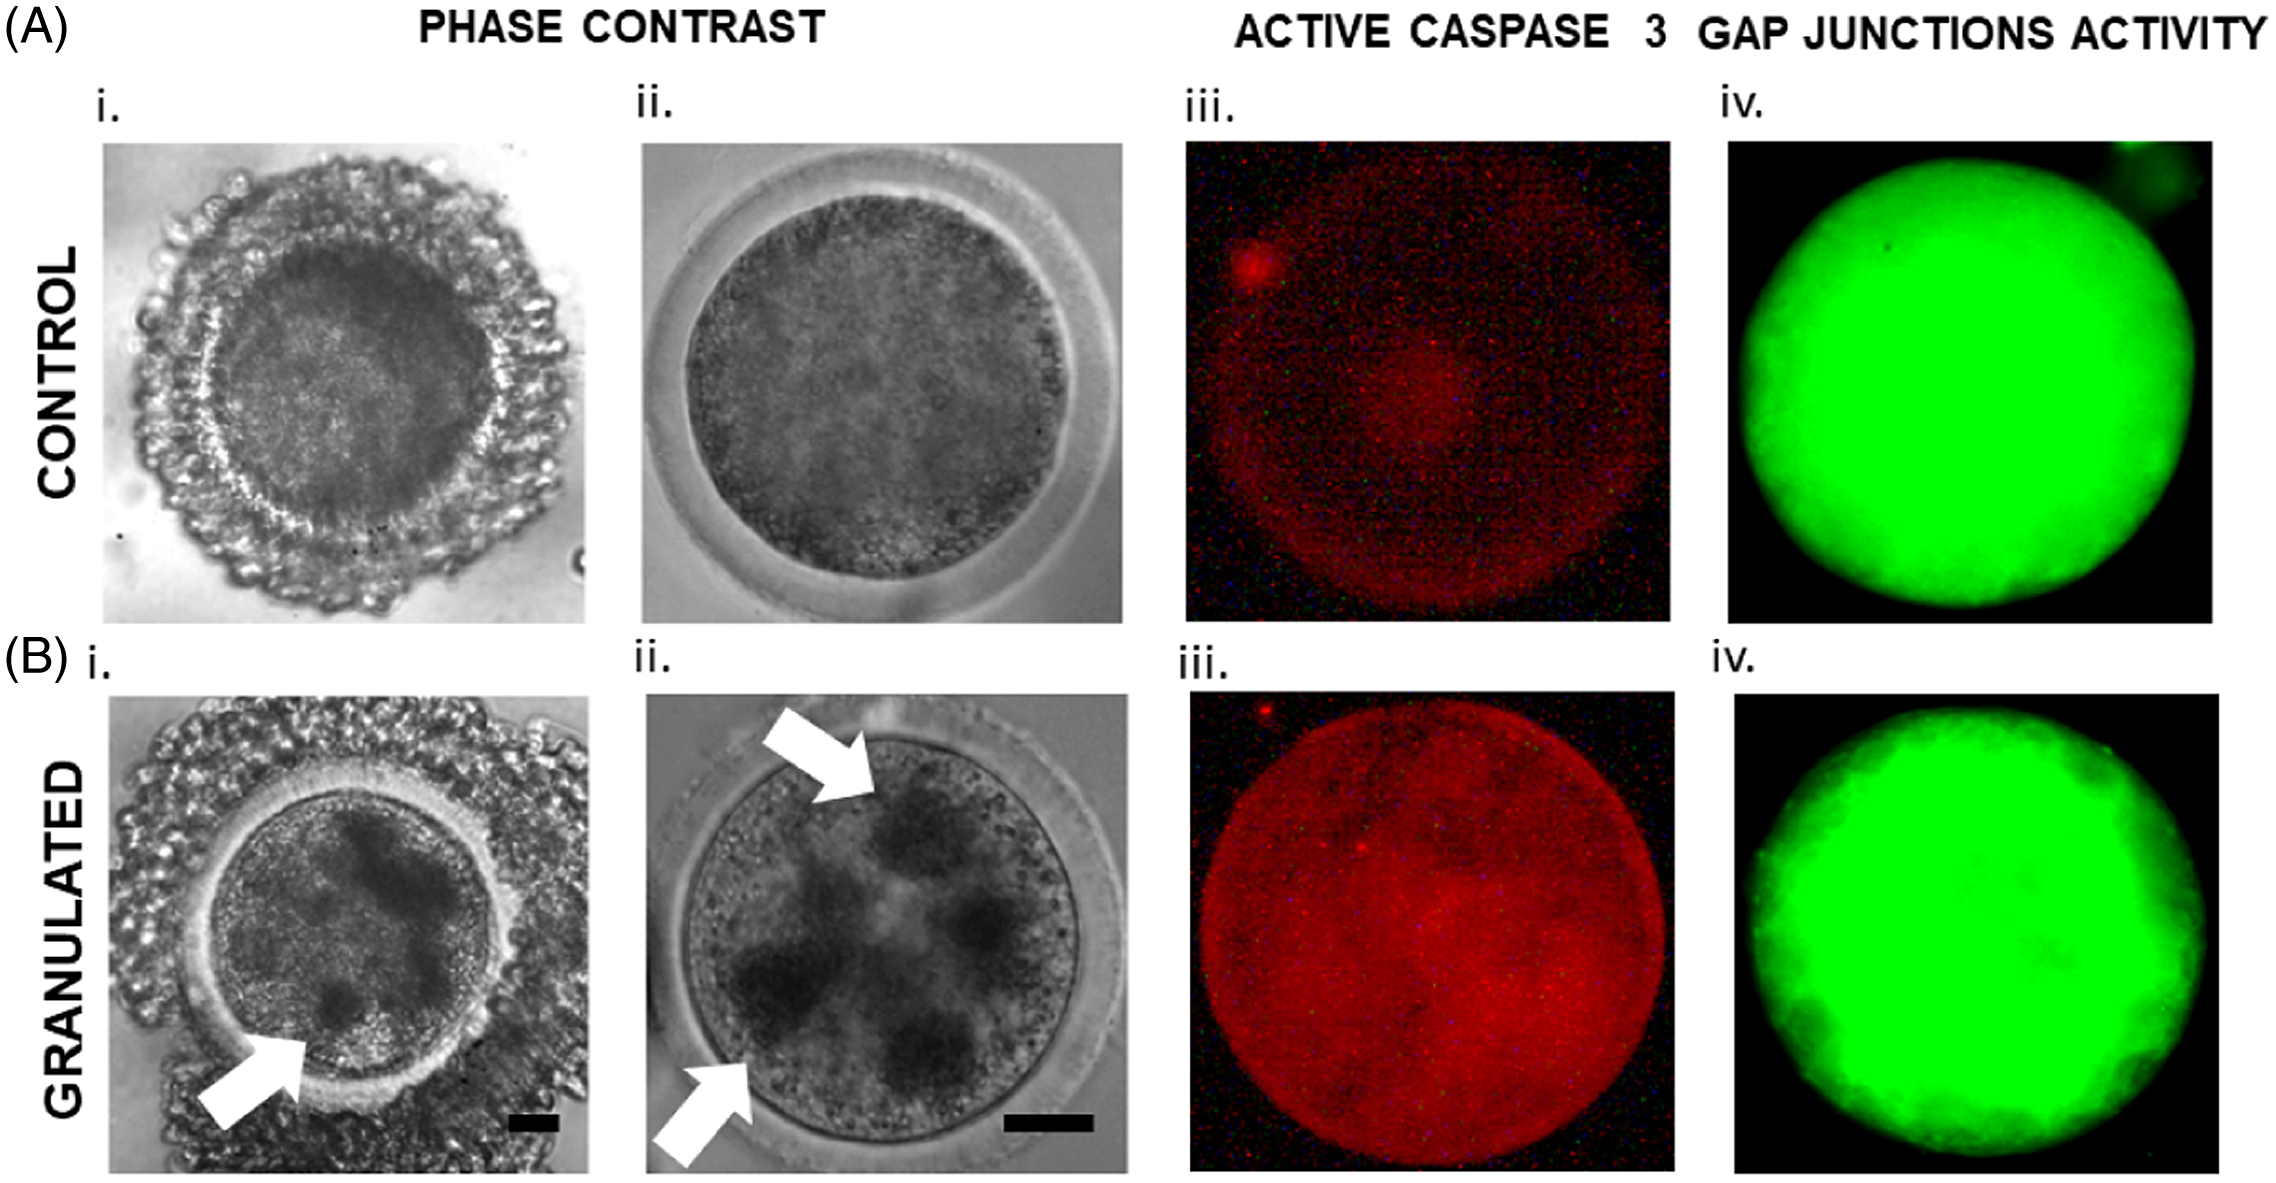
• GC group: COCs presenting granulations in the cytoplasm (three or more diffuse granules of 15 µm were visualized in ooplasm; Figure 2Ai, Bi) without any signs of degeneration (lightening or excessive ooplasm darkening).
For Groups I and II, all COCs had more than three layers of cells, were nonatretic, strongly adhered to the oocyte, had no signs of expansion and degeneration, and presented a rounded shape.
Groups of oocytes presenting homogeneous cytoplasm with minor granules or with signs of degeneration (lightening or excessive darkening of the ooplasm) or exhibiting cumulus cells with signs of expansion or degeneration, Those COCs were excluded from the experiment.
GC recovery rate was calculated for Experiment 2 and was considered as a percentage of all viable oocytes (denuded and atretic COCs were discarded).
Active caspase 3 immunofluorescence
Immature oocytes from both groups (CC and GC) were enzymatically denuded (TrypLE Express, ThermoFisher, Waltham, USA), fixed in 4% paraformaldehyde and stored in PBS at 4°C. As previously described (Oliveira et al., Reference Oliveira, Saraiva, de Lima, Oliveira, Serapião, Garcia, Borges and Camargo2016), oocytes were permeabilized in 0.5% Triton X-100 solution for 30 min at room temperature and washed three times in PBS supplemented with 0.2% Tween-20 (PBS-T). Oocytes were transferred to a blocking solution (PBS-T supplemented with 3% BSA) for 4 h at 4°C. Primary antibody incubation (mouse anti-rabbit caspase 3, 1:750) was performed at 4°C overnight. Oocytes were washed three times in PBS-T for 10 min and incubated with a secondary antibody (donkey anti-rabbit IgG conjugated to Alexa Fluor 555, 1:400) for 30–120 min at room temperature. Immunofluorescence assessments were carried out on slides under fluorescence microscopy at 556–573 nm wavelength. Images were recorded and analyzed for fluorescence levels using the ROI tool in ImageJ software (NIH- Bethesda, USA).
GAP junctions activity assay
Calcein-AM staining was previously validated to estimate GAP junction activity (Thomas et al., Reference Thomas, Armstrong and Gilchrist2004). The protocol was used with minor modifications. Oocytes from CC and GC groups were transferred to an in vitro maturation (IVM) medium containing calcein (1 µM) and kept in an incubator for 15 min (38.5°C, 5% CO2 in atmospheric air, with maximum humidity). Oocytes were washed three times in an IVM-calcein-free medium and returned to the incubator for 25 min. Next, oocytes were denuded (TrypLE) and assessed on slides under a fluorescence microscope at 496–516 nm wavelength. Images were recorded and analyzed for fluorescence levels using the ROI tool in ImageJ software.
In vitro embryo production (IVP)
For all IVP steps, culture was conducted in medium drops under mineral oil at 38.5°C in 5% CO2 in humidified air. IVM was performed for 24 h in groups of 20 oocytes per 100-µl drop of Tissue Culture Medium (TCM-199) supplemented with 10% FBS, 1.0 μg/ml of FSH (Folltropin™, Bioniche Animal Health, Belleville, Canada), 50 μg/ml hCG (Profasi™, Serono, São Paulo, Brazil), 1.0 μg/ml estradiol, 16 μg/ml sodium pyruvate, 100 UI penicillin and 0.1 mg/ml streptomycin. After IVM, gametes co-culture was performed for 18–20 h in groups of 20 oocytes per drop (50 µl) of FERT-TALP medium supplemented with 0.6% BSA, 10 μg/ml heparin, 18 μM penicillamine, 10 μM hypotaurine, and 1.8 μM epinephrine. A frozen straw of a previously tested batch of bovine semen was thawed at 36°C for 30 s, transferred to a 45/90 Percoll gradient and centrifuged at 3600 g for 7 min. The pellet (30 µl) was suspended in 1 ml of FERT-TALP medium and centrifuged at 520 g for 5 min. After centrifugation, 20 μl of the medium, including the pellet, was collected. The concentration was adjusted to a final concentration of ∼104 spermatozoa for each oocyte and added to the TALP-IVF drops. After IVF, presumptive zygotes were vigorously pipetted to remove most cumulus cells. For Experiment 1, presumptive zygotes were individually transferred to 6-µl drops, after which 96 hpi 3 µl medium was added to each drop. The individual embryo culture allows the evaluation of embryonic development from the zygote to the blastocyst stage. For Experiment 2, presumptive zygotes were transferred in groups of 20–100 µl drops and the medium was half replaced at 96 hpi. SOF-AA medium supplemented with 1.5% FBS and 6 mg/ml BSA was used.
Embryonic development assessments
Cleavage rate was assessed at 48 hpi and the blastocyst rate was calculated at 168 hpi. In Experiment 1, developmental kinetics was assessed at four time points: 48 hpi, 96 hpi, 144 hpi, and 168 hpi, and the stage of development of each embryo was recorded. In each time point, the percentage of embryo developmental stage was calculated.
Embryo transfer (ET), pregnancy assessment and fetal development
At 168 hpi, the IVP blastocysts were used for ET to Girolando heifers. For oestrus synchronization, recipients received a vaginal progesterone device containing 1 mg and an injection containing 2 mg of estradiol benzoate. After 7 days, the progesterone device was removed and injections of cloprostenol (0.5 mg) and estradiol cypionate (Zoetis, New Jersey, USA) were administered. Embryo transfer was performed 9 days after removal of the progesterone device in recipients with a corpus luteum and adequate uterine tone.
Recipients were examined 35 days after ET to determine pregnancy status. Fetometry [EVD, biparietal diameter (BPD), and crown–rump length (CRL)] was performed by transrectal ultrasonography at a frequency of 7.5 MHz using a linear transducer coupled to the ultrasound device. The same technician performed the evaluations every 6 days. EVD and CRL assessments started at day 37 and ended at day 55 of gestation. BPD assessment started at day 43 and ended at day 91 of gestation.
Gene expression analysis
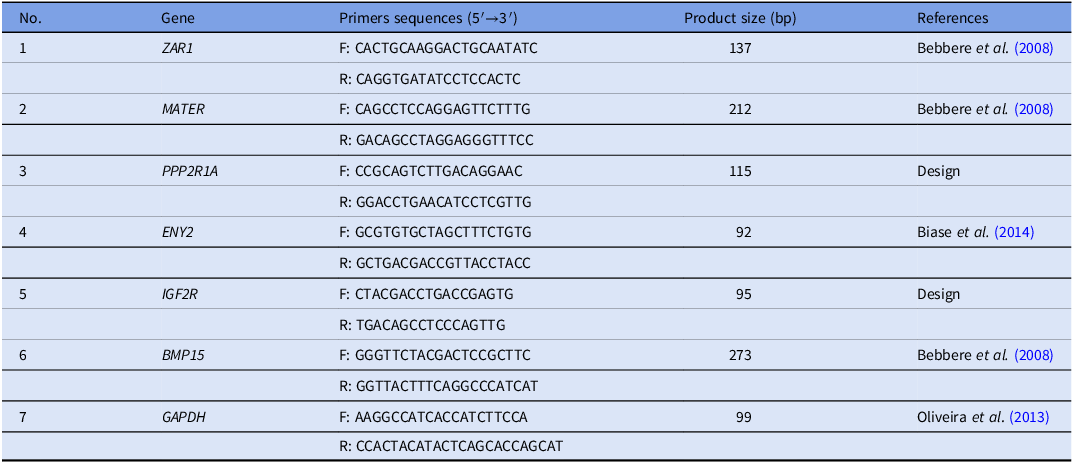
Primer sequences, fragment sizes, and references are listed in Table 1. ZAR1 (1), MATER (2), PPP2R1A (3), ENY2 (4), IGF2R (6), and BMP15 (7) transcripts were analyzed in oocytes (1, 2, 3, and 4); and cumulus cells (5 and 6). Pools of 10 immature oocytes were denuded using 200 µl TrypLE Express enzyme. Oocytes were collected without cells and snap frozen. The drops used to denude oocytes (cumulus cell suspension) were centrifuged for 7 min at 3600 g. The supernatant was discarded, and the pellet was collected and snap frozen. Five pools were evaluated from each sample (oocytes, cumulus cells) and from each group (CC and GC).
Primer sequence (5′ to 3′), product size and reference of analyzed genes in oocytes, and cumulus cells.

Note: BMP15, Bone morphogenetic 15; ENY2, Transcription And Export Complex 2 Subunit; GAPDH, Glyceraldehyde-3-phosphate dehydrogenase; IGF2R, Insulin-like growth factor 2 receptor; MATER, Maternal antigen that embryo requires; PPP2R1A, Protein phosphatase 2 regulatory subunit alpha; ZAR1, Zygote arrest 1.
Total RNA was extracted using an RNeasy Micro kit (Qiagen, Venlo, The Netherlands) following the manufacturer’s recommendations, and the mRNA elution was performed with 14 µl of RNase-free water. For reverse transcription, 10 μl of the sample (equivalent to 7.2 oocytes, or cumulus) were used. The reaction was performed with ImProm-II Reverse Transcription System (Promega, Madison, USA), according to the manufacturer’s recommendations. A final volume of 20 μl was generated and divided by up to 16 reactions.
qPCR reactions were performed using ABI Prism 7300 (Applied Biosystems, Foster City, USA) in duplicate in a 20 μl volume using 6 pmol of primers. The mRNA expression levels were analyzed using the standard curve method and normalized with endogenous reference gene GAPDH. This gene is routinely used in oocyte (Biase et al., Reference Biase, Everts, Oliveira, Santos-Biase, Fonseca Merighe, Smith, Martelli, Lewin and Meirelles2014), and cumulus cell (Dieci et al., Reference Dieci, Lodde, Labreque, Dufort, Tessaro, Sirard and Luciano2016) gene expression studies. A transcript standard curve was prepared by purifying the product of qPCR reactions using a QIAquick PCR Purification Kit (Qiagen). Dilutions ranged from 1 to 1:10,000, totalling five points.
Statistical analysis
All statistical analyses were performed at a 5% significance level.
Mann–Whitney test was used to analyze the Ac3 levels, GAP junction activity, and mRNA expression levels. Fisher’s exact test was used to compare cleavage, blastocyst, pregnancy and calving rates between groups. Analysis of variance (ANOVA) repeated measures was used after a Box–Cox transformation to analyze BPD, EVD, CRL, and development kinetics.
Mann–Whitney test and Fisher’s exact test were performed in GraphPad Prism software (San Diego, USA). ANOVA was performed in Minitab Software (State College, USA).
Results
Under our conditions, 31% of the oocytes demonstrated GC. In addition, 56% of the recovered oocytes were classified as CC oocytes, and 13% were discarded from analysis (oocytes with homogeneous cytoplasm with minor granules, with signs of degeneration or exhibiting cumulus cells with signs of expansion or degeneration or denuded oocytes).
Active caspase 3 levels in oocytes are affected by granulated cytoplasm
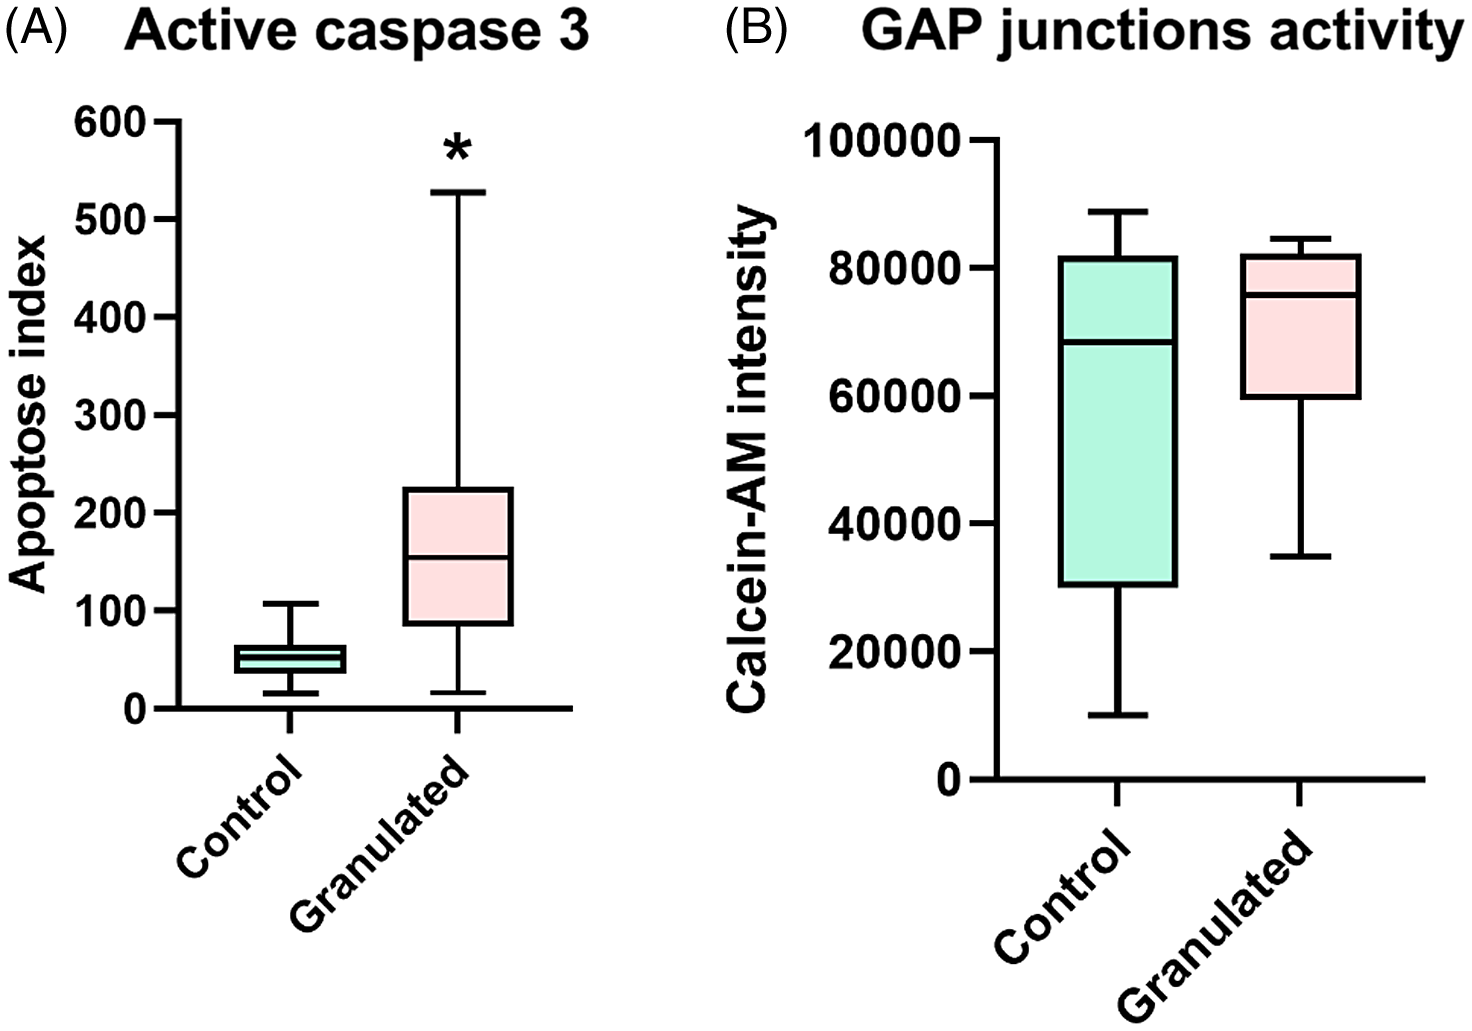
COCs collected in Experiment 1 (CC = 21 and GC = 49, obtained in two replicates) were analyzed by immunofluorescence (Figure 2) for active caspase 3 (Ac3). Lower (P < 0.0001) Ac3 levels were found in the CC group (Figure 2A.ii and Figure 3A) compared with the GC group (Figure 2B.ii).
Characterization of bovine oocytes with control and granular cytoplasm. (A. i, B. i) COCs phase contrast images show classification of oocytes used in the study (scale bar= 8.5 µm). (A. ii, B, ii) Denuded oocytes are shown in higher magnification (scale bar= 15 µm). (A. iii, B .iii) Images of Immature oocytes immunostained for active caspase 3 (red). (A. iv, B .iv) Images of live immature oocytes after COCs calcein-AM staining for GAP junction activity estimation (green). White arrow indicates cytoplasmic granules.
Immunofluorescence analysis of control and granulated oocytes. (A) Active caspase 3 levels and (B) GAP junctions activity (*) An asterisk indicates significant difference between groups.

GAP junction activity is similar in granulated and control cytoplasm oocytes
To evaluate immature COCs GAP junction activity, calcein-AM transfer from cumulus cells to oocytes was assessed in live oocytes collected in Experiment 1 from both groups (CC = 38 and GC = 58 immature COCs, obtained in two replicates; Figure 2). The results demonstrate that CC and GC groups expressed similar calcein-AM levels. Therefore, this suggests no difference (P > 0.05) in the GAP junction activity (Figure 2A.iii, B.iii) between groups (Figure 3B).
Granular cytoplasm does not affect cleavage and blastocyst rates
Immature COCs collected in Experiment 1 from slaughterhouse ovaries (CC = 331 and GC = 291) were used for IVP and cleavage and blastocyst rates were assessed. Cleavage rate did not differ between CC (68.27 ± 4.13%) and GC (61.16 ± 6.21%) groups (P = 0.064). Additionally, no difference was detected in blastocyst rate between CC (27.43.52 ± 2.20%) and GC (25.08 ± 3.98%) groups (P = 0.911).
Kinetics of embryo development is similar between control and granular oocyte–derived embryos
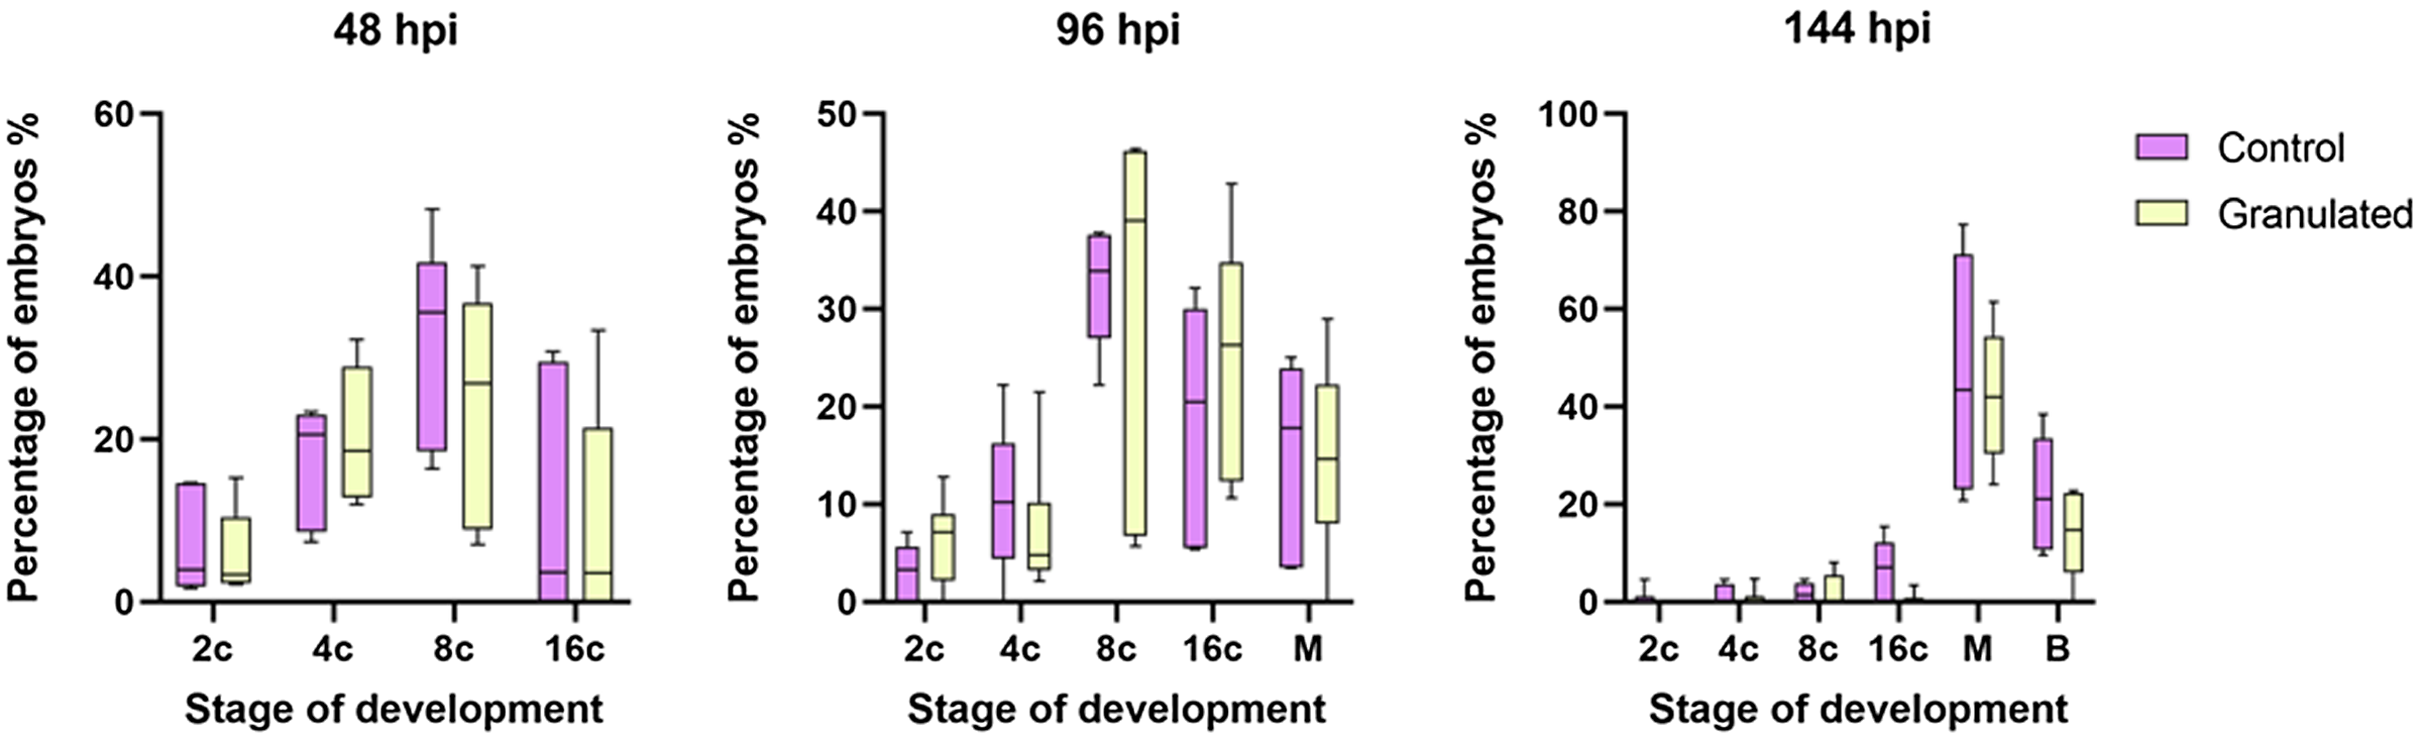
Embryo development kinetics was analyzed to evaluate possible outcomes of granulated cytoplasm oocytes use on IVF, such as embryo arrest. Embryos were individually evaluated at three time points during development (48 hpi, 96 hpi, 144 hpi) to estimate the stage of development (2, 4, 8, 16, morulae or blastocyst). No difference was detected in the developmental stage between CC and GC groups in any evaluated time point (Figure 4).
Kinetics of embryo development: stage of development in embryos derived from control and granular cytoplasm oocytes. Structures were cultivated in drops separately. Therefore, allow individual assessments from day 1 to day 6. Four moments during in vitro culture were evaluated (48 hpi, 96 hpi, and 144 hpi).

Gene expression analysis is altered in granular cytoplasm oocytes
To identify differences in genes related to oocyte and embryo competence between CC and GC groups, samples collected during Experiment 1 were used to analyze gene expression. For this, immature denuded oocytes (five pools of 10 oocytes obtained from six replicates), and cumulus cells (five pools of individualized cumulus cells from 10 COCs obtained from five replicates) were used.
Total GAPDH mRNA means from oocytes (CC: 4.18 ×10⁻⁴ ± 4.85 × 10⁻⁵ vs GC: 3.65 × 10⁻⁴ ± 3.85 × 10⁻⁵) and cumulus cells (CC: 5.68 × 10⁻² ± 3.36 × 10⁻² vs GC: 4.91 × 10⁻² ± 2.58 × 10⁻⁵) were similar between groups.
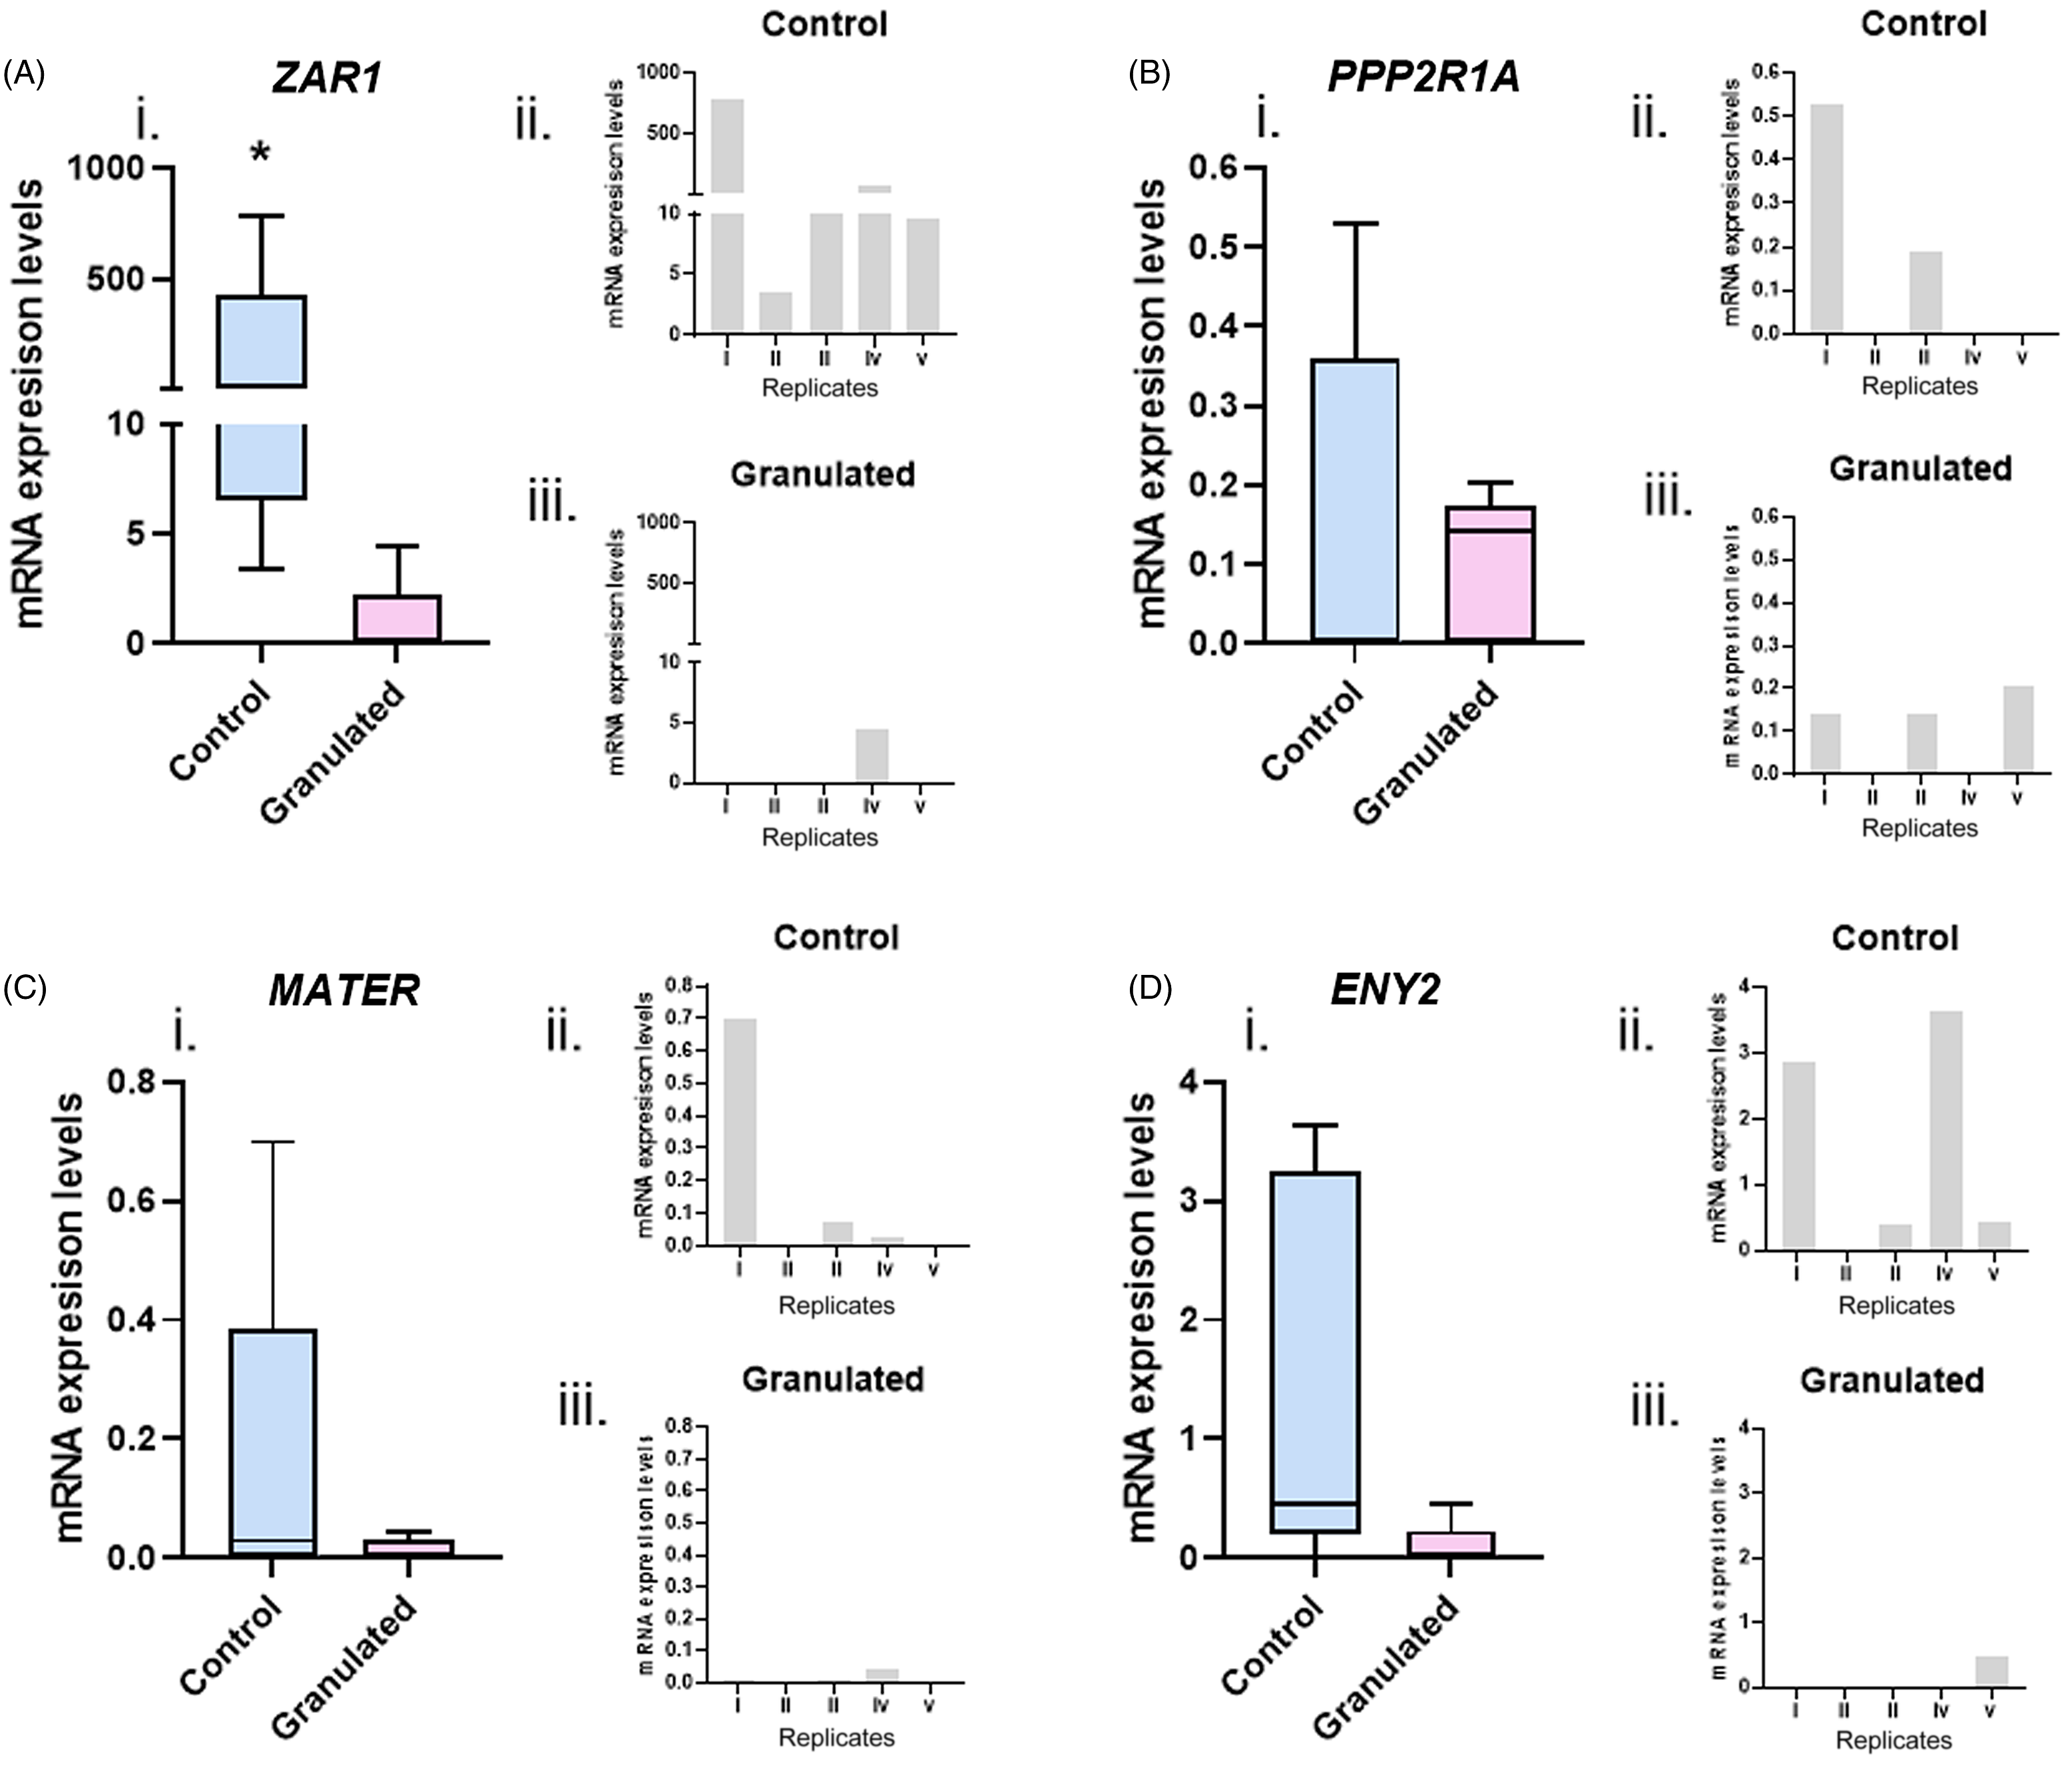
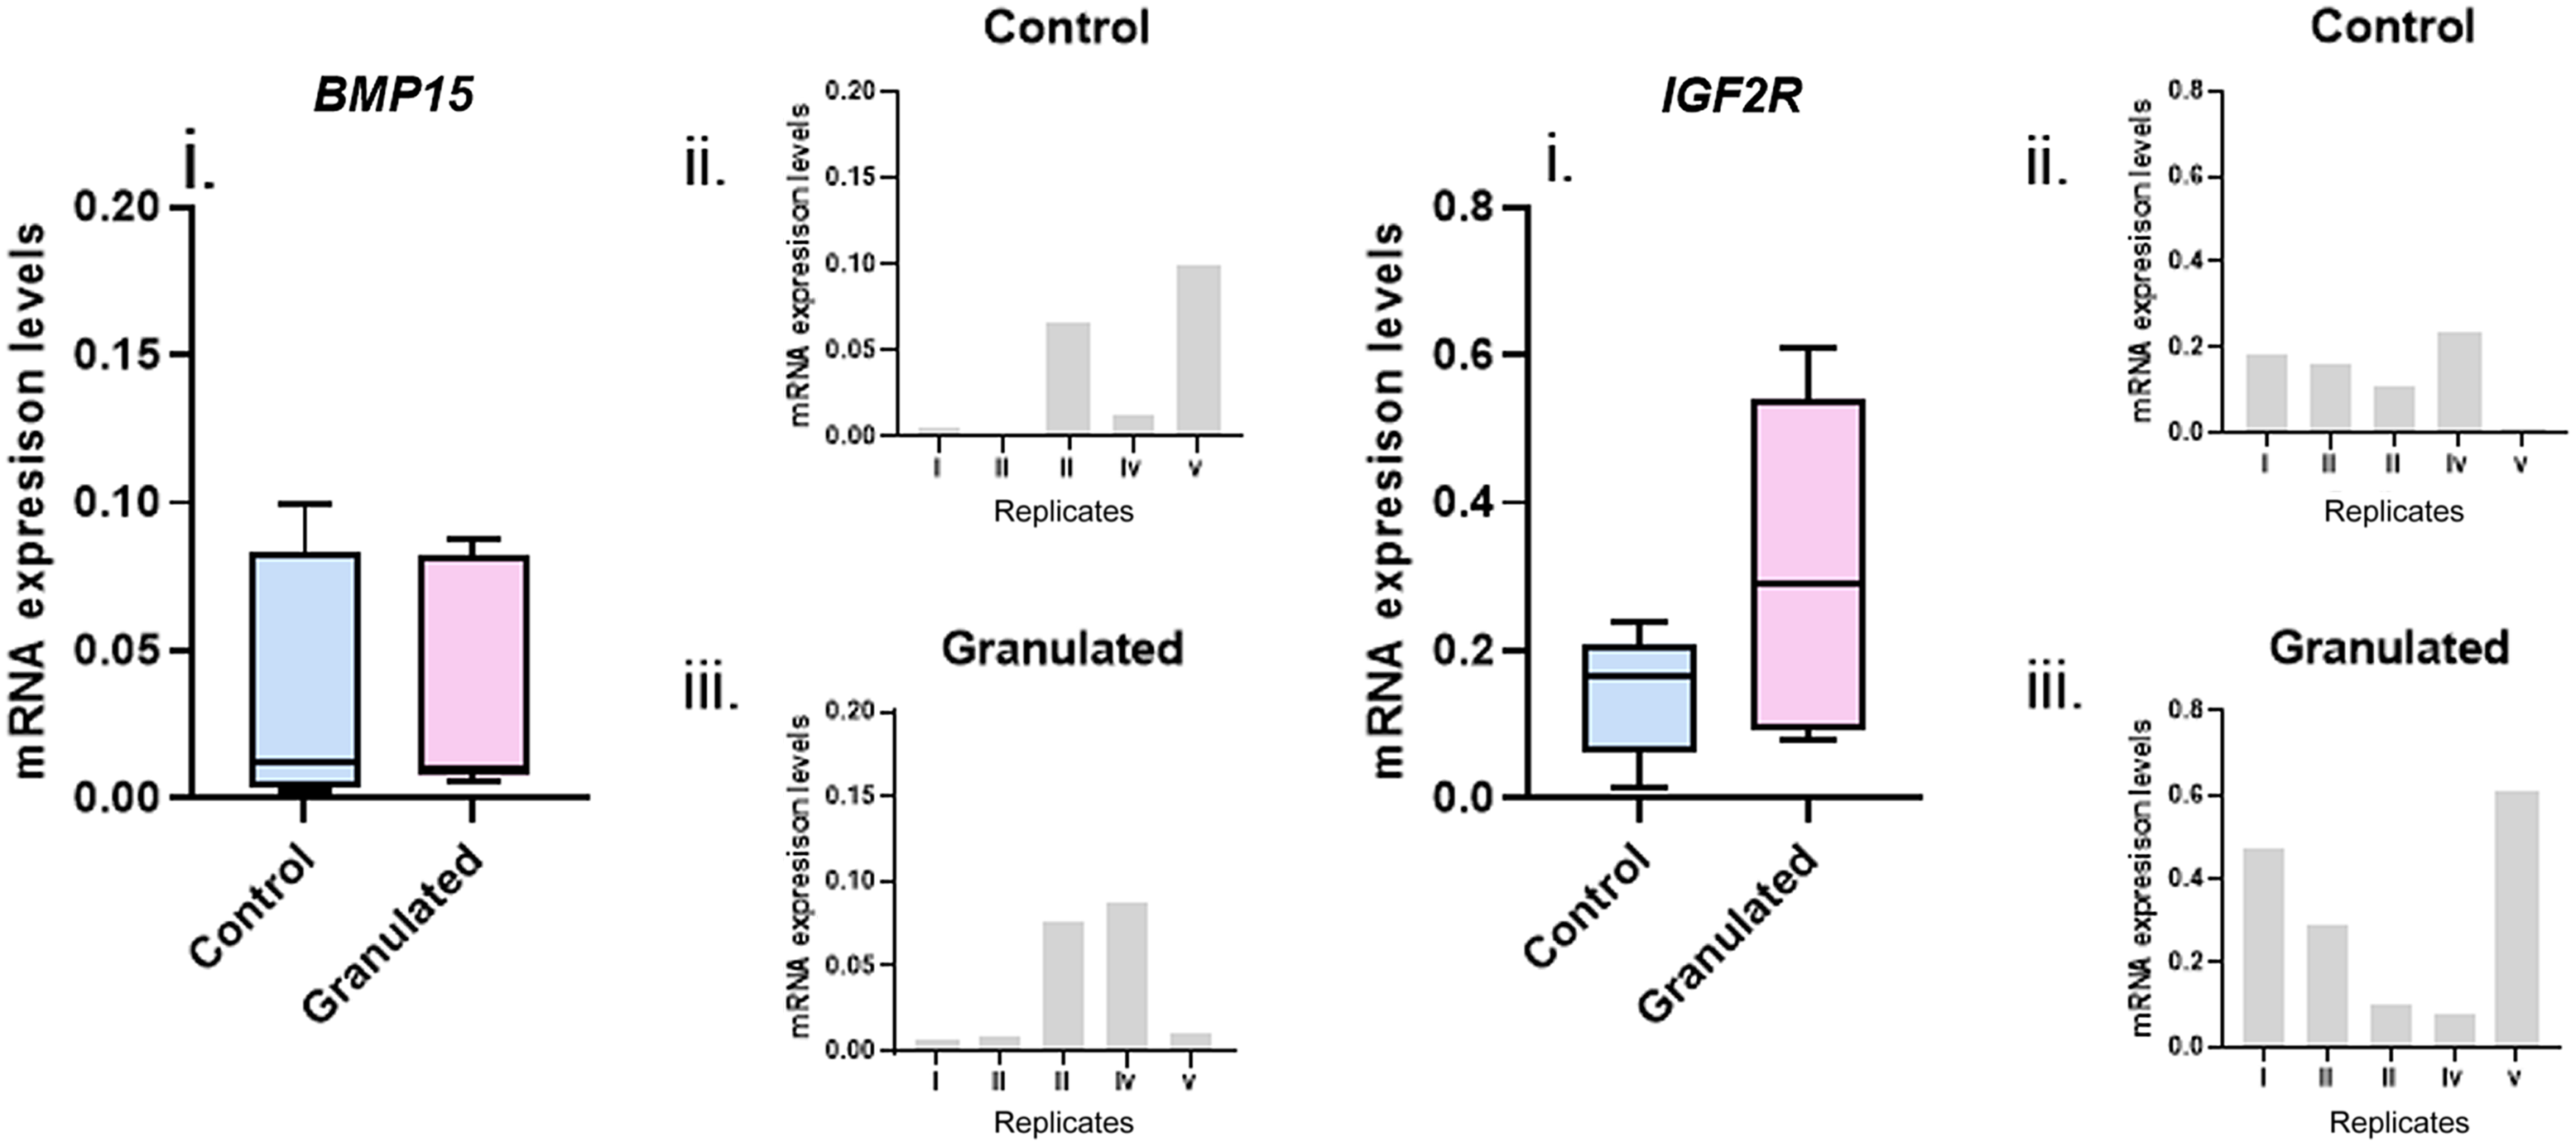
ZAR1 (Figure 5A), MATER (Figure 5B), PPP2R1A (Figure 5C), and ENY2 (Figure 5D) mRNA levels were analyzed in oocytes. ZAR1 expression was downregulated (P = 0.01) in GC oocytes, demonstrating a relationship between this pathway and cytoplasmic dysmorphism. For MATER, PPP2R1A, and ENY2, no difference (P > 0.05) was detected between groups. In cumulus cells, the transcripts analyzed were BMP15 (Figure 6A) and IGF2R (Figure 6B). No difference (P > 0.05) was detected in mRNA quantification for BMP15 and IGF2R between groups.
mRNA levels of denuded oocytes detected in control or granulated cytoplasm groups. Graphics shown mean level of (A) ZAR1, (B) MATER, (C) PPP2RIA, and (C) ENY2 transcripts. Bars of ii and iii graphics of all transcripts evaluated indicates individual values detected in the five replicates performed. (*) An asterisk indicates the significant difference between the analyzed groups.

mRNA levels of cumulus cells detected in control or granulated cytoplasm groups. Graphics shown mean level of (A) BMP15, (B) IGF2R transcripts. Bars of ii and iii graphics of all transcripts evaluated indicates individual values detected in the five replicates performed.

Granular cytoplasmic profile does not alter post-implantation development
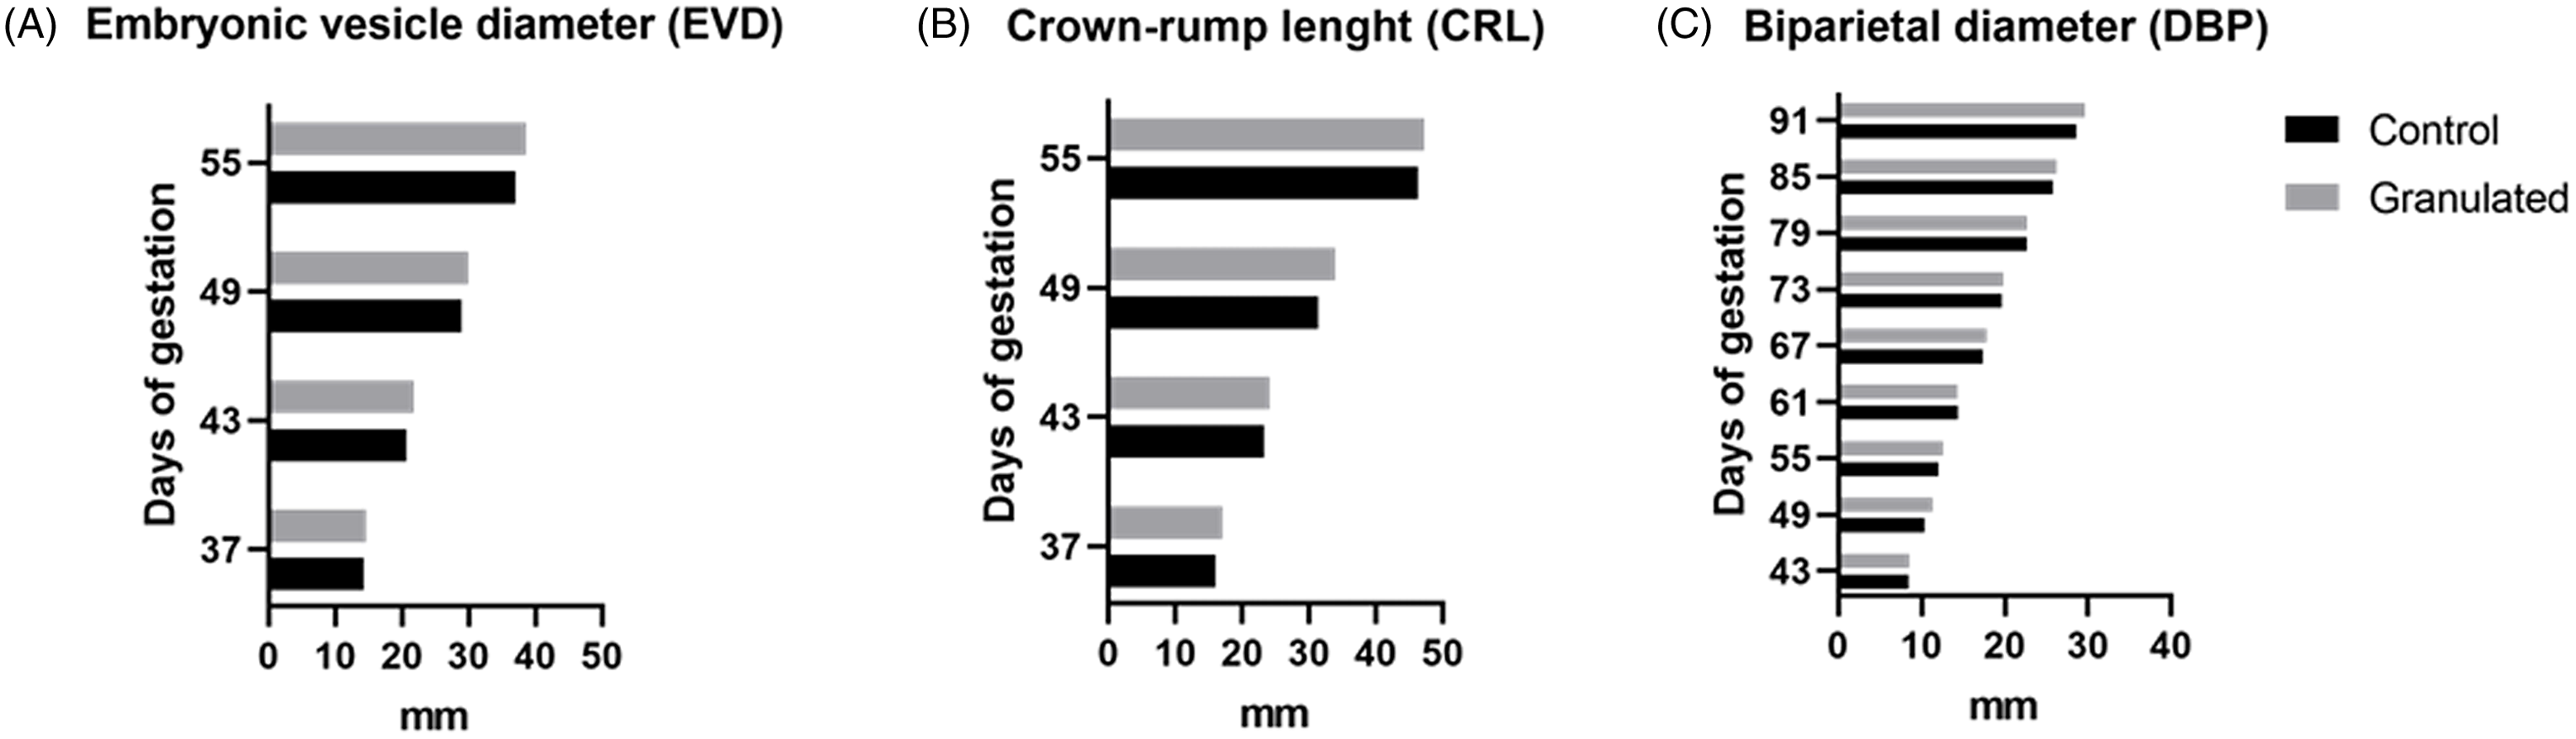
Embryos produced from CC and GC oocytes during Experiment 2 were transferred to recipients to assess the granular cytoplasm effects during late embryonic development (CC = 60 and GC = 30). A similar pregnancy rate (CC: 24.27 ± 9.70% vs GC: 26.31 ± 7.23%) was detected. Fetal growth was assessed in pregnancies from CC (n = 8) and GC (n = 5) groups every six days for EVD (Figure 7A), CRL (Figure 7B), and BPD (Figure 7C) parameters to determine whether post-implantation development remained unaltered between the groups. In these analyses, no differences were detected at evaluated time points. Finally, no detrimental effect was detected for cytoplasmic granules on calving rates (CC: 23.68% vs GC: 33.33%; P = 0.56). Our data suggests that post-implantation development is not affected by the presence of cytoplasmic granules in oocytes.
Effects of cytoplasmic profile on post-implantation development. Graphics show the fetal growth assessment during the days of gestation for the Embryonic vesicle diameter (EVD) (A), Crown-rump length (CRL) (B), and Biparietal diameter (DBP) (C) parameters. Bars indicate the mean values for the measurements performed.

Discussion
The main objective of our study was to investigate differences in functional and quality parameters between grade I oocytes and oocytes that had cumulus cell integrity but presented a heterogeneous granulated cytoplasm, usually considered unsuitable for IVF.
An annual internal report from our research group revealed that ∼30% of bovine oocytes recovered from ovum pick-UP (OPU) sessions presented cytoplasmic abnormalities and were rejected after morphological assessments (data not shown). Here we present results showing similar performance in blastocyst production between control oocytes and granulated oocytes. In bovine, oocytes with highly heterogeneous cytoplasm are, in general, classified as atretic and have less capacity for development (Blondin and Sirard, Reference Blondin and Sirard1995; De Wit et al., Reference De Wit, Wurth and Kruip2000). In several bovine studies, the oocyte quality analyses are performed by COC morphological characteristics that associate cytoplasm homogeneity and cumulus cell profile (Blondin and Sirard, Reference Blondin and Sirard1995; Boni et al., Reference Boni, Cuomo and Tosti2002; De Wit et al., Reference De Wit, Wurth and Kruip2000). In these approaches, oocytes that have the degree of granulation of GC groups are usually discarded. According to our results, such oocytes could produce embryos and calves at similar performance than homogeneous cytoplasm oocytes.
The COCs act as a single machine through bidirectional communication (Russell et al., Reference Russell, Gilchrist, Brown and Thompson2016). These cells exchange factors responsible for oocyte development and maturation (Biase and Kimble, Reference Biase and Kimble2018). However, it must be considered that to become competent, the oocyte, as a single cell, must pass through several stages of maturation throughout the life of a female (Sirard et al., Reference Sirard, Richard, Blondin and Robert2006). Cumulus cells, in turn, are a pool of cells that undergo differentiation and proliferation processes and also support oocyte maturation events (Fortune, Reference Fortune1994). Therefore, even if some cumulus cells do not survive, the oocyte will have many others to support oogenesis (Hussein et al., Reference Hussein, Froiland, Amato, Thompson and Gilchrist2005). Taken together, these facts support the hypothesis that, even if the oocytes have some degree of cytoplasmic granulation, the cumulus cells that have good viability can ensure development (De Bem et al., Reference De Bem, Adona, Bressan, Mesquita, Chiaratti, Meirelles and Leal2014).
Cytoplasmic granules can have different origins, such as refractory bodies, lipid droplets, and inclusion particles derived from smooth endoplasmic reticulum clusters (Rienzi et al., Reference Rienzi, Vajta and Ubaldi2011). Our data demonstrate that developmental kinetics were not affected by GC. In bovine and human models, this non-invasive technique is an interesting approach to analyze cleavage kinetics, as it offers an early and indirect estimation of the gamete’s ability to derive blastocysts (Milewski et al., Reference Milewski, Kuć, Kuczyńska, Stankiewicz, Łukaszuk and Kuczyński2015; Sugimura et al., Reference Sugimura, Akai and Imai2017). In human embryos, the mature oocyte’s cytoplasmic morphology has controversial effects on the cleavage pattern (Faramarzi et al., Reference Faramarzi, Khalili and Ashourzadeh2017; Rienzi et al., Reference Rienzi, Ubaldi, Iacobelli, Minasi, Romano, Ferrero, Sapienza, Baroni, Litwicka and Greco2008; Wilding et al., Reference Wilding, Di Matteo, D’Andretti, Montanaro, Capobianco and Dale2007; Yi et al., Reference Yi, Xi, Zhang and Yang2019; Yu et al., Reference Yu, Ji, Sha, Sun and Fan2015). In women, several studies have evaluated the COC separately, unlike in cattle, emphasizing the characteristics of oocytes and cumulus cells individually, such as cytoplasmic homogeneity. It is possible that a broader cytoplasmic dimorphism characterization in human oocytes might have influenced this discrepancy, or there might be differences between bovine cytoplasm granules and human cytoplasmic granules. In addition, in human IVF studies, oocytes are usually matured in vivo and evaluated at the metaphase II (MII) stage. Another theory would be that the human in vivo maturation protocol increases the deleterious effects of granules, such as high caspase levels, which affect embryonic development competence.
We detected that cytoplasmic granulations do not influence the performance of oocytes, as indicated by the similar cleavage, blastocyst and implantation rates, fetal development, and calving rate. In humans, MII oocytes with cytoplasmic granules present disappointing results regarding implantation potential (Serhal et al., Reference Serhal, Ranieri, Kinis, Marchant, Davies and Khadum1997; Tulay et al., Reference Tulay, Arslan, Buran and Koprulu2019). In women, oocyte immaturity (Kahraman et al., Reference Kahraman, Yakin, Dönmez, Samli, Bahçe, Cengiz, Sertyel, Samli and Imirzalioğlu2000) may be related to low implantation capacity despite similar fertilization potential (Braga et al., Reference Braga, Setti, Figueira, Machado, Iaconelli, Borges and Borges2013). In cattle, oocytes are conventionally matured in vitro, in contrast with the usual IVF procedure in humans. Therefore, in vitro maturation may be an alternative in cases of cows or women with high granular oocyte recovery records.
Despite the similar developmental potential, granulated oocytes present increased Ac3 levels. Apoptosis plays a pivotal role in the elimination of the majority of germ cells in all stages of oogenesis (Tiwari et al., Reference Tiwari, Prasad, Tripathi, Pandey, Ali, Singh, Shrivastav and Chaube2015) and may also prevent the detrimental effects caused by GC, such as low pregnancy rates caused by cytoplasmic granules of smooth endoplasmic reticulum (Otsuki et al., Reference Otsuki, Okada, Morimoto, Nagai and Kubo2004). It is possible that the caspase 3 pathway is activated by cytoplasmic aggregate degradation, but at insufficient levels to promote cell death as oocyte competence is not affected.
ZAR1 gene expression was downregulated in granular oocytes. ZAR1 and MATER are maternal effect genes (Tong et al., Reference Tong, Gold, Pfeifer, Dorward, Lee, Bondy, Dean and Nelson2000) associated with early embryonic development events, especially those related to embryonic genome activation (Pennetier et al., Reference Pennetier, Perreau, Uzbekova, Thélie, Delaleu, Mermillod and Dalbiès-Tran2006). As the low abundance of ZAR1 transcript in GC did not affect embryonic development, it is possible that specific changes to this transcript level are not sufficient to exert a functional effect in bovine. In this species, ZAR1 expression is not limited to oocytes, as in mice (Wu et al., Reference Wu, Viveiros, Eppig, Bai, Fitzpatrick and Matzuk2003), and ZAR1 expression levels increase at approximately the four-cell stage (Brevini et al., Reference Brevini, Cillo, Colleoni, Lazzari, Galli and Gandolfi2004). Therefore, it is possible that, in bovines, a compensatory mechanism of embryonic expression just before major embryonic genome activation is present for embryos derived from granulated oocytes.
In oocytes, no difference was detected in cytoplasmic granule effects on transcription levels related to various important processes, such as: (1) resumption of meiosis in oocytes (PPP2R1A) (Hu et al., Reference Hu, Wang, Jiang, Qi, Huang, Liang, Schatten and Sun2014; Yu et al., Reference Yu, Ji, Sha, Sun and Fan2015); and (2) regulation of transcription activation (ENY2) (Galán and Rodríguez-Navarro, Reference Galán and Rodríguez-Navarro2012). These results corroborate our developmental analysis, as no effect was detected for any of those processes in cleavage and embryo kinetics.
It is important to emphasize that no cumulus cell variables were included in our experimental design, as in both groups, only COCs displaying cumulus integrity were selected. As expected, the gene expression of cumulus cells remained unaltered. The same was found for the activity of cell–oocyte communication junctions (GAP junctions), which are critical for the transfer of cell cycle modulators (Thomas et al., Reference Thomas, Armstrong and Gilchrist2004), as was also the case between GC and control oocytes.
This result was expected as experimental oocytes were classified based on cytoplasm and similar cumulus were selected for both groups. Most studies involving the characterization of COCs associate the cytoplasmic profile with the number of layers and cumulus expansion (Patel et al., Reference Patel, Bettegowda, Ireland, Coussens, Lonergan and Smith2007; Souza-Cácares et al., Reference Souza-Cácares, Fialho, Silva, Cardoso, Pöhland, Martins and Melo-Sterza2019). Therefore, our results are focused on cytoplasmic effects commonly unexplored due to the usual morphological classification adopted for bovine COCs.
In conclusion, we demonstrated that bovine oocytes presenting cytoplasmic granules had altered ZAR1 expression and increased Ac3 enzyme levels, but these changes did not affect embryonic development. Our results suggest these oocytes are competent and can be used in IVF routine, and cytoplasmic granules should not be used as an eliminatory criterion for morphological classification of bovine COCs.
Acknowledgements
This research was supported by CNPq (Grant 408435/2016–0) and Coordenação de Aperfeiçoamento de Pessoal de Nível Superior, Brasil (CAPES), Finance Code 001. The authors would like to acknowledge Marta Martins for assistance in gene expression assays.
CRediT authorship contribution statement
PMS Rosa, CS Oliveira and JM Garcia conceived the study. PMS Rosa and CS Oliveira wrote the manuscript, designed the experiments, analyzed the data and interpreted the results. PMS Rosa, CS Oliveira and PHE Guedes performed the experiments. All authors read and approved the final version of the manuscript.
Competing interests
No conflict of interest exists in the submission of this manuscript. The manuscript is approved by all authors for publication. The manuscript is an original research that has not been published previously and is not under consideration for publication elsewhere.