Introduction
Endophytic bacteria are bacteria that can be isolated from surface-disinfected plant tissues or extracted from within the plants and that are not observed to harm the host. These bacteria, which generally colonize the intercellular spaces, have been isolated from all plant tissues and from many plant species (Rosenblueth & Martínez-Romero Reference Rosenblueth and Martínez-Romero2006). The beneficial effects of bacterial endophytes on their host appear to occur directly through mechanisms described as plant growth-promoting rhizobacteria (PGPR) (Höflich et al. Reference Höflich, Wiehe and Kühn1994), or indirectly by antagonistic activity against one or more phytopathogenic organisms (Reiter et al. Reference Reiter, Pfeifer, Schwab and Sessitsch2002). However, the ecophysiological significance of endophytes in plant communities remains unclear.
In Antarctica the moss flora comprises relatively few species of wide ecological amplitude, widespread around the continent. Antarctic moss research has been carried out on the taxonomy and the biogeography (Ochyra et al. Reference Ochyra, Lewis-Smith and Bednarek-Ochyra2008), the high UV tolerance (Clarke & Robinson Reference Clarke and Robinson2008), and the impact of climatic warming on the carbon balance (Nakatsubo Reference Nakatsubo2002). However, to our knowledge there is no report on identifying the endophytic bacterial community of an Antarctic moss species.
In this study, we have chosen Sanionia uncinata (Hedw.) Loeske as a representative Antarctic moss species, as it is a dominant moss species distributed widely over Antarctica and has a global geographic distribution (Hedenäs Reference Hedenäs2012). To compare the patterns of endophytic bacteria between the phyllosphere and the rhizosphere, we have divided the moss gametophore into the upper green (UG) part and the lower brown (LB) part.
Materials & methods
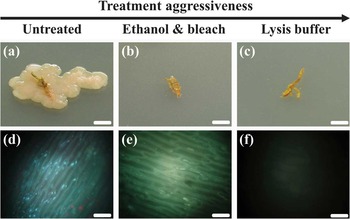
Samples of S. uncinata were collected from a wet moss area in December 2010 on King George Island, South Shetland Islands (62°13.566′S, 58°47.29′W). After dividing into the UG and the LB parts, gametophytes were washed with tap water to remove attached soil and sterilized using ethanol bleach and alkaline lysis buffer (Hollants et al. Reference Hollants, Leliaert, De Clerck and Willems2010). Samples were soaked in 70% ethanol for 3 min, washed with fresh sodium hypochlorite solution (2.5% available Cl- for 5 min, rinsed with 70% ethanol for 30 sec, and finally washed five times with sterile distilled water (ethanol bleach, parts b and e in Fig. 1), or heated with 240 ml sterile distilled water and 60 ml alkaline lysis buffer (1 M NaOH and 10% sodium dodecyl sulfate) for 15 min at 95°C (lysis treatment, parts c and f in Fig. 1). In order to evaluate various methods of surface decontamination, we tested their effectiveness by incubating moss on tryptic soy agar medium plates at 30°C for three days, followed by DAPI (4′,6-diamidino-2-phenylindole) staining under a fluorescence microscope. As lysis buffer showed the most effective elimination of epiphytic organisms and only a trace of DAPI fluorescence by genomic DNA remnant, we applied this method.
Incubation of a. untreated, b. ethanol bleach, and c. lysis treatment of S. uncinata on tryptic soy agar plates. Fluorescence microscopy images of d. untreated, e. ethanol bleach, and f. lysis treatment stained with DAPI. Scale bars: 0.5 cm (a, b, c), 20 μm (d, e, f).

Total DNA extraction from moss gametophore UG and LB parts was performed using DNeasy Plant Mini kit (Qiagen, CA, USA), followed by PCR amplification and pyrosequencing (Na et al. Reference Na, Kim, Yoon, Kim and Chun2011). Each operational taxonomic unit (OTU) was taxonomically assigned using the EzTaxon-e database (http://eztaxon-e.ezbiocloud.net, accessed November 2011) (Kim et al. Reference Kim, Cho, Lee, Yoon, Kim, Na, Park, Jeon, Lee, Yi, Won and Chun2012) after applying TBC (taxonomic based clustering) program (Lee et al. Reference Lee, Yi, Jeon and Chun2012).
Results
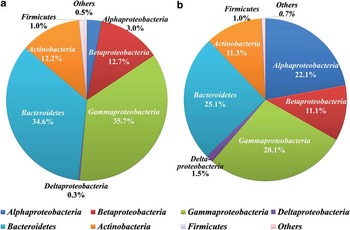
A total of 3957 bacterial reads, 1684 and 2273 reads from UG and LB parts, respectively, were recovered with high quality. Thses phylotypes represented a number of phyla with Proteobacteria, mainly classes of Alpha-, Beta- and Gammaproteobacteria, accounting for the vast majority of reads with 65.6% of the total (Fig. 2), which was consistent with other studies from plants (Idris et al. Reference Idris, Trifonova, Puschenreiter, Wenzel and Sessitsch2004). Bacteroidetes and Actinobacteria were strongly represented at 29.1% and 11.7%, respectively. Interestingly, the distribution of the division of Alphaproteobacteria between the UG part (3%) and the LB part (22.15%) was remarkably different (Fig. 2), suggesting that this division in the LB part might be a significant constituent of the bacterial community in this ecosystem. It is still unclear if this is caused by the specificity of endophytes only in moss in general or in S. uncinata specifically, or by the extreme conditions for moss in Antarctica. In order to clarify this, additional studies across a number of Antarctic moss species need to be carried out.
The relative abundances of various bacterial lineages in phylum level recovered from a. the upper green part, and b. the lower brown part of Sanionia uncinata.

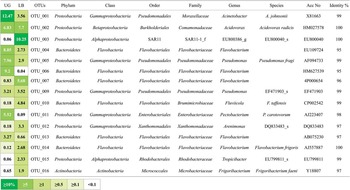
Proceeding to a higher resolution of species levels with the heat plot in Fig. 3, the proportion of each OTU in UG and LB parts was slightly different. Dominant and diverse OTUs in this study were closely related with sequences characterized only by uncultured or environmental clones.
Heat plot showing the 15 most dominant operational taxonomic units (OTUs) in the upper green (UG) part and the lower brown (LB) part with their relative abundances of each OTU. The colour code paling from green to white indicates the highest to lowest relative abundance values.

Discussion
Antarctic moss provides a novel resource to help clarify the role of endophytes and their interaction in each part of their host. Furthermore, the SAR11 clade, well known from its dominance in seawater (Morris et al. Reference Morris, Rappe, Connon, Vergin, Siebold, Carlson and Giovannoni2002), were detected at 10.5% in the LB part (but only 0.06% in the UG part), which might be concerned as one of the dominant microorganisms in the UG part of Antarctic moss. In general, Alphaproteobacteria were dominant in the studies of endophytic bacteria in lichens (Cardinale et al. Reference Cardinale, De Castro, Müller, Berg and Grube2008) and plants (Ikeda et al. Reference Ikeda, Okubo, Anda, Nakashita, Yasuda, Sato, Kaneko, Tabata, Eda, Momiyama, Terasawa, Mitsui and Minamisawa2010) so Antarctic mosses follow that pattern.
Overall, endophytic bacteria in the Antarctic moss were more diverse than we had expected, and it seemed possible that there are specific relationships between endophytes and the region they inhabit in the host moss species.
Acknowledgements
This research was supported by the Korea Polar Research Institute (Grant PE11060 and PE11030). The technical help of Ahnna Cho is gratefully acknowledged. The constructive comments of the reviewer are also gratefully acknowledged.